
Preparation of Catechin Nanoemulsion from Oolong Tea Leaf Waste and Its Inhibition of Prostate Cancer Cells DU-145 and Tumors in Mice


Abstract
1. Introduction
2. Results and Discussion
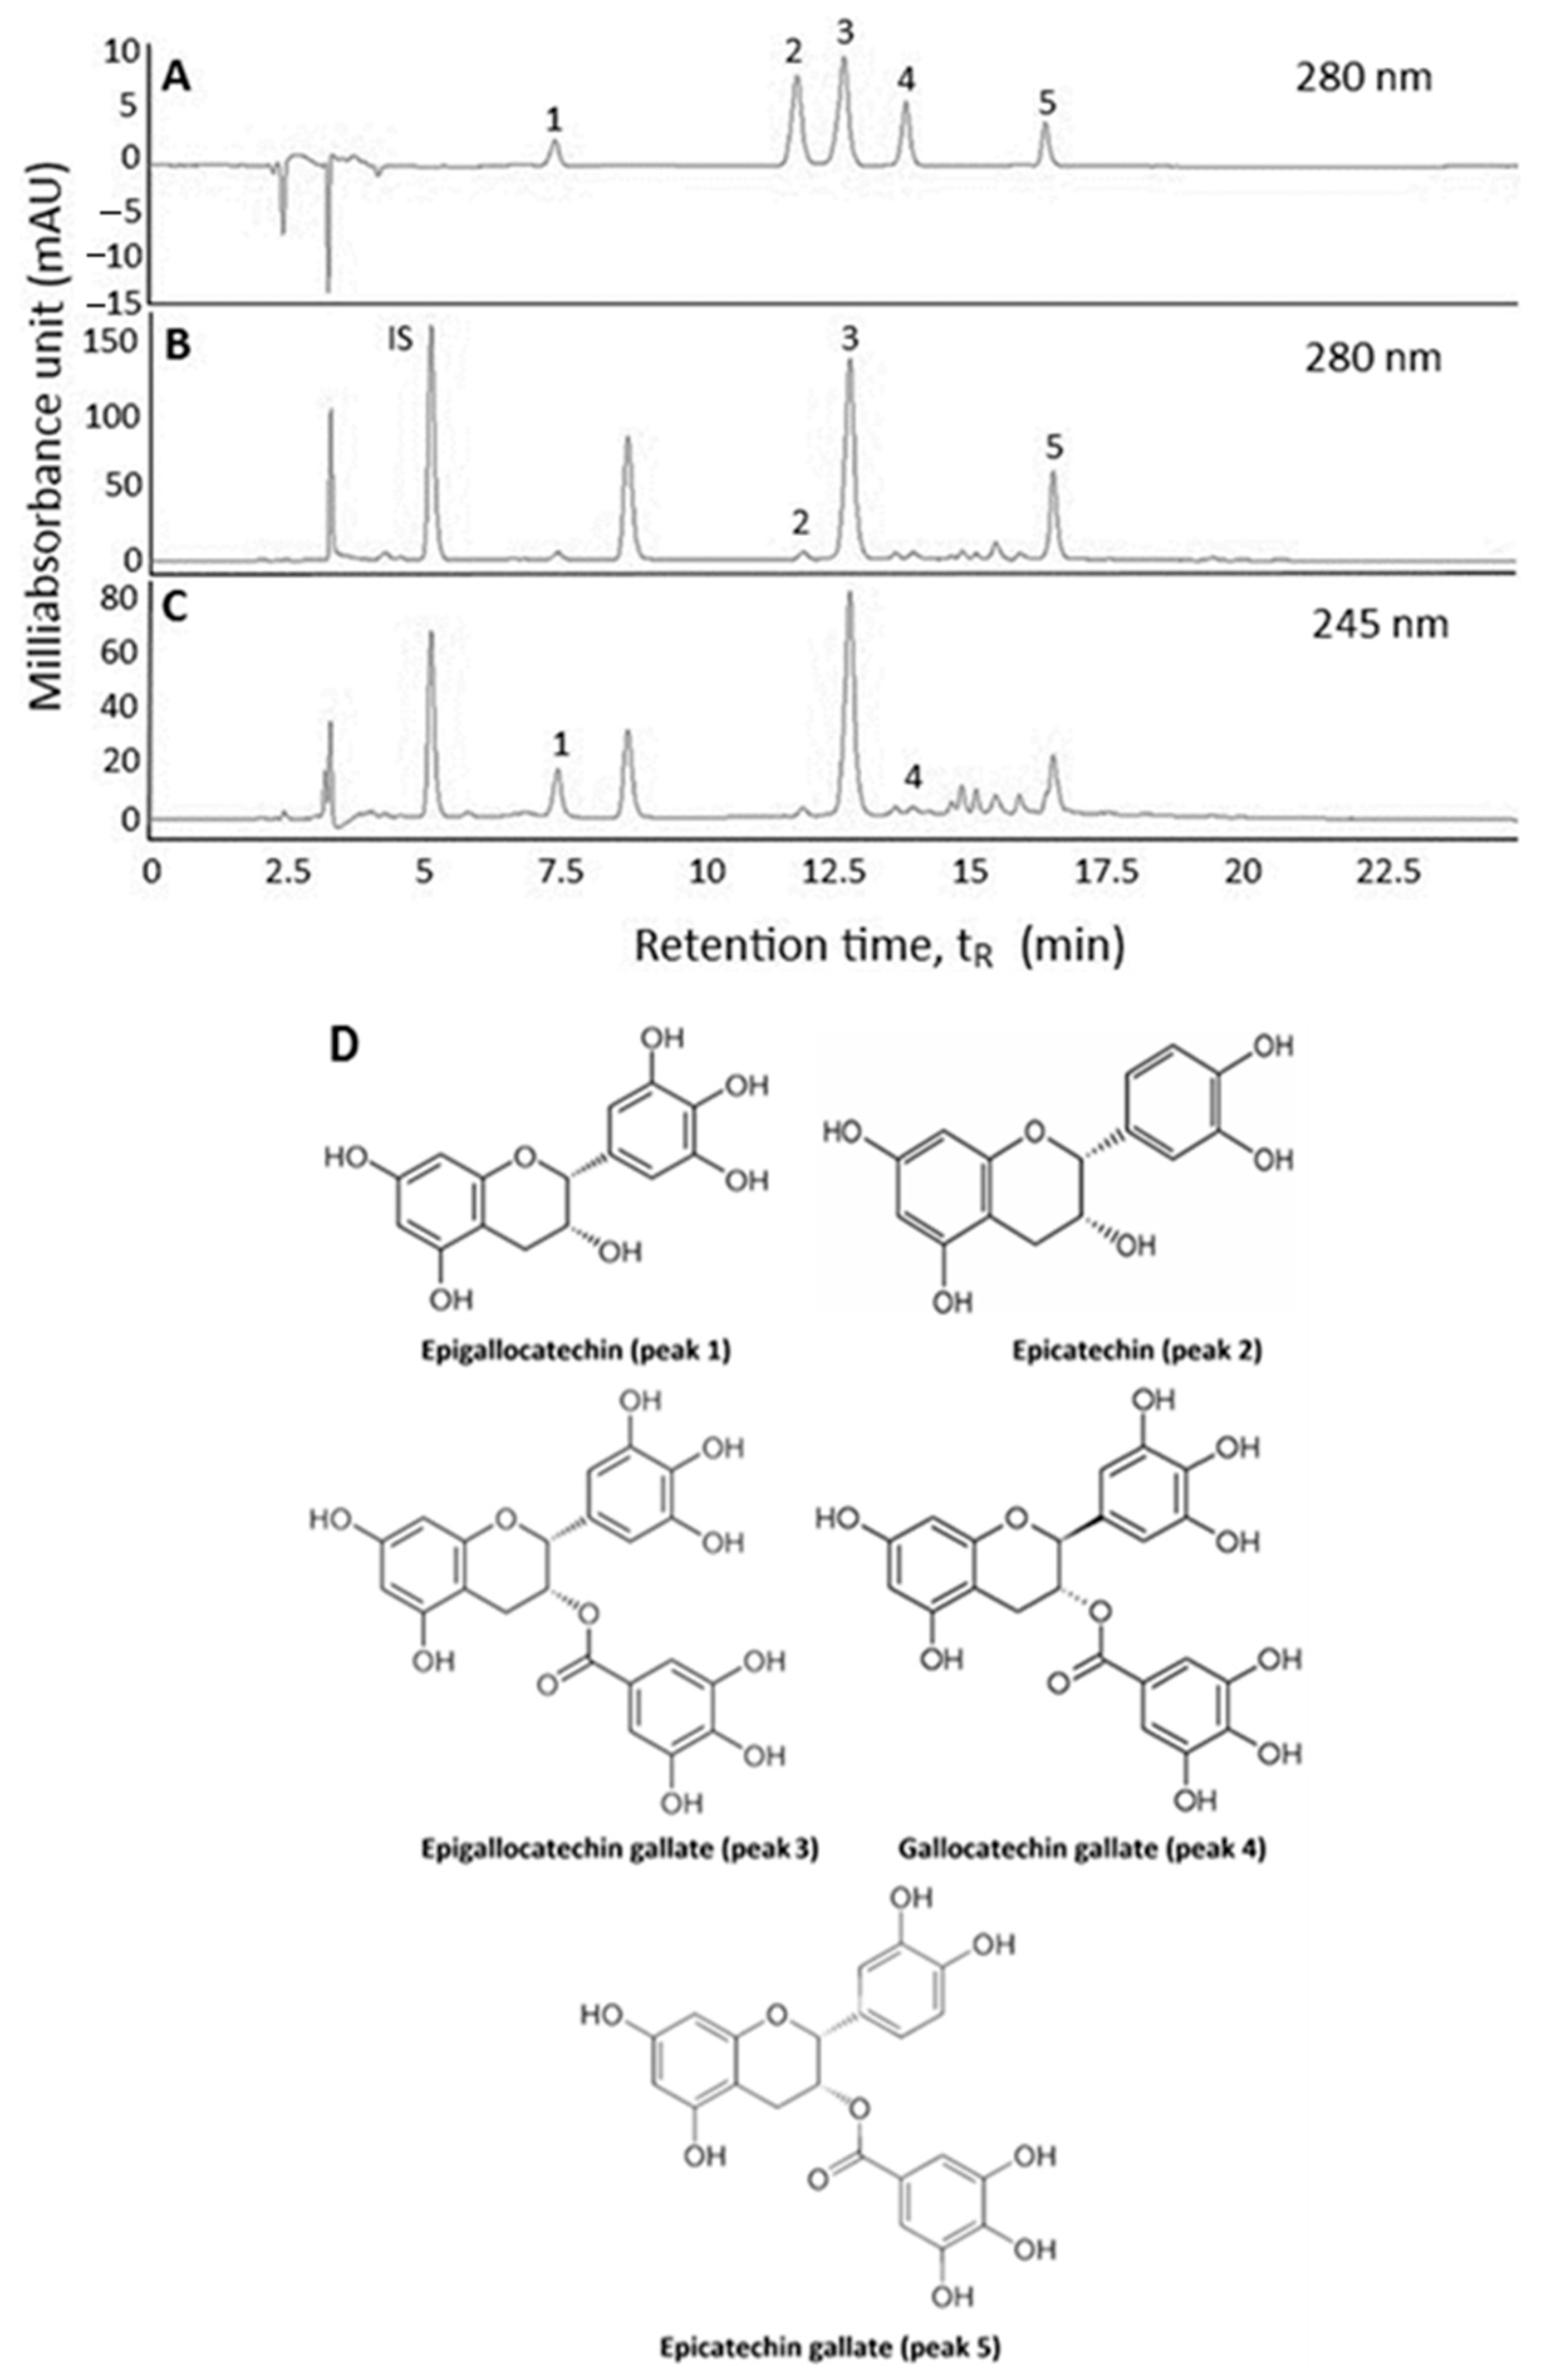
2.1. Extraction and HPLC Analysis of Catechins in Oolong Tea Leaf Waste
2.2. Method Validation
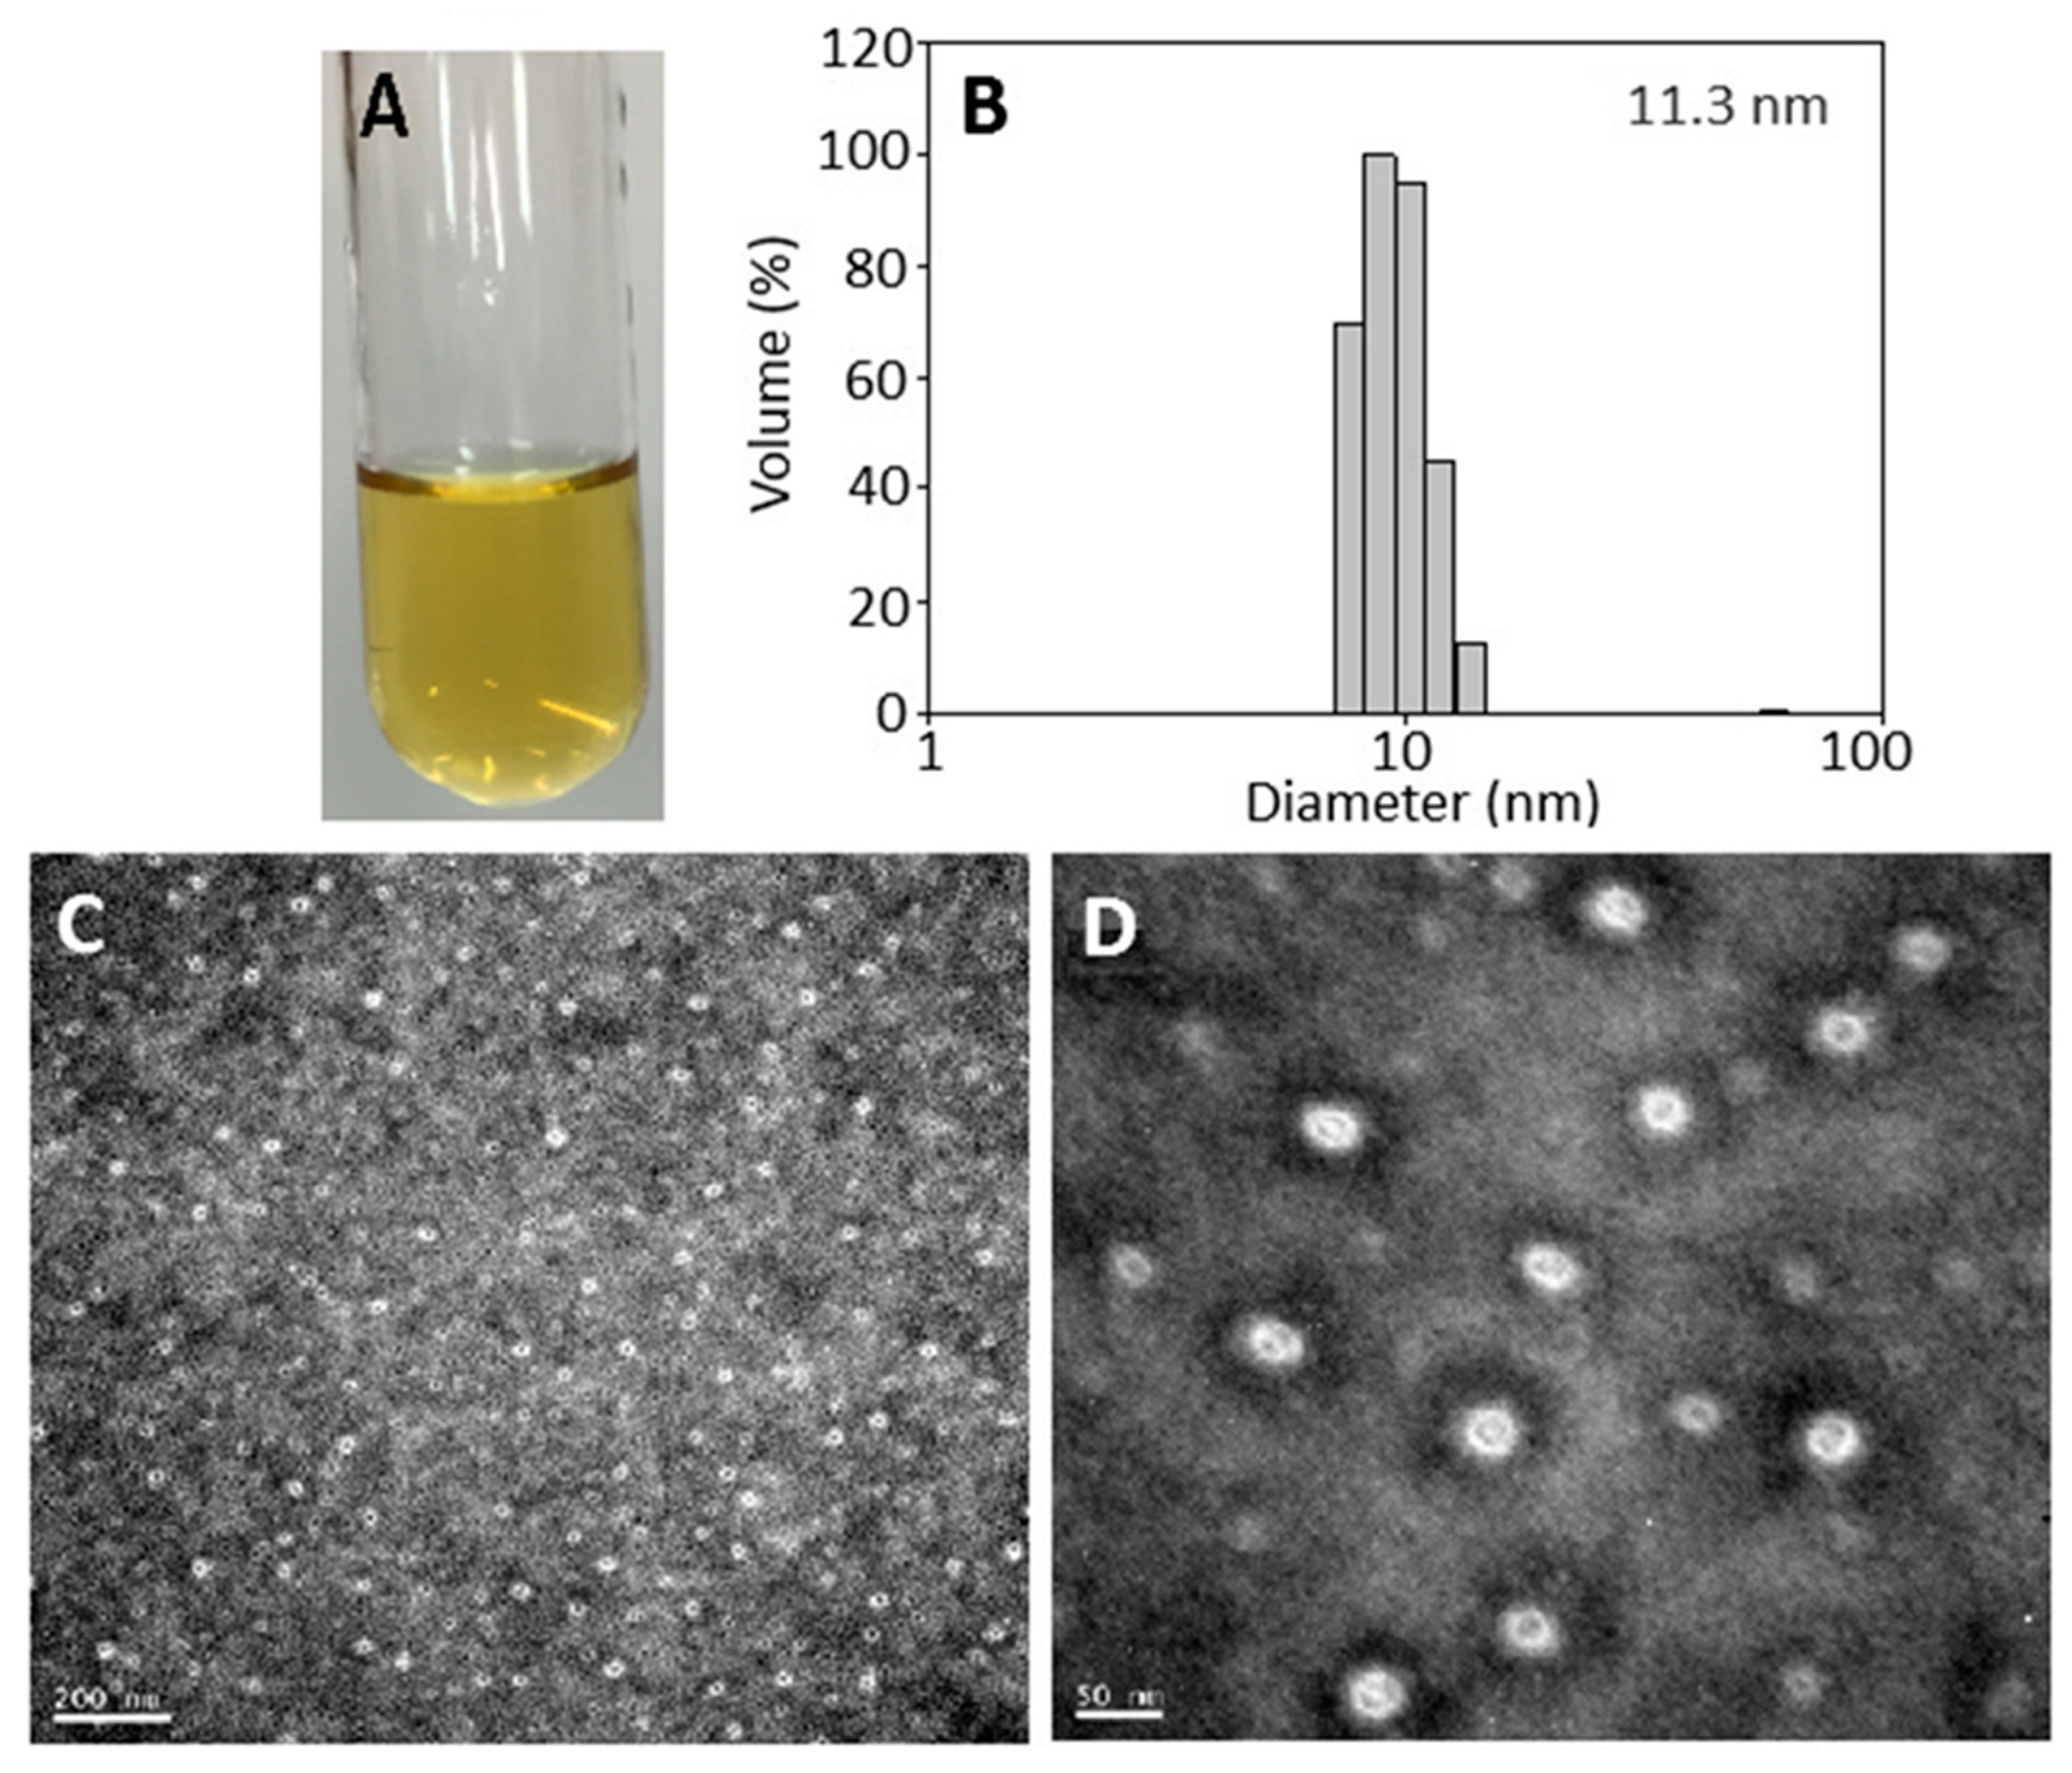
2.3. Nanoemulsion Characteristics
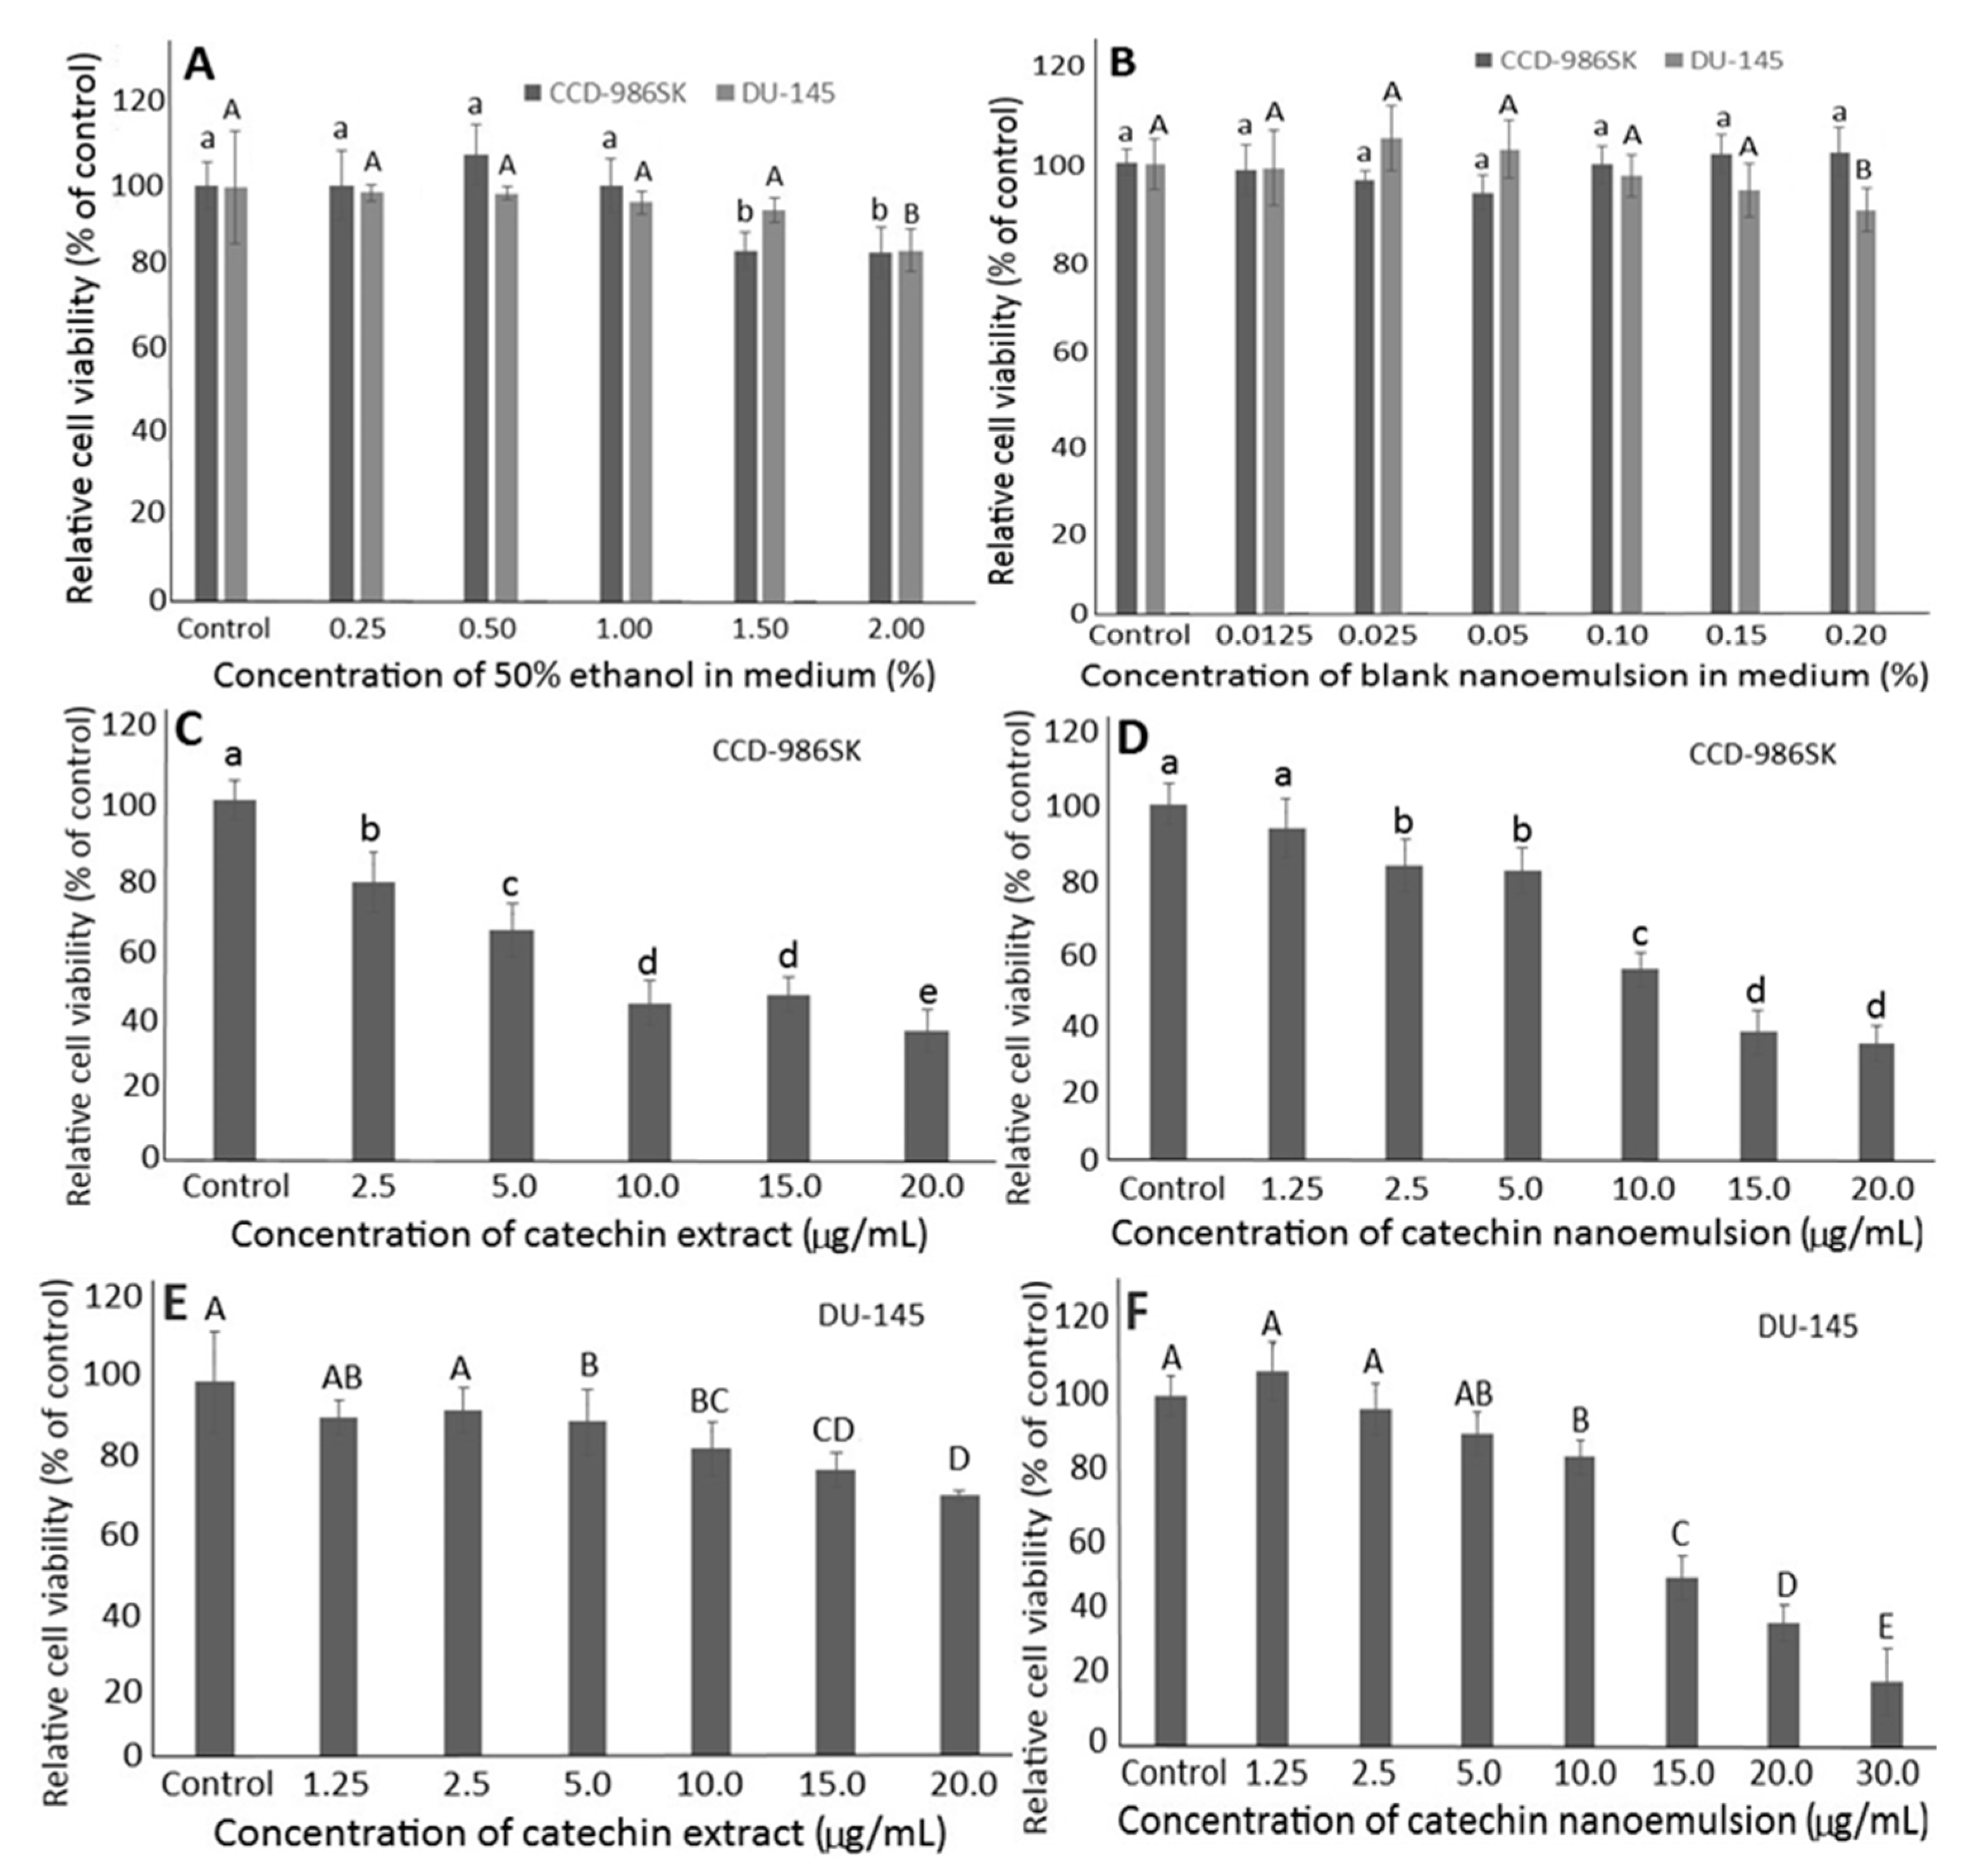
2.4. Effects of Solvent and Blank Nanoemulsion on DU-145 and CCD-986SK Cells
2.5. Effects of Catechin Extract and Nanoemulsion on DU-145 and CCD-986SK Cells
2.6. Cell Cycle Analysis
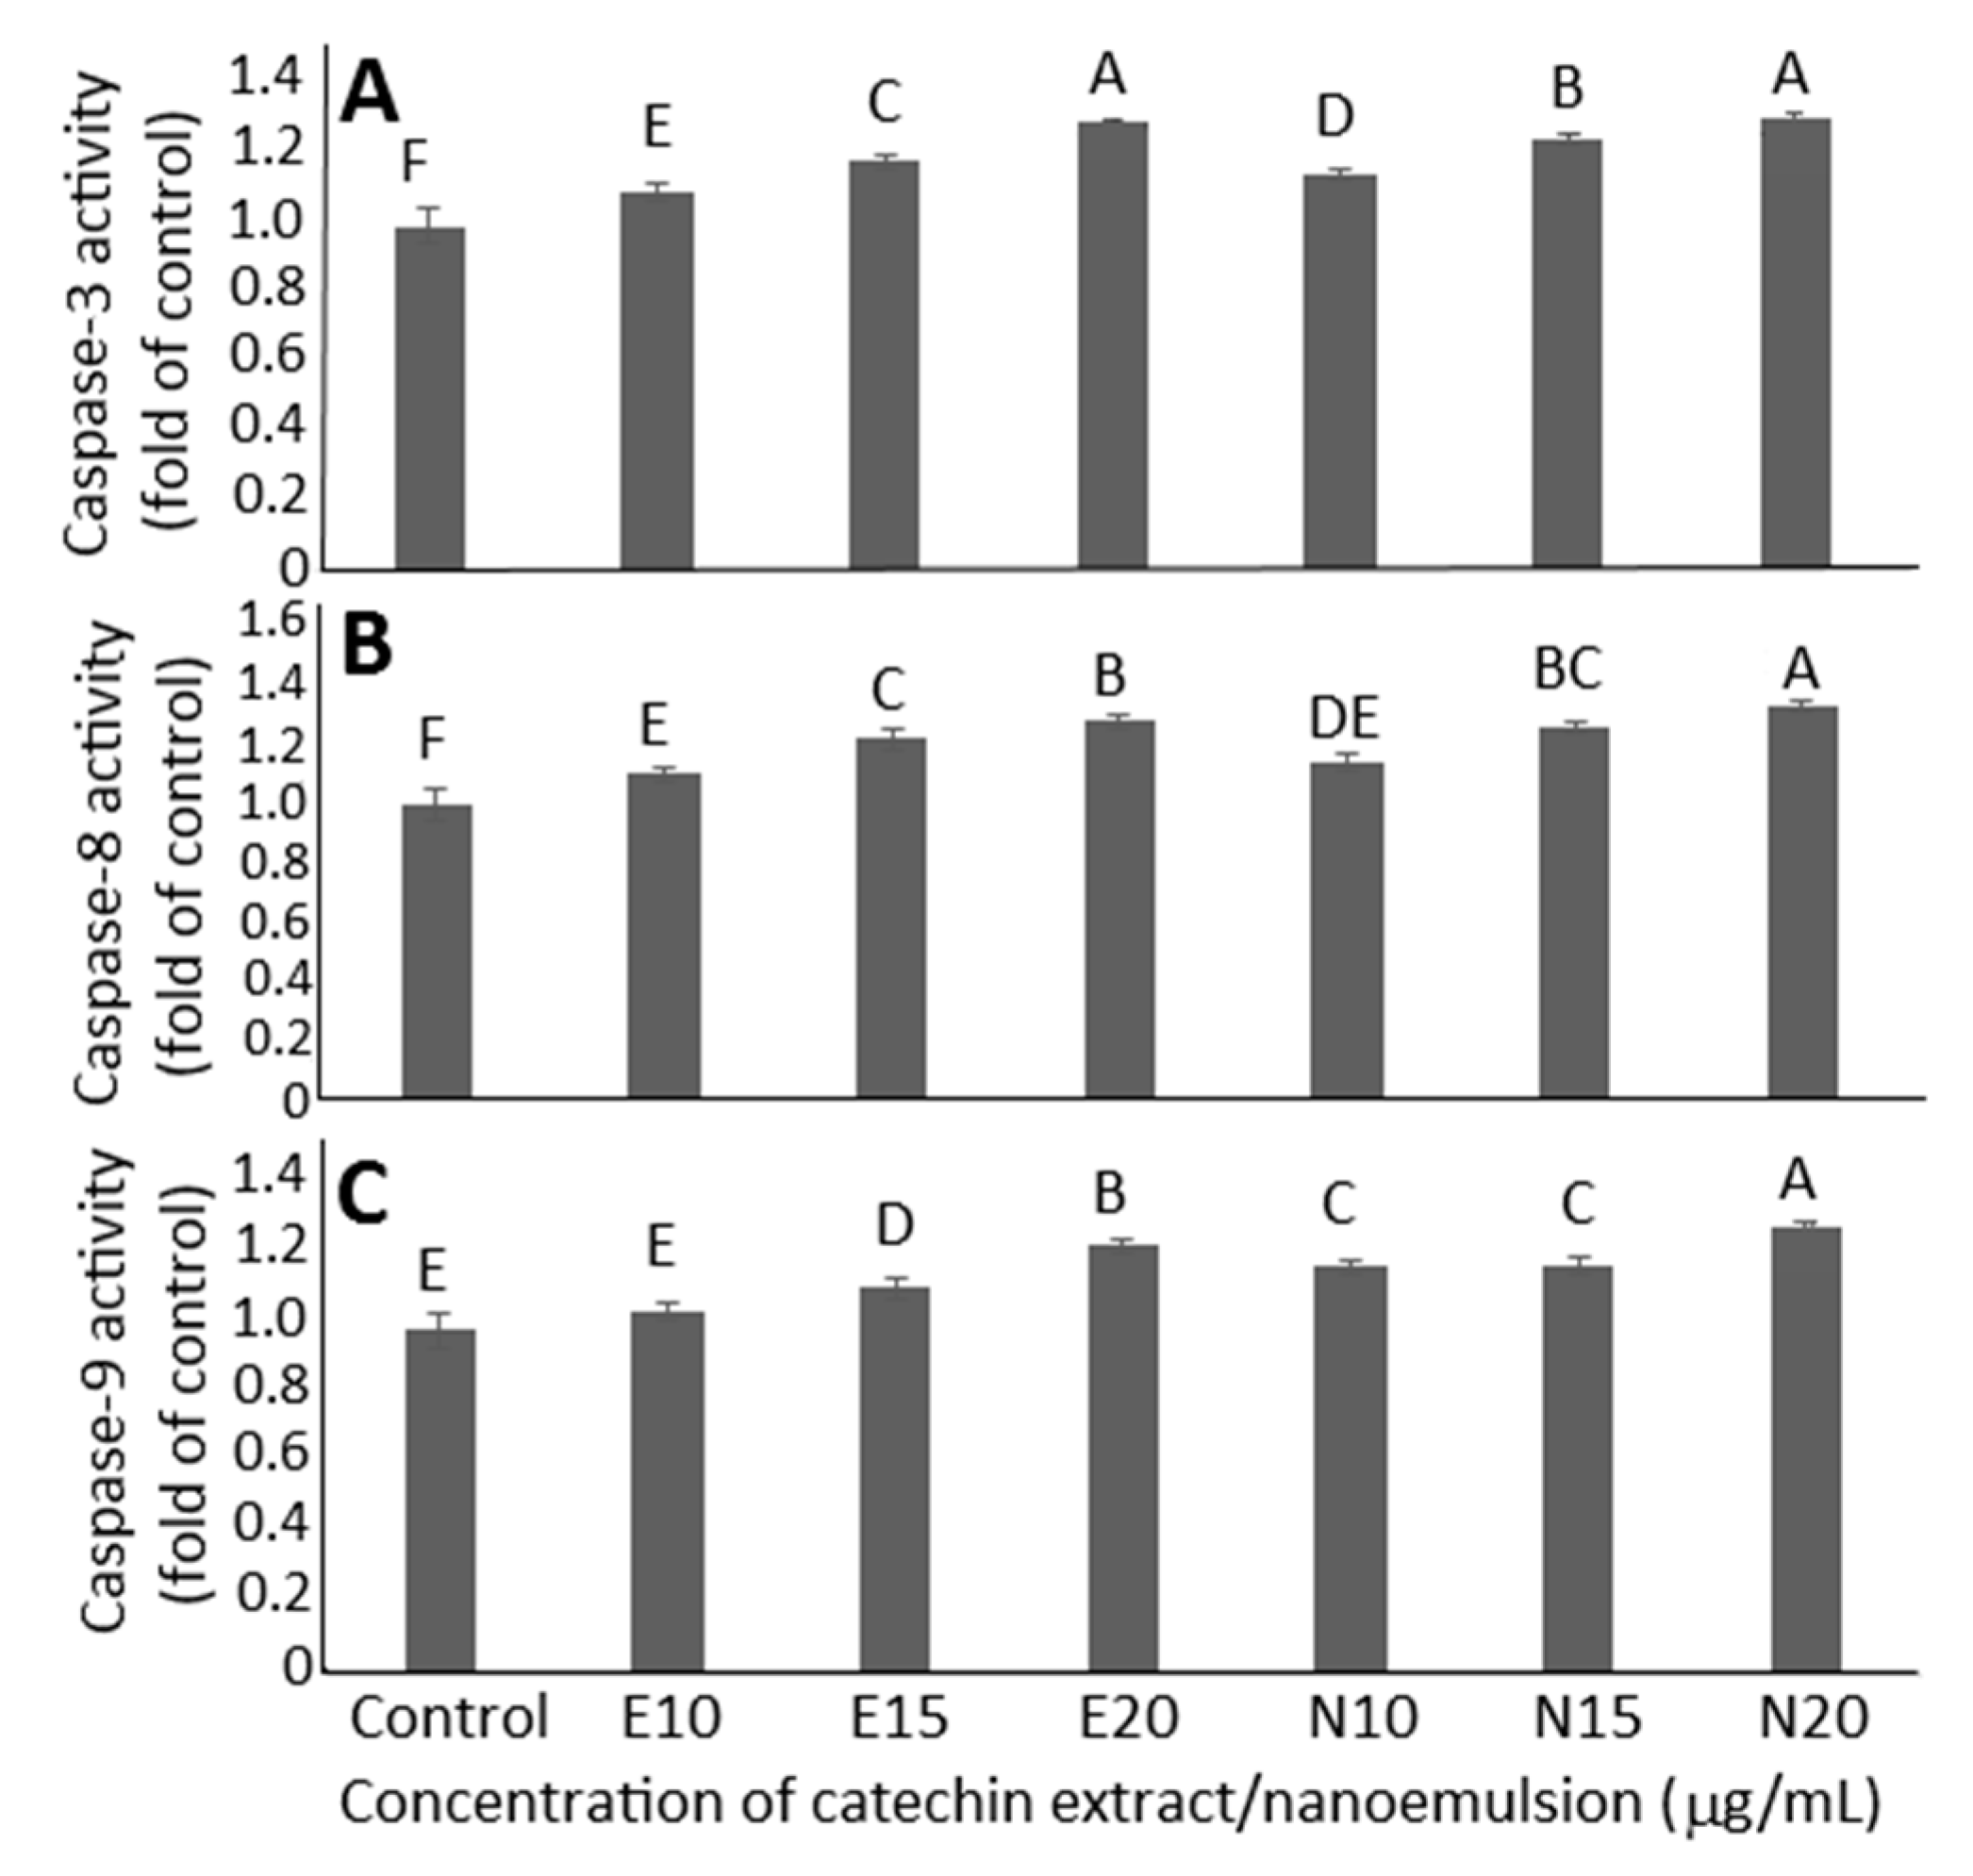
2.7. Cell Apoptosis Analysis
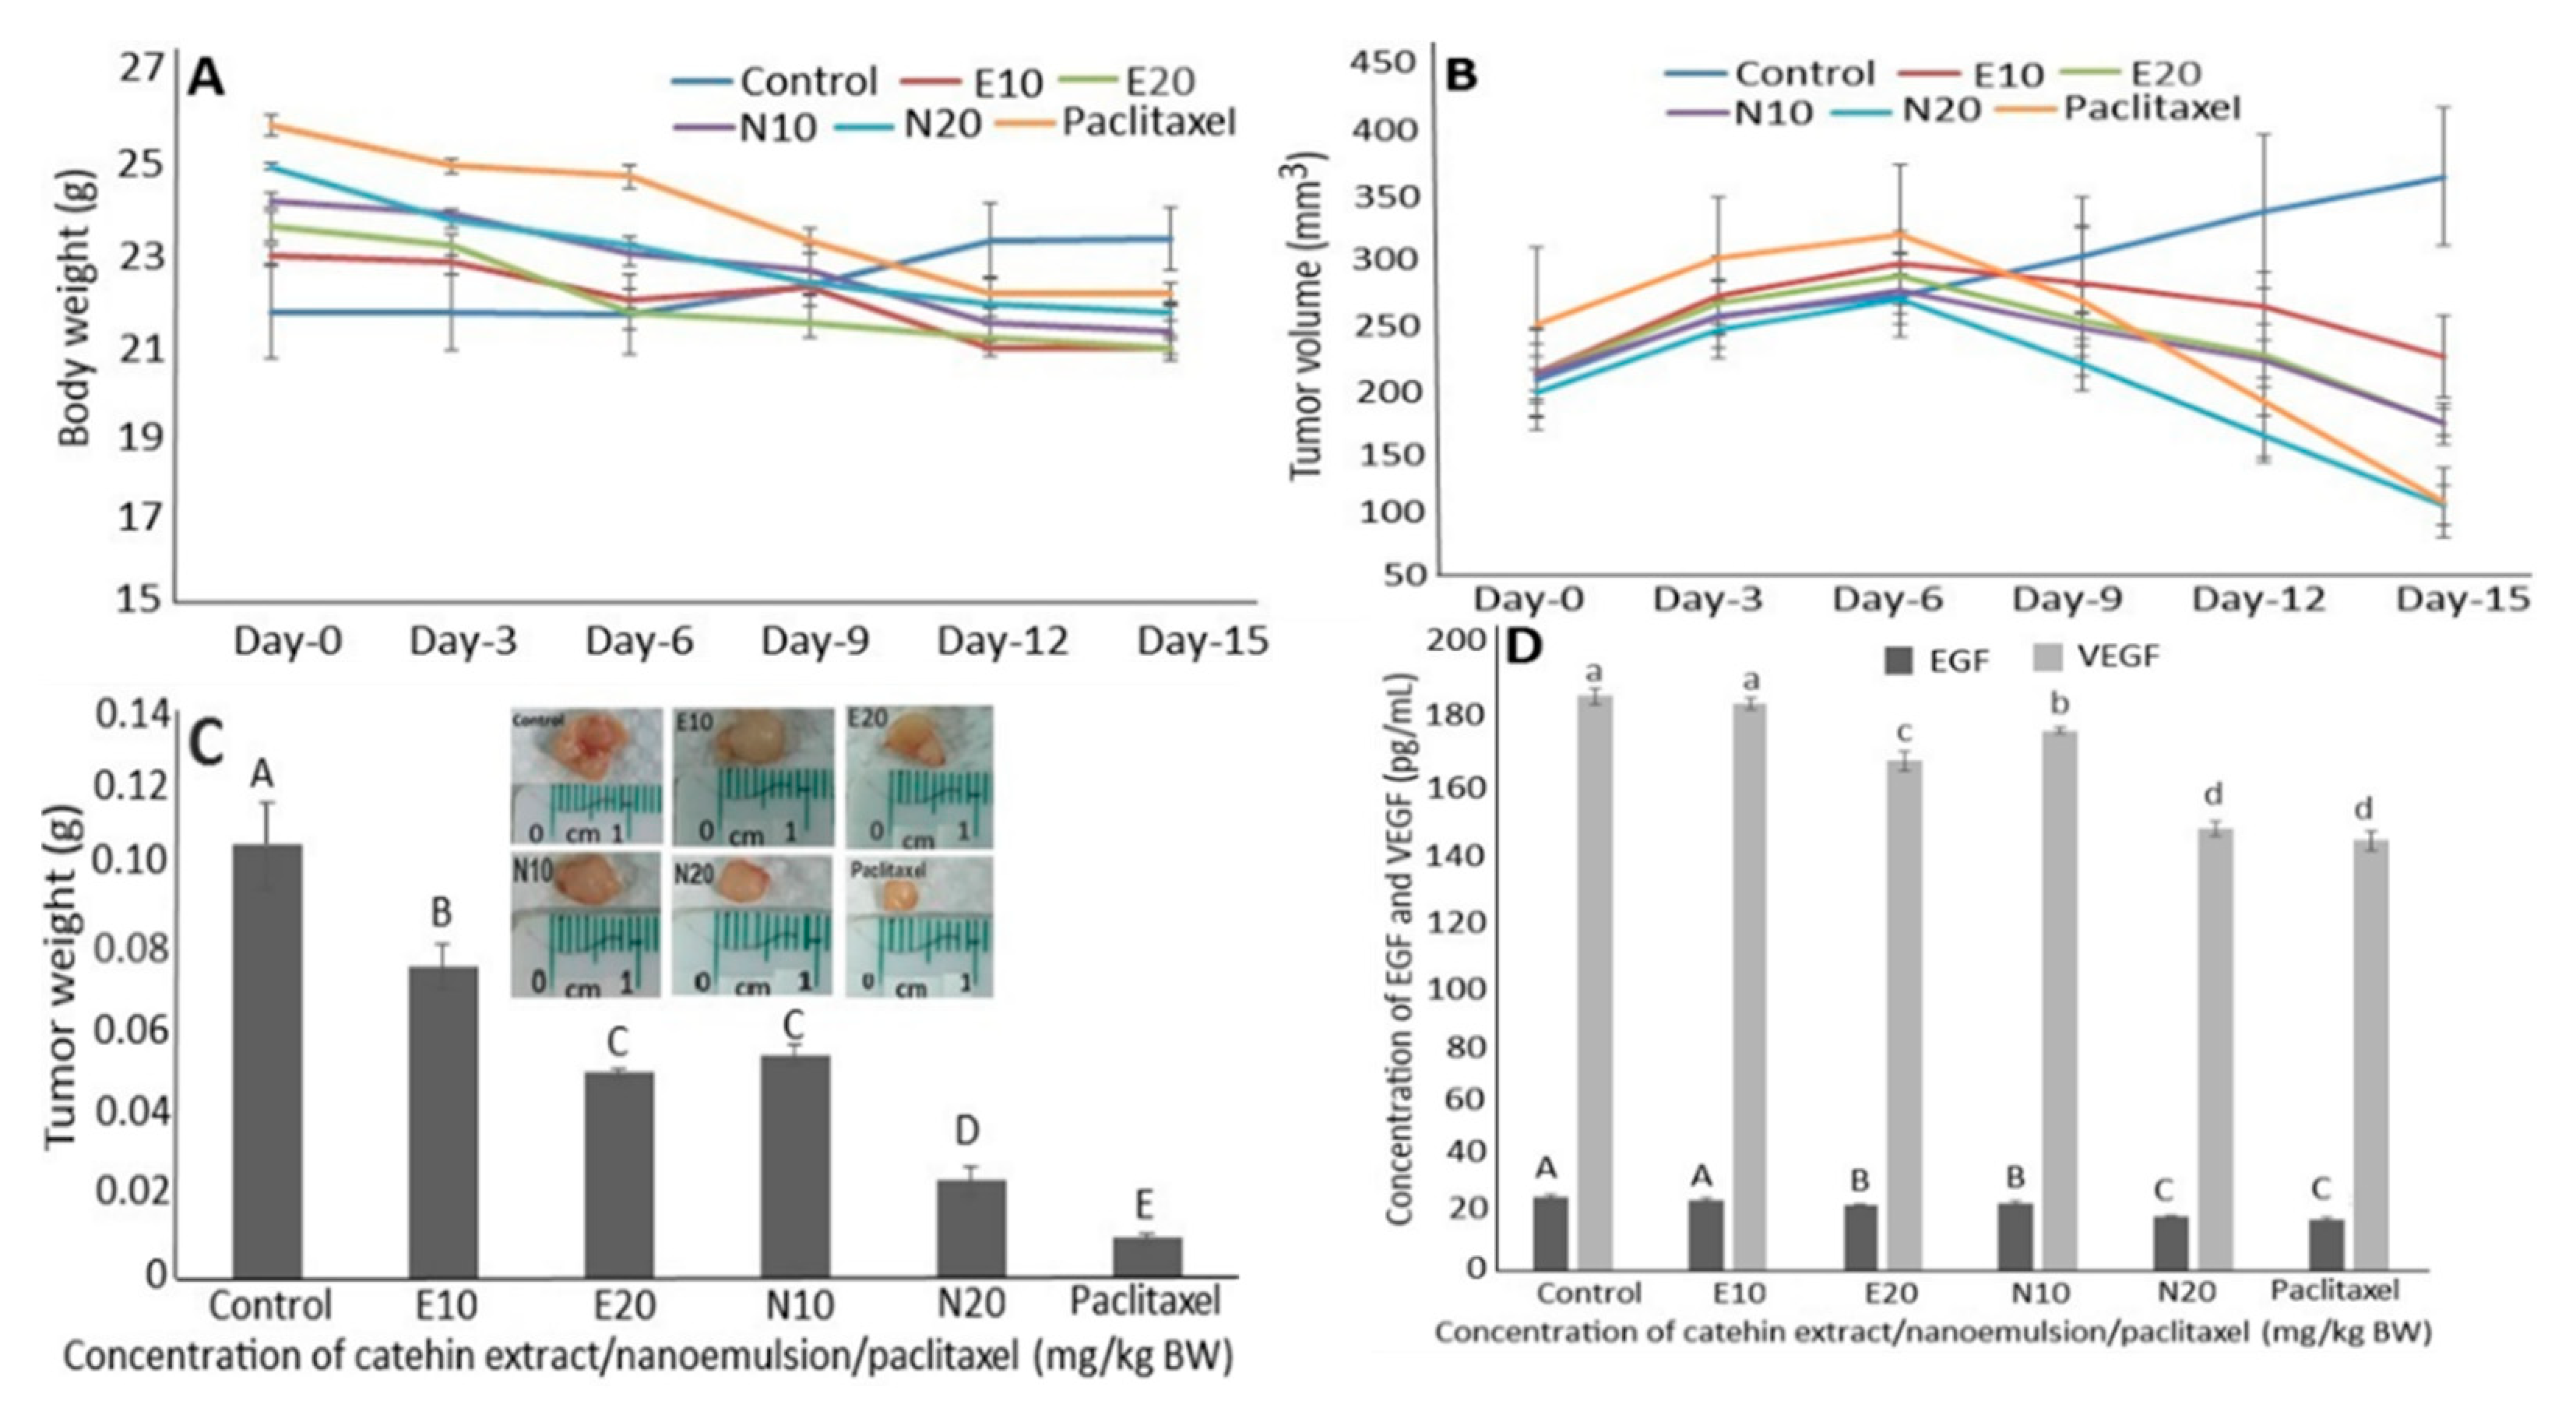
2.8. Anti-Tumor Study of Catechin Extract, Catechin Nanoemulsion and Paclitaxel on DU-145 Induced Tumor in Mice
2.9. Regulation of EGF and VEGF Levels in Serum
3. Materials and Methods
3.1. Materials
3.2. Extraction of Catechins from Oolong Tea Leaf Waste
3.3. HPLC Separation of Catechins
3.4. Identification of Catechins
3.5. Validation of Quality Control Parameters
3.6. Quantitation of Catechins
3.7. Preparation of Catechin Nanoemulsion
3.8. Characterization of Catechin Nanoemulsion
3.9. Cell Culture for Prostate Cancer Cells DU-145
3.10. MTT Assay for DU-145 and CCD-986SK Cells
3.11. Cell Cycle Analysis for DU-145 Cells
3.12. Annexin V/propidium Iodide Staining Assay for DU-145 Cells
3.13. Activities of Caspase-3, Caspase-8 and Caspase-9
3.14. Animal Study Approval and Handling for Evaluating Anti-Tumor Efficiency in Mice
3.15. Animal Experiments
3.16. Determination of Growth Factors in Serum
3.17. Statistical Analysis
4. Conclusions
Author Contributions
Funding
Institutional Review Board Statement
Informed Consent Statement
Data Availability Statement
Acknowledgments
Conflicts of Interest
References
- Lin, J.-K.; Lin, C.-L.; Liang, Y.-C.; Lin-Shiau, S.-Y.; Juan, I.-M. Survey of Catechins, Gallic Acid, and Methylxanthines in Green, Oolong, Pu-erh, and Black Teas. J. Agric. Food Chem. 1998, 46, 3635–3642. [Google Scholar] [CrossRef]
- Wang, Y.; Li, Q.; Wang, Q.; Li, Y.; Ling, J.; Liu, L.; Chen, X.; Bi, K. Simultaneous Determination of Seven Bioactive Components in Oolong Tea Camellia sinensis: Quality Control by Chemical Composition and HPLC Fingerprints. J. Agric. Food Chem. 2011, 60, 256–260. [Google Scholar] [CrossRef]
- Connors, S.K.; Chornokur, G.; Kumar, N.B. New Insights Into the Mechanisms of Green Tea Catechins in the Chemoprevention of Prostate Cancer. Nutr. Cancer 2012, 64, 4–22. [Google Scholar] [CrossRef]
- Yeh, D.B. Comparison of Antioxidant and Anti-Bacteria Activity of Tea Leave Wastes by Different Extraction Method. Master’s Thesis, Chia-Nan Pharmcology and Science University, Tainan City, Taiwan, 2004. [Google Scholar]
- Dube, A.; Nicolazzo, J.A.; Larson, I. Chitosan nanoparticles enhance the intestinal absorption of the green tea catechins (+)-catechin and (−)-epigallocatechin gallate. Eur. J. Pharm. Sci. 2010, 41, 219–225. [Google Scholar] [CrossRef] [PubMed]
- Chen, B.-H.; Tsai, Y. Preparation of catechin extracts and nanoemulsions from green tea leaf waste and their inhibition effect on prostate cancer cell PC-3. Int. J. Nanomed. 2016, 11, 1907–1926. [Google Scholar] [CrossRef]
- McClements, D.J.; Xiao, H. Potential biological fate of ingested nanoemulsions: Influence of particle characteristics. Food Funct. 2011, 3, 202–220. [Google Scholar] [CrossRef] [PubMed]
- Huang, R.-F.S.; Wei, Y.-J.; Inbaraj, B.S.; Chen, B.-H. Inhibition of colon cancer cell growth by nanoemulsion carrying gold nanoparticles and lycopene. Int. J. Nanomed. 2015, 10, 2823–2846. [Google Scholar] [CrossRef]
- Carvalho, M.; Jerónimo, C.; Valentão, P.; Andrade, P.B.; Silva, B.M. Green tea: A promising anticancer agent for renal cell carcinoma. Food Chem. 2010, 122, 49–54. [Google Scholar] [CrossRef]
- Singh, M.; Bhui, K.; Singh, R.; Shukla, Y. Tea polyphenols enhance cisplatin chemosensitivity in cervical cancer cells via induction of apoptosis. Life Sci. 2013, 93, 7–16. [Google Scholar] [CrossRef] [PubMed]
- Wu, C.; Xu, H.; Héritier, J.; Andlauer, W. Determination of catechins and flavonol glycosides in Chinese tea varieties. Food Chem. 2012, 132, 144–149. [Google Scholar] [CrossRef] [PubMed]
- Del Rio, D.; Stewart, A.J.; Mullen, W.; Burns, J.; Lean, M.E.J.; Brighenti, F.; Crozier, A. HPLC-MSn analysis of phenolic compounds and purine alkaloids in green and black tea. J. Agric. Food Chem. 2004, 52, 2807–2815. [Google Scholar] [CrossRef]
- Bastos, D.H.M.; Saldanha, L.A.; Catharino, R.R.; Sawaya, A.C.H.F.; Cunha, I.B.S.; de Carvalho, P.; Eberlin, M.N. Phenolic Antioxidants Identified by ESI-MS from Yerba Maté (Ilex paraguariensis) and Green Tea (Camelia sinensis) Extracts. Molecules 2007, 12, 423–432. [Google Scholar] [CrossRef]
- TFDA. Taiwan Food and Drug Administration, Method Validation of Food Analysis (In Chinese). 2017. Available online: http://www.fda.gov.tw/tc/includes/GetFile.ashx?mID=133&id=18202 (accessed on 22 January 2021).
- Lakshmi, P.; Kumar, G.A. Nanosuspension technology: A review. Int. J. Pharm. Pharm. Sci. 2010, 2, 35–40. [Google Scholar]
- Silva, H.D.; Cerqueira, M.Â.; Vicente, A.A. Nanoemulsions for Food Applications: Development and Characterization. Food Bioprocess Technol. 2012, 5, 854–867. [Google Scholar] [CrossRef]
- Kim, Y.J.; Houng, S.-J.; Kim, J.H.; Kim, Y.-R.; Ji, H.G.; Lee, S.-J. Nanoemulsified green tea extract shows improved hypocholesterolemic effects in C57BL/6 mice. J. Nutr. Biochem. 2012, 23, 186–191. [Google Scholar] [CrossRef]
- Ravindranath, M.H.; Saravanan, T.S.; Monteclaro, C.C.; Presser, N.; Ye, X.; Selvan, S.R.; Brosman, S. Epicatechins Purified from Green Tea (Camellia sinensis) Differentially Suppress Growth of Gender-Dependent Human Cancer Cell Lines. eCAM 2006, 3, 237–247. [Google Scholar] [CrossRef] [PubMed]
- Albrecht, D.S.; Clubbs, E.A.; Ferruzzi, M.; Bomser, J.A. Epigallocatechin-3-gallate (EGCG) inhibits PC-3 prostate cancer cell proliferation via MEK-independent ERK1/2 activation. Chem. Biol. Interact. 2008, 171, 89–95. [Google Scholar] [CrossRef] [PubMed]
- Chung, L.; Cheung, T.; Kong, S.; Fung, K.; Choy, Y.; Chan, Z.; Kwok, T. Induction of apoptosis by green tea catechins in human prostate cancer DU145 cells. Life Sci. 2001, 68, 1207–1214. [Google Scholar] [CrossRef]
- Gupta, S.; Ahmad, N.; Nieminen, A.-L.; Mukhtar, H. Growth Inhibition, Cell-Cycle Dysregulation, and Induction of Apoptosis by Green Tea Constituent (−)-Epigallocatechin-3-gallate in Androgen-Sensitive and Androgen-Insensitive Human Prostate Carcinoma Cells. Toxicol. Appl. Pharmacol. 2000, 164, 82–90. [Google Scholar] [CrossRef] [PubMed]
- Haddad, A.Q.; Venkateswaran, V.; Viswanathan, L.; Teahan, S.J.; Fleshner, N.E.; Klotz, L.H. Novel antiproliferative flavonoids induce cell cycle arrest in human prostate cancer cell lines. Prostate Cancer Prostatic Dis. 2005, 9, 68–76. [Google Scholar] [CrossRef] [PubMed]
- Tang, S.-N.; Singh, C.; Nall, D.; Meeker, D.; Shankar, S.; Srivastava, R.K. The dietary bioflavonoid quercetin synergizes with epigallocathechin gallate (EGCG) to inhibit prostate cancer stem cell characteristics, invasion, migration and epithelial-mesenchymal transition. J. Mol. Signal. 2010, 5, 14. [Google Scholar] [CrossRef] [PubMed]
- Smith, D.M.; Wang, Z.; Kazi, A.; Li, L.-H.; Chan, T.-H.; Dou, Q.P. Synthetic Analogs of Green Tea Polyphenols as Proteasome Inhibitors. Mol. Med. 2002, 8, 382–392. [Google Scholar] [CrossRef] [PubMed]
- Shabana, S.M. Anti-proliferative and pro-apoptotic effects of (−)-epigallocatechin-3-gallate encapsulated in chitosan nanoparticles on human prostate carcinoma cells. J. Pharm. Pharmacol. 2014, 2, 1–7. [Google Scholar]
- Roomi, M.W.; Ivanov, V.; Kalinovsky, T.; Niedzwiecki, A.; Rath, M. In vivo antitumor effect of ascorbic acid, lysine, proline and green tea extract on human prostate cancer PC-3 xenografts in nude mice: Evaluation of tumor growth and immunohistochemistry. In Vivo 2005, 19, 179–183. [Google Scholar]
- Stearns, M.E.; Amatangelo, M.D.; Varma, D.; Sell, C.; Goodyear, S.M. Combination Therapy with Epigallocatechin-3-Gallate and Doxorubicin in Human Prostate Tumor Modeling Studies: Inhibition of Metastatic Tumor Growth in Severe Combined Immunodeficiency Mice. Am. J. Pathol. 2010, 177, 3169–3179. [Google Scholar] [CrossRef] [PubMed]
- Liao, S.; Umekita, Y.; Guo, J.; Kokontis, J.M.; Hiipakka, R.A. Growth inhibition and regression of human prostate and breast tumors in athymic mice by tea epigallocatechin gallate. Cancer Lett. 1995, 96, 239–243. [Google Scholar] [CrossRef]
- ICH. International Conference on Harmonization: Guideline on the Validation of Analysis Procedures; Methodology Q2B; ICH: Brussels, Belgium, 2013. [Google Scholar]
- APA. American Physiological Association: Guidelines for Ethical Conduct in the Care and Use of Animals. 2012. Available online: http://www.apa.org/science/leadership/care/guidelines (accessed on 25 January 2021).


| Peak No. | Compound | tR | k | α | PP (%) | Absorption Wavelength (λmax, nm) | Mass Spectra ([M − H]−, m/z) d | Tandem Mass Fragment Ions (MS2) | |||||
|---|---|---|---|---|---|---|---|---|---|---|---|---|---|
| Extract c | Standard | Reported | Extract | Standard | Reported | Extract | Reported | ||||||
| IS a | L-tryptophan | 5.11 | - | - | - | - | - | - | - | - | - | - | - |
| 1 | epigallocatechin (EGC) | 7.40 | 1.26 | 2.08 (1,2) b | 99.95 | 270 | 270 | 271 e | 305 | 305 | 305 e | 261, 219, 137 | 261, 219 h, 137 g |
| 2 | epicatechin (EC) | 11.88 | 2.63 | 2.08 (1,2) b | 99.94 | 278 | 278 | 275 f | 289 | 289 | 289 f | 245, 203, 125 | 245, 203, 125 i |
| 3 | epigallocatechin gallate (EGCG) | 12.72 | 2.89 | 1.10 (2,3) b | 99.98 | 274 | 274 | 274 e | 457 | 457 | 457 e | 331, 305, 169, 125 | 331, 305, 169 i, 125 g |
| 4 | gallocatechin gallate (GCG) | 13.86 | 3.24 | 1.12 (3,4) b | 99.92 | 274 | 274 | 274 e | 457 | 457 | 457 e | 305, 169, 125 | 305, 169, 125 g |
| 5 | epicatechin gallate (ECG) | 16.42 | 4.03 | 1.24 (4,5) b | 99.99 | 276 | 278 | 278 e | 441 | 441 | 441 e | 289, 169 | 289, 169 h |
| Compound | Calibration Curve | LOD b (μg/mL) | LOQ c (μg/mL) | Content (mg/g) d | Recovery Data (%) | Intra-Day Variability | Inter-Day Variability | ||||||
|---|---|---|---|---|---|---|---|---|---|---|---|---|---|
| Original (μg) | Spiked (μg) | Found (μg) | Mean Recovery (%) e | RSD f (%) | Content (mg/g) g | RSD f (%) | Content (mg/g) h | RSD f (%) | |||||
| epigallocatechin (EGC) | y = 0.2551x + 0.2682 (0.9971) a | 0.18 | 0.55 | 7.17 ± 0.10 | 769.6 769.6 | 700.0 1050.0 | 1414.1 1830.9 | 96.6 ± 4.2 | 4.31 | 7.28 ± 0.03 | 0.39 | 7.17 ± 0.10 | 1.37 |
| epicatechin (EC) | y = 0.1572x + 0.1895 (0.9966) a | 0.11 | 0.32 | 6.29 ± 0.06 | 897.4 897.4 | 600.0 900.0 | 1453.1 1772.0 | 94.9 ± 8.2 | 8.63 | 6.33 ± 0.09 | 1.34 | 6.29 ± 0.07 | 1.03 |
| epigallocatechin gallate (EGCG) | y = 1.7592x − 28.732 (0.9909) a | 0.04 | 0.12 | 28.36 ± 0.08 | 4524.9 4524.9 | 3000.0 4500.0 | 7616.7 9261.6 | 104.2 ± 2.2 | 2.09 | 29.25 ± 0.06 | 0.20 | 29.15 ± 0.12 | 0.40 |
| gallocatechin gallate (GCG) | y = 0.7163x − 0.0299 (0.9982) a | 0.03 | 0.11 | 1.67 ± 0.01 | 175.6 175.6 | 150.0 225.0 | 312.7 358.9 | 86.5 ± 2.4 | 2.75 | 1.67 ± 0.01 | 0.56 | 1.67 ± 0.01 | 0.63 |
| epicatechin gallate (ECG) | y = 1.1243x − 3.0065 (0.9922) a | 0.03 | 0.10 | 10.75 ± 0.04 | 1361.6 1361.6 | 1000.0 1500.0 | 2356.4 2812.4 | 98.1 ± 0.2 | 0.15 | 13.11 ± 0.12 | 0.91 | 13.14 ± 0.07 | 0.56 |
| Concentration (μg/mL) | Sub-G1 (%) | G0/G1 (%) | S (%) | G2/M (%) |
|---|---|---|---|---|
| Control | 0.98 ± 0.2 a | 88.82 ± 1.4 a | 3.63 ± 0.6 a | 6.43 ± 0.5 a |
| Extract | ||||
| 10 | 0.98 ± 0.1 a | 81.36 ± 1.1 b | 8.66 ± 1.1 b | 8.75 ± 0.9 b |
| 15 | 1.42 ± 0.1 b | 83.11 ± 1.6 b | 6.92 ± 0.8 b | 8.35 ± 0.6 b |
| 20 | 1.56 ± 0.2 bc | 82.73 ± 0.8 b | 7.96 ± 1.0 b | 8.19 ± 0.7 b |
| Nanoemulsion | ||||
| 10 | 1.47 ± 0.1 b | 81.95 ± 1.0 b | 8.22 ± 0.7 b | 8.14 ± 0.8 b |
| 15 | 1.74 ± 0.1 cd | 79.63 ± 0.9 c | 10.42 ± 0.3 c | 7.42 ± 0.4 b |
| 20 | 1.91 ± 0.1 d | 77.59 ± 1.2 c | 12.86 ± 0.4 d | 7.60 ± 0.4 b |
| Treatment | Necrosis Cells (B1) (%) | Late Apoptosis Cells (B2) (%) | Viable Cells (B3) (%) | Early Apoptosis Cells (B4) (%) |
|---|---|---|---|---|
| Control | 0.44 ± 0.1 a | 1.01 ± 0.1 a | 97.69 ± 1.2 a | 0.85 ± 0.2 a |
| Extract (20 μg/mL) | 1.01 ± 0.1 b | 1.05 ± 0.2 a | 93.30 ± 0.9 b | 4.64 ± 0.4 b |
| Nanoemulsion (20 μg/mL) | 2.45 ± 0.2 c | 3.51 ± 0.6 b | 89.28 ± 0.7 c | 4.76 ± 0.1 b |
Publisher’s Note: MDPI stays neutral with regard to jurisdictional claims in published maps and institutional affiliations. |
© 2021 by the authors. Licensee MDPI, Basel, Switzerland. This article is an open access article distributed under the terms and conditions of the Creative Commons Attribution (CC BY) license (https://creativecommons.org/licenses/by/4.0/).
Share and Cite
Lin, Y.-H.; Wang, C.-C.; Lin, Y.-H.; Chen, B.-H. Preparation of Catechin Nanoemulsion from Oolong Tea Leaf Waste and Its Inhibition of Prostate Cancer Cells DU-145 and Tumors in Mice. Molecules 2021, 26, 3260. https://doi.org/10.3390/molecules26113260
Lin Y-H, Wang C-C, Lin Y-H, Chen B-H. Preparation of Catechin Nanoemulsion from Oolong Tea Leaf Waste and Its Inhibition of Prostate Cancer Cells DU-145 and Tumors in Mice. Molecules. 2021; 26(11):3260. https://doi.org/10.3390/molecules26113260
Chicago/Turabian StyleLin, Yu-Hsiang, Chi-Chung Wang, Ying-Hung Lin, and Bing-Huei Chen. 2021. "Preparation of Catechin Nanoemulsion from Oolong Tea Leaf Waste and Its Inhibition of Prostate Cancer Cells DU-145 and Tumors in Mice" Molecules 26, no. 11: 3260. https://doi.org/10.3390/molecules26113260
APA StyleLin, Y.-H., Wang, C.-C., Lin, Y.-H., & Chen, B.-H. (2021). Preparation of Catechin Nanoemulsion from Oolong Tea Leaf Waste and Its Inhibition of Prostate Cancer Cells DU-145 and Tumors in Mice. Molecules, 26(11), 3260. https://doi.org/10.3390/molecules26113260