
Classification of Congeneric and QSAR of Homologous Antileukemic S–Alkylcysteine Ketones


Abstract
1. Introduction
2. Results and Discussion
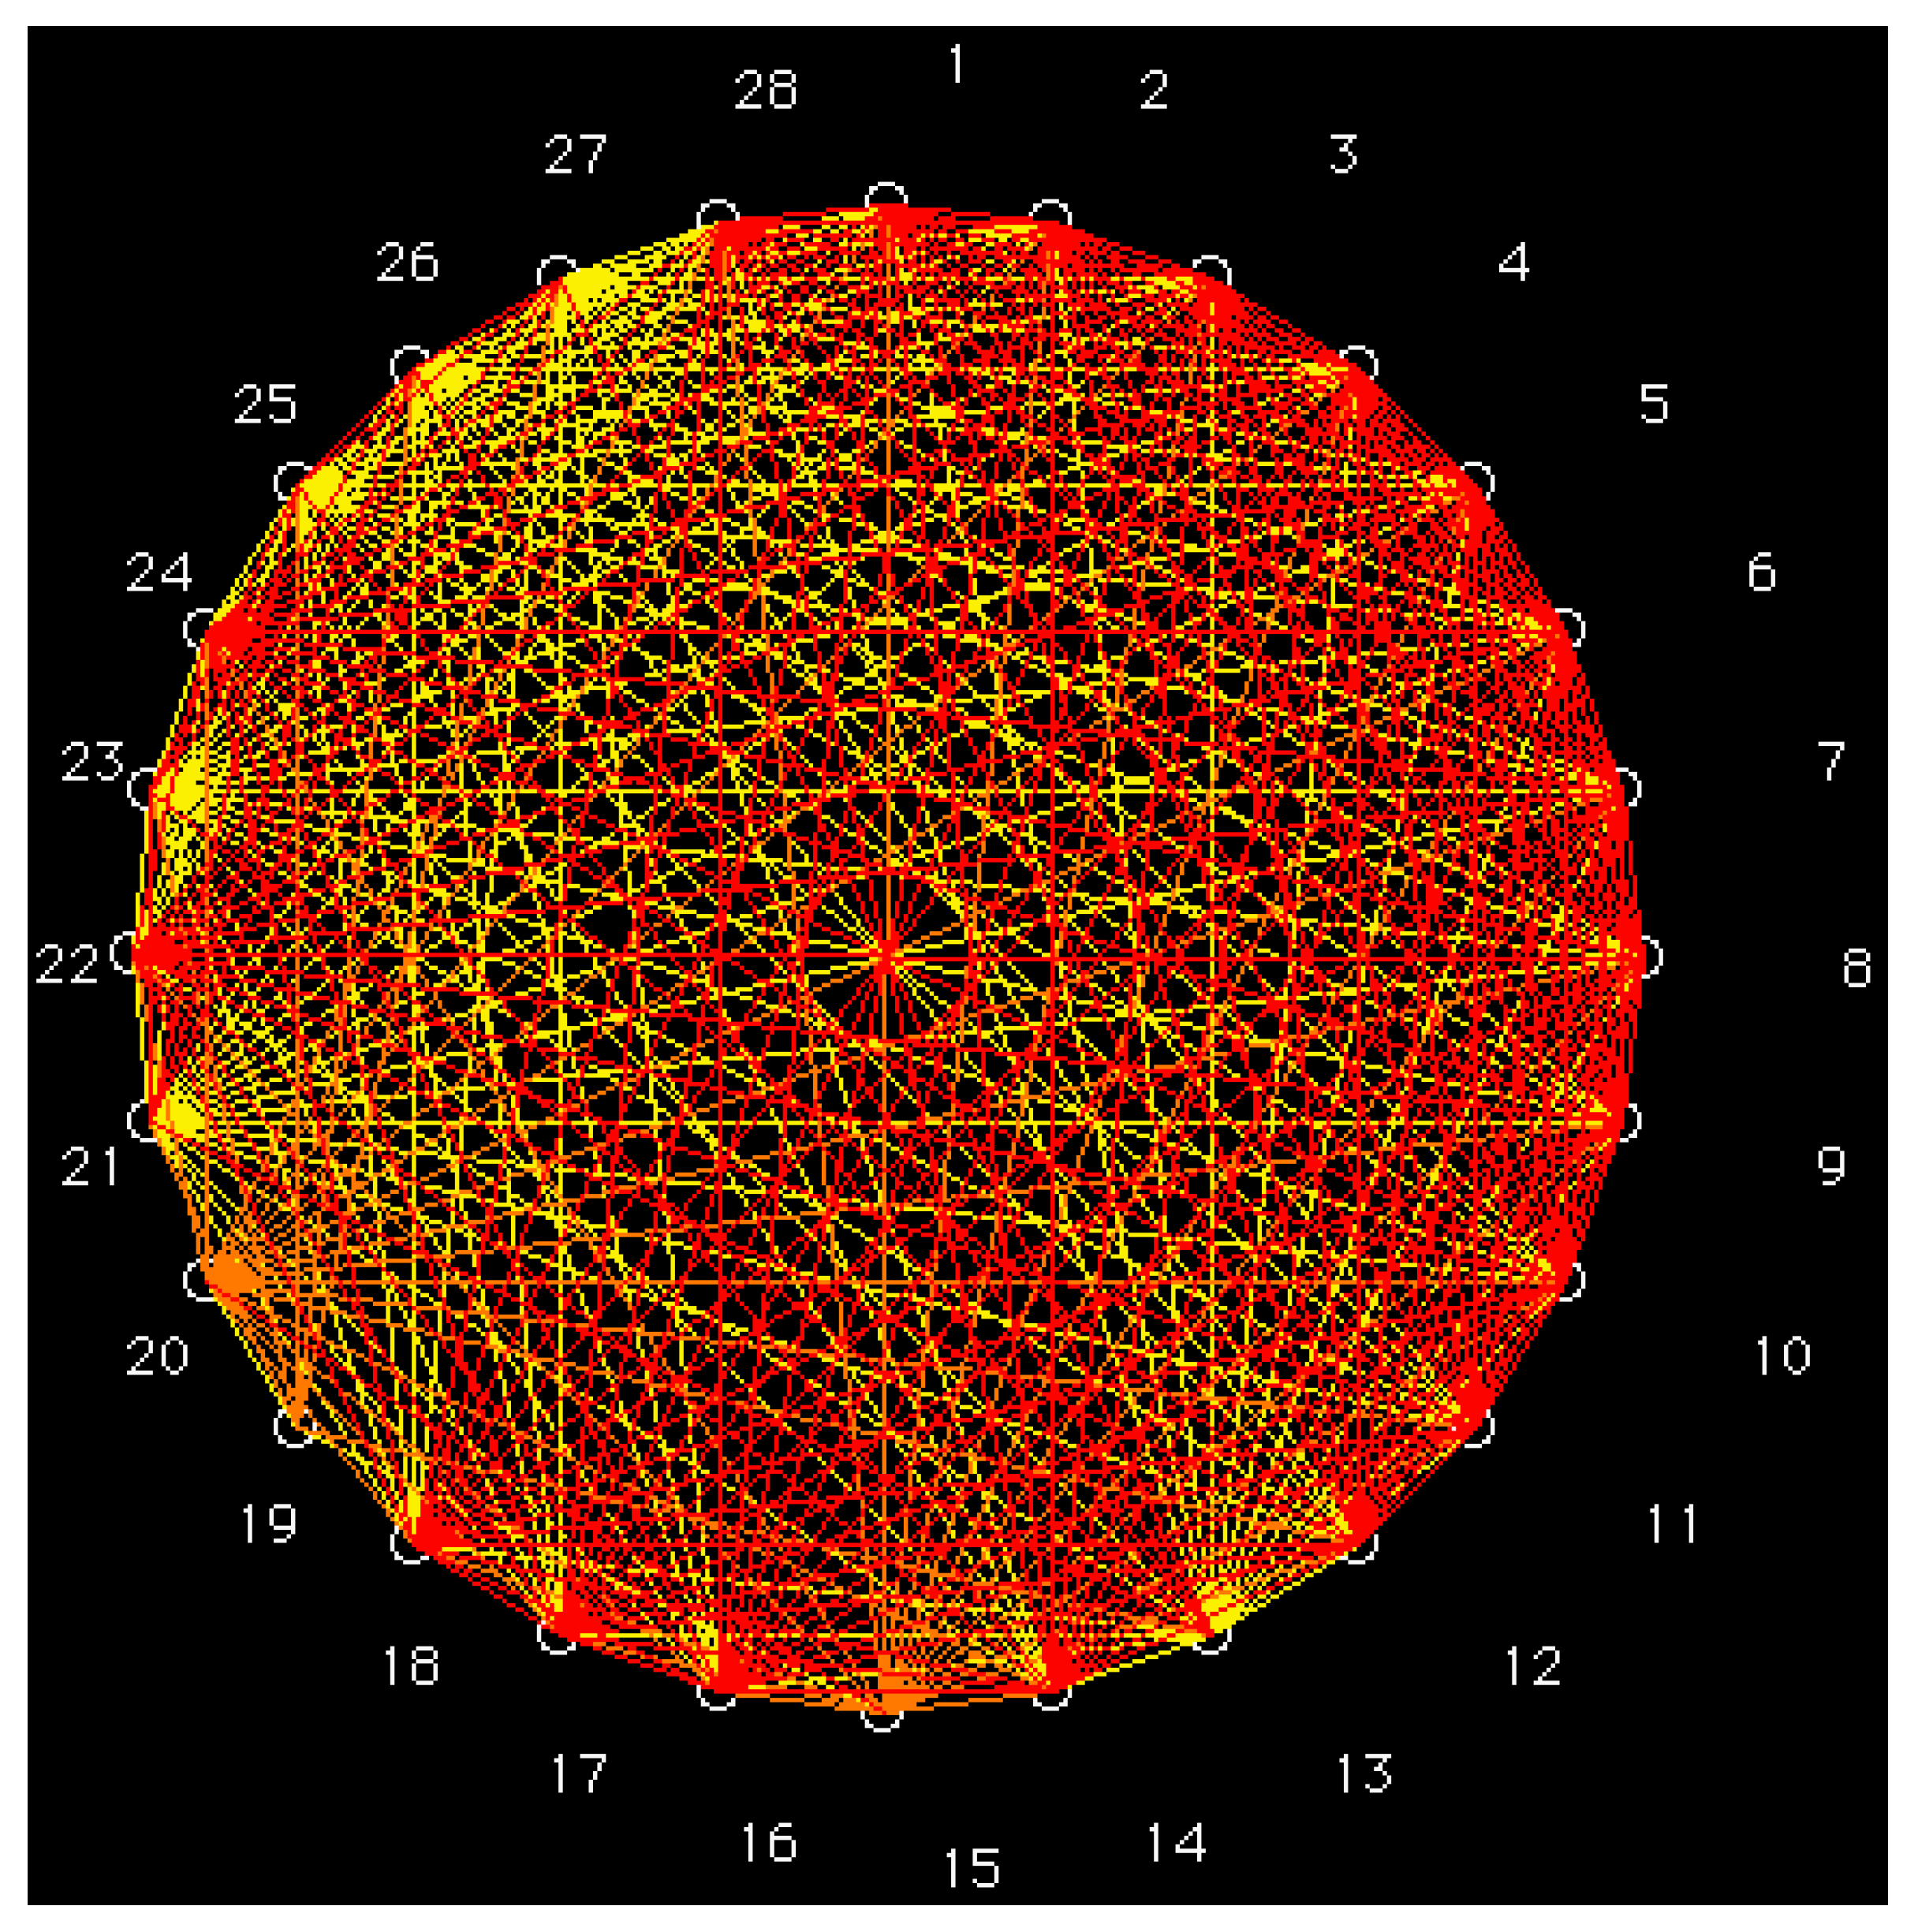
2.1. GraphCor Partial Correlation Diagram
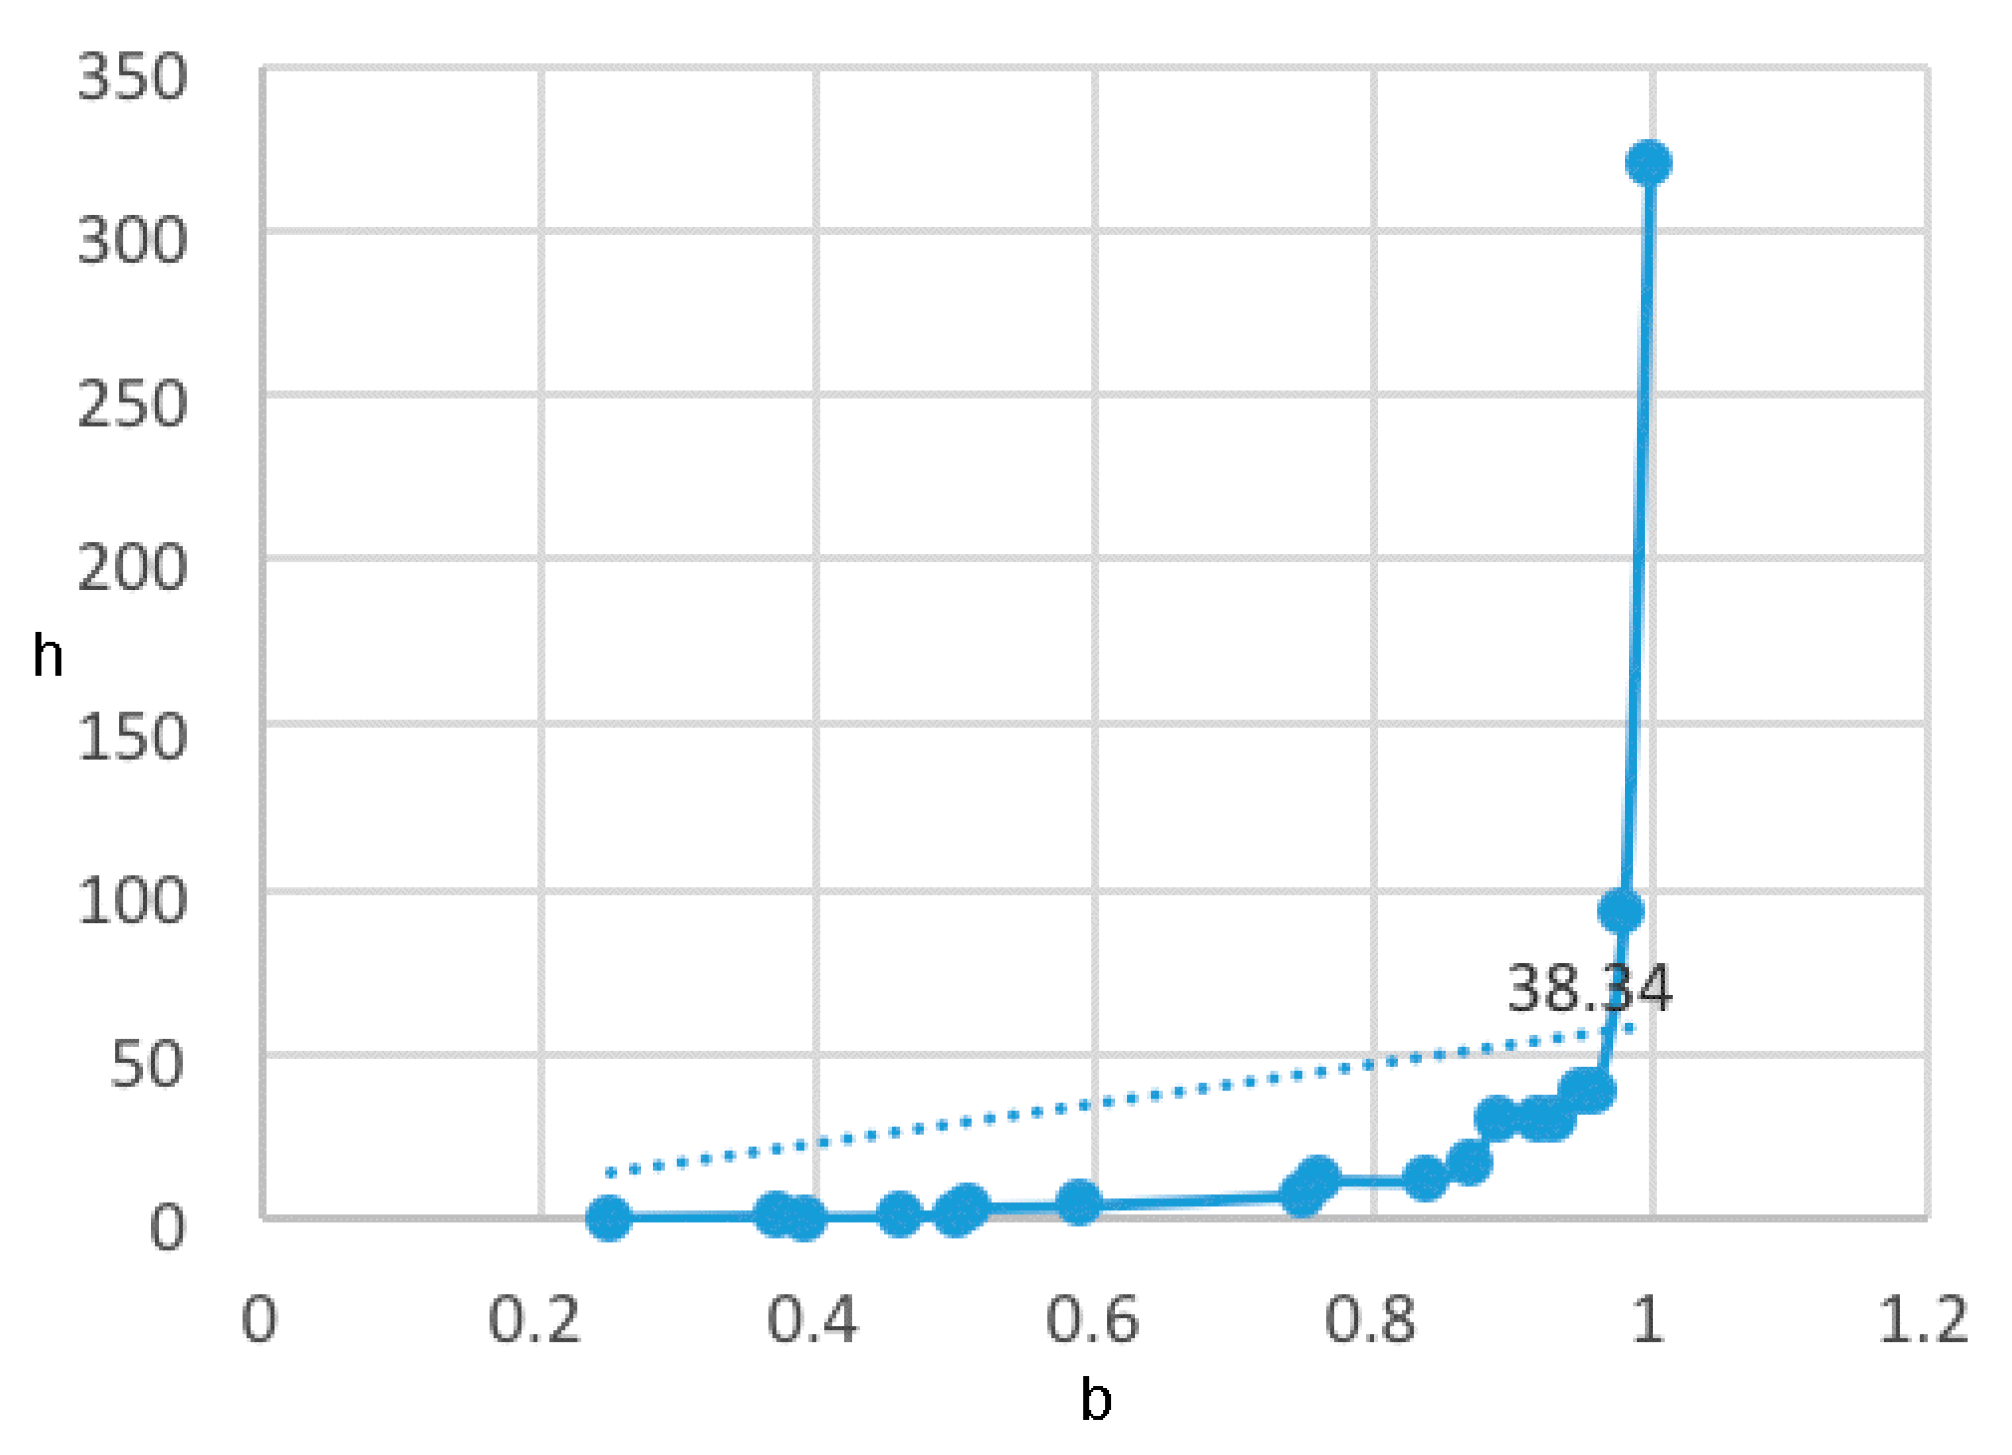
2.2. MolClas Molecular Classification Based on the Equipartition Conjecture of Entropy Production
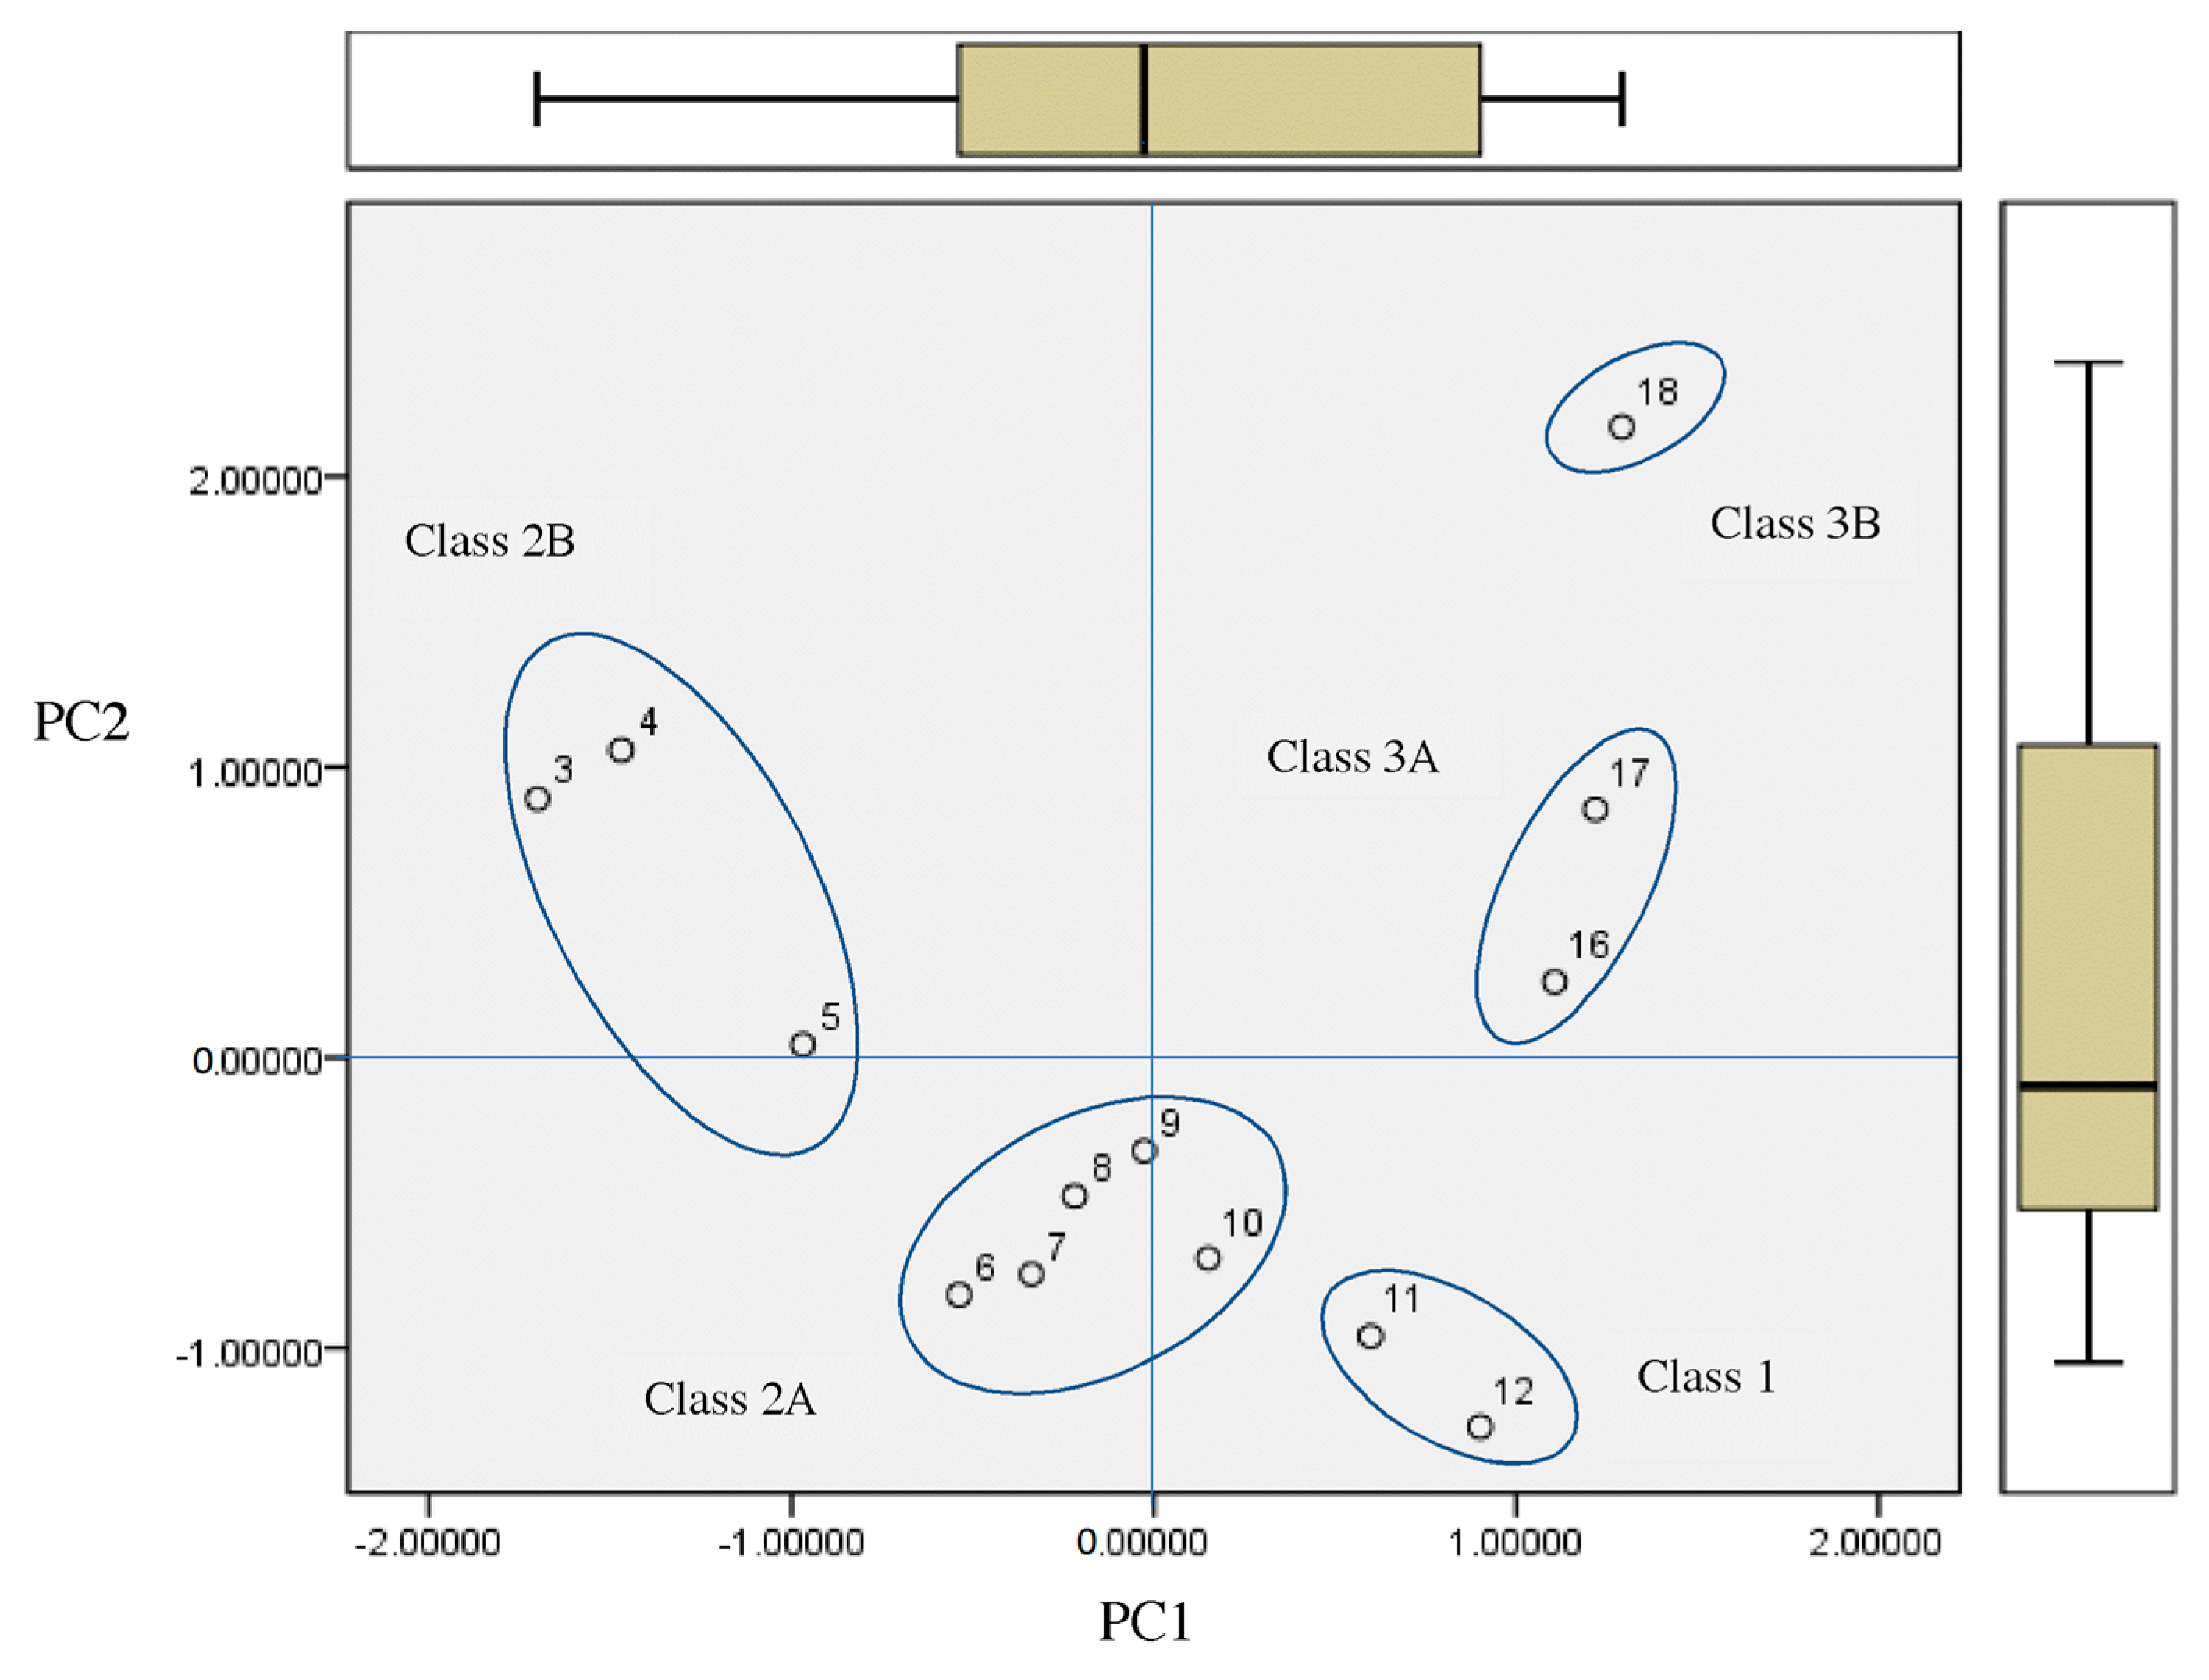
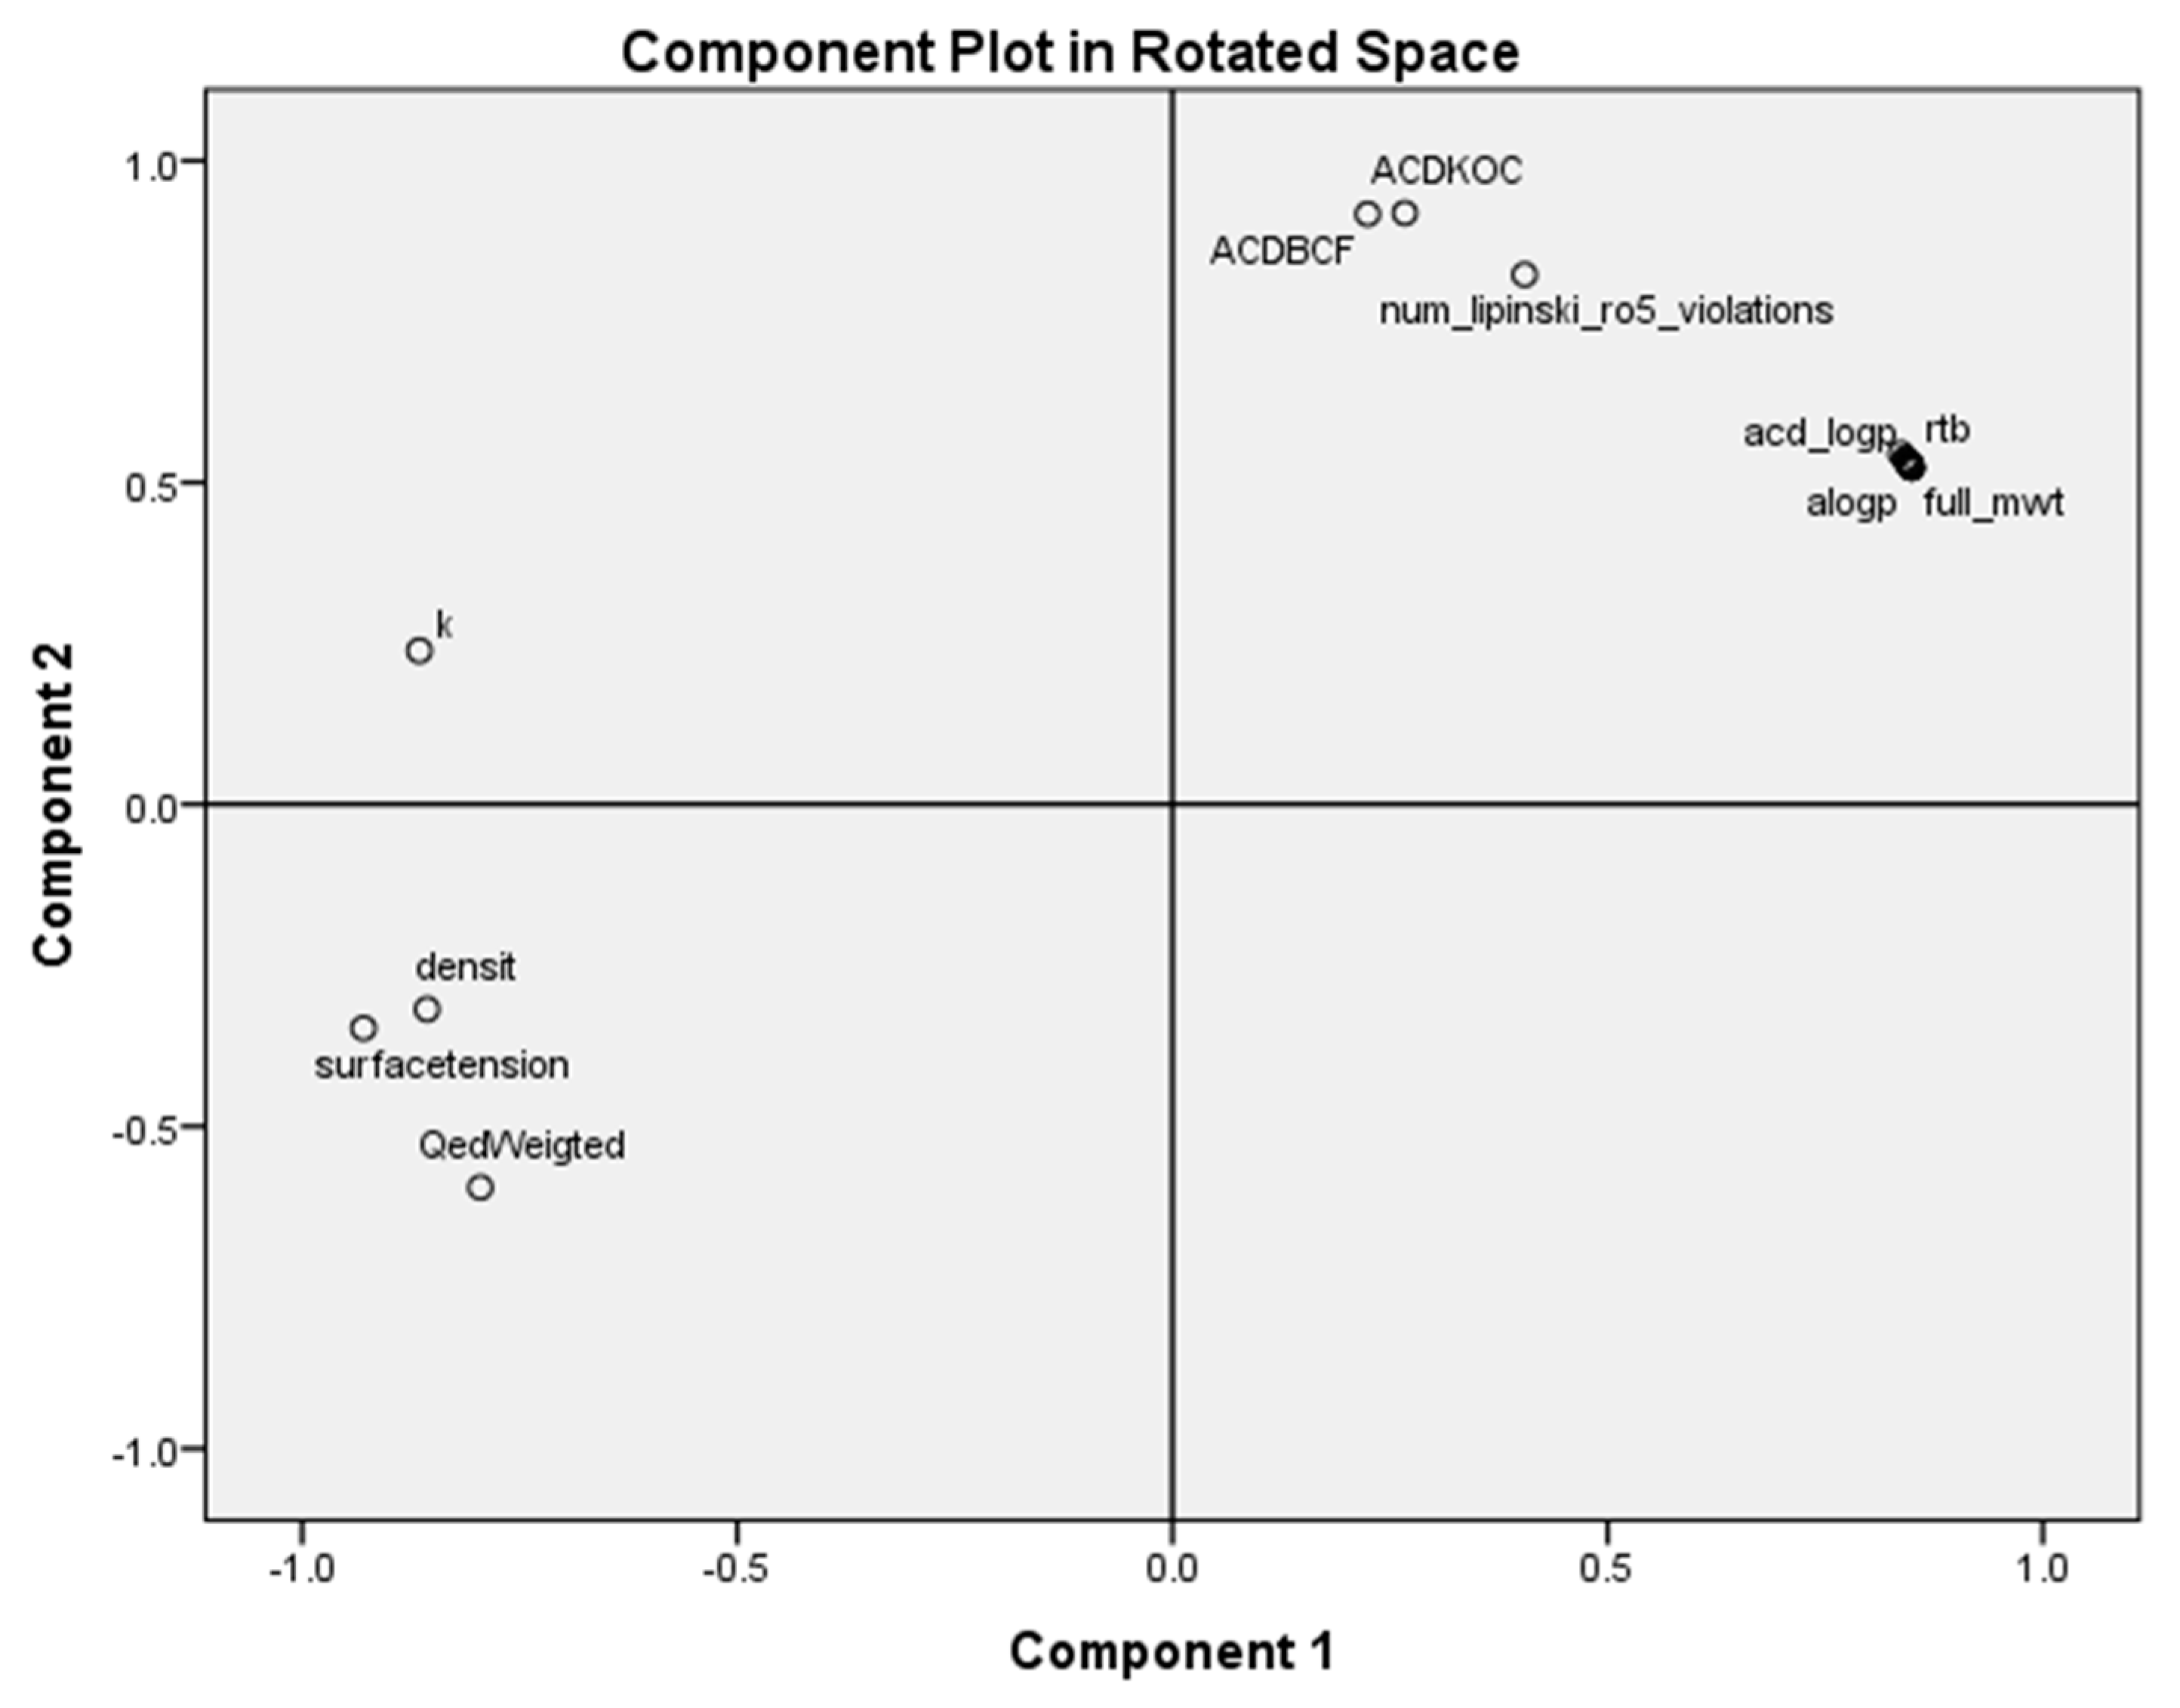
2.3. Principal Component Analysis for Classification of the Most Antileukemic Bioactive Compounds
3. Materials and Methods
3.1. MolClas Program for Molecular Classification Based on the Equipartition Conjecture of Entropy Production
3.2. GraphCor Program for Partial Correlation Diagram
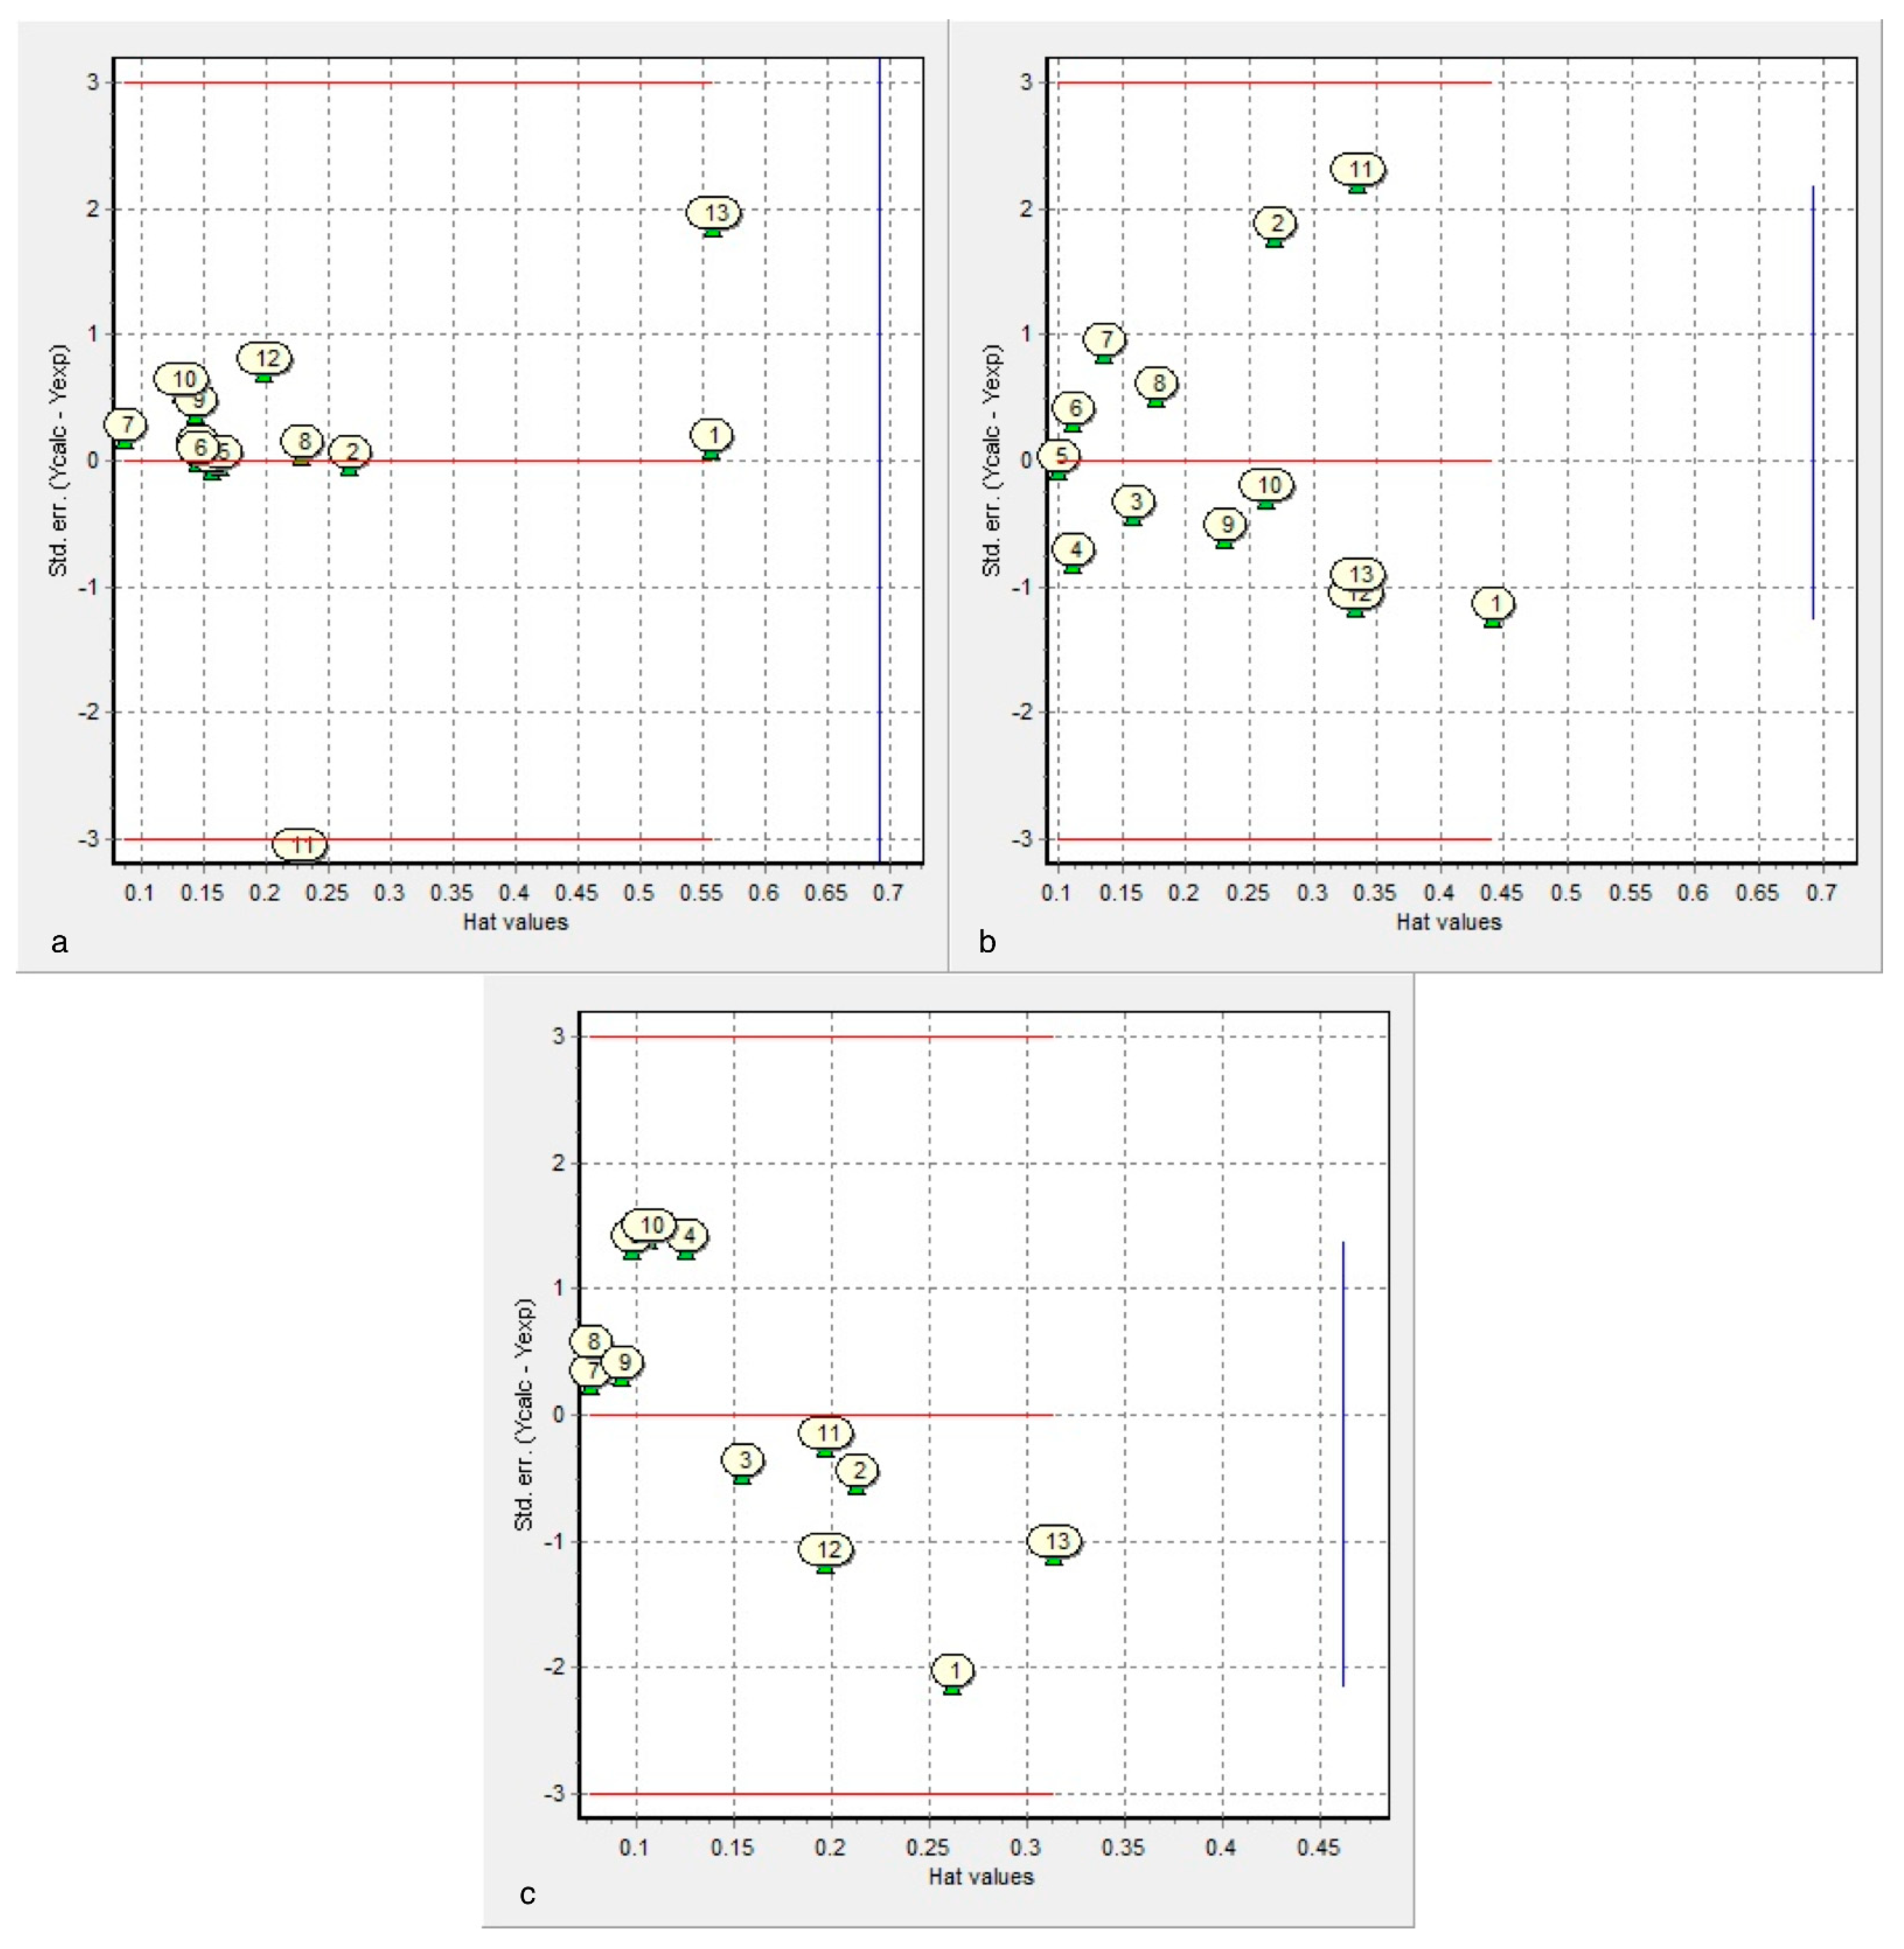
3.3. Statistical Analysis
4. Conclusions
- Based on a set of six vector properties, the partial correlation diagram was calculated for a set of 28 S-alkylcysteine diazomethyl- and chloromethyl-ketone derivatives. Derivatives with the greatest antileukemic activity in the same class correspond to high partial correlations.
- A table of periodic classification is made based on information entropy. The first four characteristics denote the group, and the last two indicate the period. Nine classes are clearly distinguished. The most active compounds (11, 12 and 24), all with 11 or 12 carbons in line in R2, are situated at the right side, bottom and, especially, bottom right of this periodic table.
- The principal component analysis scores plot of the homologous series of S-alkyl chloromethyl ketones, for 18 properties, shows five subclasses corresponding to the periodic classification of the congeneric series into nine classes.
- Linear fits of both antileukemic activities and stability are good (correlation coefficients of 0.57 or greater). They are in agreement with the principal component analysis. The variables that appear in the models are those that show positive loading in the principal component analysis.
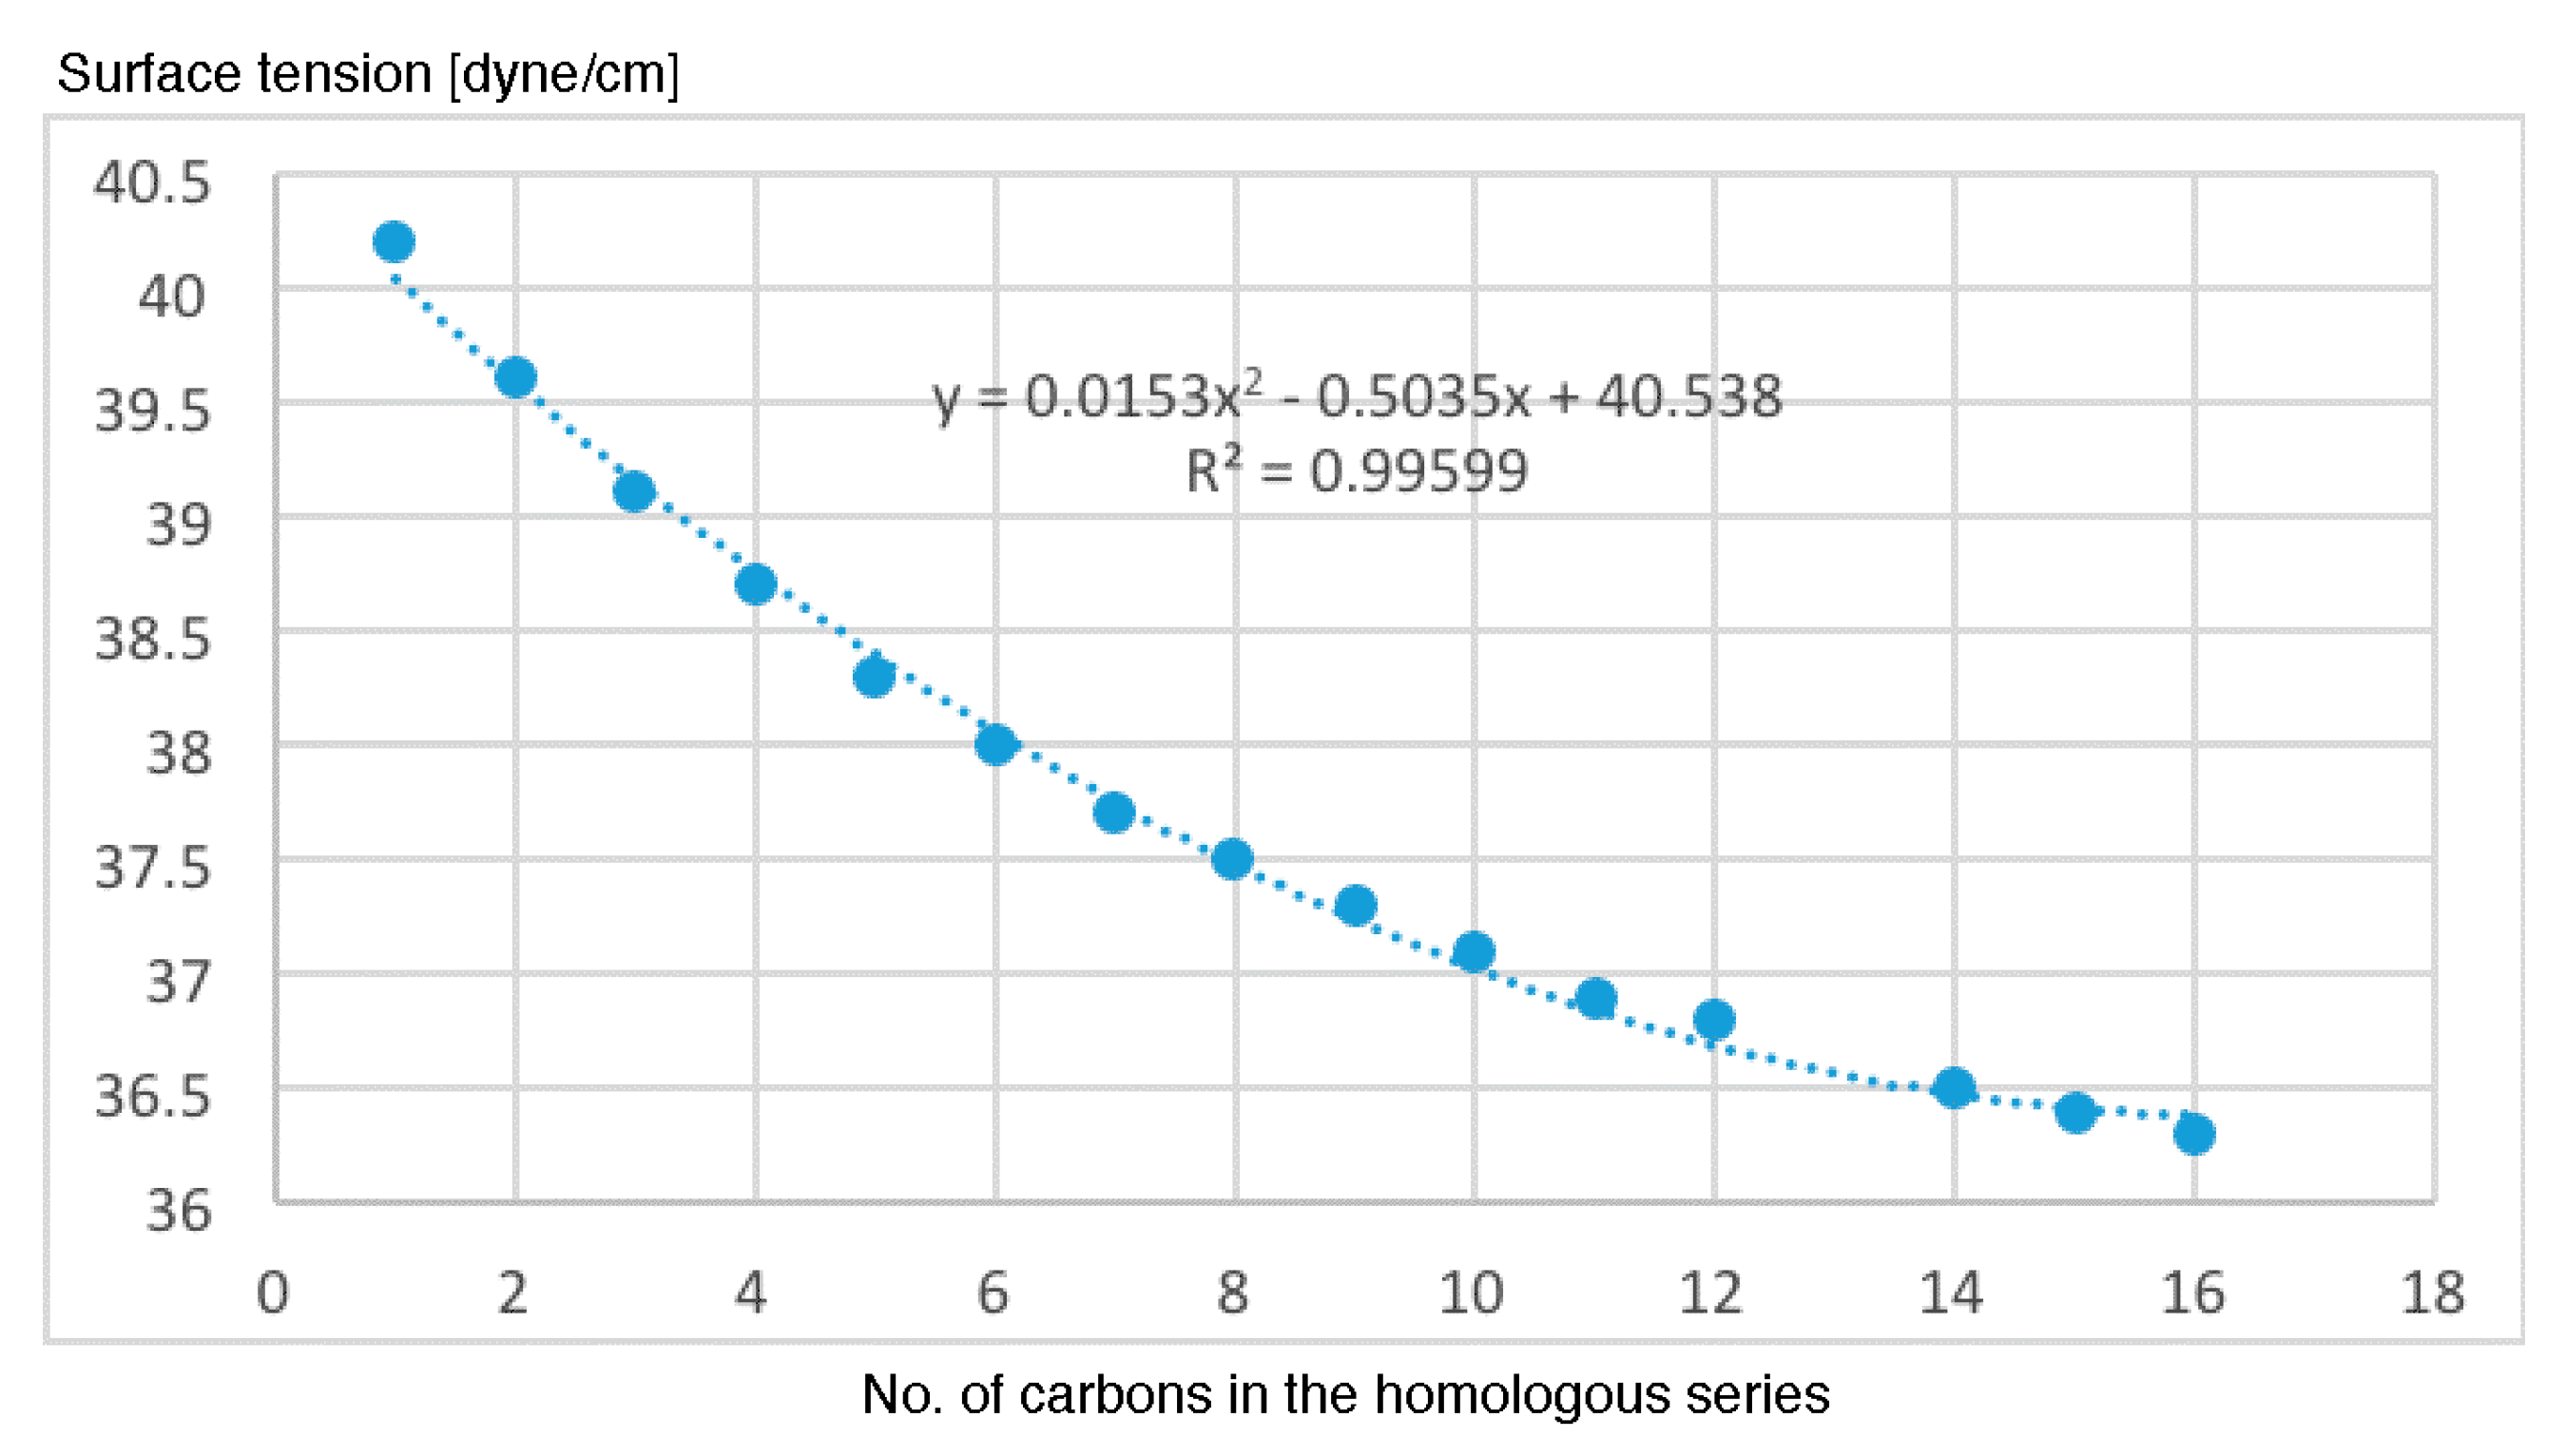
- The most important properties to explain the antileukemic activities (50% inhibitory concentration Molt-3 T-lineage acute lymphoblastic leukemia minus the logarithm of 50% inhibitory concentration Nalm-6 B-lineage acute lymphoblastic leukemia and stability k) are ACD logD, surface tension and number of violations of Lipinski’s rule of five.
- After leave-m-out cross-validation, Equation (1) is the most predictive for cysteine diazomethyl- and chloromethyl-ketone derivatives (cross-validated correlation coefficient of 0.764).
- The results of the antileukemic activities for the cysteine diazomethyl- and chloromethyl-ketone derivatives show that the surface tension has an unfavorable influence and this could be related to the results obtained by Thakur.
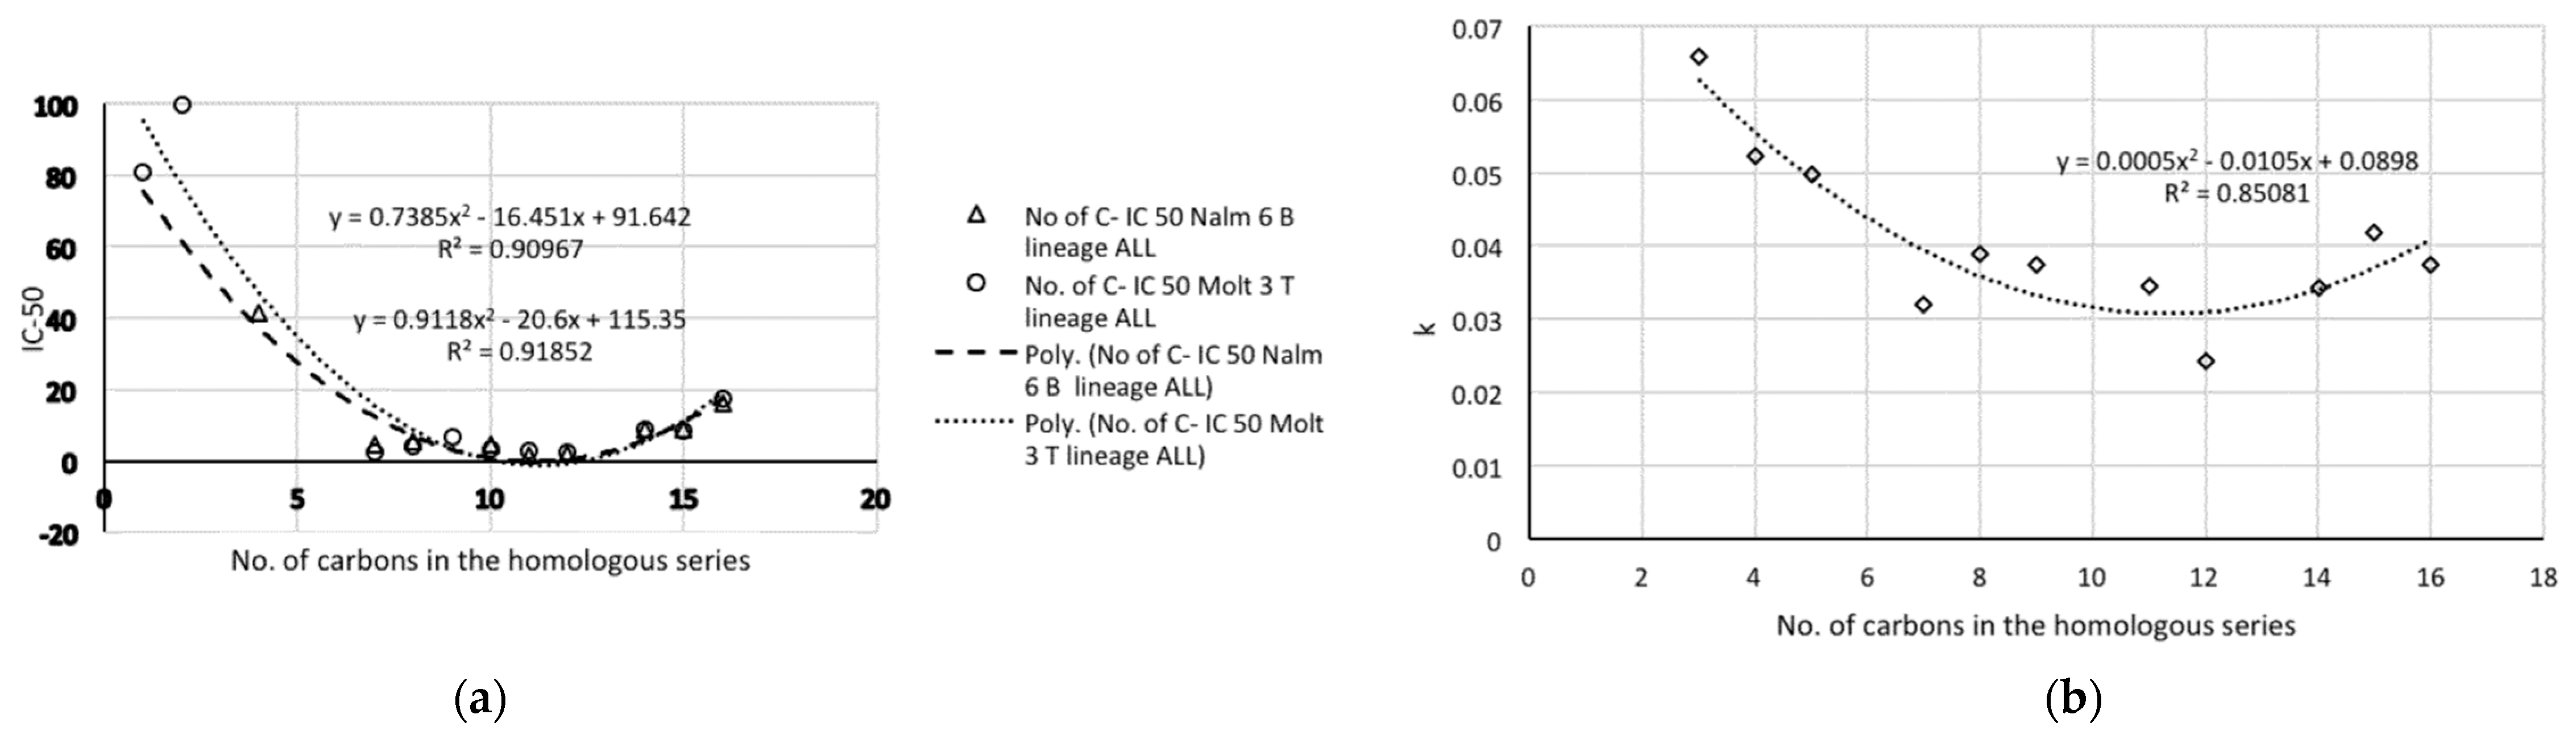
- The representations of 50% inhibitory concentration Nalm-6 B-lineage and 50% inhibitory concentration Molt-3 T-lineage acute lymphoblastic leukemias, as well as stability k vs. the number of carbons, are fitted to second-degree polynomial curves. The most active compounds (11 and 12) present minimum values and coincide with Class 1 obtained by information entropy theory.
Supplementary Materials
Author Contributions
Funding
Institutional Review Board Statement
Informed Consent Statement
Data Availability Statement
Acknowledgments
Conflicts of Interest
Sample Availability
References
- Jemal, A.; Bray, F.; Center, M.M.; Ferlay, J.; Ward, E.; Forman, D. Global cancer statistics. CA Cancer J. Clin. 2011, 61, 69–90. [Google Scholar] [CrossRef] [PubMed]
- Bray, F.; Ferlay, J.; Soerjomataram, I.; Siegel, R.L.; Torre, L.A.; Jemal, A. Global cancer statistics 2018: GLOBOCAN estimates of incidence and mortality worldwide for 36 cancers in 185 countries. CA Cancer J. Clin. 2018, 68, 394–424. [Google Scholar] [CrossRef] [PubMed]
- Uckun, F.M.; Narla, R.M.; Perry, D.A. Parker Hughes Institute. Alkyl Ketones as Potent Anti-Cancer Agents. Patent US6251882B1, 26 June 2001. [Google Scholar]
- Uckun, F.M.; Narla, R.M.; Perry, D.A. Parker Hughes Institute. Alkyl Ketones as Potent Anti-Cancer Agents. Patent CA2336108A1, 6 January 2001. [Google Scholar]
- Perrey, D.A.; Narla, R.K.; Uckun, F.M. Cysteine chloromethyl and diazomethyl ketone derivatives with potent anti-leukemic activity. Bioorg. Med. Chem. Lett. 2000, 10, 547–549. [Google Scholar] [CrossRef]
- Perrey, D.A.; Scannell, M.P.; Narla, R.K.; Uckun, F.M. The S-alkyl chain length as a determinant of the anti-leukemic activity of cysteine chloromethyl ketone compounds. Bioorg. Med. Chem. Lett. 2000, 10, 551–552. [Google Scholar] [CrossRef]
- Kotchevar, A.T.; Perrey, D.A.; Uckun, F.M. A degradation study of a series of chloromethyl and diazomethyl ketone anti-leukemic agents. Drug Develop. Ind. Pharm. 2002, 28, 143–149. [Google Scholar] [CrossRef] [PubMed]
- Holland, H.L.; Brown, F.M.; Johnson, D.V.; Kerridge, A.; Mayne, B.; Turner, C.D.; van Vliet, A.J. Biocatalytic oxidation of S-alkylcysteine derivatives by chloroperoxidase and Beauveria species. J. Mol. Catal. B Enzym. 2002, 17, 249–256. [Google Scholar] [CrossRef]
- Calce, E.; De Luca, S. The cysteine S-alkylation reaction as a synthetic method to covalently modify peptide sequences. Chem. Eur. J. 2017, 23, 224–233. [Google Scholar] [CrossRef] [PubMed]
- Castellano, G.; Redondo, L.; Torrens, F. QSAR of natural sesquiterpene lactones as inhibitors of Myb-dependent gene expression. Curr. Top. Med. Chem. 2017, 17, 3256–3268. [Google Scholar] [CrossRef] [PubMed]
- Torrens, F.; Castellano, G. Structure–activity relationships of cytotoxic lactones as inhibitors and mechanisms of action. Curr. Drug Discov. Technol. 2020, 17, 166–182. [Google Scholar] [CrossRef] [PubMed]
- Castellano, G.; Tena, J.; Torrens, F. Structural indicators and its relation to antioxidant properties of Posidonia oceanica (L.) Delile. MATCH Commun. Math. Comput. Chem. 2012, 67, 231–250. [Google Scholar]
- Castellano, G.; González-Santander, J.L.; Lara, A.; Torrens, F. Classification of flavonoid compounds by using entropy of information theory. Phytochemistry 2013, 93, 182–191. [Google Scholar] [CrossRef] [PubMed]
- Castellano, G.; Lara, A.; Torrens, F. Classification of stilbenoid compounds by entropy of artificial intelligence. Phytochemistry 2014, 97, 62–69. [Google Scholar] [CrossRef] [PubMed]
- Castellano, G.; Torrens, F. Quantitative structure–antioxidant activity models of isoflavonoids: A theoretical study. Int. J. Mol. Sci. 2015, 16, 12891–12906. [Google Scholar] [CrossRef] [PubMed]
- Castellano, G.; Torrens, F. Information entropy-based classification of triterpenoids and steroids from Ganoderma. Phytochemistry 2015, 116, 305–313. [Google Scholar] [CrossRef] [PubMed]
- Shaw, P.J.A. Multivariate Statistics for the Environmental Sciences; Hodder-Arnold: New York, NY, USA, 2003. [Google Scholar]
- Thakur, A. QSAR study on benzenesulfonamide ionization constant: Physicochemical approach using surface tension. Arch. Org. Chem. 2005, 14, 49–58. [Google Scholar] [CrossRef]
- White, H. Neural network learning and statistics. AI Expert 1989, 4, 48–52. [Google Scholar]
- Kullback, S. Information Theory and Statistics; Wiley: New York, NY, USA, 1959. [Google Scholar]
- Iordache, O. Modeling Multi-Level Systems; Springer: Berlin/Heidelberg, Germany, 2011. [Google Scholar]
- Iordache, O. Self-Evolvable Systems: Machine Learning in Social Media; Springer: Berlin/Heidelberg, Germany, 2012. [Google Scholar]
- IMSL. Integrated Mathematical Statistical Library (IMSL); IMSL: Houston, TX, USA, 1989. [Google Scholar]
- Besalú, E. Fast computation of cross-validated properties in full linear leave-many-out procedures. J. Math. Chem. 2001, 29, 191–203. [Google Scholar] [CrossRef]


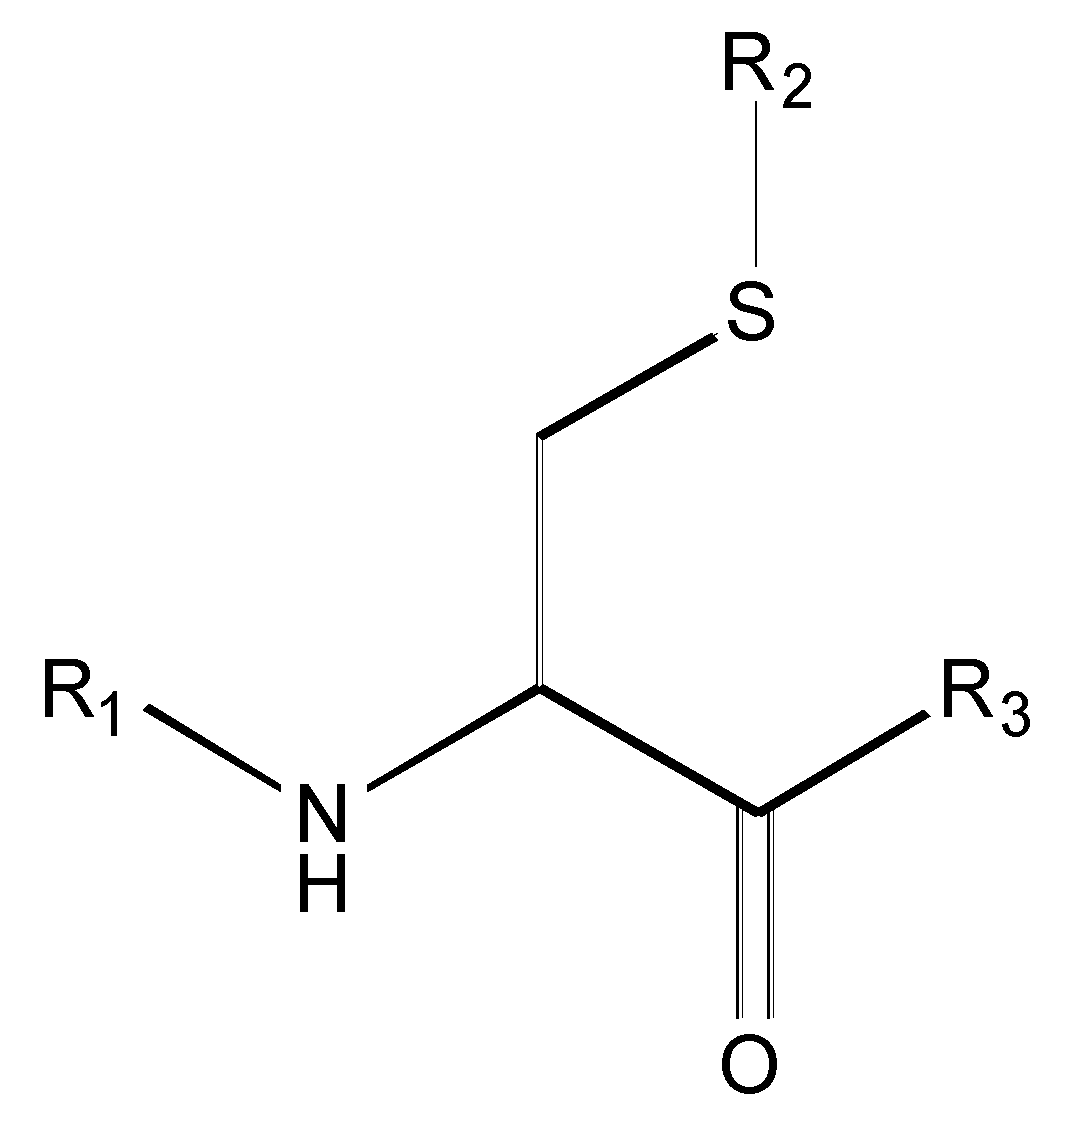
| Compound | R1 | R2 | R3 | <i1,i2,i3,i4,i5,i6> a | IC50 (µM) Nalm-6 B-lineage ALL | IC50 (µM) Molt-3 T-lineage ALL | k [hr−1] 0.01M Phosphate Buffer, pH = 8.0, Ionic Strength = 0.3 M |
|---|---|---|---|---|---|---|---|
| 1 | CH3CO | CH3 | CH2Cl | 111001 | 30.3 | 80.8 | – |
| 2 | CH3CO | CH2CH3 | CH2Cl | 111001 | 52.8 | 99.9 | – |
| 3 | CH3CO | (CH2)2CH3 | CH2Cl | 111101 | 6.9 | 8.0 | 0.0658 |
| 4 | CH3CO | (CH2)3CH3 | CH2Cl | 111101 | 41.4 | 5.6 | 0.0523 |
| 5 | CH3CO | (CH2)4CH3 | CH2Cl | 111101 | 5.8 | 5.4 | 0.0498 |
| 6 | CH3CO | (CH2)5CH3 | CH2Cl | 111101 | 3.3 | 0.7 | 0.0336 |
| 7 | CH3CO | (CH2)6CH3 | CH2Cl | 111101 | 4.8 | 2.5 | 0.0319 |
| 8 | CH3CO | (CH2)7CH3 | CH2Cl | 111101 | 5.6 | 4.1 | 0.0388 |
| 9 | CH3CO | (CH2)8CH3 | CH2Cl | 111101 | 7.3 | 6.7 | 0.0373 |
| 10 | CH3CO | (CH2)9CH3 | CH2Cl | 111101 | 4.7 | 3.4 | 0.0352 |
| 11 | CH3CO | (CH2)10CH3 | CH2Cl | 111111 | 1.7 | 3.0 | 0.0345 |
| 12 | CH3CO | (CH2)11CH3 | CH2Cl | 111111 | 2.0 | 2.3 | 0.0242 |
| 13 | CH3CO | (CH2)11CH3 | CH=N2 | 011111 | 15.4 | 22.9 | – |
| 14 | Boc b | (CH2)11CH3 | CH2Cl | 110111 | 15.1 | 15.5 | – |
| 15 | H c | (CH2)11CH3 | CH2Cl | 100111 | 17.7 | 12.5 | – |
| 16 | CH3CO | (CH2)13CH3 | CH2Cl | 111001 | 8.7 | 8.8 | 0.0417 |
| 17 | CH3CO | (CH2)14CH3 | CH2Cl | 111001 | 8.9 | 8.6 | 0.0374 |
| 18 | CH3CO | (CH2)15CH3 | CH2Cl | 111001 | 16.0 | 17.3 | 0.0363 |
| 19 | Boc-Gly | trans,trans-Farnesyl | CH=N2 | 000110 | 51.3 | 84.5 | – |
| 20 | Boc-Gly | trans,trans-Farnesyl | CH2Cl | 100110 | 12.9 | 17.5 | – |
| 21 | Boc | trans,trans-Farnesyl | CH=N2 | 010110 | 49.8 | 50.1 | – |
| 22 | Boc | trans,trans-Farnesyl | CH2Cl | 110110 | 10.7 | 7.7 | – |
| 23 | CH3CO | trans,trans-Farnesyl | CH=N2 | 011110 | 30.3 | 32.2 | – |
| 24 | CH3CO | trans,trans-Farnesyl | CH2Cl | 111110 | 3.0 | 1.4 | – |
| 25 | CH3CO | trans-Geranyl | CH=N2 | 011000 | >100 | >100 | – |
| 26 | Boc | trans-Geranyl | CH=N2 | 010000 | >100 | >100 | – |
| 27 | CH3CO | 3-Methyl-2-butenyl | CH=N2 | 011000 | >100 | >100 | – |
| 28 | CH3CO | 3-Methyl-2-butenyl | CH2Cl | 111000 | 12.6 | 7.9 | – |
| P a | 0001 b | 0100/0101/0110 | 0111 | 1001 | 1101 | 1110 | 1111 |
|---|---|---|---|---|---|---|---|
| 0X c | Class 9 | Class 3 | Class 2 | ||||
 |  |  | |||||
| 25 R1: CH3CO; R2: trans-Geranyl 26 R1: Boc; R2: trans-Geranyl 27 R1: CH3CO; R2: 3-Methyl-2-butenyl | 1 R2: -CH3 2 R2: -CH2CH3 16 R2: -(CH2)13CH3 17 R2: -(CH2)14CH3 18 R2: -(CH2)15CH3 28 R2: 3-Methyl-2-butenyl | 3 R2: -(CH2)2CH3 4 R2: -(CH2)3CH3 5 R2: -(CH2)4CH3 6 R2: -(CH2)5CH3 7 R2: -(CH2)6CH3 8 R2: -(CH2)7CH3 9 R2: -(CH2)8CH3 10 R2: -(CH2)9CH3 | |||||
| 1X | Class 8 | Class 7 | Class 6 | Class 5 | Class 4 | Class 1 | |
 |  |  |  |  |  | ||
| 19 R1: Boc-Gly; R2: trans,trans-Farnesyl | 21 R2: trans,trans-Farnesyl | 13 R2: -(CH2)11CH3 23 R2: trans,trans-Farnesyl | 15 R1: H.HCl; R2: -(CH2)11CH3 20 R1: Boc-Gly; R2: trans,trans-Farnesyl | 14 R2: -(CH2)11CH3 22 R2: trans,trans-Farnesyl | 11 R2: -(CH2)10CH3 12 R2: -(CH2)11CH3 24 R2: trans,trans-Farnesyl | ||
| b | h | No. of Classes |
|---|---|---|
| 1.0000 | 320.8858 | 28 |
| 0.9799 | 93.3938 | 14 |
| 0.9599 | 38.3400 | 9 |
| 0.9499 | 38.3178 | 9 |
| 0.9299 | 30.4859 | 8 |
| 0.9199 | 30.5388 | 8 |
| 0.8899 | 30.5166 | 8 |
| 0.8699 | 17.4259 | 6 |
| 0.8399 | 11.8925 | 5 |
| 0.7599 | 11.5383 | 5 |
| 0.7499 | 7.5860 | 4 |
| 0.5899 | 4.1698 | 3 |
| m | IC50 Molt-3 T-Lineage ALL Equation (1) | pIC50 Nalm-6 B-Lineage ALL Equation (2) | k Equation (3) |
|---|---|---|---|
| 1 | 0.764 | 0.424 | 0.286 |
| 2 | 0.767 | 0.428 | 0.285 |
| 3 | 0.770 | – | 0.283 |
| 4 | 0.772 | – | 0.281 |
| 5 | 0.775 | – | 0.280 |
| 6 | 0.776 | – | 0.280 |
| 7 | 0.775 | – | 0.283 |
| 8 | 0.769 | – | 0.290 |
| 9 | 0.738 | – | 0.306 |
| 10 | – | – | 0.340 |
Publisher’s Note: MDPI stays neutral with regard to jurisdictional claims in published maps and institutional affiliations. |
© 2021 by the authors. Licensee MDPI, Basel, Switzerland. This article is an open access article distributed under the terms and conditions of the Creative Commons Attribution (CC BY) license (http://creativecommons.org/licenses/by/4.0/).
Share and Cite
Castellano, G.; León, A.; Torrens, F. Classification of Congeneric and QSAR of Homologous Antileukemic S–Alkylcysteine Ketones. Molecules 2021, 26, 235. https://doi.org/10.3390/molecules26010235
Castellano G, León A, Torrens F. Classification of Congeneric and QSAR of Homologous Antileukemic S–Alkylcysteine Ketones. Molecules. 2021; 26(1):235. https://doi.org/10.3390/molecules26010235
Chicago/Turabian StyleCastellano, Gloria, Adela León, and Francisco Torrens. 2021. "Classification of Congeneric and QSAR of Homologous Antileukemic S–Alkylcysteine Ketones" Molecules 26, no. 1: 235. https://doi.org/10.3390/molecules26010235
APA StyleCastellano, G., León, A., & Torrens, F. (2021). Classification of Congeneric and QSAR of Homologous Antileukemic S–Alkylcysteine Ketones. Molecules, 26(1), 235. https://doi.org/10.3390/molecules26010235