Article

Computer-Driven Development of an in Silico Tool for Finding Selective Histone Deacetylase 1 Inhibitors

1
Bioinformatics Research Center, School of Pharmacy and Pharmaceutical Sciences, Isfahan University of Medical Sciences, Isfahan 81746-73461, Iran
2
Department of Biotechnology, Chemistry and Pharmacy, DoE Department of Excellence 2018–2022, University of Siena, via Aldo Moro 2, 53100 Siena, Italy
3
Department of Pharmacy, University of Pisa, via Bonanno 6, 56126 Pisa, Italy
*
Authors to whom correspondence should be addressed.
Present address: Wellcome Centre for Anti-Infectives Research, Drug Discovery Unit, Division of Biological Chemistry and Drug Discovery, University of Dundee, Dundee DD1 5EH, UK.
Molecules 2020, 25(8), 1952; https://doi.org/10.3390/molecules25081952
Submission received: 5 April 2020 / Revised: 18 April 2020 / Accepted: 20 April 2020 / Published: 22 April 2020

Abstract

:
Histone deacetylases (HDACs) are a class of epigenetic modulators overexpressed in numerous types of cancers. Consequently, HDAC inhibitors (HDACIs) have emerged as promising antineoplastic agents. Unfortunately, the most developed HDACIs suffer from poor selectivity towards a specific isoform, limiting their clinical applicability. Among the isoforms, HDAC1 represents a crucial target for designing selective HDACIs, being aberrantly expressed in several malignancies. Accordingly, the development of a predictive in silico tool employing a large set of HDACIs (aminophenylbenzamide derivatives) is herein presented for the first time. Software Phase was used to derive a 3D-QSAR model, employing as alignment rule a common-features pharmacophore built on 20 highly active/selective HDAC1 inhibitors. The 3D-QSAR model was generated using 370 benzamide-based HDACIs, which yielded an excellent correlation coefficient value (R2 = 0.958) and a satisfactory predictive power (Q2 = 0.822; Q2F3 = 0.894). The model was validated (r2ext_ts = 0.794) using an external test set (113 compounds not used for generating the model), and by employing a decoys set and the receiver-operating characteristic (ROC) curve analysis, evaluating the Güner–Henry score (GH) and the enrichment factor (EF). The results confirmed a satisfactory predictive power of the 3D-QSAR model. This latter represents a useful filtering tool for screening large chemical databases, finding novel derivatives with improved HDAC1 inhibitory activity.

Graphical Abstract

1. Introduction

Epigenetic defects in gene expression are well known in the onset and progression of cancer. In this context, pharmacological targeting of proteins of the cellular epigenetic machinery has provided opportunities for anti-cancer drug design [1,2]. Among epigenetic enzymes, histone deacetylases (HDACs) hold a fundamental role in regulating gene expression through histone post-translational modifications [3,4,5].
HDACs catalyze the removal of acetyl groups from the acetylated ε-amino termini of lysine residues located at the tails of the nucleosomal histones core. Histone deacetylation process leads to condensed chromatin structure which concomitantly restricts the accessibility of related transcriptional factors to their target genes, thereby suppressing gene expression including tumor suppressor genes [6,7,8]. The abnormal regulation of this process culminates with the high expression level of HDACs. This event has been observed in the development of several human cancers. Consequently, effective inhibition of HDACs has recently gained importance as a valid therapeutic strategy to reverse aberrant epigenetic changes associated with cancer [9,10,11]. HDAC inhibitors (HDACIs) induce histone hyperacetylation and subsequent transcriptional re-activation of suppressed genes which are correlated with a variety of effects on tumor cells including apoptosis, differentiation, cell cycle arrest, inhibition of proliferation and cytostasis [12,13].
The HDAC family comprises 18 isoforms in mammalian cells which are categorized into four main classes (class I-IV) based on their structural and functional characteristics. HDACs belonging to class I (HDAC1–3 and 8), II (HDACs 4–7, 9 and 10) and IV (HDAC11) are all zinc-dependent metalloenzymes, while class III HDACs, also known as the sirtuins (SIRT1-7), requires NAD+ as a cofactor for their catalytic function [6,14].
Extensive efforts over recent decades have led to the identification of four chemically diverse classes of HDACIs as potent antineoplastic agents including, hydroxamates, benzamides, cyclic peptides, and short-chain fatty acids [3]. The main breakthrough in developing these inhibitors was achieved by the US FDA approval of Vorinostat [15], Belinostat [16], Panobinostat (hydroxamate-based inhibitors) [17], Romidepsin (a cyclic peptide) [18] and Chidamide (a benzamide-based inhibitor) [19] for the treatment of lymphoma and myeloma. Moreover, several HDACIs such as Mocetinostat [20], Entinostat [21], Tacedinaline [22], Givinostat [23], and Abexinostat [24] are currently in clinical trials for treating various types of cancers. The structures of several approved and clinical HDACIs are shown in Figure 1.
Despite these successes, the most known HDACIs target multiple HDAC isoforms and this poor selectivity represents a major drawback which limits their broad clinical utility [25,26]. Isoform-selective HDACIs would offer superior therapeutic advantages due to limited off-target and undesirable effects, improved clinical efficacy and better tolerability [27,28]. Moreover, isoform-selective inhibitors would provide chemical tools to delineate the precise roles of individual HDAC isoforms in human diseases, including rare disorders [29]. Therefore, in recent years, identification of highly potent inhibitors with strict selectivity towards a specific isoform have caught more attention in the development of novel HDACIs for the epigenetic therapy [30,31,32,33]. In this context, due to the pivotal role of HDAC1 in the angiogenesis, proliferation, and survival of mammalian carcinoma cells, this isoform is particularly being sought as a preferred target for successful design of selective HDACIs [34,35,36,37,38].
A wide range of hydroxamic acid derivatives are known to be potent pan-inhibitors of several HDAC isoforms [39,40]. Accordingly, in recent years, there has been considerable interest in developing non-hydroxamate HDACIs with satisfactory selectivity towards a specific isoform. In this context, aminophenylbenzamide derivatives represent an important class of non-hydroxamate HDACIs owing to their potent HDAC inhibition along with desirable pharmacokinetic profile and excellent selectivity for HDAC class I enzyme. Furthermore, inhibitors containing an ortho-aminobenzamide typically exhibit relatively greater levels of selectivity for class I HDACs, particularly HDAC1 [35,41]. In addition, hydroxamic-derived inhibitors often suffer from some serious pharmacokinetic issues including poor metabolic stability, rapid clearance, undesirable oral absorption, and short half-life in plasma, whereas benzamides-based inhibitors show better metabolic stability and oral bioavailability [42,43,44,45]. For these solid reasons, renewed efforts are being directed towards the further exploration of innovative aminophenylbenzamide chemotypes as privileged and valuable scaffolds to develop isoform-selective HDACIs [46,47,48].
Recently, in silico techniques, including ligand-based methods such as pharmacophore modeling and three-dimensional quantitative structural activity relationship (3D-QSAR), have efficiently contributed to guide the discovery of novel bioactive molecules, with reduced costs in terms of money and time [49,50,51]. In fact, QSAR methods provide relationships between physicochemical properties of a series of compounds and their biological activities to obtain a reliable statistical model for predicting the activities of new chemical entities. The fundamental principle of the technique is that the change in structural properties determines modifications in biological activities of the compounds. In the classical QSAR approaches, affinities of ligands to their binding sites, inhibition constants, rate constants, and other biological data have been correlated with molecular properties including lipophilicity, polarizability, electronic and steric properties (Hansch analysis) or with structural features (Free-Wilson analysis). However, classical QSAR approach has only a limited utility for designing new molecules due to the lack of consideration of the 3D structure of the selected compounds. Accordingly, 3D-QSAR has emerged as a natural extension to the classical Hansch and Free-Wilson approaches, which exploits the three-dimensional properties of the ligands to predict their biological activities employing robust chemometric techniques such as partial least squares (PLS). The success of these methods can be attributed to several factors including identification of important features for the activity, rationalization of activity trends in molecules under study, prediction of the specific activity for a selected target or undesirable effects of new compounds. On the other hand, ligand-based methods have been used in virtual screening campaigns of chemical databases to find novel hits with improved potency and can be combined with other computational and experimental workflows to discover new potential drugs [52,53,54,55,56,57].
Until now, only limited number of 3D-QSAR studies for hydroxamate set of HDACIs have been reported [58,59,60,61,62,63,64]. However, to the best of our knowledge, no previous attempt has been made to seek the structural and chemical features of aminophenylbenzamide governing their HDAC inhibitory activities employing 3D-QSAR methodology along with a large set of compounds. Given the aforementioned therapeutic significance of this class of inhibitors, we developed and validated a 3D-QSAR model using a comprehensive set of previously reported benzamide derivatives as selective HDAC1 inhibitors. From this perspective, the software Phase, implemented in Maestro, was employed to explore a common-features pharmacophore hypothesis based on highly active ligands. This hypothesis was then used as an alignment rule to derive a predictive 3D-QSAR model [65]. Such an in silico tool could aid not only in forecasting the HDAC1 inhibitory activity of newly designed chemical entities, but also offer a robust foundation for designing new selective HDACIs with increased binding affinities to HDAC1. Accordingly, the developed model could have a relevant implication in drug discovery campaign for searching isoform-selective HDACIs.

2. Results and Discussion

The application of 3D-QSAR methodology in the design of HDACIs has received little attention to date and only a few instances of field-based QSAR models (comparative molecular field analysis (CoMFA) and comparative similarity indices analysis (CoMSIA) methods) have been reported for hydroxamate-based inhibitors [58,59,60,61,62,63,64]. However, this approach has not been carried out for a large set of benzamide-based derivatives behaving as HDACIs. On the other hand, we have recently developed a series of predictive 3D-QSAR models for different purposes including the identification or rational design of new chemical entities for different targets [53,55], and the prediction of undesirable effects of novel molecules such as potential hERG K+ channel related cardiotoxicity [57]. In all these cases, Phase was used to develop a computational tool using a pharmacophore-based alignment that links the information of pivotal functional groups of the ligands with their biological activity [65]. The fruitful results of the above-mentioned molecular modeling studies as well as therapeutic significance of benzamide chemotypes as valuable isoform-selective HDACIs inspired us to derive a pharmacophore-based 3D-QSAR model to be used as a screening filtering tool able to quantitatively predict the HDAC1 inhibitory activity of newly designed ligands.

2.1. Data Set Preparation

A comprehensive data set of 370 diverse HDACIs based on benzamide scaffold with functional biological activity expressed as IC50 (see the Supplementary Materials for further details) with a range of HDAC1 inhibitory activities spanning five orders of magnitude (from 6.0 nM of compound 17 to 50 µM of compound 132, Table S1) were selected from literature for developing a predictive 3D-QSAR model. Subsequently, an extensive conformational search for each ligand was performed employing MacroModel software (see experimental section for further details). Conformational analysis is crucial to enhance both the quality of the alignment for the molecules used to generate the 3D-QSAR model and the reliability of the in silico tool [53,54,55,56,57]. After the exhaustive conformational analysis of the selected ligands (Table S1), the generation of the 3D-QSAR model was started.

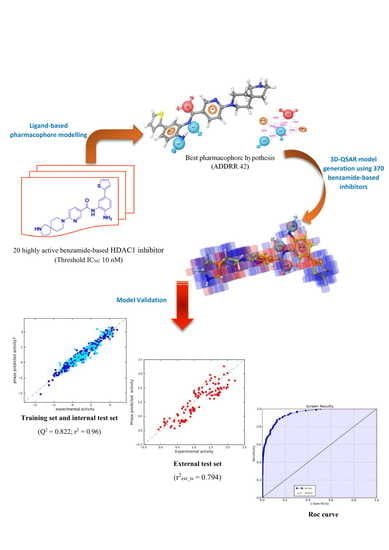
2.2. Pharmacophore Modeling and 3D-QSAR Model Generation

As a first step to develop the 3D-QSAR model, 20 most active compounds with IC50 values ≤ 10 nM included in the data set (ligands 120, Figure 2, Table S1) were considered to find out common pharmacophore hypotheses that were subsequently scored and ranked by the software Phase. This means that the highly active compounds possess common features that are responsible for the activity exploited by a 3D pharmacophore hypothesis. Therefore, a pharmacophore hypothesis provides a rational picture of primary chemical features of ligands responsible for HDAC1 inhibitory activity and therefore can be used as a reliable alignment rule for the 3D-QSAR model development.
To have optimal combination of sites or features shared by the most active ligands, the minimum and maximum number of site points were set on 5. This means that we selected 5 as maximum features to include in the pharmacophore models. Among the 26 common pharmacophore hypotheses generated by the software Phase, only those models which showed superior alignment with the active compounds were identified by calculating the survival score. The survival scoring function of Phase module identifies the best candidate hypothesis from the generated models and offers an overall ranking of all the hypotheses. The scoring algorithm includes contributions from the alignment of site points and vectors, volume overlap, selectivity, number of ligands matched, relative conformational energy, and activity. To identify pharmacophore models with more active and less inactive features, all models were mapped to inactive compounds and scored. If inactives score well, the hypothesis could be invalid because it does not discriminate between actives and inactives. Therefore, adjusted survival score was calculated by subtracting the inactive score from the survival score of these pharmacophores.
After the scoring, the model ADDRR, herein referred to ADDRR hypothesis, with the maximum adjusted survival score (3.769) and lowest relative conformational energy, was selected as the top-ranked hypothesis among the generated 3D model hypotheses. The different scoring parameters for the selected hypothesis (ADDRR) were provided in Table 1. The 3D spatial arrangement of all features with inter-feature distance constraints of ADDRR are presented in Figure 3. As shown in this figure, the hypothesis was characterized by the five main features: one hydrogen-bond acceptor (A), two hydrogen-bond donors (D), and two aromatic rings (R).
Figure 3A depicts one of the most active ligands in the set (compound 13, Table S1), mapped onto the ADDRR pharmacophore. As depicted in the mentioned figure, compound 13 thoroughly fits all features of the pharmacophore model, underlining the previous findings on structural components required for interacting with the HDAC1 binding site [66,67,68]. As illustrated in Figure 3, the carbonyl oxygen of the benzamide group served as a hydrogen-bond acceptor (HBA) feature, while two hydrogen-bond donor (HBD) features were mapped to the protons of the 2-aminophenyl NH2 and amide NH. Furthermore, out of two aromatic features, one was mapped to the phenyl ring of the 2-aminophenyl. The other aromatic feature was mapped to the pyridine ring of the nicotinamide moiety. This hypothesis was well corroborated by accepted common pharmacophore model for HDACIs comprising the zinc binding group (ZBG), a linker and a cap group as established by computational and biophysical studies reported for HDAC1 inhibitors [66,67,68,69,70]. Based on the current study, the aniline groups of the benzamide-based inhibitors are served as ZBG, coordinating the catalytic zinc ion in the HDAC1 active site. Moreover, it is well known that H-bonds formation with key residues of HDAC1 active site are commonly found for the ZBG of this class of HDAC1 inhibitors. In particular, in addition to the zinc ion coordination, protons of the 2-aminophenyl NH2 group could also establish hydrogen bonds with His140 and His141, while the carbonyl oxygen of the benzamide portion could also form another hydrogen binding interaction with hydroxyl group of Tyr303. It has been reported that NH of amide could offer the appropriate HBD vector to address the Gly149 through H-bond formation. The presence of two aromatic features capable of participating in π-π stacking interactions with hydrophobic residues Phe150, Tyr204, Phe205, and Tyr303, represents another important requisite for further stabilization of ligand binding. These residues were located in a long and narrow hydrophobic tube-like channel and thus interaction with them allow tubular access of ligand into active site [66,67,69,70]. Accordingly, the above-mentioned ADDRR hypothesis imparts the key features of ligand for providing the relevant interactions with the HDAC1 active site.
The ADDRR pharmacophore hypothesis was then employed as alignment rule to derive the 3D-QSAR model. In this step, the compounds were randomly divided into training (70%) and test sets (30%) taking into account that the response range was well-covered in both sets (Table S1). This choice was made to warrant the inclusion of the positive information originating from 70% of the compounds enclosed in the training set (corresponding to 259 compounds), for the development of the computational tool. Moreover, the compounds kept in the test set (30%, 111 compounds) ensures an appropriate assessment of the predictive power of the generated model through an exhaustive internal validation. The atom-based version of Phase’s 3D-QSAR workflow was preferred to the pharmacophore-based one. Such a choice allowed us to take into account contributions associated with all the important structural features other than pharmacophore for HDAC1 inhibitory activity such as the steric clashes. To enhance the model accuracy and evade overfitting phenomenon, models containing one up to seven factors were generated for the studied data set. Statistical parameters for each model are provided in Table 2. Model featuring seven factors was preferred and selected because it better performed in comparison with other models. The reliability of the selected model is justified by the fact that all statistical parameters were in acceptable range. In this regard, the correlation and cross-validated correlation coefficients (R2 = 0.958 and Q2 = 0.822, respectively) of the selected model along with the Pearson R-value (R-Pearson = 0.915) were extremely satisfactory, indicating a close correspondence between estimated and experimental IC50 values. Moreover, the high Fisher ratio (F = 822.1) suggested a statistically significant regression model, which was further supported by the small value of the variance ratio (P = 4.377 × 10−169), an indication of a high degree of confidence. Finally, the small values of the standard deviation and the root-mean-square error (SD: 0.178 and RMSE: 0.281, respectively) also provided indication about the robustness of the developed computational model. Moreover, the Q2F3 value clearly indicates that the 3D-QSAR model with seven factors is robust.
A scatter plot of experimental versus predicted activities was generated to assess the results (Figure 4). Based on this plot, the IC50 values were reliably predicted for both training and test set molecules (Table S1). This plot along with the aforementioned statistical features clearly imply the significance of the approach and indicate a QSAR model with a robust predictive power.
Three-dimensional aspects obtained from the QSAR model were visualized using 3D plots of the crucial volume elements occupied by ligands. Such plots allow the visual analysis of important features of ligand structures along with their contributions to the biological activity. The 3D plot representation of the whole model, superimposed to the highly (3, 10, and 13), moderate (22, 213, and 239), and less active derivatives (218, 279, and 299), is depicted in Figure 5. In this illustration, the blue and red cubes indicate the positive and negative coefficients, respectively. In fact, blue cubes refer to ligand regions in which the specific feature is important for better activity, whereas the red cubes are indicative of a particular structural feature or functional group which is not essential for the activity or is likely to decrease the activity. Cubes with small positive and negative coefficients, which therefore did not greatly affect the activity, were filtered out by setting a 1.50 × 10⁻² coefficient threshold. Remarkably, compounds 10 and 13 (Figure 5A,B, respectively) as well as other highly active ligands, mainly lodge in the blue regions, while the less active compounds such as 218 and 299 (Figure 5G,I, respectively) largely resides on the red regions. Moreover, regarding some compounds with moderate activity and generally all compounds with limited activity, we also observed a significant inability to match all the pharmacophore features, according to the decrease of inhibitory potencies.

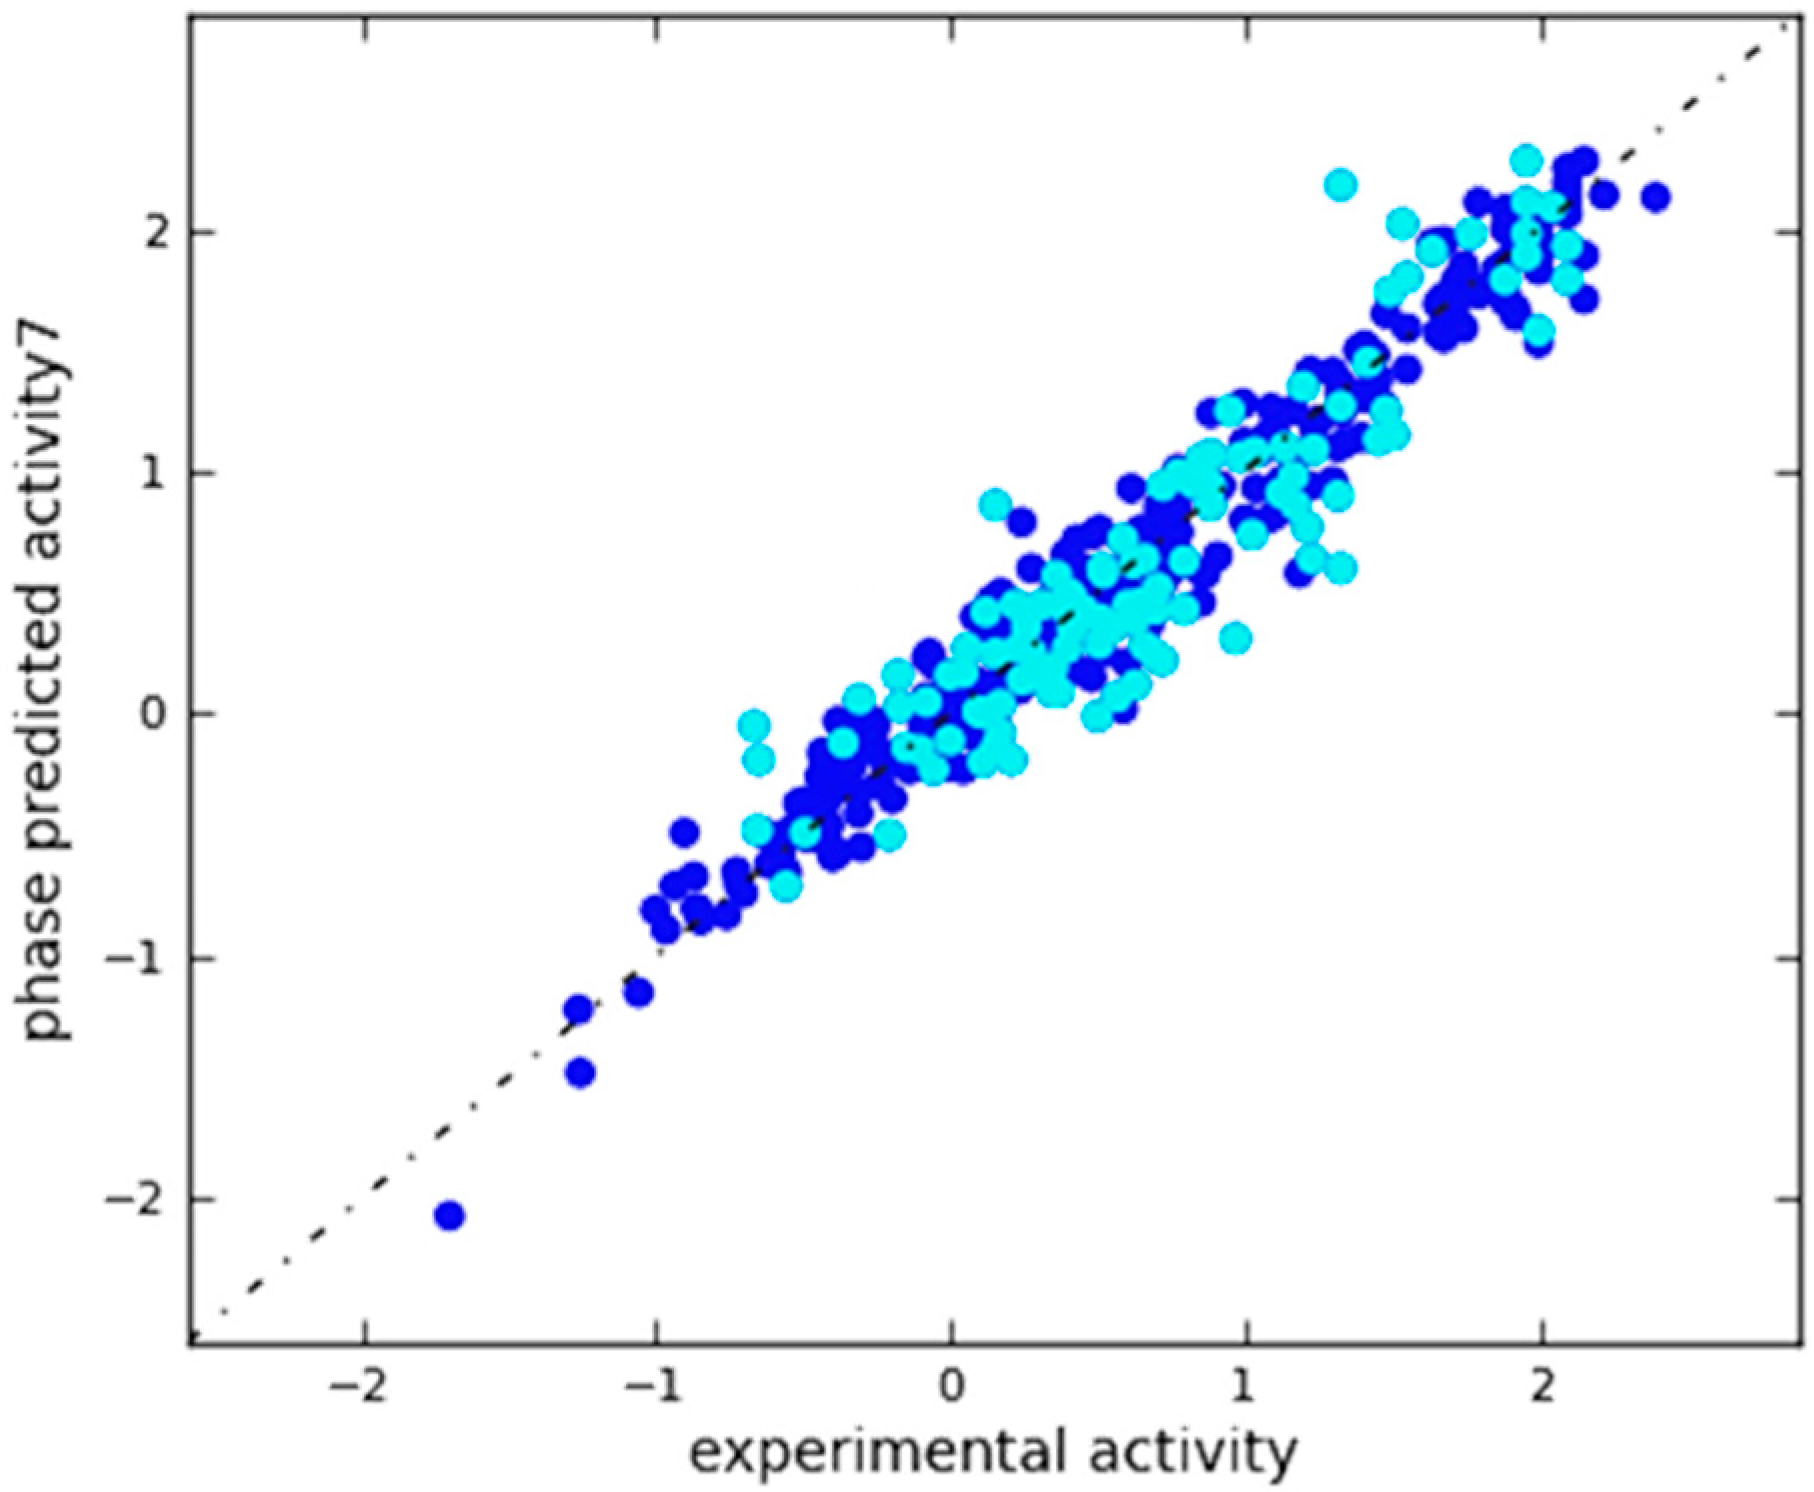
2.3. In Silico 3D-QSAR Model Validation

2.3.1. Validation Using External Test Set

After the generation of the 3D-QSAR model, a preliminary in silico validation was performed using an external test set selected from the literature that have not been used for generating the computational model. This set was composed of 113 compounds with different inhibitory activities against HDAC1 (ranging from 5.8 nM to 1140 nM; Table S2 in the Supplementary Materials). As reported in Table S2, our model was satisfactorily efficient in estimating the HDAC1 inhibitory activity of compounds included in the external test set. In the scatter plot depicted in Figure 6, the experimental and predicted pIC50 values of these compounds are also displayed, offering a reasonable correlation coefficient (r2ext_ts = 0.794). This result provided further confirmation that the correlation shown by the model is not accidental.

2.3.2. Validation Using Decoy Set and Receiver-Operating Characteristic (ROC) Curve Approach

For a further validation and to assess the performance of the developed 3D-QSAR model, we employed a validation method based on generation of decoys set. This procedure is usually employed to evaluate the capability of in silico tools such as 3D-QSAR models to discriminate between active or inactive molecules [71,72,73,74,75]. Starting from highly active compounds (ligands 1–20 in Table S1), 86 additional compounds with good activity against HDAC1 (cutoff IC50 < 35 nM; Tables S1 and S2) were selected from the training, test and external validation sets for a total of 106 compounds (Table S3) from which decoys were generated. For this set of active ligands, DUD-E server generated 5764 decoys. After an appropriate minimization and conformational search of decoys, we have combined them with the active molecules (referred as A in Figure 7A) for a total of 5870 compounds (referred as D in Figure 7A) that were then subjected to a virtual screening using the developed 3D-QSAR model. Interestingly, the results of this evaluation supported the validity of the proposed model. Analysis of the database screening results (Figure 7A) indicated a trend in which inactive compounds fail to completely satisfy all the pharmacophore features, thus making their predicted activity very poor or absent. In contrast, the 3D-QSAR model was reasonably efficient in the estimation of HDAC1 inhibitory activity of active compounds.
According to the screening results (Figure 7A), the top 30 ranked compounds were considered to be hits (Ht). This cutoff value could represent a suitable number of molecules (about 1% of database) to be purchased after a virtual screening campaign. Remarkably, among Ht, 26 (Ha) compounds belonged to the set of 106 known HDAC1 inhibitors. Furthermore, this qualitative analysis was well supported by the calculation of some statistical parameters such as EF and GH score (see Materials and Methods section for calculation details). In this regard, the calculated EF was 48.33, which implies that it could be about 48.33 times more probable to select active compounds from the hit list compared with random selection from the complete database. The estimated GH score value of 0.71, larger than 0.5, indicates a great reliability of the model (Figure 7A). This suggests that the developed computational model can serve as efficient tool in virtual screening studies to find out novel chemical entities behaving as selective HDAC1 inhibitors.
The applicability of the proposed 3D-QSAR model was further evaluated by means of the receiver-operating characteristic (ROC) curve. The ROC curve approach is a well-recognized metric used as an objective way to assess the balance between model sensitivity (capability to discover true positives) and specificity (capability to avoid false positives) [55,57,76,77]. For this purpose, 5870 compounds employed in the previous validation step, were ranked according to their predicted activity values as estimated by the 3D-QSAR model. The output of the ROC curve provided a score for appraising the overall performance of the model. In particular, the closer the ROC score is to 1.0, the better is the model at discriminating active from inactive compounds. ROC curve analysis of our in silico model yielded a satisfactory Area Under the Curve (AUC) score of 0.94 (Figure 7B), providing additional evidence about the predictivity of the developed 3D-QSAR model.

3. Materials and Methods

3.1. Hardware and Software Specifications

All computational tasks in this study were carried out using molecular modeling package from Schrödinger suite 2015 (Schrödinger, Inc., LLC, New York, NY, USA) installed on an Intel(R) Xeon(R) CPU E5-2620 v2 @ 3.30 GHz, 64 GB RAM with 12 processors, and a 2GB graphics card of NVIDIA Quadro K2200 running Ubuntu 10.04 LTS (long-term support) as operating system. Access to the Schrödinger modules as well as the capability to organize and analyze data was provided by Maestro as a portal interface of Schrödinger [78].

3.2. Ligands and Data Set Preparation

A comprehensive set of HDAC1 inhibitors characterized by the 2-aminophenylbenzamide scaffold with known IC50 values that vary over a wide range was collected from the literature [66,67,79,80,81,82,83,84,85,86,87,88,89,90,91,92] and the bindingDB database [93]. The selection criterion for the compounds to be included in the set was that their HDAC1 inhibition was evaluated using the same fluorescent assay based on the fluorogenic substrate Fluor-de-Lys. This inclusion criterion allowed us to obtain a homogeneous set of compounds regarding their biological evaluation. This step is crucial to develop a predictive model since the data selection is pivotal for adding the correct information to a software for developing computational models. The 3D structures of all ligands were built using the builder panel in the Maestro. For the molecules possessing known stereochemistry, the absolute configuration was specified during the drawing of the compounds. All structures were treated by LigPrep module of Schrödinger suite 2015 [94] in order to generate the most probable ionization state at the cellular pH value (7.4 ± 0.2) as reported by us [95,96,97]. Moreover, the OPLS-AA_2005 force field was used for optimization, which produces the lowest energy conformer of the ligand [98]. The prepared ligands were then submitted to MacroModel software [99] in order to obtain an exhaustive conformational analysis using the OPLS-AA_2005 as force field. The solvent effects are simulated employing the analytical Generalized-Born/Surface-Area (GB/SA) model [100], and no cutoff for non-bonded interactions was selected. Molecular energy minimizations were performed using Polak–Ribiere conjugate gradient (PRCG) method with 2000 maximum iterations and 0.001 gradient convergence threshold. The conformational searches were carried out by employing MCMM (Monte Carlo Multiple Minimum) torsional sampling method. Automatic setup with 21 kJ/mol (5.02 kcal/mol) in the energy window for saving structure and a 0.5 Å cutoff distance for redundant conformers was used.

3.3. 3D-QSAR Model Generation

The software package Phase 4.2 [101], implemented in Maestro suite, was used to generate pharmacophore hypotheses and 3D-QSAR models for HDAC1 inhibitors based on 2-aminophenylbenzamide scaffold. Given a set of molecules with high affinity for a particular protein target, this software uses fine-grained conformational sampling and a range of scoring techniques to identify a common-features pharmacophore hypothesis, which conveys 3D structural characteristics that are critical for the activity. Pharmacophore feature sites for the molecules were specified by a set of features well-defined in Phase as hydrogen-bond acceptor (A), hydrogen-bond donor (D), hydrophobic group (H), negatively charged group (N), positively charged group (P) and aromatic ring (R). No user-defined feature was employed for the present study. The ligands prepared as reported in the previous step, were imported into the “develop common pharmacophore hypotheses” panel of Phase with their respective biological activity values. Twenty active compounds (Figure 2 and in Table S1 in the Supplementary Materials) possessing highly inhibitory potency against HDAC1 were selected for generating the pharmacophore hypotheses. Common-features pharmacophore hypotheses were identified, scored, and ranked by means of conformational analysis and tree-based partitioning techniques. In the score hypotheses step, common pharmacophores are examined, and a scoring procedure is applied to identify the pharmacophore from each surviving n-dimensional box that yields the best alignment of the active set ligands. This pharmacophore provides the means to explain how the active molecules bind to the receptor.
The best ranked pharmacophore model obtained by Phase (ADDRR, shown in Figure 3A superimposed to aminophenylnicotinamide analogue 13), consisted of five features: one hydrogen-bond acceptor (A), two hydrogen-bond donors (D), and two aromatic functions (R). The inter-feature distances (Figure 3B) were measured by using the site measurements tool implemented in the software Phase. This pharmacophore was used as alignment rule for further 3D-QSAR analysis. All the molecules used for the QSAR studies (Table S1) were aligned to the selected pharmacophore hypothesis. In the present study, we set a pIC50 threshold for the selection of active and inactive ligands. These pIC50 values were also used as the dependent variable in the 3D-QSAR calculations. In particular, compounds that showed an IC50 comprised between 5 and 50 µM were considered to be inactive ligands. Moderate inhibitors were considered compounds with IC50 between 10 nM and 5 µM, while compounds possessing an IC50 ≤ 10 nM were assigned as potent inhibitors of HDAC1 and consequently as actives during 3D-QSAR model generation. Remarkably, to avoid possible faults arising from the inclusion in the set of molecules with uncertain activity, only molecules with experimentally definite inhibitory activity have been selected to develop the in silico model. Atom-based QSAR models were developed for ADDRR hypothesis using 259 compounds in the training set (370 compounds were randomly divided 70% in the training and 30% in the test set) and a grid spacing of 0.5 Å. QSAR models were generated by means of PLS method. An internal validation was achieved employing leave-n-out (LnO) technique as specified in Phase user manual (Phase, version 4.2, User Manual, Schrödinger press, LLC, New York, NY, 2015). As reported by Todeschini et al. the internal validation results generally expressed in terms of Q2 metrics should be amended introducing Q2F3 metrics for the internal validation of the QSAR models [102]. For this purpose, we calculated these metrics (Table 2) employing the formula reported below (Equation (1)).
Q F 3 2 = 1 i = 1 n O U T ( y i y ^ i / i ) 2 / n O U T i = 1 n T R ( y i y ¯ T R ) 2 / n T R  
where yi is the experimental response of the ith object, ŷi/i is the predicted response when the ith object is not in the training set, nTR and nOUT are the number of training and prediction objects, respectively, and ȳTR is the average value of the training set experimental responses. Moreover, to avoid overfitting/underfitting phenomena, we considered 7 factors that is an appropriate for the number of selected compounds. In fact, although there is no limit on the maximum number of factors, but as a general rule, we stopped adding factors when the standard deviation of regression is approximately equal to the experimental error (calculated as median error among the selected compounds).

3.4. In Silico 3D-QSAR Model Validation

After the generation of the 3D-QSAR model, a preliminary in silico validation was performed using a large external test set of compounds (113 molecules) selected from the literature [83,84,89,103,104,105,106] (Table S2 in the Supplementary Materials) that have not been used for generating and cross validating the model. These compounds were prepared by using Maestro, LigPrep, and MacroModel, adopting the same procedure for preparing the molecules used to derive the model. Moreover, to further assess that the chosen model with 7 factors better performs with respect to the other Phase-derived models, we applied the validation method employing the external test set to all the generated QSAR models (Table 2). This workflow established that the model with 7 factors is the best performing model of the series in predicting the activity of the external test set with a correlation coefficient r2ext_ts = 0.794 (Figure 6) (LVs 1, r2ext_ts = 0.421; LVs 2, r2ext_ts = 0.698; LVs 3, r2ext_ts = 0.657; LVs 4, r2ext_ts = 0.712; LVs 5, r2ext_ts = 0.735; LVs 6, r2ext_ts = 0.787; Figures S1–S6, respectively).
Further validation of the model was done by enrichment study using decoy test [107]. For this purpose, the Enhanced (DUD-E) web server [108] was employed to generate a set of useful decoys generated from a collection of 106 active compounds from three sources: 1) active compounds used to develop the pharmacophore model, 2) other compounds with good activity against HDAC1 used in 3D-QSAR studies and 3) the most active compounds of the external test set. This collection consisted of 106 active compounds with IC50 ≤ 35 nM (Table S3). For this set of active ligands, the DUD-E server provided 5764 inactive ligands (redundant structures in the output files were deleted) from a subset of the ZINC database filtered using the Lipinski’s rules for drug-likeness, for a total of 5870 compounds (5764 inactives plus 106 actives). Each of these inactive decoys was selected to bear a resemblance to the physicochemical properties of the reference ligand but differ from it in terms of 2D structure (e.g., large difference of Tanimoto coefficient between decoys and active molecules). Although largely used, the approach based on decoys sets presents some limitations (i.e., the decoy sets often span a small, synthetically feasible subset of molecular space and are restricted in physicochemical similarity compared with actives). After the generation, the decoys sets were downloaded as 126 smiles files and imported into Maestro and submitted to LigPrep application to properly convert smiles into 3D structures as well as for removing potential erroneous structures. Subsequently, to perform a minimization and a conformational search of the obtained structures MacroModel program was employed (same parameters for ligands preparation were applied). A single file containing conformers of active molecules and decoys was created and submitted to Phase software for predicting the inhibitory activity of database against HDAC1 using the developed 3D-QSAR model and employing “search for matches” option. After decoys generation and activity evaluation, the Güner–Henry score, i.e., goodness of hit list (GH) and enrichment factor (EF) values were estimated by Equations (2) and (3), respectively.
E F = H a / H t ( A / D )  
G H = { H a ( 3 A + H t ) 4 H t A } [ 1 ( H t H a ) ( D A ) ]
where Ht represents the total number of compounds in the hit list found by virtual screening, Ha is the total actives found by virtual screening considering the top 30-ranked position (positions comprise within the cutoff value). The total number of compounds (Ht) might represent the number of molecules to purchase after a virtual screening protocol and almost the 1% of the considered database (D). A represents the total of the active derivatives enclosed in the database, and D stands for the total number of molecules existing in the set. The range of GH score varies from 0 to 1. The GH score 0 means a null model, while the GH score 1 denotes generation of an ideal model. Moreover, the % yield of actives (% YA) and % ratio of actives (% RA) were evaluated by Equations (4) and (5), respectively.
% Y A = [ ( H a H t ) 100 ]  
% R A = [ ( H a A ) 100 ]  
Moreover, to assess the predictive power of the 3D-QSAR model, a ROC was employed through an Enrichment Calculator (enrichment.py) script [55,56,57,76]. The mentioned script calculates the enrichment metrics, including area under the receiver-operating characteristic curve (AUC), from virtual screening by means of the output structure file and a list of known active molecules. The output of the screening protocol, using active molecules and decoys, consisted of a list of molecules ranked by the predicted activity from the top-predicted molecules as estimated by the 3D-QSAR model. These ranking data along with a list file of active molecules were submitted to the enrichment.py application.

4. Conclusions

The present study describes the generation of a ligand-based pharmacophore model (ADDRR) for a subset of 20 highly active aminophenylbenzamide derivatives reported as selective HDAC1 inhibitors by employing the software Phase implemented in the Schrödinger molecular modeling suite. With the aid of pharmacophore-based alignment rule, a meaningful 3D-QSAR model was derived and validated employing of the QSAR models a large set of benzamide-based HDAC1 inhibitors (training set, test set, and an external test set for a total of 483 molecules) by using PLS analysis. The main objective of this approach was to develop an in-house computational tool for the prediction of HDAC1 inhibitory activity during the design of innovative aminophenylbenzamide chemotypes as privileged therapeutic scaffold in the isoform-selective HDACIs research. The validation outcomes confirmed that the proposed 3D-QSAR model is endowed with satisfactory predictive power taking into account favorable structural requirements responsible for HDAC1 inhibitory activity. This aspect has been computationally investigated since the selectivity is implicit in the template molecules; however prospective validation is needed to exploit the performance of the model. In fact, the developed 3D-QSAR model can be used for rationally designing novel and selective HDACIs. Moreover, based on the computational investigation, the developed model possesses a rationale for virtual screening campaign, with huge potential in isoform-selective HDACIs drug discovery, and it can effectively provide a set of guidelines for the design and optimization of novel derivatives with greater activity towards HDAC1.

Supplementary Materials

The following are available online, Table S1: Experimental (Observed column) and predicted (Predicted column) activity pIC50 for compounds used for developing the 3D-QSAR model., Table S2: Experimental (Observed column) and predicted (Predicted column) activity pIC50 for compounds included in the external test set, Table S3: Active compounds used for generating a decoys set, Figures S1–S6: Scatter plots for all the model generated by Phase.

Author Contributions

Conceptualization, H.S. and S.B.; methodology, H.S., G.C. (Giulia Chemi) and S.B.; software, H.S., G.C. (Giulia Chemi) and S.B.; validation, H.S., G.C. (Giulia Chemi) and S.B.; formal analysis, H.S., G.C. (Giulia Chemi), G.C. (Giuseppe Campiani), V.C. and S.B.; investigation, H.S., G.C. (Giulia Chemi); data curation, H.S., G.C. (Giulia Chemi), G.C. (Giuseppe Campiani), V.C. and S.B.; writing—original draft preparation, H.S. and S.B.; writing—review and editing, H.S., G.C. (Giulia Chemi), S.B., G.C. (Giuseppe Campiani), V.C.; supervision, S.B. All authors have read and agreed to the published version of the manuscript.

Funding

This research was funded by the Bioinformatics Research Center in Isfahan University of Medical Sciences (Iran) grant number 298137 to H.S.

Acknowledgments

The authors thank Lorenzo Chemi for the technical assistance during the calculation of Q2F3.

Conflicts of Interest

The authors declare no conflict of interest.

References

  1. Conway, S.J.; Woster, P.M.; Greenlee, W.J.; Georg, G.; Wang, S. Epigenetics: Novel Therapeutics Targeting Epigenetics. J. Med. Chem. 2016, 59, 1247–1248. [Google Scholar] [CrossRef]
  2. Yoo, C.B.; Jones, P.A. Epigenetic therapy of cancer: Past, present and future. Nat. Rev. Drug Discov. 2006, 5, 37–50. [Google Scholar] [CrossRef]
  3. Bertrand, P. Inside HDAC with HDAC inhibitors. Eur. J. Med. Chem. 2010, 45, 2095–2116. [Google Scholar] [CrossRef]
  4. Falkenberg, K.J.; Johnstone, R.W. Histone deacetylases and their inhibitors in cancer, neurological diseases and immune disorders. Nat. Rev. Drug Discov. 2014, 13, 673–691. [Google Scholar] [CrossRef]
  5. Paris, M.; Porcelloni, M.; Binaschi, M.; Fattori, D. Histone deacetylase inhibitors: From bench to clinic. J. Med. Chem 2008, 51, 1505–1529. [Google Scholar] [CrossRef]
  6. de Ruijter, A.J.; van Gennip, A.H.; Caron, H.N.; Kemp, S.; van Kuilenburg, A.B. Histone deacetylases (HDACs): Characterization of the classical HDAC family. Biochem. J. 2003, 370, 737–749. [Google Scholar] [CrossRef]
  7. Kouzarides, T. Chromatin modifications and their function. Cell 2007, 128, 693–705. [Google Scholar] [CrossRef] [Green Version]
  8. Rodriquez, M.; Aquino, M.; Bruno, I.; De Martino, G.; Taddei, M.; Gomez-Paloma, L. Chemistry and biology of chromatin remodeling agents: State of art and future perspectives of HDAC inhibitors. Curr. Med. Chem. 2006, 13, 1119–1139. [Google Scholar] [CrossRef]
  9. Bolden, J.E.; Peart, M.J.; Johnstone, R.W. Anticancer activities of histone deacetylase inhibitors. Nat. Rev. Drug Discov. 2006, 5, 769–784. [Google Scholar] [CrossRef]
  10. Marks, P.A.; Dokmanovic, M. Histone deacetylase inhibitors: Discovery and development as anticancer agents. Expert Opin. Investig. Drugs 2005, 14, 1497–1511. [Google Scholar] [CrossRef]
  11. Minucci, S.; Pelicci, P.G. Histone deacetylase inhibitors and the promise of epigenetic (and more) treatments for cancer. Nat. Rev. Cancer 2006, 6, 38–51. [Google Scholar] [CrossRef] [Green Version]
  12. Brittain, D.; Weinmann, H.; Ottow, E. Recent Advances in the Medicinal Chemistry of Histone Deacetylase Inhibitors. Annu. Rep. Med. Chem. 2007, 42, 337–348. [Google Scholar] [CrossRef]
  13. Miller, T.A. Patent status of histone deacetylase inhibitors. Expert Opin. Ther. Pat. 2005, 14, 791–804. [Google Scholar] [CrossRef]
  14. Gregoretti, I.; Lee, Y.-M.; Goodson, H.V. Molecular Evolution of the Histone Deacetylase Family: Functional Implications of Phylogenetic Analysis. J. Mol. Biol. 2004, 338, 17–31. [Google Scholar] [CrossRef]
  15. Duvic, M.; Talpur, R.; Ni, X.; Zhang, C.; Hazarika, P.; Kelly, C.; Chiao, J.H.; Reilly, J.F.; Ricker, J.L.; Richon, V.M.; et al. Phase 2 trial of oral vorinostat (suberoylanilide hydroxamic acid, SAHA) for refractory cutaneous T-cell lymphoma (CTCL). Blood 2006, 109, 31–39. [Google Scholar] [CrossRef]
  16. Lee, H.Z.; Kwitkowski, V.E.; Del Valle, P.L.; Ricci, M.S.; Saber, H.; Habtemariam, B.A.; Bullock, J.; Bloomquist, E.; Li Shen, Y.; Chen, X.H.; et al. FDA Approval: Belinostat for the Treatment of Patients with Relapsed or Refractory Peripheral T-cell Lymphoma. Clin. Cancer Res. 2015, 21, 2666–2670. [Google Scholar] [CrossRef] [Green Version]
  17. Garnock-Jones, K.P. Panobinostat: First Global Approval. Drugs 2015, 75, 695–704. [Google Scholar] [CrossRef]
  18. VanderMolen, K.M.; McCulloch, W.; Pearce, C.J.; Oberlies, N.H. Romidepsin (Istodax, NSC 630176, FR901228, FK228, depsipeptide): A natural product recently approved for cutaneous T-cell lymphoma. J. Antibiot. 2011, 64, 525–531. [Google Scholar] [CrossRef]
  19. Qiao, Z.; Ren, S.; Li, W.; Wang, X.; He, M.; Guo, Y.; Sun, L.; He, Y.; Ge, Y.; Yu, Q. Chidamide, a novel histone deacetylase inhibitor, synergistically enhances gemcitabine cytotoxicity in pancreatic cancer cells. Biochem. Biophys. Res. Commun. 2013, 434, 95–101. [Google Scholar] [CrossRef]
  20. Garcia-Manero, G.; Assouline, S.; Cortes, J.; Estrov, Z.; Kantarjian, H.; Yang, H.; Newsome, W.M.; Miller, W.H.; Rousseau, C.; Kalita, A.; et al. Phase 1 study of the oral isotype specific histone deacetylase inhibitor MGCD0103 in leukemia. Blood 2008, 112, 981–989. [Google Scholar] [CrossRef] [Green Version]
  21. Knipstein, J.; Gore, L. Entinostat for treatment of solid tumors and hematologic malignancies. Expert Opin. Investig. Drugs 2011, 20, 1455–1467. [Google Scholar] [CrossRef]
  22. Gediya, L.K.; Belosay, A.; Khandelwal, A.; Purushottamachar, P.; Njar, V.C.O. Improved synthesis of histone deacetylase inhibitors (HDIs) (MS-275 and CI-994) and inhibitory effects of HDIs alone or in combination with RAMBAs or retinoids on growth of human LNCaP prostate cancer cells and tumor xenografts. Bioorg. Med. Chem. 2008, 16, 3352–3360. [Google Scholar] [CrossRef] [PubMed] [Green Version]
  23. Finazzi, G.; Vannucchi, A.M.; Martinelli, V.; Ruggeri, M.; Nobile, F.; Specchia, G.; Pogliani, E.M.; Olimpieri, O.M.; Fioritoni, G.; Musolino, C.; et al. A phase II study of Givinostat in combination with hydroxycarbamide in patients with polycythaemia vera unresponsive to hydroxycarbamide monotherapy. Br. J. Haematol. 2013, 161, 688–694. [Google Scholar] [CrossRef] [PubMed]
  24. Evens, A.M.; Balasubramanian, S.; Vose, J.M.; Harb, W.; Gordon, L.I.; Langdon, R.; Sprague, J.; Sirisawad, M.; Mani, C.; Yue, J.; et al. A Phase I/II Multicenter, Open-Label Study of the Oral Histone Deacetylase Inhibitor Abexinostat in Relapsed/Refractory Lymphoma. Clin. Cancer Res. 2015, 22, 1059–1066. [Google Scholar] [CrossRef] [Green Version]
  25. Bruserud, O.; Stapnes, C.; Ersvær, E.; Gjertsen, B.; Ryningen, A. Histone Deacetylase Inhibitors in Cancer Treatment: A Review of the Clinical Toxicity and the Modulation of Gene Expression in Cancer Cells. Curr. Pharm. Biotechnol. 2007, 8, 388–400. [Google Scholar] [CrossRef]
  26. Subramanian, S.; Bates, S.E.; Wright, J.J.; Espinoza-Delgado, I.; Piekarz, R.L. Clinical Toxicities of Histone Deacetylase Inhibitors. Pharmaceuticals 2010, 3, 2751–2767. [Google Scholar] [CrossRef] [Green Version]
  27. Karagiannis, T.C.; El-Osta, A. Will broad-spectrum histone deacetylase inhibitors be superseded by more specific compounds? Leukemia 2006, 21, 61–65. [Google Scholar] [CrossRef]
  28. Roche, J.; Bertrand, P. Inside HDACs with more selective HDAC inhibitors. Eur. J. Med. Chem. 2016, 121, 451–483. [Google Scholar] [CrossRef]
  29. Brindisi, M.; Saraswati, A.P.; Brogi, S.; Gemma, S.; Butini, S.; Campiani, G. Old but Gold: Tracking the New Guise of Histone Deacetylase 6 (HDAC6) Enzyme as a Biomarker and Therapeutic Target in Rare Diseases. J. Med. Chem. 2020, 63, 23–39. [Google Scholar] [CrossRef]
  30. Bieliauskas, A.V.; Pflum, M.K.H. Isoform-selective histone deacetylase inhibitors. Chem. Soc. Rev. 2008, 37, 1402. [Google Scholar] [CrossRef]
  31. Guha, M. HDAC inhibitors still need a home run, despite recent approval. Nat. Rev. Drug Discov. 2015, 14, 225–226. [Google Scholar] [CrossRef] [PubMed]
  32. Ononye, S.N.; van Heyst, M.; Falcone, E.M.; Anderson, A.C.; Wright, D.L. Toward isozyme-selective inhibitors of histone deacetylase as therapeutic agents for the treatment of cancer. Pharm. Pat. Anal. 2012, 1, 207–221. [Google Scholar] [CrossRef] [PubMed] [Green Version]
  33. Zhang, L.; Han, Y.; Jiang, Q.; Wang, C.; Chen, X.; Li, X.; Xu, F.; Jiang, Y.; Wang, Q.; Xu, W. Trend of Histone Deacetylase Inhibitors in Cancer Therapy: Isoform Selectivity or Multitargeted Strategy. Med. Res. Rev. 2015, 35, 63–84. [Google Scholar] [CrossRef] [PubMed]
  34. Glaser, K.B.; Li, J.; Staver, M.J.; Wei, R.-Q.; Albert, D.H.; Davidsen, S.K. Role of Class I and Class II histone deacetylases in carcinoma cells using siRNA. Biochem. Biophys. Res. Commun. 2003, 310, 529–536. [Google Scholar] [CrossRef]
  35. Hu, E.; Dul, E.; Sung, C.-M.; Chen, Z.; Kirkpatrick, R.; Zhang, G.-F.; Johanson, K.; Liu, R.; Lago, A.; Hofmann, G.; et al. Identification of Novel Isoform-Selective Inhibitors within Class I Histone Deacetylases. J. Pharmacol. Exp. Ther. 2003, 307, 720–728. [Google Scholar] [CrossRef] [Green Version]
  36. Kawai, H.; Li, H.; Avraham, S.; Jiang, S.; Avraham, H.K. Overexpression of histone deacetylase HDAC1 modulates breast cancer progression by negative regulation of estrogen receptor? Int. J. Cancer 2003, 107, 353–358. [Google Scholar] [CrossRef]
  37. Rikimaru, T.; Taketomi, A.; Yamashita, Y.-I.; Shirabe, K.; Hamatsu, T.; Shimada, M.; Maehara, Y. Clinical Significance of Histone Deacetylase 1 Expression in Patients with Hepatocellular Carcinoma. Oncology 2007, 72, 69–74. [Google Scholar] [CrossRef]
  38. Senese, S.; Zaragoza, K.; Minardi, S.; Muradore, I.; Ronzoni, S.; Passafaro, A.; Bernard, L.; Draetta, G.F.; Alcalay, M.; Seiser, C.; et al. Role for Histone Deacetylase 1 in Human Tumor Cell Proliferation. Mol. Cell Biol. 2007, 27, 4784–4795. [Google Scholar] [CrossRef] [Green Version]
  39. Khan, N.; Jeffers, M.; Kumar, S.; Hackett, C.; Boldog, F.; Khramtsov, N.; Qian, X.; Mills, E.; Berghs, S.C.; Carey, N.; et al. Determination of the class and isoform selectivity of small-molecule histone deacetylase inhibitors. Biochem. J. 2007, 409, 581–589. [Google Scholar] [CrossRef] [Green Version]
  40. Shen, S.; Kozikowski, A.P. Why Hydroxamates May Not Be the Best Histone Deacetylase Inhibitors-What Some May Have Forgotten or Would Rather Forget? ChemMedChem 2016, 11, 15–21. [Google Scholar] [CrossRef] [Green Version]
  41. Beckers, T.; Burkhardt, C.; Wieland, H.; Gimmnich, P.; Ciossek, T.; Maier, T.; Sanders, K. Distinct pharmacological properties of second generation HDAC inhibitors with the benzamide or hydroxamate head group. Int. J. Cancer 2007, 121, 1138–1148. [Google Scholar] [CrossRef] [PubMed]
  42. Bonfils, C.; Kalita, A.; Dubay, M.; Siu, L.L.; Carducci, M.A.; Reid, G.; Martell, R.E.; Besterman, J.M.; Li, Z. Evaluation of the Pharmacodynamic Effects of MGCD0103 from Preclinical Models to Human Using a Novel HDAC Enzyme Assay. Clin. Cancer Res. 2008, 14, 3441–3449. [Google Scholar] [CrossRef] [PubMed] [Green Version]
  43. Chou, C.J.; Herman, D.; Gottesfeld, J.M. Pimelic Diphenylamide 106 Is a Slow, Tight-binding Inhibitor of Class I Histone Deacetylases. J. Biol. Chem. 2008, 283, 35402–35409. [Google Scholar] [CrossRef] [PubMed] [Green Version]
  44. Kelly, W.K.; Richon, V.M.; O’Connor, O.; Curley, T.; MacGregor-Curtelli, B.; Tong, W.; Klang, M.; Schwartz, L.; Richardson, S.; Rosa, E.; et al. Phase I clinical trial of histone deacetylase inhibitor: Suberoylanilide hydroxamic acid administered intravenously. Clin. Cancer Res. 2003, 9, 3578–3588. [Google Scholar]
  45. Nagaoka, Y.; Maeda, T.; Kawai, Y.; Nakashima, D.; Oikawa, T.; Shimoke, K.; Ikeuchi, T.; Kuwajima, H.; Uesato, S. Synthesis and cancer antiproliferative activity of new histone deacetylase inhibitors: Hydrophilic hydroxamates and 2-aminobenzamide-containing derivatives. Eur. J. Med. Chem. 2006, 41, 697–708. [Google Scholar] [CrossRef]
  46. Moradei, O.M.; Mallais, T.C.; Frechette, S.; Paquin, I.; Tessier, P.E.; Leit, S.M.; Fournel, M.; Bonfils, C.; Trachy-Bourget, M.-C.; Liu, J.; et al. Novel Aminophenyl Benzamide-Type Histone Deacetylase Inhibitors with Enhanced Potency and Selectivity. J. Med. Chem. 2007, 50, 5543–5546. [Google Scholar] [CrossRef]
  47. Suzuki, T.; Miyata, N. Non-hydroxamate Histone Deacetylase Inhibitors. Curr. Med. Chem. 2005, 12, 2867–2880. [Google Scholar] [CrossRef]
  48. Wang, D.-F.; Helquist, P.; Wiech, N.L.; Wiest, O. Toward Selective Histone Deacetylase Inhibitor Design: Homology Modeling, Docking Studies, and Molecular Dynamics Simulations of Human Class I Histone Deacetylases. J. Med. Chem. 2005, 48, 6936–6947. [Google Scholar] [CrossRef]
  49. Chemi, G.; Brogi, S. Breakthroughs in Computational Approaches for Drug Discovery. J. Drug Res. Dev. 2017, 3. [Google Scholar] [CrossRef]
  50. Verma, J.; Khedkar, V.; Coutinho, E. 3D-QSAR in Drug Design—A Review. Curr. Top. Med. Chem. 2010, 10, 95–115. [Google Scholar] [CrossRef]
  51. Yang, S.-Y. Pharmacophore modeling and applications in drug discovery: Challenges and recent advances. Drug Discov. Today 2010, 15, 444–450. [Google Scholar] [CrossRef]
  52. Cherkasov, A.; Muratov, E.N.; Fourches, D.; Varnek, A.; Baskin, I.I.; Cronin, M.; Dearden, J.; Gramatica, P.; Martin, Y.C.; Todeschini, R.; et al. QSAR Modeling: Where Have You Been? Where Are You Going To? J. Med. Chem. 2014, 57, 4977–5010. [Google Scholar] [CrossRef] [PubMed] [Green Version]
  53. Brogi, S.; Corelli, F.; Di Marzo, V.; Ligresti, A.; Mugnaini, C.; Pasquini, S.; Tafi, A. Three-dimensional quantitative structure–selectivity relationships analysis guided rational design of a highly selective ligand for the cannabinoid receptor 2. Eur. J. Med. Chem. 2011, 46, 547–555. [Google Scholar] [CrossRef] [PubMed]
  54. Brogi, S.; Papazafiri, P.; Roussis, V.; Tafi, A. 3D-QSAR using pharmacophore-based alignment and virtual screening for discovery of novel MCF-7 cell line inhibitors. Eur. J. Med. Chem. 2013, 67, 344–351. [Google Scholar] [CrossRef] [PubMed]
  55. Zaccagnini, L.; Brogi, S.; Brindisi, M.; Gemma, S.; Chemi, G.; Legname, G.; Campiani, G.; Butini, S. Identification of novel fluorescent probes preventing PrP Sc replication in prion diseases. Eur. J. Med. Chem. 2017, 127, 859–873. [Google Scholar] [CrossRef] [PubMed]
  56. Brogi, S.; Brindisi, M.; Joshi, B.P.; Sanna Coccone, S.; Parapini, S.; Basilico, N.; Novellino, E.; Campiani, G.; Gemma, S.; Butini, S. Exploring clotrimazole-based pharmacophore: 3D-QSAR studies and synthesis of novel antiplasmodial agents. Bioorg. Med. Chem. Lett. 2015, 25, 5412–5418. [Google Scholar] [CrossRef] [PubMed]
  57. Chemi, G.; Gemma, S.; Campiani, G.; Brogi, S.; Butini, S.; Brindisi, M. Computational Tool for Fast in silico Evaluation of hERG K+ Channel Affinity. Front. Chem. 2017, 5. [Google Scholar] [CrossRef] [Green Version]
  58. Liu, B.; Lu, A.J.; Liao, C.Z.; Liu, H.B.; Zhou, J.J. 3D-QSAR of Sulfonamide Hydroxamic Acid HDAC Inhibitors. Acta Phys. Chim. Sin. 2005, 21, 333–337. [Google Scholar] [CrossRef]
  59. Guo, Y.; Xiao, J.; Guo, Z.; Chu, F.; Cheng, Y.; Wu, S. Exploration of a binding mode of indole amide analogues as potent histone deacetylase inhibitors and 3D-QSAR analyses. Bioorg. Med. Chem. 2005, 13, 5424–5434. [Google Scholar] [CrossRef]
  60. Juvale, D.C.; Kulkarni, V.V.; Deokar, H.S.; Wagh, N.K.; Padhye, S.B.; Kulkarni, V.M. 3D-QSAR of histone deacetylase inhibitors: Hydroxamate analogues. Org. Biomol. Chem. 2006, 4, 2858. [Google Scholar] [CrossRef]
  61. Ragno, R.; Simeoni, S.; Valente, S.; Massa, S.; Mai, A. 3-D QSAR Studies on Histone Deacetylase Inhibitors. A GOLPE/GRID Approach on Different Series of Compounds. J. Chem. Inf. Model. 2006, 46, 1420–1430. [Google Scholar] [CrossRef] [PubMed]
  62. Chen, Y.; Li, H.; Tang, W.; Zhu, C.; Jiang, Y.; Zou, J.; Yu, Q.; You, Q. 3D-QSAR studies of HDACs inhibitors using pharmacophore-based alignment. Eur. J. Med. Chem. 2009, 44, 2868–2876. [Google Scholar] [CrossRef] [PubMed]
  63. Wang, D.-F.; Wiest, O.; Helquist, P.; Lan-Hargest, H.-Y.; Wiech, N.L. QSAR Studies of PC-3 cell line inhibition activity of TSA and SAHA-like hydroxamic acids. Bioorg. Med. Chem. Lett. 2004, 14, 707–711. [Google Scholar] [CrossRef] [PubMed]
  64. Xie, A.; Liao, C.; Li, Z.; Ning, Z.; Hu, W.; Lu, X.; Shi, L.; Zhou, J. Quantitative Structure-Activity Relationship Study of Histone Deacetylase Inhibitors. Anti-Cancer Agents Med. Chem. 2004, 4, 273–299. [Google Scholar] [CrossRef] [PubMed]
  65. Dixon, S.L.; Smondyrev, A.M.; Knoll, E.H.; Rao, S.N.; Shaw, D.E.; Friesner, R.A. PHASE: A new engine for pharmacophore perception, 3D QSAR model development, and 3D database screening: 1. Methodology and preliminary results. J. Comput. Aided Mol. Des. 2006, 20, 647–671. [Google Scholar] [CrossRef] [PubMed]
  66. Abdizadeh, T.; Kalani, M.R.; Abnous, K.; Tayarani-Najaran, Z.; Khashyarmanesh, B.Z.; Abdizadeh, R.; Ghodsi, R.; Hadizadeh, F. Design, synthesis and biological evaluation of novel coumarin-based benzamides as potent histone deacetylase inhibitors and anticancer agents. Eur. J. Med. Chem. 2017, 132, 42–62. [Google Scholar] [CrossRef]
  67. Hamblett, C.L.; Methot, J.L.; Mampreian, D.M.; Sloman, D.L.; Stanton, M.G.; Kral, A.M.; Fleming, J.C.; Cruz, J.C.; Chenard, M.; Ozerova, N.; et al. The discovery of 6-amino nicotinamides as potent and selective histone deacetylase inhibitors. Bioorg. Med. Chem. Lett. 2007, 17, 5300–5309. [Google Scholar] [CrossRef]
  68. Sixto-López, Y.; Bello, M.; Correa-Basurto, J. Insights into structural features of HDAC1 and its selectivity inhibition elucidated by Molecular dynamic simulation and Molecular Docking. J. Biomol. Struct. Dyn. 2018, 37, 584–610. [Google Scholar] [CrossRef]
  69. Brindisi, M.; Cavella, C.; Brogi, S.; Nebbioso, A.; Senger, J.; Maramai, S.; Ciotta, A.; Iside, C.; Butini, S.; Lamponi, S.; et al. Phenylpyrrole-based HDAC inhibitors: Synthesis, molecular modeling and biological studies. Future Med. Chem. 2016, 8, 1573–1587. [Google Scholar] [CrossRef]
  70. Brindisi, M.; Senger, J.; Cavella, C.; Grillo, A.; Chemi, G.; Gemma, S.; Cucinella, D.M.; Lamponi, S.; Sarno, F.; Iside, C.; et al. Novel spiroindoline HDAC inhibitors: Synthesis, molecular modelling and biological studies. Eur. J. Med. Chem. 2018, 157, 127–138. [Google Scholar] [CrossRef]
  71. Braga, R.C.; Andrade, C.H. Assessing the Performance of 3D Pharmacophore Models in Virtual Screening: How Good are They? Curr. Top. Med. Chem. 2013, 13, 1127–1138. [Google Scholar] [CrossRef] [PubMed]
  72. Dror, O.; Schneidman-Duhovny, D.; Inbar, Y.; Nussinov, R.; Wolfson, H.J. Novel Approach for Efficient Pharmacophore-Based Virtual Screening: Method and Applications. J. Chem. Inf. Model. 2009, 49, 2333–2343. [Google Scholar] [CrossRef] [PubMed] [Green Version]
  73. Krishna, S.; Singh, D.K.; Meena, S.; Datta, D.; Siddiqi, M.I.; Banerjee, D. Pharmacophore-Based Screening and Identification of Novel Human Ligase I Inhibitors with Potential Anticancer Activity. J. Chem. Inf. Model. 2014, 54, 781–792. [Google Scholar] [CrossRef] [PubMed]
  74. Sakkiah, S.; Thangapandian, S.; John, S.; Lee, K.W. Pharmacophore based virtual screening, molecular docking studies to design potent heat shock protein 90 inhibitors. Eur. J. Med. Chem. 2011, 46, 2937–2947. [Google Scholar] [CrossRef]
  75. Thangapandian, S.; John, S.; Sakkiah, S.; Lee, K.W. Pharmacophore-based virtual screening and Bayesian model for the identification of potential human leukotriene A4 hydrolase inhibitors. Eur. J. Med. Chem. 2011, 46, 1593–1603. [Google Scholar] [CrossRef] [PubMed]
  76. Triballeau, N.; Acher, F.; Brabet, I.; Pin, J.-P.; Bertrand, H.-O. Virtual Screening Workflow Development Guided by the “Receiver Operating Characteristic” Curve Approach. Application to High-Throughput Docking on Metabotropic Glutamate Receptor Subtype 4. J. Med. Chem. 2005, 48, 2534–2547. [Google Scholar] [CrossRef]
  77. Zhao, W.; Hevener, K.E.; White, S.W.; Lee, R.E.; Boyett, J.M. A statistical framework to evaluate virtual screening. BMC Bioinform. 2009, 10. [Google Scholar] [CrossRef] [Green Version]
  78. Maestro; Version 10.1; Schrödinger, LLC: New York, NY, USA, 2015.
  79. Andrews, D.M.; Gibson, K.M.; Graham, M.A.; Matusiak, Z.S.; Roberts, C.A.; Stokes, E.S.; Brady, M.C.; Chresta, C.M. Design and campaign synthesis of pyridine-based histone deacetylase inhibitors. Bioorg. Med. Chem. Lett. 2008, 18, 2525–2529. [Google Scholar] [CrossRef]
  80. Methot, J.L.; Chakravarty, P.K.; Chenard, M.; Close, J.; Cruz, J.C.; Dahlberg, W.K.; Fleming, J.; Hamblett, C.L.; Hamill, J.E.; Harrington, P.; et al. Exploration of the internal cavity of histone deacetylase (HDAC) with selective HDAC1/HDAC2 inhibitors (SHI-1:2). Bioorg. Med. Chem. Lett. 2008, 18, 973–978. [Google Scholar] [CrossRef]
  81. Kattar, S.D.; Surdi, L.M.; Zabierek, A.; Methot, J.L.; Middleton, R.E.; Hughes, B.; Szewczak, A.A.; Dahlberg, W.K.; Kral, A.M.; Ozerova, N.; et al. Parallel medicinal chemistry approaches to selective HDAC1/HDAC2 inhibitor (SHI-1:2) optimization. Bioorg. Med. Chem. Lett. 2009, 19, 1168–1172. [Google Scholar] [CrossRef]
  82. Methot, J.L.; Hamblett, C.L.; Mampreian, D.M.; Jung, J.; Harsch, A.; Szewczak, A.A.; Dahlberg, W.K.; Middleton, R.E.; Hughes, B.; Fleming, J.C.; et al. SAR profiles of spirocyclic nicotinamide derived selective HDAC1/HDAC2 inhibitors (SHI-1:2). Bioorg. Med. Chem. Lett. 2008, 18, 6104–6109. [Google Scholar] [CrossRef]
  83. Li, Y.; Wang, Y.; Xie, N.; Xu, M.; Qian, P.; Zhao, Y.; Li, S. Design, synthesis and antiproliferative activities of novel benzamides derivatives as HDAC inhibitors. Eur. J. Med. Chem. 2015, 100, 270–276. [Google Scholar] [CrossRef] [PubMed]
  84. Li, Y.; Zhou, Y.; Qian, P.; Wang, Y.; Jiang, F.; Yao, Z.; Hu, W.; Zhao, Y.; Li, S. Design, synthesis and bioevalution of novel benzamides derivatives as HDAC inhibitors. Bioorg. Med. Chem. Lett. 2013, 23, 179–182. [Google Scholar] [CrossRef] [PubMed]
  85. Siliphaivanh, P.; Harrington, P.; Witter, D.J.; Otte, K.; Tempest, P.; Kattar, S.; Kral, A.M.; Fleming, J.C.; Deshmukh, S.V.; Harsch, A.; et al. Design of novel histone deacetylase inhibitors. Bioorg. Med. Chem. Lett. 2007, 17, 4619–4624. [Google Scholar] [CrossRef] [PubMed]
  86. Andrews, D.M.; Stokes, E.S.; Carr, G.R.; Matusiak, Z.S.; Roberts, C.A.; Waring, M.J.; Brady, M.C.; Chresta, C.M.; East, S.J. Design and campaign synthesis of piperidine- and thiazole-based histone deacetylase inhibitors. Bioorg. Med. Chem. Lett. 2008, 18, 2580–2584. [Google Scholar] [CrossRef]
  87. Hirata, Y.; Hirata, M.; Kawaratani, Y.; Shibano, M.; Taniguchi, M.; Yasuda, M.; Ohmomo, Y.; Nagaoka, Y.; Baba, K.; Uesato, S. Anti-tumor activity of new orally bioavailable 2-amino-5-(thiophen-2-yl)benzamide-series histone deacetylase inhibitors, possessing an aqueous soluble functional group as a surface recognition domain. Bioorg. Med. Chem. Lett. 2012, 22, 1926–1930. [Google Scholar] [CrossRef]
  88. Kiyokawa, S.; Hirata, Y.; Nagaoka, Y.; Shibano, M.; Taniguchi, M.; Yasuda, M.; Baba, K.; Uesato, S. New orally bioavailable 2-aminobenzamide-type histone deacetylase inhibitor possessing a (2-hydroxyethyl)(4-(thiophen-2-yl)benzyl)amino group. Bioorg. Med. Chem. 2010, 18, 3925–3933. [Google Scholar] [CrossRef]
  89. Mahboobi, S.; Dove, S.; Sellmer, A.; Winkler, M.; Eichhorn, E.; Pongratz, H.; Ciossek, T.; Baer, T.; Maier, T.; Beckers, T. Design of chimeric histone deacetylase- and tyrosine kinase-inhibitors: A series of imatinib hybrides as potent inhibitors of wild-type and mutant BCR-ABL, PDGF-Rbeta, and histone deacetylases. J. Med. Chem. 2009, 52, 2265–2279. [Google Scholar] [CrossRef]
  90. Rajak, H.; Kumar, P.; Parmar, P.; Thakur, B.S.; Veerasamy, R.; Sharma, P.C.; Sharma, A.K.; Gupta, A.K.; Dangi, J.S. Appraisal of GABA and PABA as linker: Design and synthesis of novel benzamide based histone deacetylase inhibitors. Eur. J. Med. Chem. 2012, 53, 390–397. [Google Scholar] [CrossRef]
  91. Valente, S.; Trisciuoglio, D.; De Luca, T.; Nebbioso, A.; Labella, D.; Lenoci, A.; Bigogno, C.; Dondio, G.; Miceli, M.; Brosch, G.; et al. 1,3,4-Oxadiazole-containing histone deacetylase inhibitors: Anticancer activities in cancer cells. J. Med. Chem. 2014, 57, 6259–6265. [Google Scholar] [CrossRef]
  92. Rusche, J.R.; Peet, N.P.; Hopper, A.T. Compositions Including 6-Aminohexanoic Acid Derivatives as HDAC Inhibitors. U.S. Patent 9,265,734, 23 February 2016. [Google Scholar]
  93. Liu, T.; Lin, Y.; Wen, X.; Jorissen, R.N.; Gilson, M.K. BindingDB: A web-accessible database of experimentally determined protein-ligand binding affinities. Nucleic Acids Res. 2007, 35, D198–D201. [Google Scholar] [CrossRef] [PubMed] [Green Version]
  94. LigPrep; Version 3.3; Schrödinger, LLC: New York, NY, USA, 2015.
  95. Sirous, H.; Chemi, G.; Campiani, G.; Brogi, S. An integrated in silico screening strategy for identifying promising disruptors of p53-MDM2 interaction. Comput. Biol. Chem. 2019, 83, 107105. [Google Scholar] [CrossRef] [PubMed]
  96. Sirous, H.; Chemi, G.; Gemma, S.; Butini, S.; Debyser, Z.; Christ, F.; Saghaie, L.; Brogi, S.; Fassihi, A.; Campiani, G.; et al. Identification of Novel 3-Hydroxy-pyran-4-One Derivatives as Potent HIV-1 Integrase Inhibitors Using in silico Structure-Based Combinatorial Library Design Approach. Front. Chem. 2019, 7, 574. [Google Scholar] [CrossRef] [PubMed] [Green Version]
  97. Sirous, H.; Fassihi, A.; Brogi, S.; Campiani, G.; Christ, F.; Debyser, Z.; Gemma, S.; Butini, S.; Chemi, G.; Grillo, A.; et al. Synthesis, Molecular Modelling and Biological Studies of 3-hydroxypyrane- 4-one and 3-hydroxy-pyridine-4-one Derivatives as HIV-1 Integrase Inhibitors. Med. Chem. 2019, 15, 755–770. [Google Scholar] [CrossRef] [PubMed]
  98. Jorgensen, W.L.; Maxwell, D.S.; Tirado-Rives, J. Development and Testing of the OPLS All-Atom Force Field on Conformational Energetics and Properties of Organic Liquids. J. Am. Chem. Soc. 1996, 118, 11225–11236. [Google Scholar] [CrossRef]
  99. MacroModel; Version 10.7; Schrödinger, LLC: New York, NY, USA, 2015.
  100. Still, W.C.; Tempczyk, A.; Hawley, R.C.; Hendrickson, T. Semianalytical treatment of solvation for molecular mechanics and dynamics. J. Am. Chem. Soc. 1990, 112, 6127–6129. [Google Scholar] [CrossRef]
  101. Phase; Version 4.2; Schrödinger, LLC: New York, NY, USA, 2015.
  102. Todeschini, R.; Ballabio, D.; Grisoni, F. Beware of Unreliable Q2! A Comparative Study of Regression Metrics for Predictivity Assessment of QSAR Models. J. Chem. Inf. Model. 2016, 56, 1905–1913. [Google Scholar] [CrossRef]
  103. Frechette, S.; Leit, S.; Woo, S.H.; Lapointe, G.; Jeannotte, G.; Moradei, O.; Paquin, I.; Bouchain, G.; Raeppel, S.; Gaudette, F.; et al. 4-(Heteroarylaminomethyl)-N-(2-aminophenyl)-benzamides and their analogs as a novel class of histone deacetylase inhibitors. Bioorg. Med. Chem. Lett 2008, 18, 1502–1506. [Google Scholar] [CrossRef]
  104. Marson, C.M.; Matthews, C.J.; Atkinson, S.J.; Lamadema, N.; Thomas, N.S. Potent and Selective Inhibitors of Histone Deacetylase-3 Containing Chiral Oxazoline Capping Groups and a N-(2-Aminophenyl)-benzamide Binding Unit. J. Med. Chem. 2015, 58, 6803–6818. [Google Scholar] [CrossRef] [Green Version]
  105. Zhu, Y.; Chen, X.; Ran, T.; Niu, J.; Zhao, S.; Lu, T.; Tang, W. Design, synthesis and biological evaluation of urea-based benzamides derivatives as HDAC inhibitors. Med. Chem. Res. 2017, 26, 2879–2888. [Google Scholar] [CrossRef]
  106. Harrington, P.; Kattar, S.; Miller, T.A.; Stanton, M.G.; Tempest, P.; Witter, D.J. 4-Carboxybenzylamino Derivatives as Histone Deacetylase Inhibitors. U.S. Patent 8,389,553, 5 March 2013. [Google Scholar]
  107. Kirchmair, J.; Markt, P.; Distinto, S.; Wolber, G.; Langer, T. Evaluation of the performance of 3D virtual screening protocols: RMSD comparisons, enrichment assessments, and decoy selection—What can we learn from earlier mistakes? J. Comput. Aided Mol. Des. 2008, 22, 213–228. [Google Scholar] [CrossRef] [PubMed]
  108. Mysinger, M.M.; Carchia, M.; Irwin, J.J.; Shoichet, B.K. Directory of Useful Decoys, Enhanced (DUD-E): Better Ligands and Decoys for Better Benchmarking. J. Med. Chem. 2012, 55, 6582–6594. [Google Scholar] [CrossRef] [PubMed]
Figure 1. HDACIs approved by FDA and/or in clinical trials.
Molecules 25 01952 g001
Figure 2. Chemical structure of highly active compounds against HDAC1 (IC50 comprised between 0.004 µM and 0.01 µM) used for generating a common-features pharmacophore.
Molecules 25 01952 g002
Figure 3. (A) Superposition of highly active compound 13 and ADDRR hypothesis. (B) ADDRR hypothesis and its inter-feature distances. Features are as follows: H-bond acceptor = A, red vector; H-bond donor = D, blue vectors; aromatic feature = R, orange ring (pictures were generated by means of Maestro software).
Molecules 25 01952 g003
Figure 4. Scatter plot for the predicted (Phase-predicted activity) and the observed (experimental activity) pIC50 values (μM) as calculated by the 3D-QSAR model applied to the training set (blue) and test set (cyan) compounds.
Molecules 25 01952 g004
Figure 5. (AC) Superposition of highly active compounds 3, 10, and 13, respectively with the 3D-QSAR model. (DF) Superposition of moderate active compounds 22 (Mocetinostat), 213, and 239, respectively with the 3D-QSAR model. (GI) Superposition of less active compounds 218, 279, and 299, respectively with the 3D-QSAR model. The picture was generated by means of Maestro software (Schrödinger, LLC, New York, NY, USA, 2015).
Molecules 25 01952 g005
Figure 6. Scatter plot for the predicted (Phase-predicted activity) and observed (experimental activity) pIC50 values (μM) as calculated by the 3D-QSAR model with 7 factors applied to the external test set.
Molecules 25 01952 g006
Figure 7. (A) EF and GH scores obtained by the application of 3D-QSAR model in a database screening; and (B) receiver-operating characteristic (ROC) curve generated from database screening.
Molecules 25 01952 g007
Table 1. The different scoring parameters for the best pharmacophore hypothesis, matching all 20 highly active compounds used.
HYPO IDSurvivalSurvival—InactiveSiteVectorVolumeSelectivityMatchesEnergyActivityInactive
ADDRR3.7691.8410.970.9990.7981.578200.0062.0971.928
Table 2. 3D-QSAR statistical parameters of the seven Latent Variables (LVs) Phase-derived sets of models.
LVsR 2aSD bF cP dRMSE eQ 2fQ2F3 gR-Pearson h
10.34080.6978132.94.699 × 10−220.51990.38860.6350.6747
20.62730.5257215.51.344 × 10−550.39790.64200.7910.8282
30.76200.4209272.23.629 × 10−790.36150.70450.8230.8579
40.87750.3025455.01.704 × 10−1440.35140.72070.8330.8690
50.91590.2512551.09.327 × 10−1340.29710.80040.8810.9003
60.94330.2067698.66.590 × 10−1340.28650.81430.8900.9100
70.95820.1778822.14.377 × 10−1690.28080.82170.8940.9152
aR2: value of r2 of the regression. bSD: standard deviation of the regression. cF: variance ratio. dP: significance level of variance ratio. eRMSE: root-mean-square error in the test set predictions. fQ2: value of Q2 for the predicted activities. gQ2F3: value of Q2F3: for the predicted activities calculated as reported in Materials and Methods section. hR-Pearson: correlation between the predicted and observed selectivity index values for the test set.

