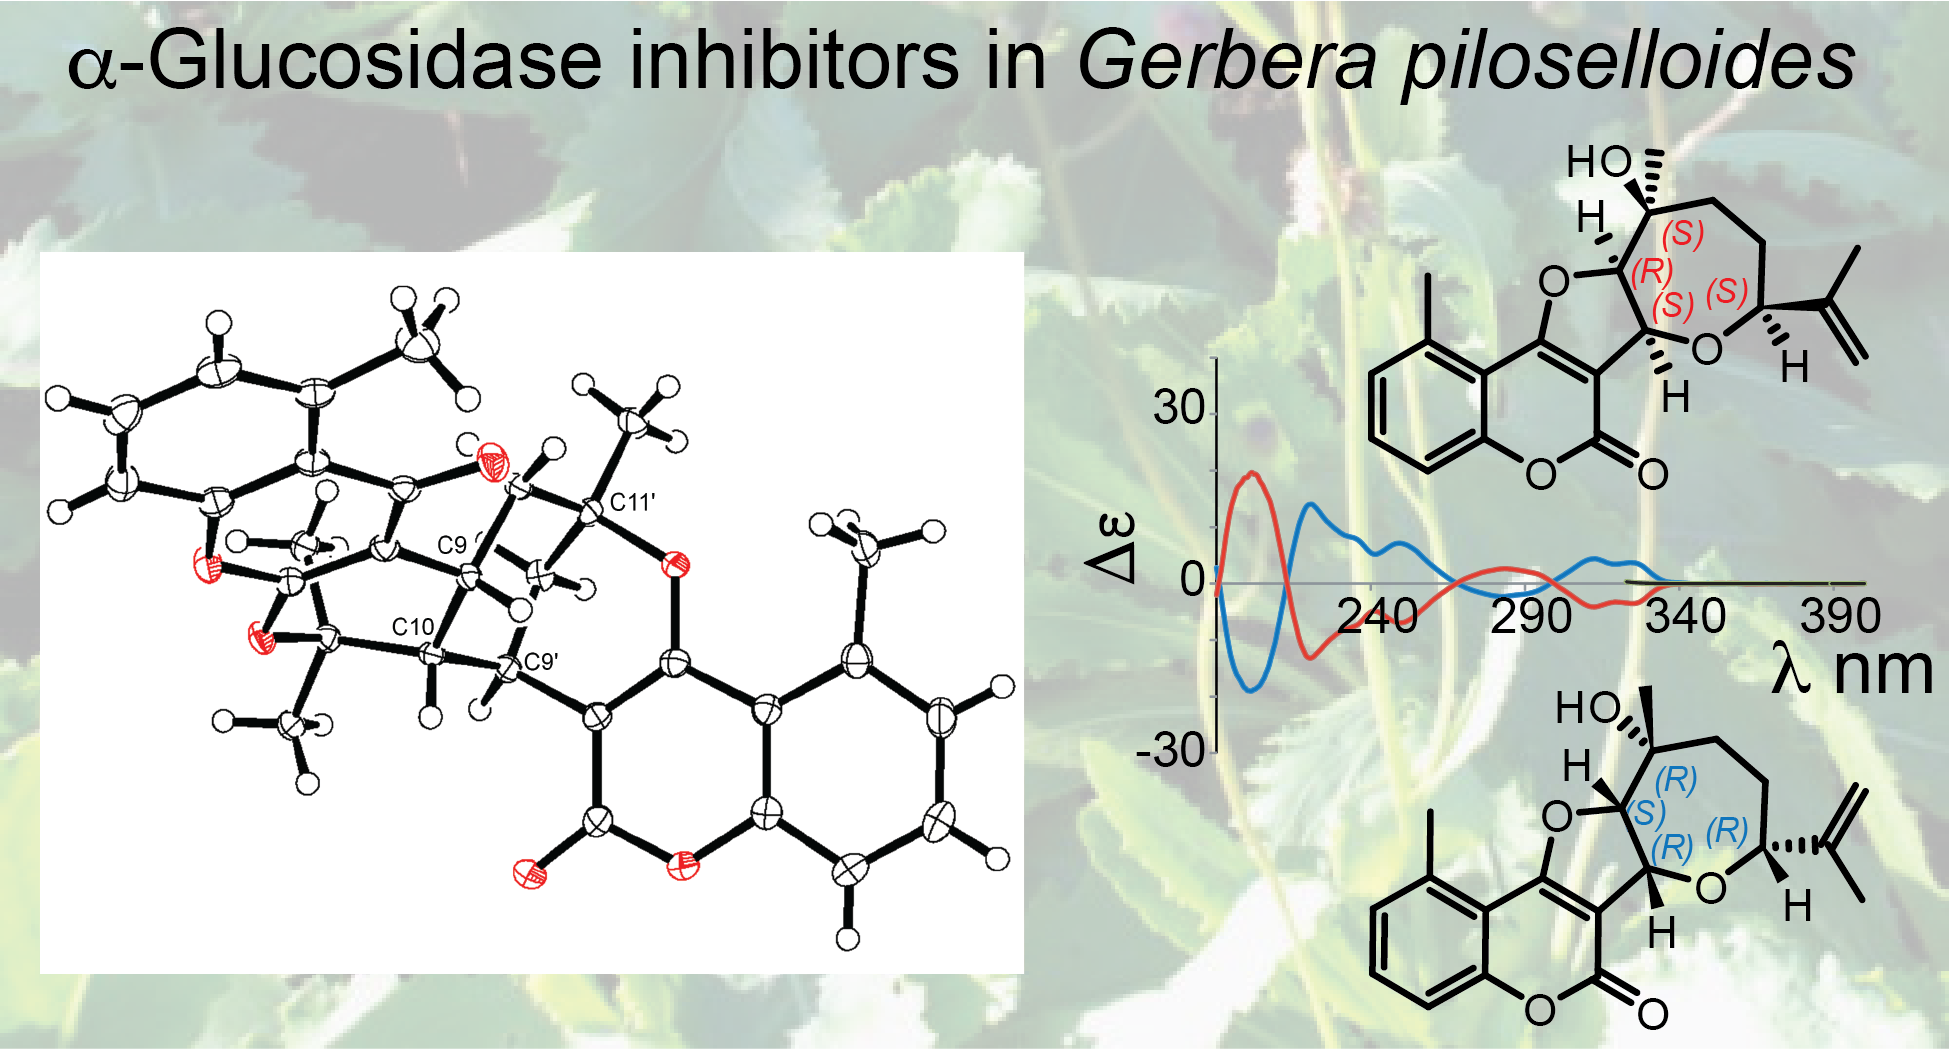
Structure Elucidation of Prenyl- and Geranyl-Substituted Coumarins in Gerbera piloselloides by NMR Spectroscopy, Electronic Circular Dichroism Calculations, and Single Crystal X-ray Crystallography

 , , , , , ,
  and
and 
Abstract

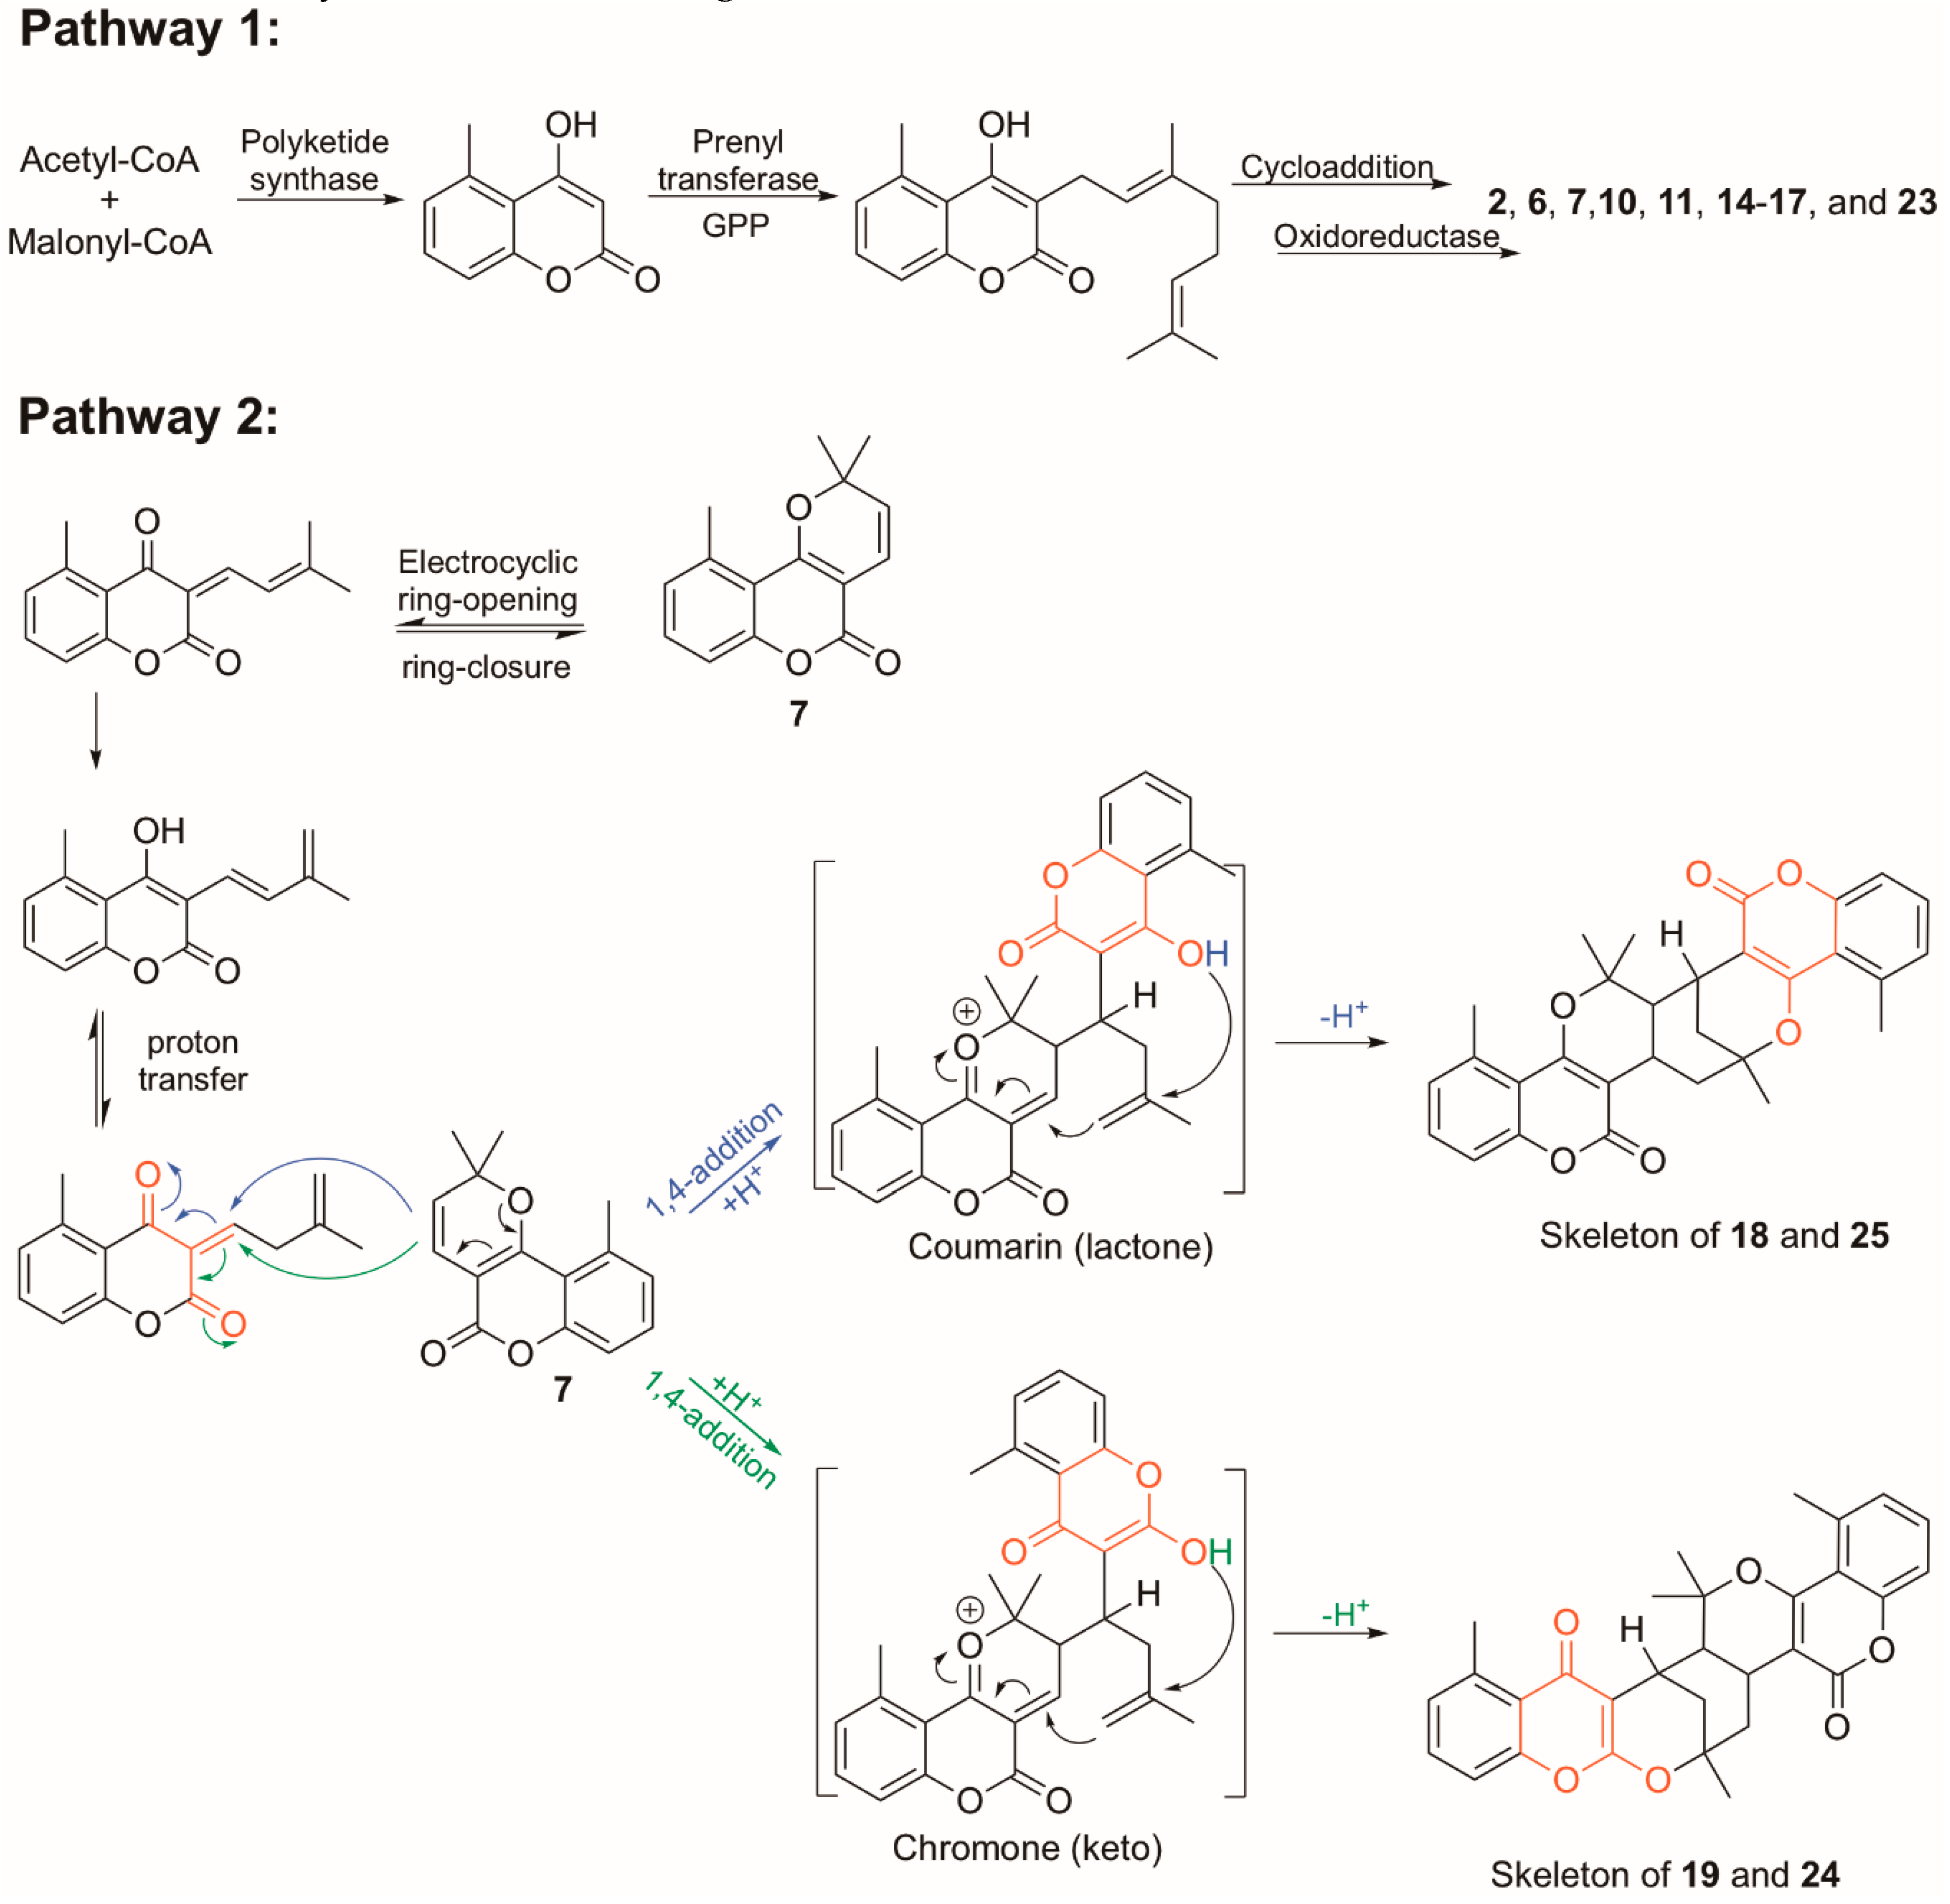
1. Introduction
2. Results
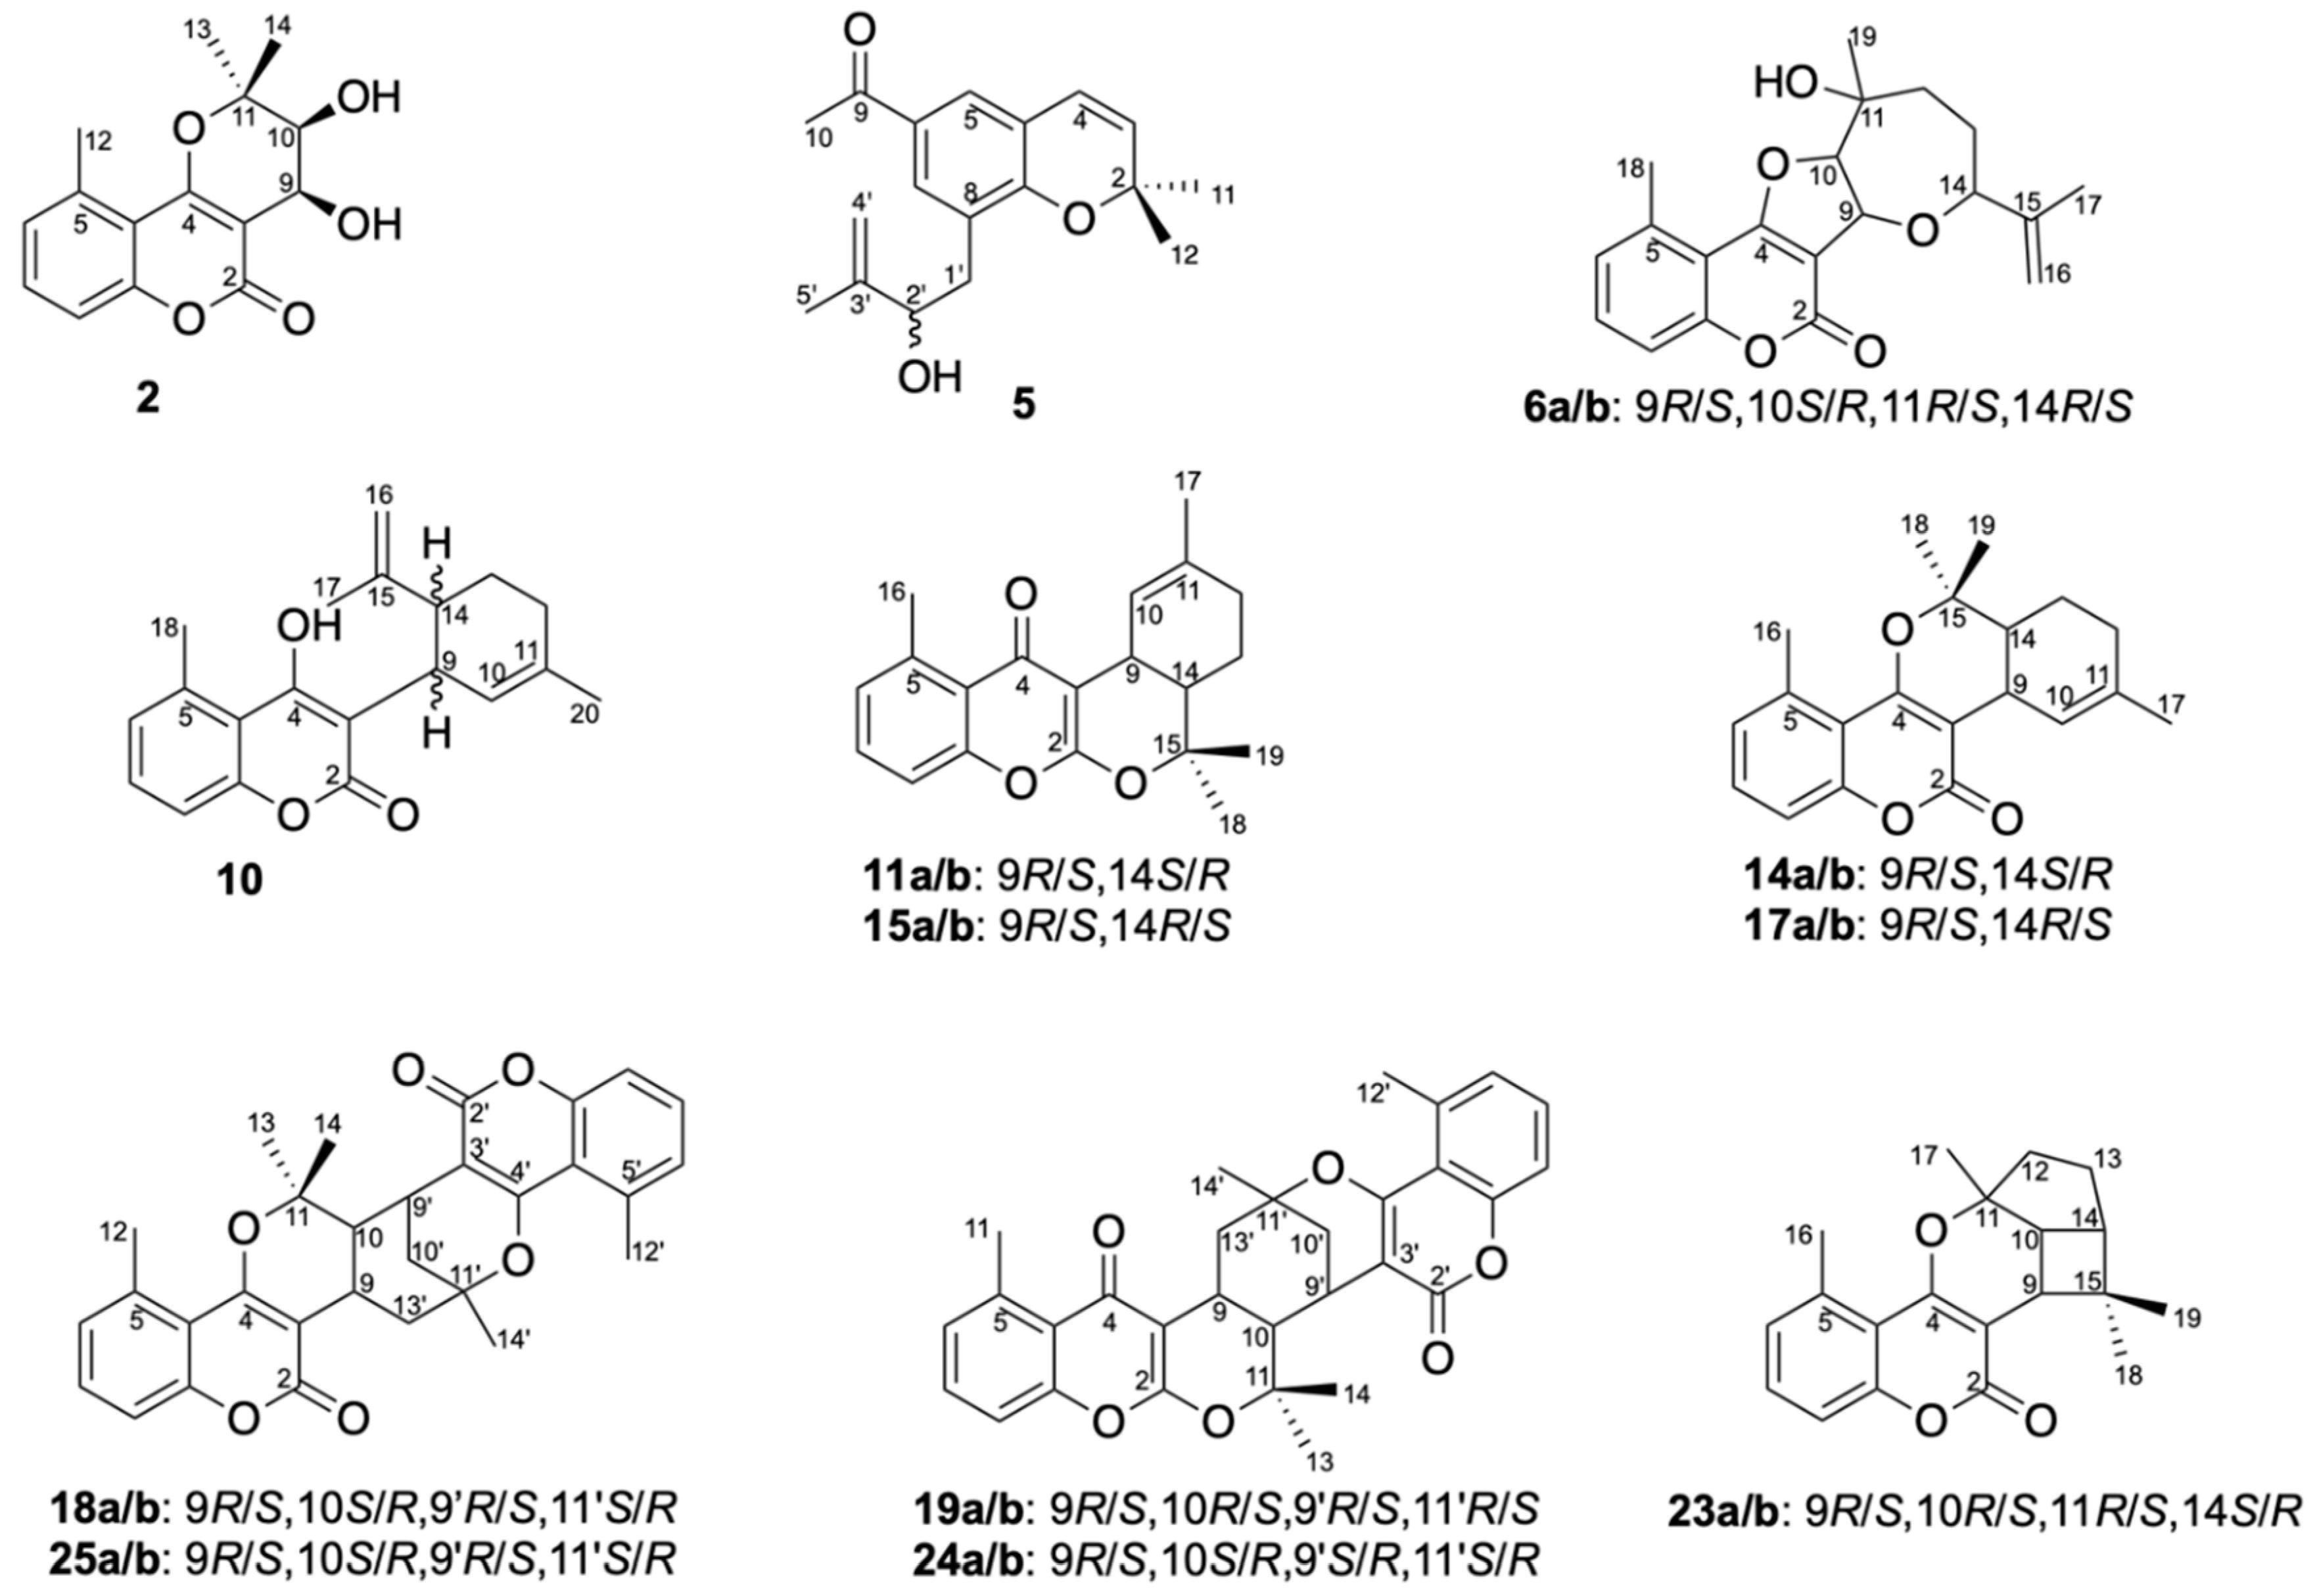
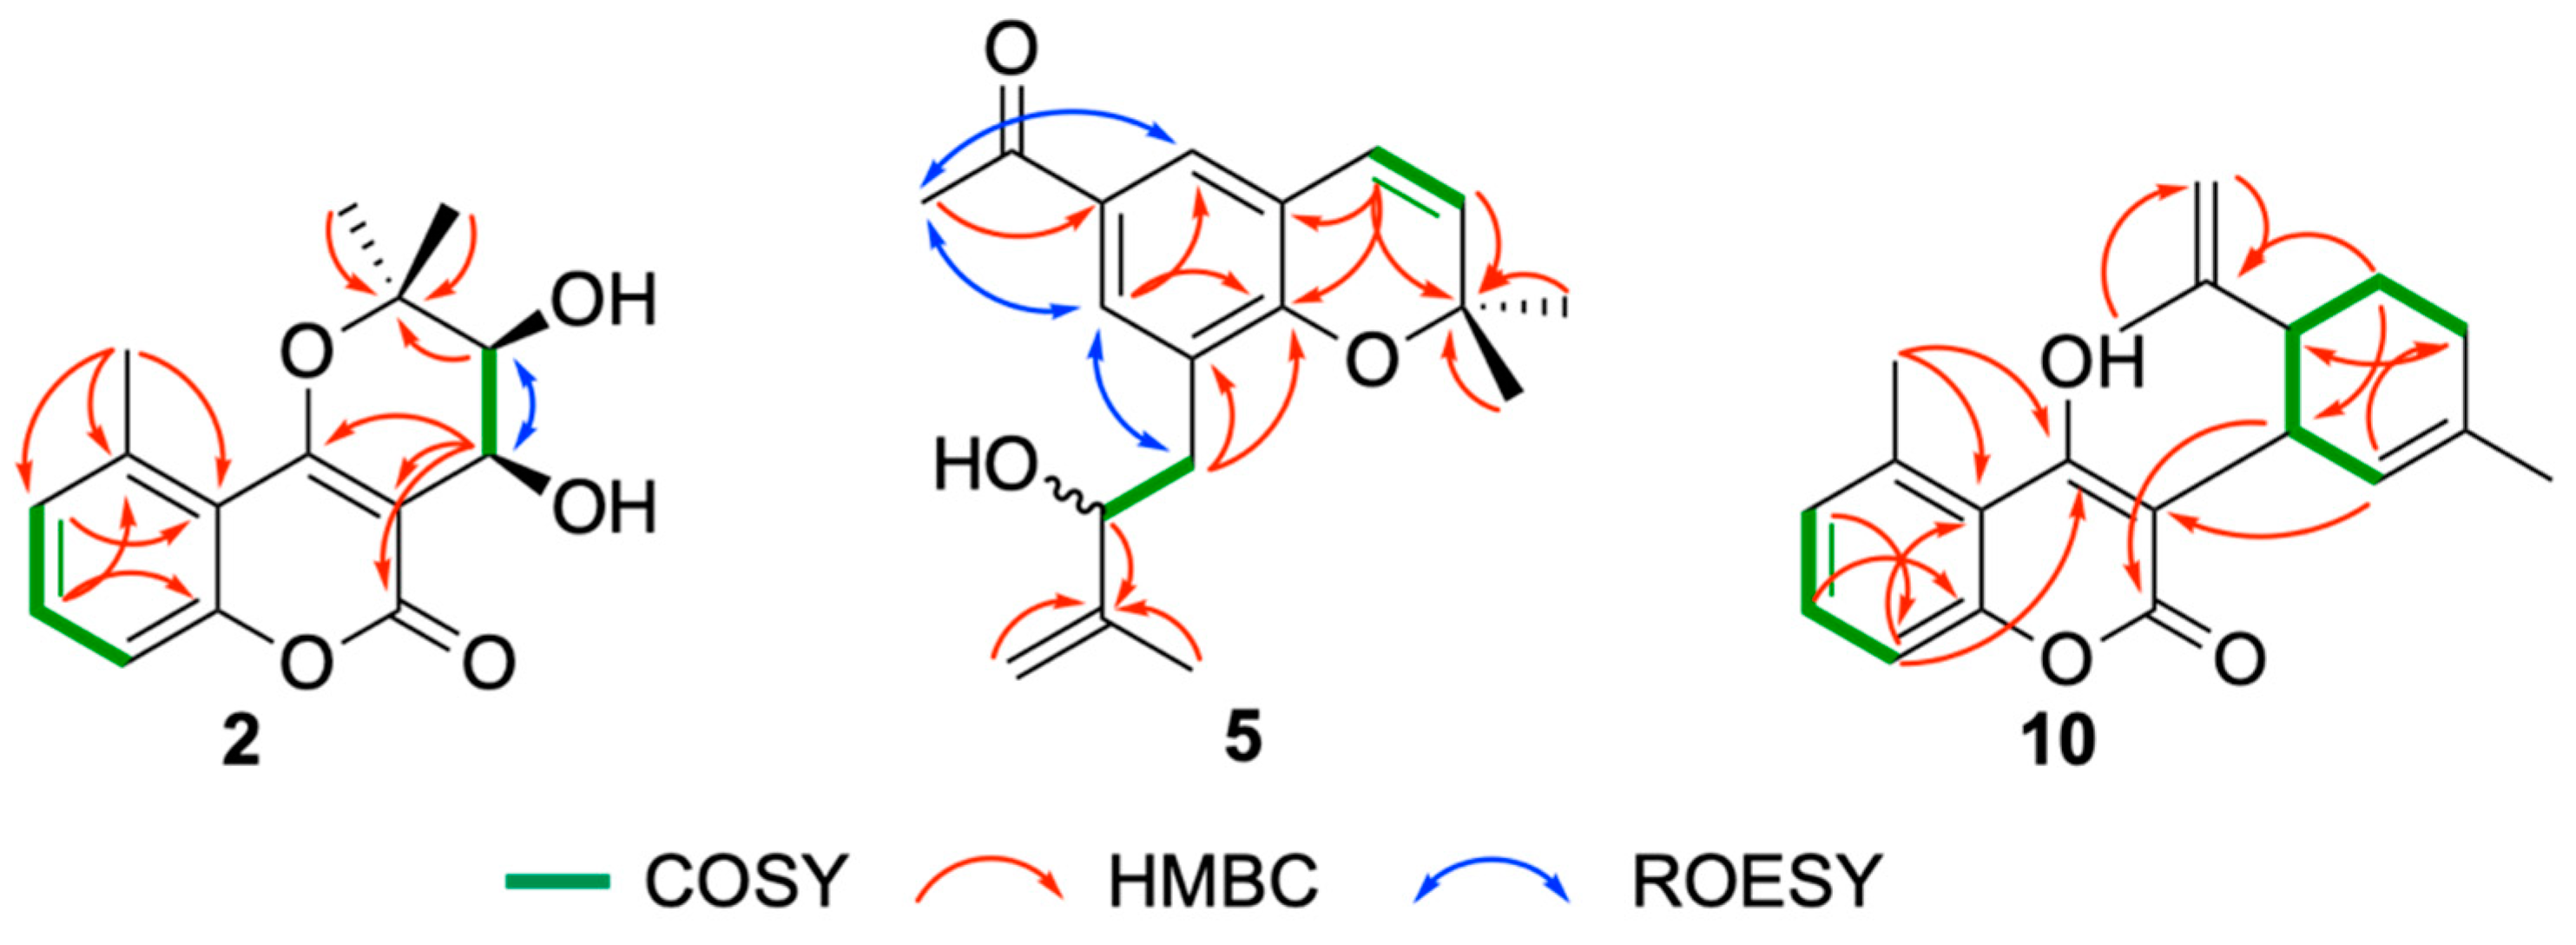
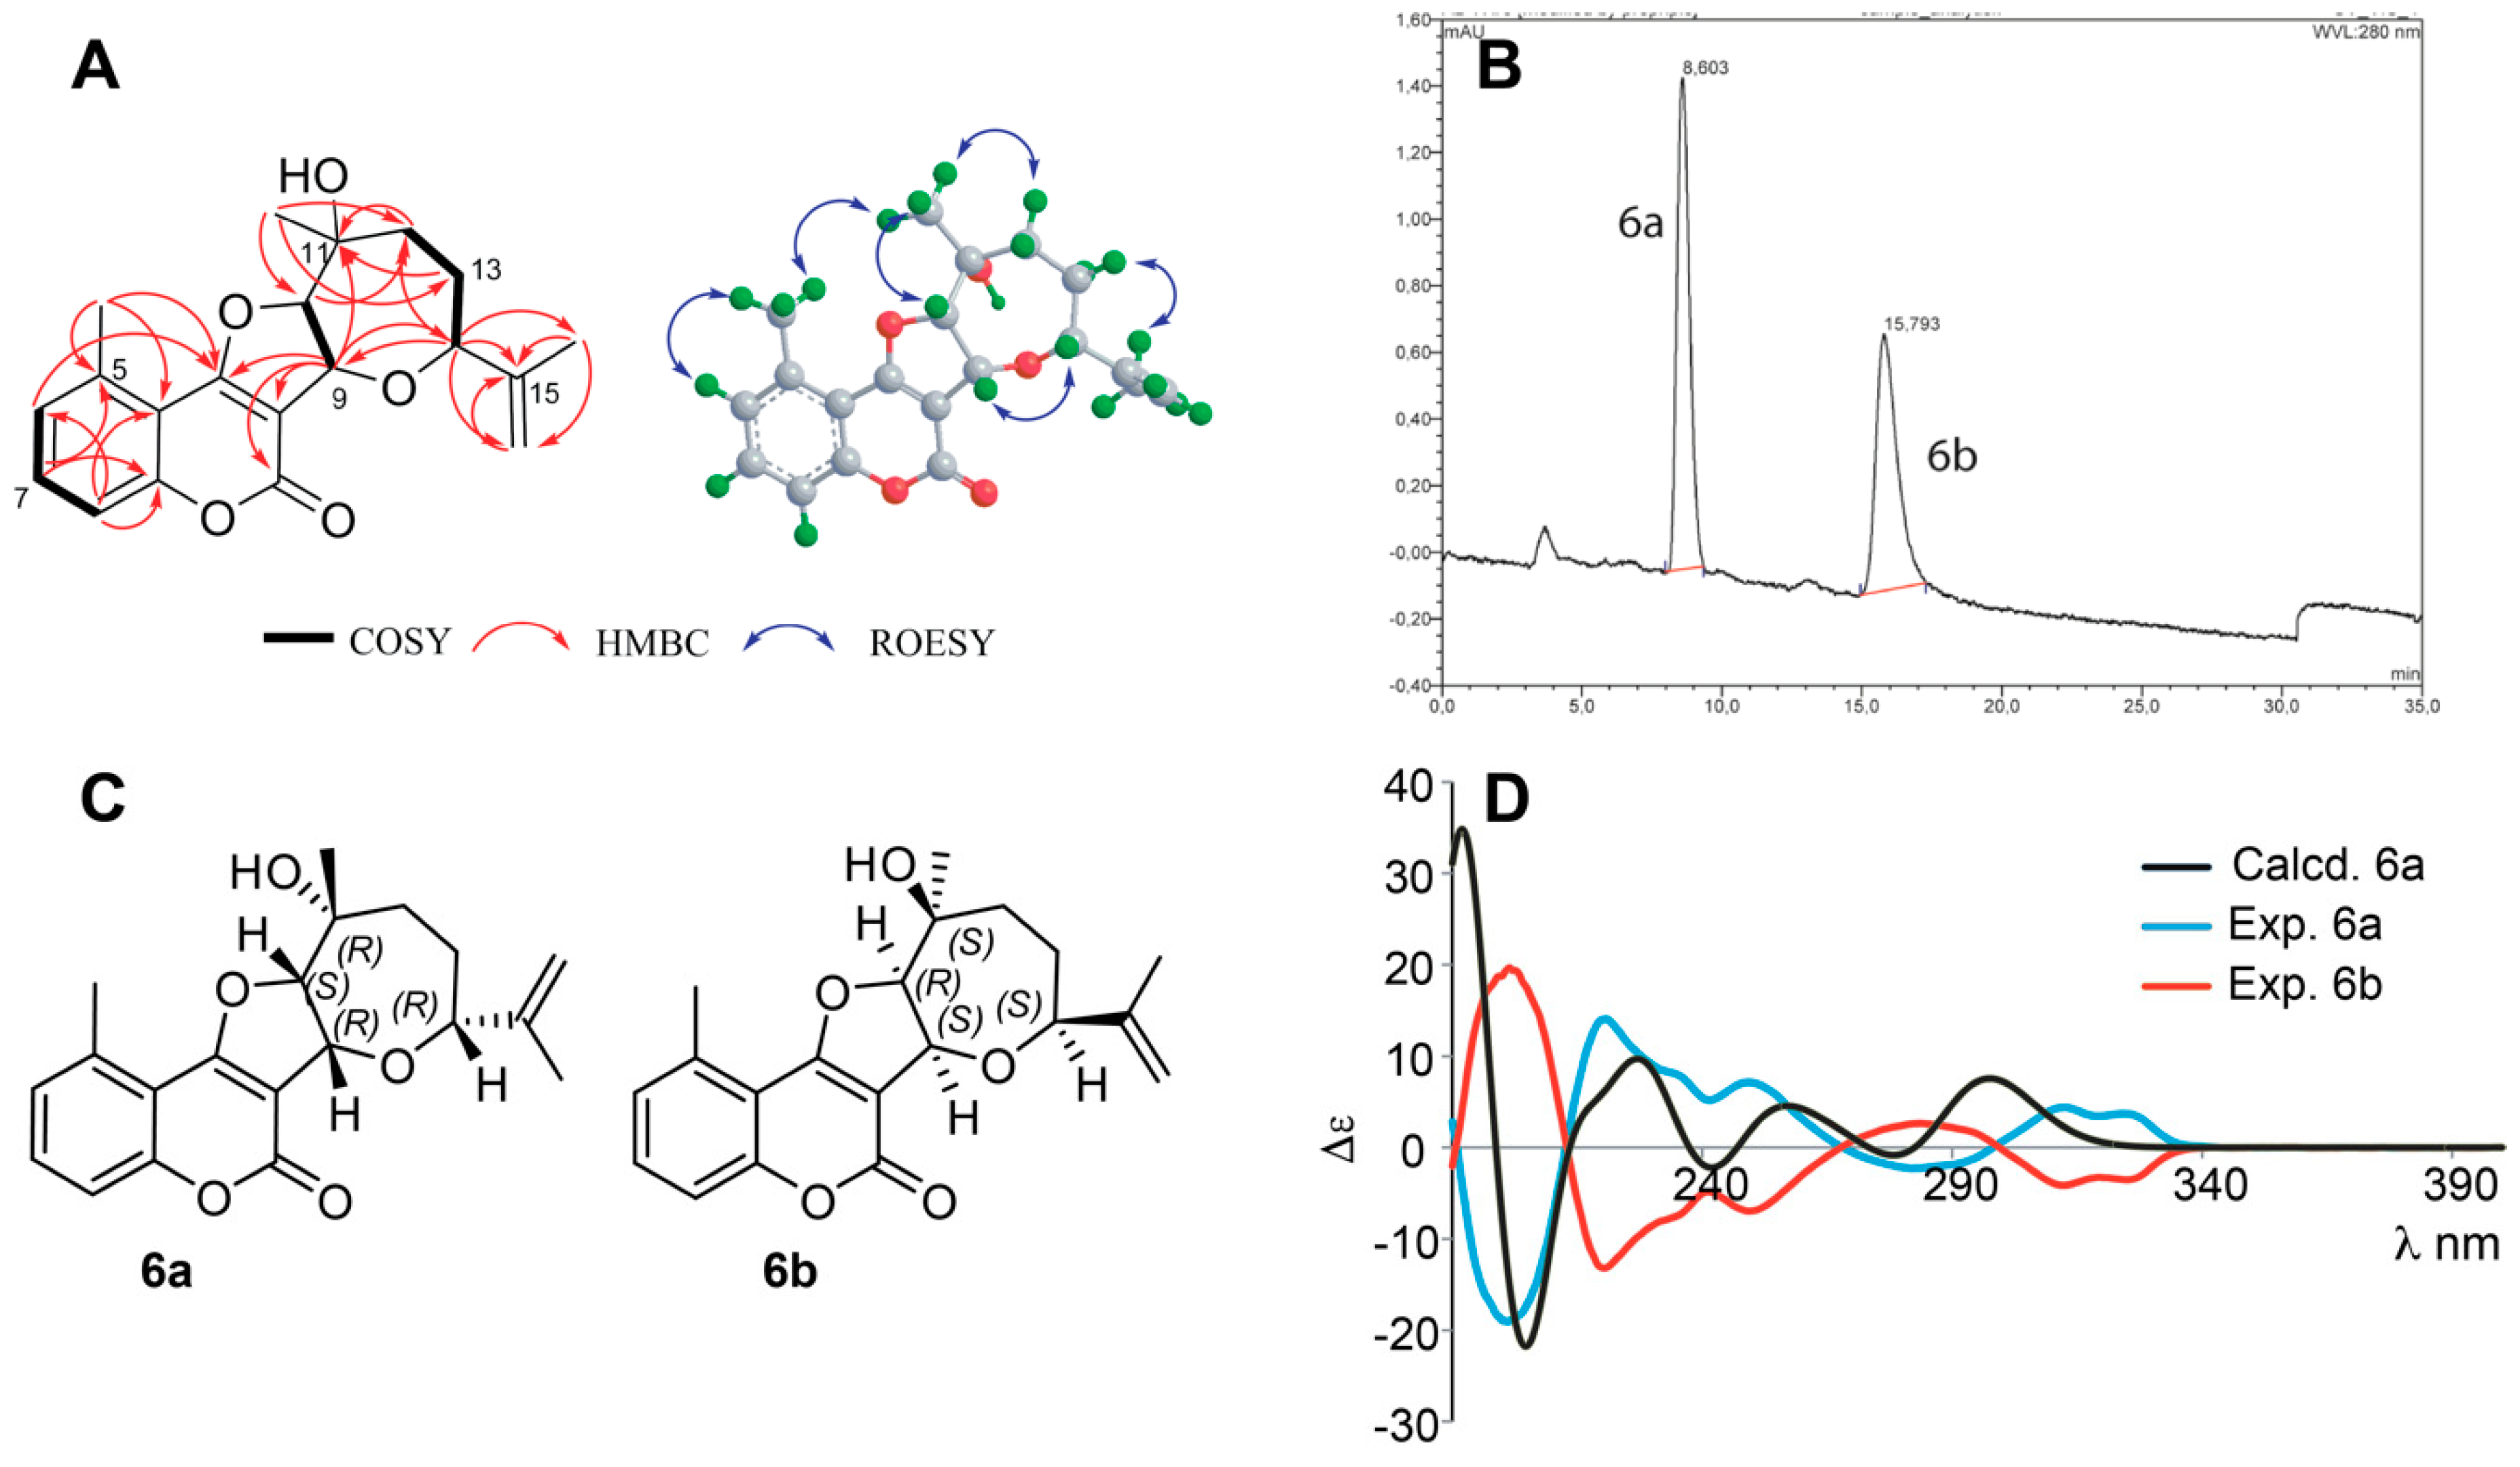
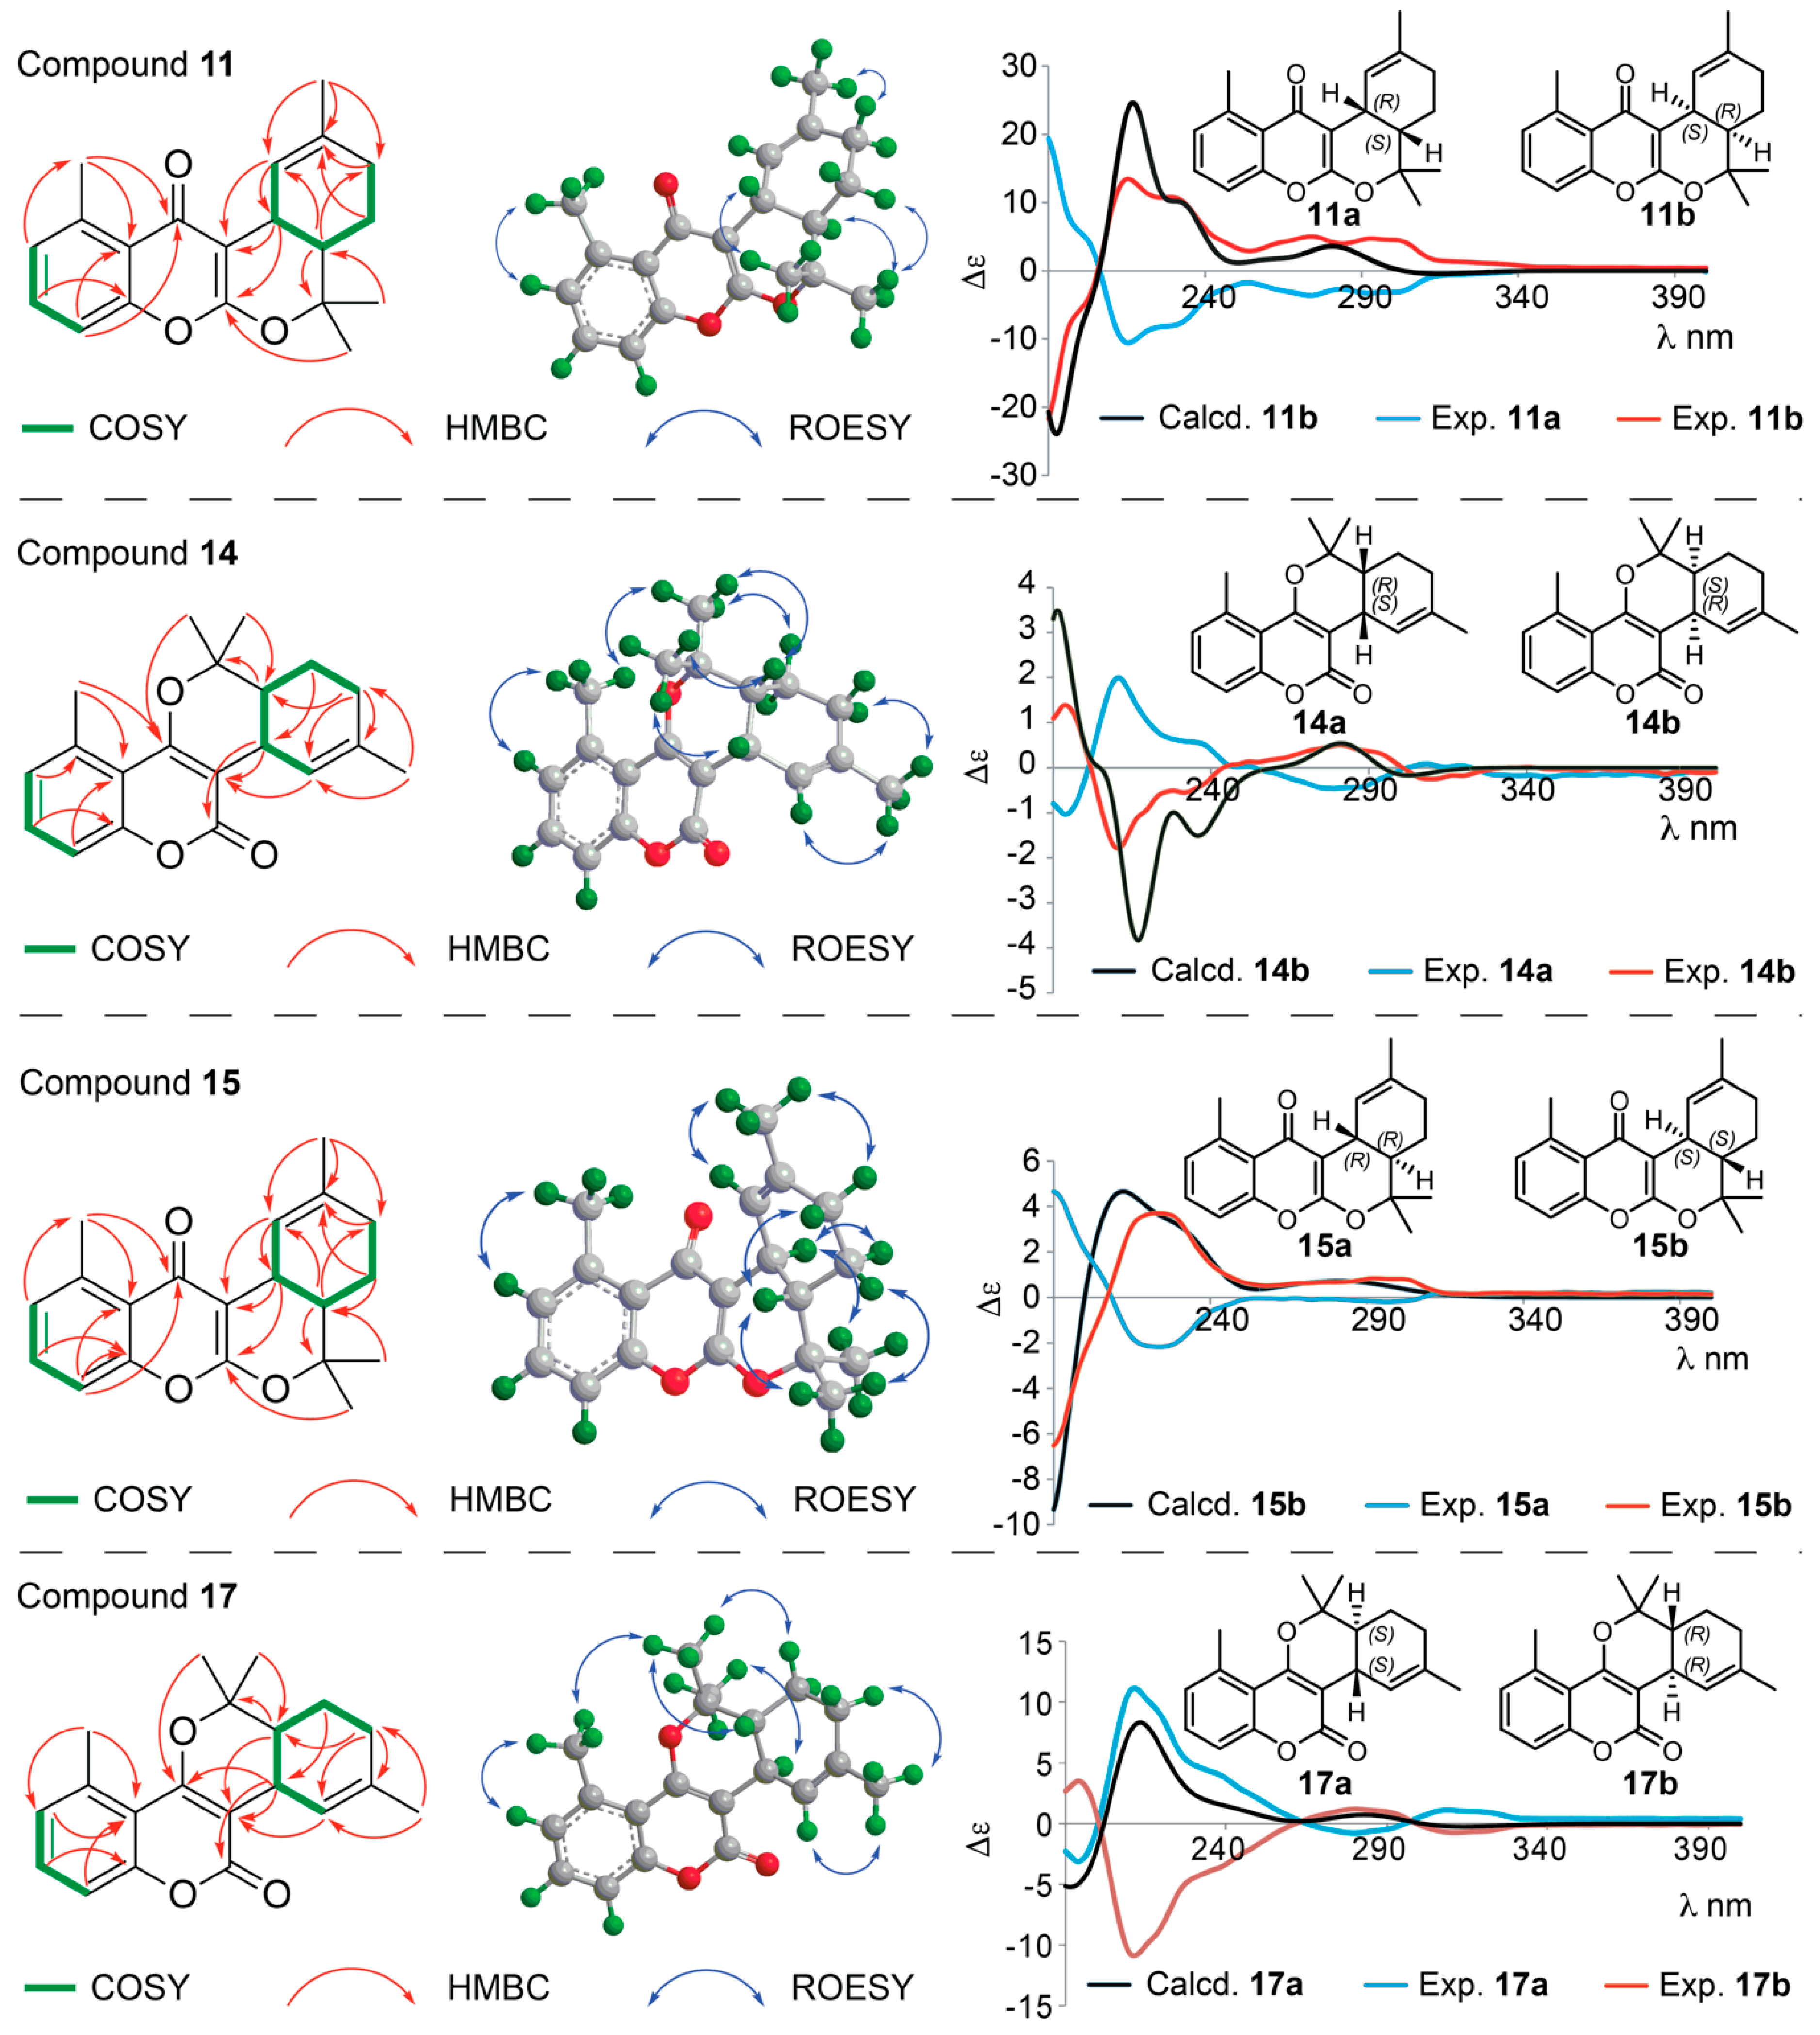
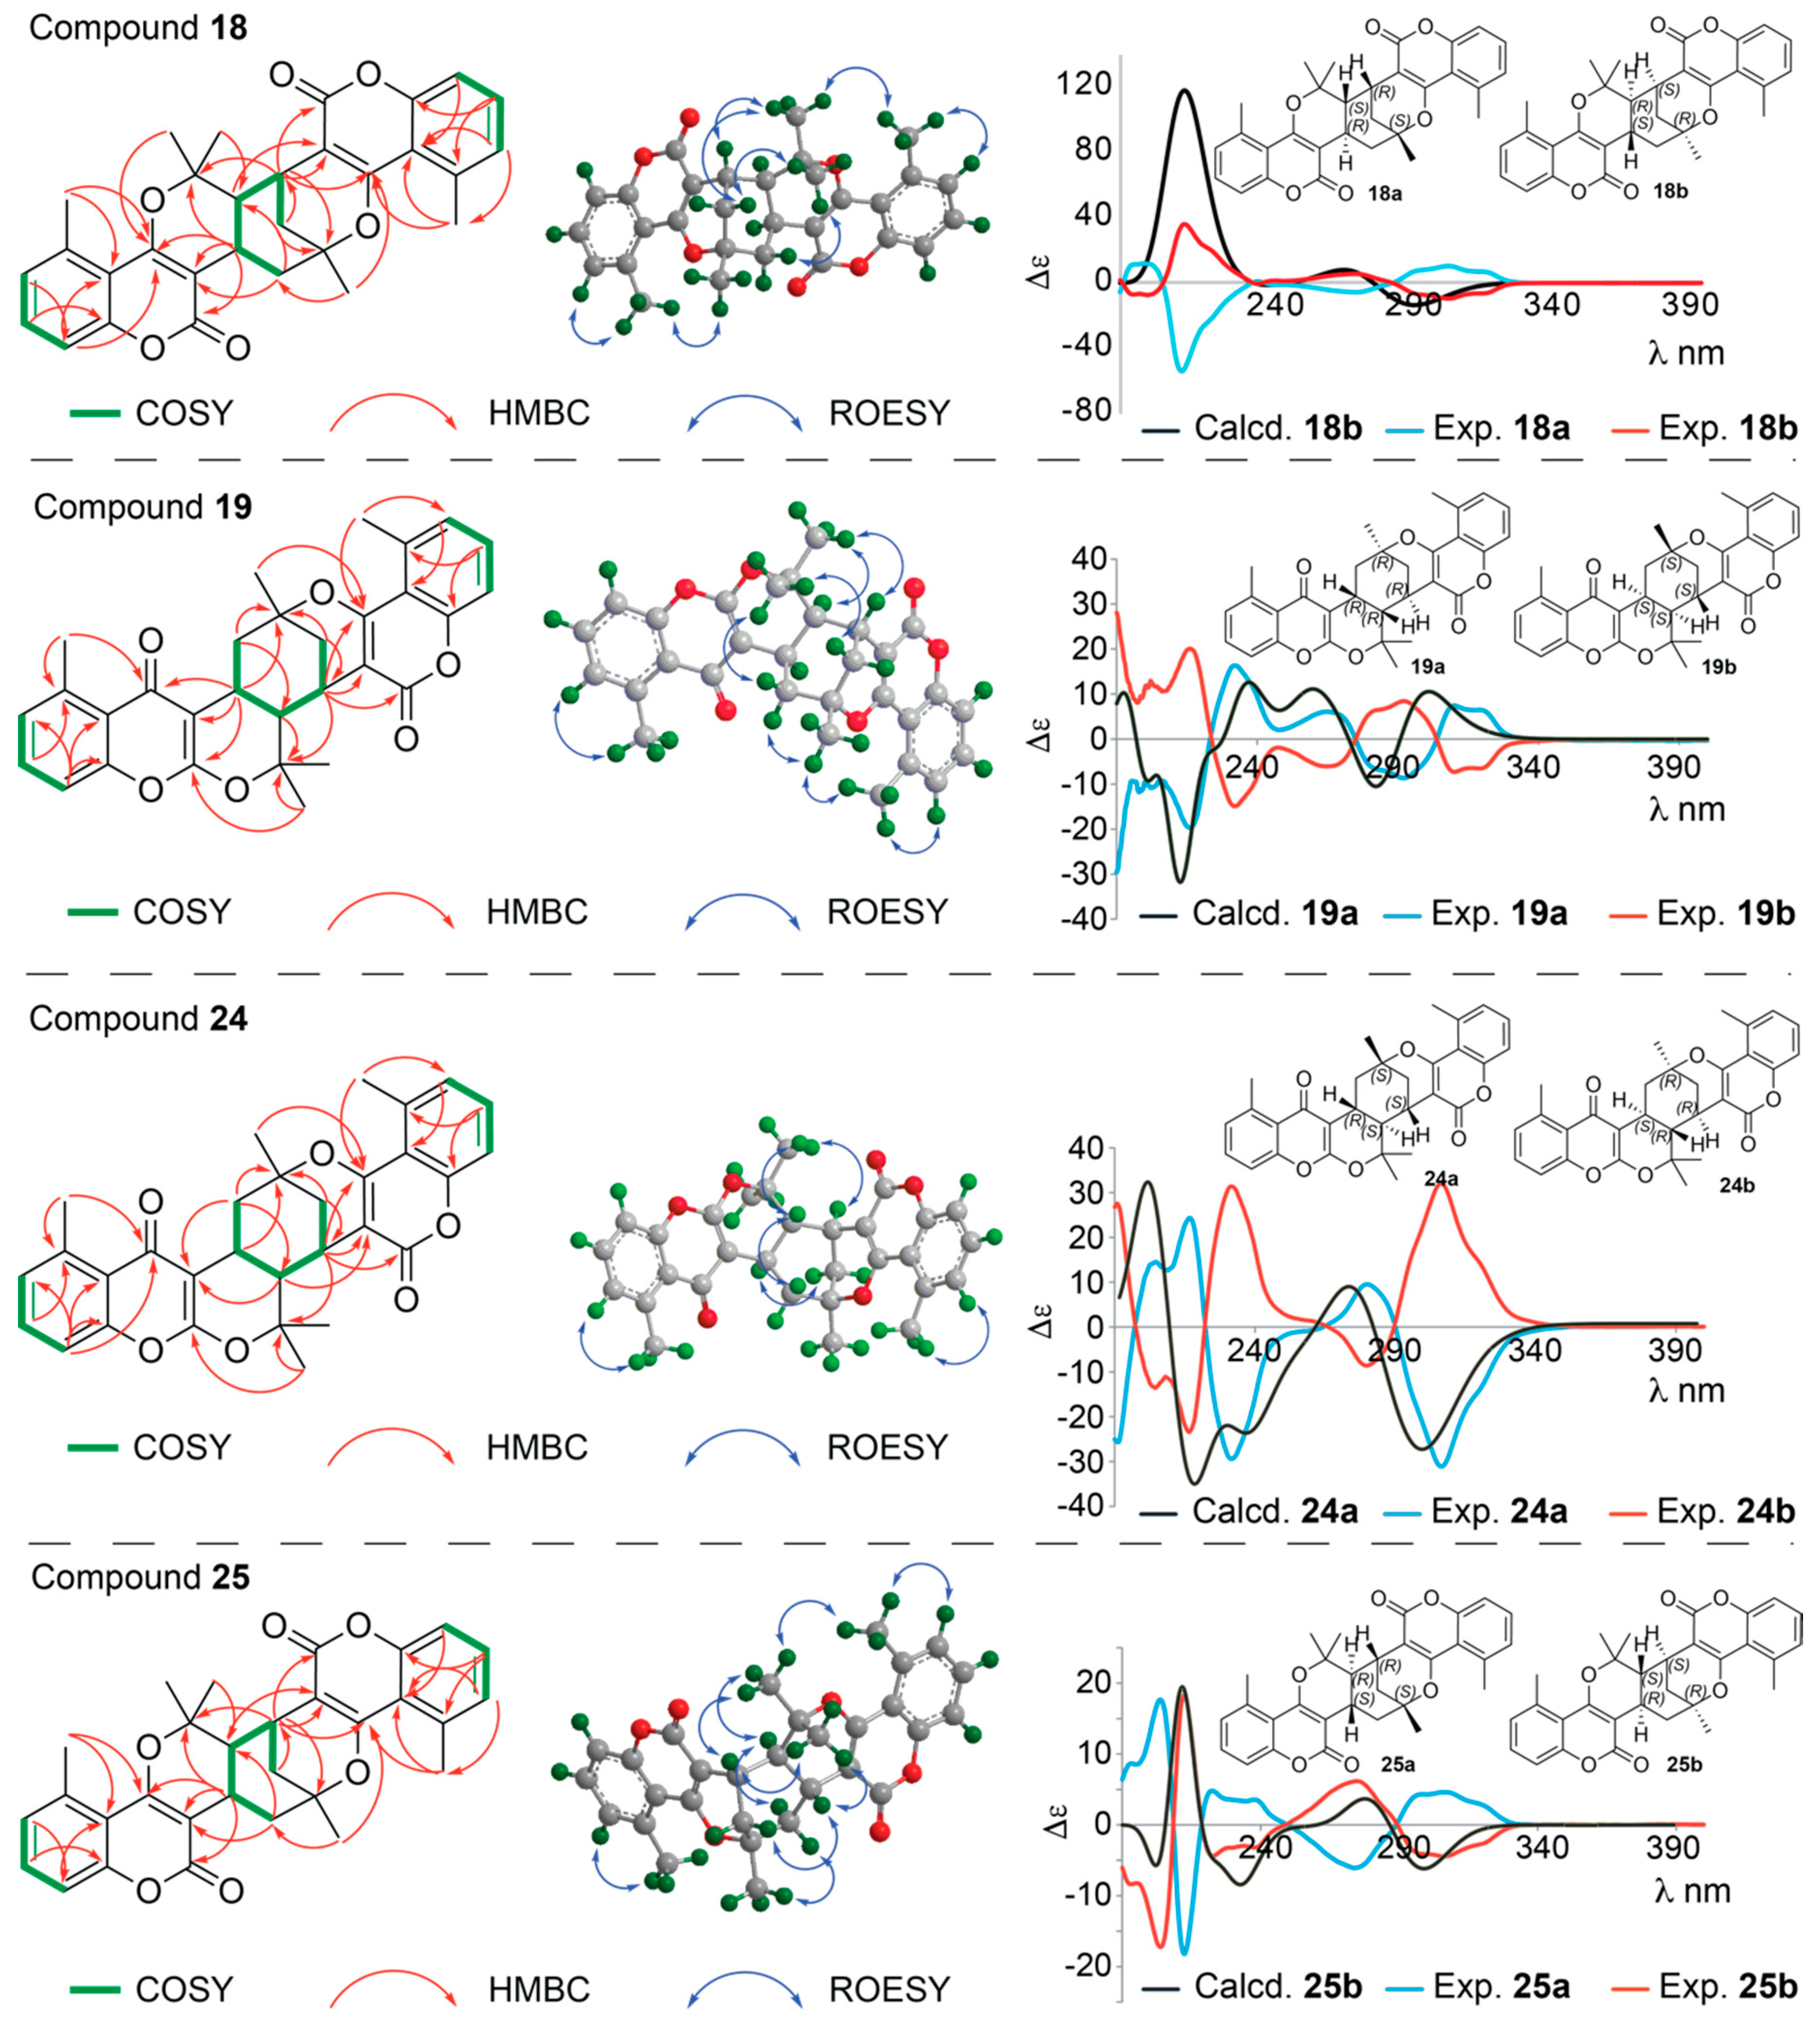
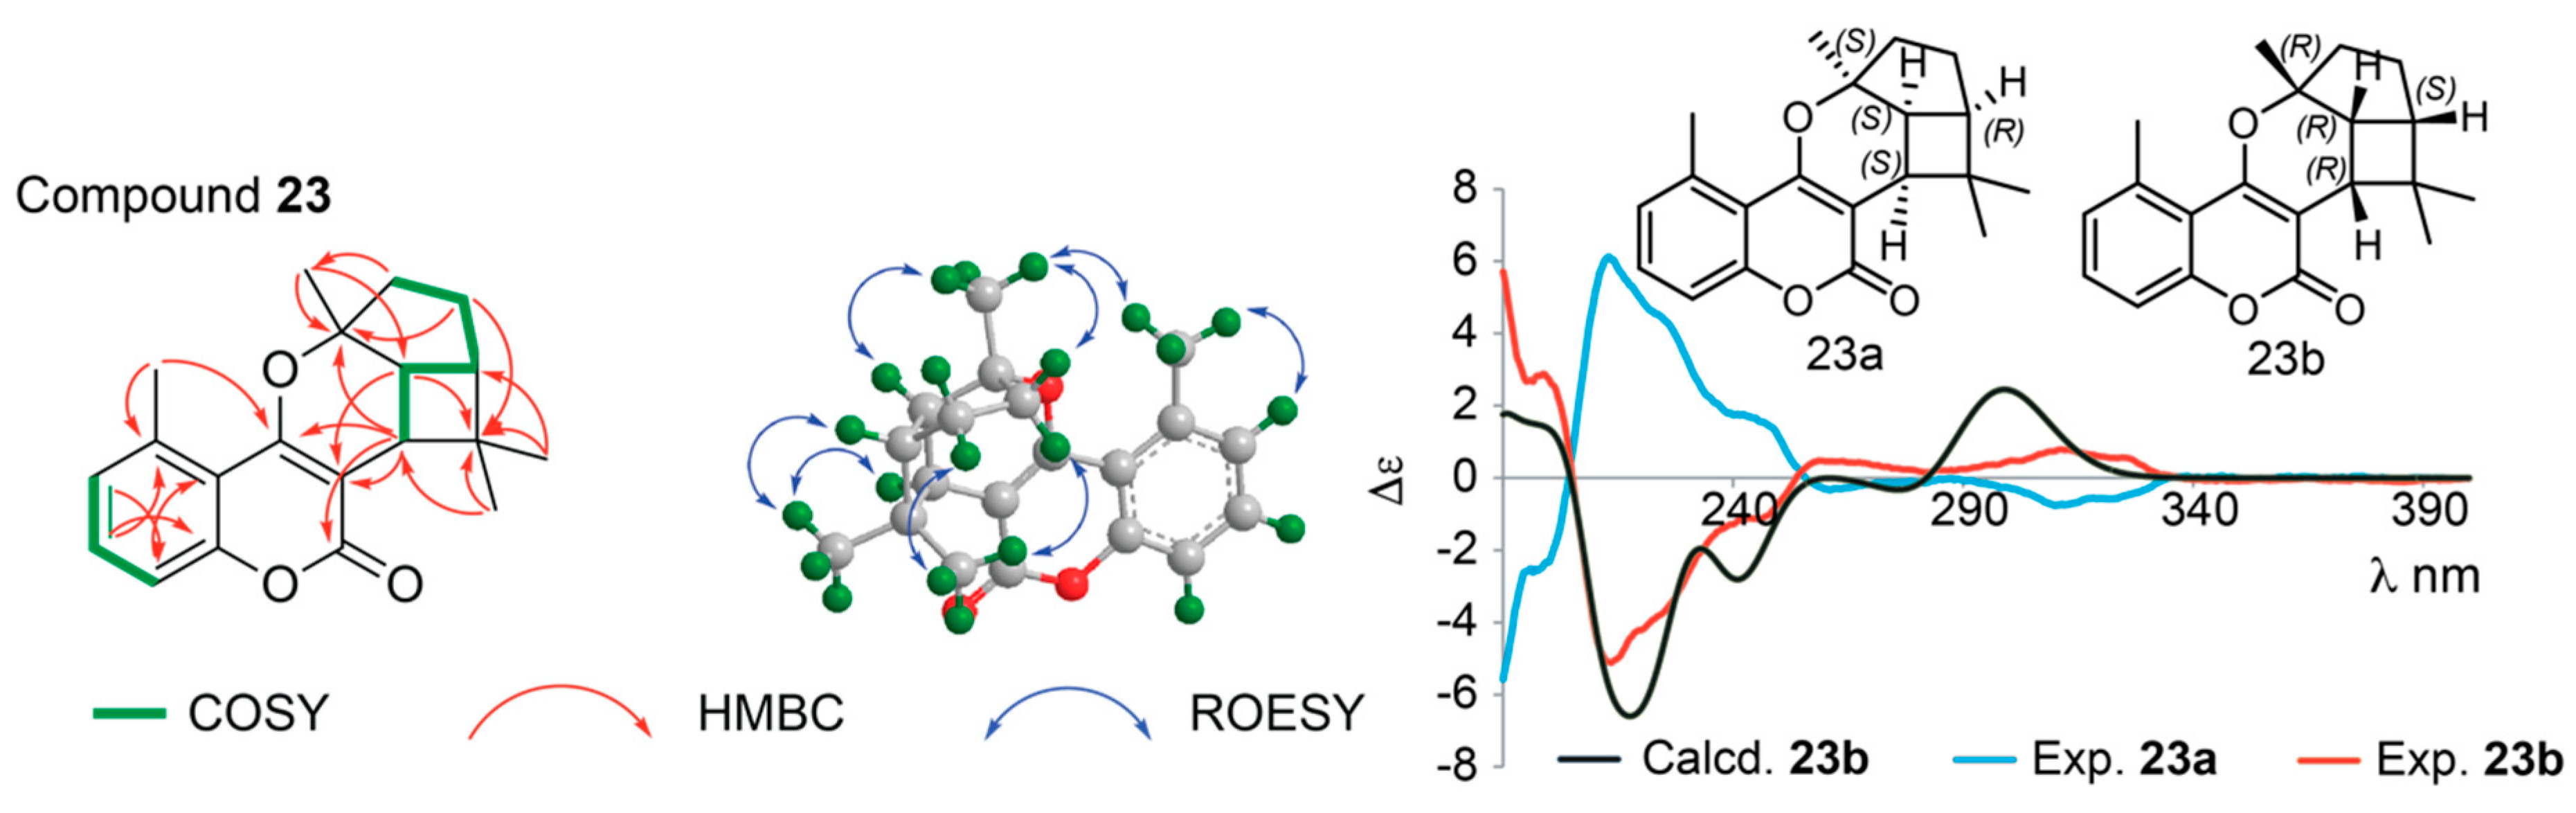
Structure Elucidation of Prenyl- and Geranyl Coumarin Derivatives
3. Materials and Methods
3.1. Plant Material and Extraction Procedure
3.2. Chemicals and Reagents
3.3. LC-PDA-HRMS
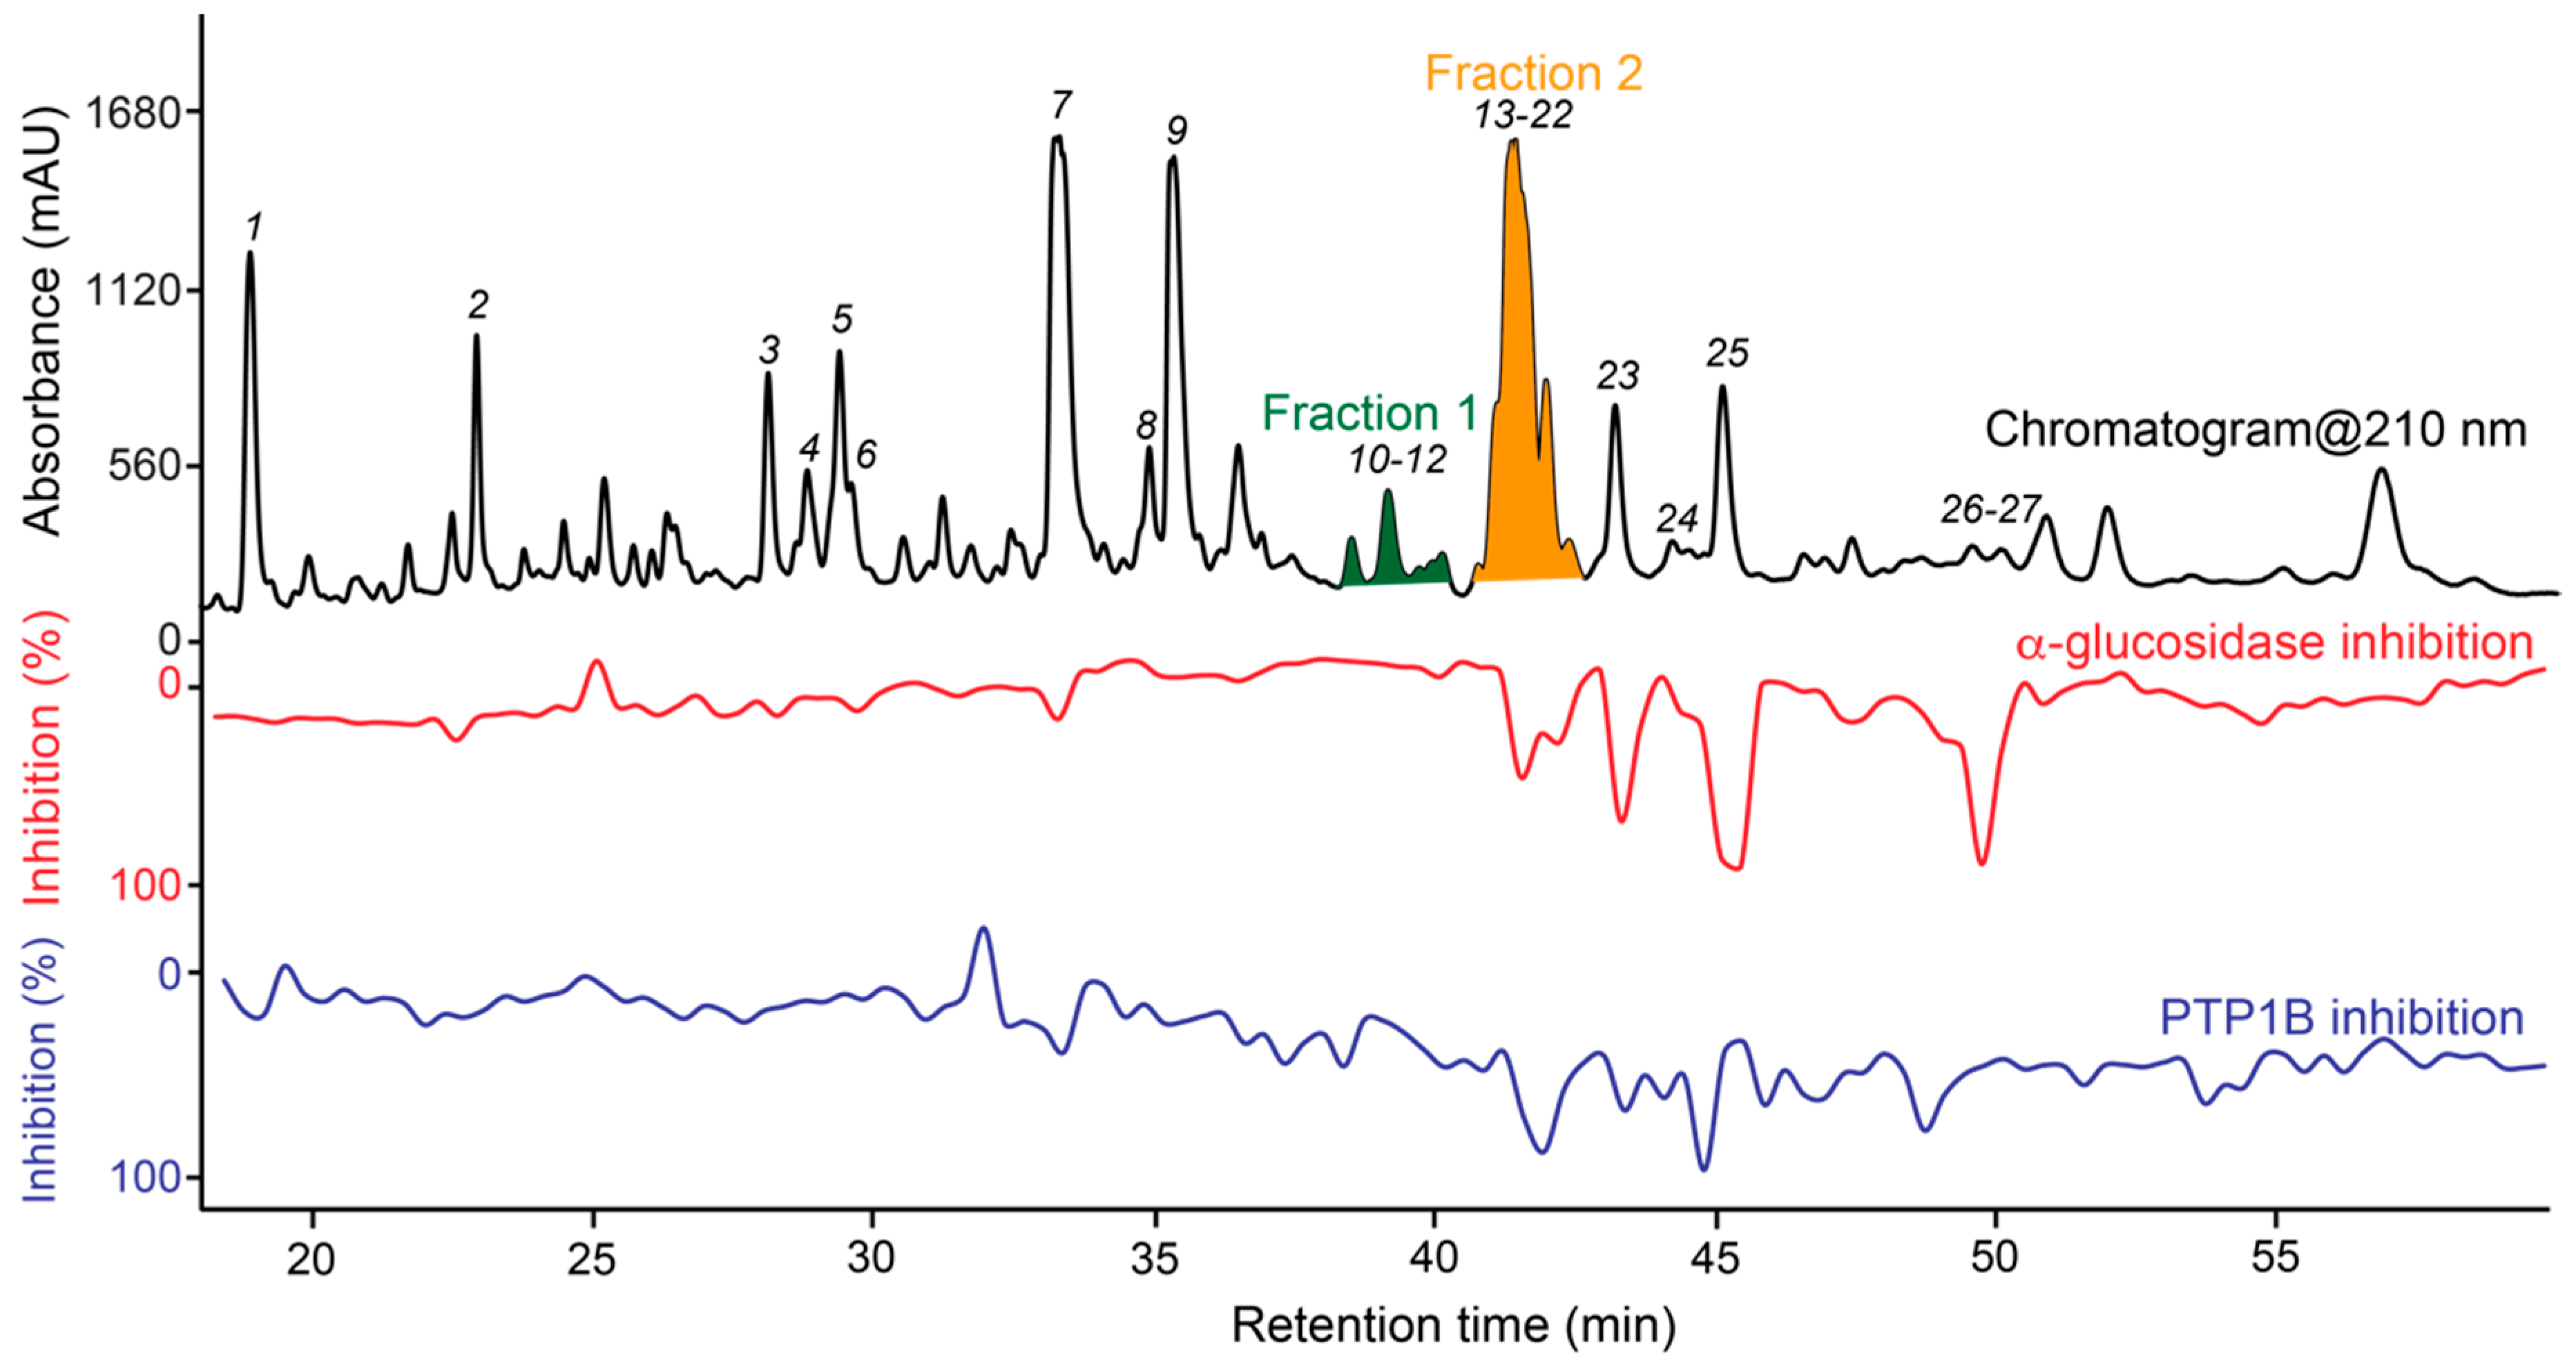
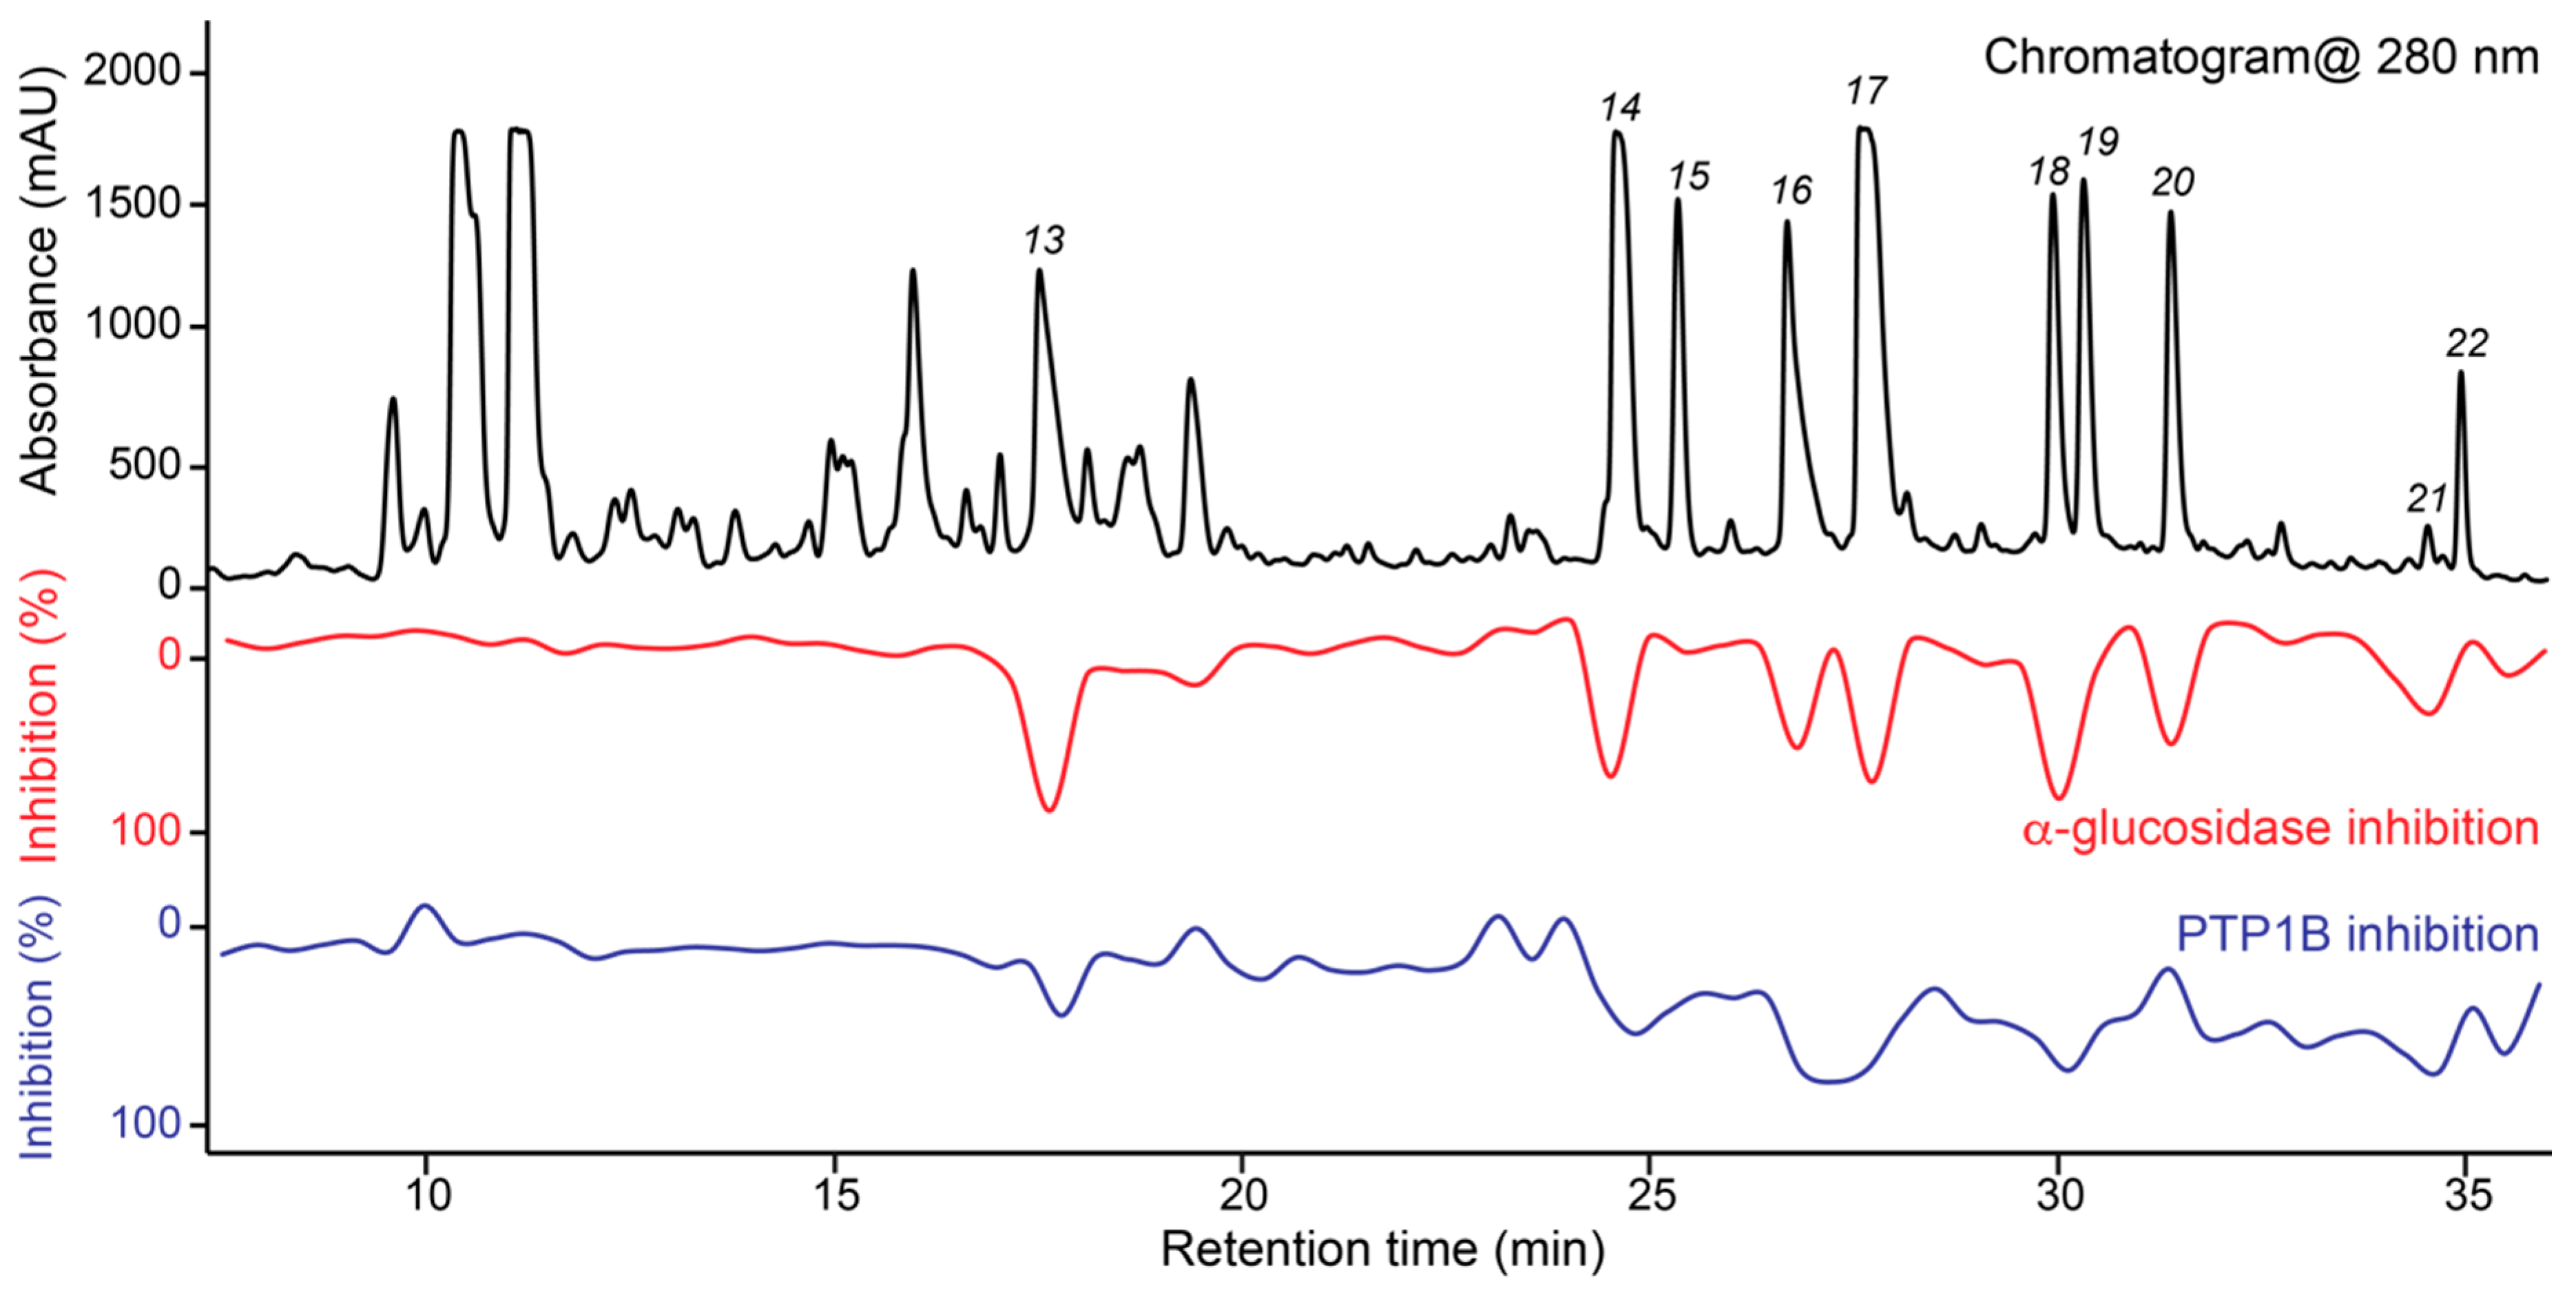
3.4. Dual High-Resolution PTP1B/α-Glucosidase Inhibition Profiling
3.5. Targeted Isolation of PTP1B/α-Glucosidase Inhibitors and Major Metabolites
3.6. Chiral Separation of Enantiomers
3.7. ECD Data Acquisition and Calculations
3.8. NMR Experiments
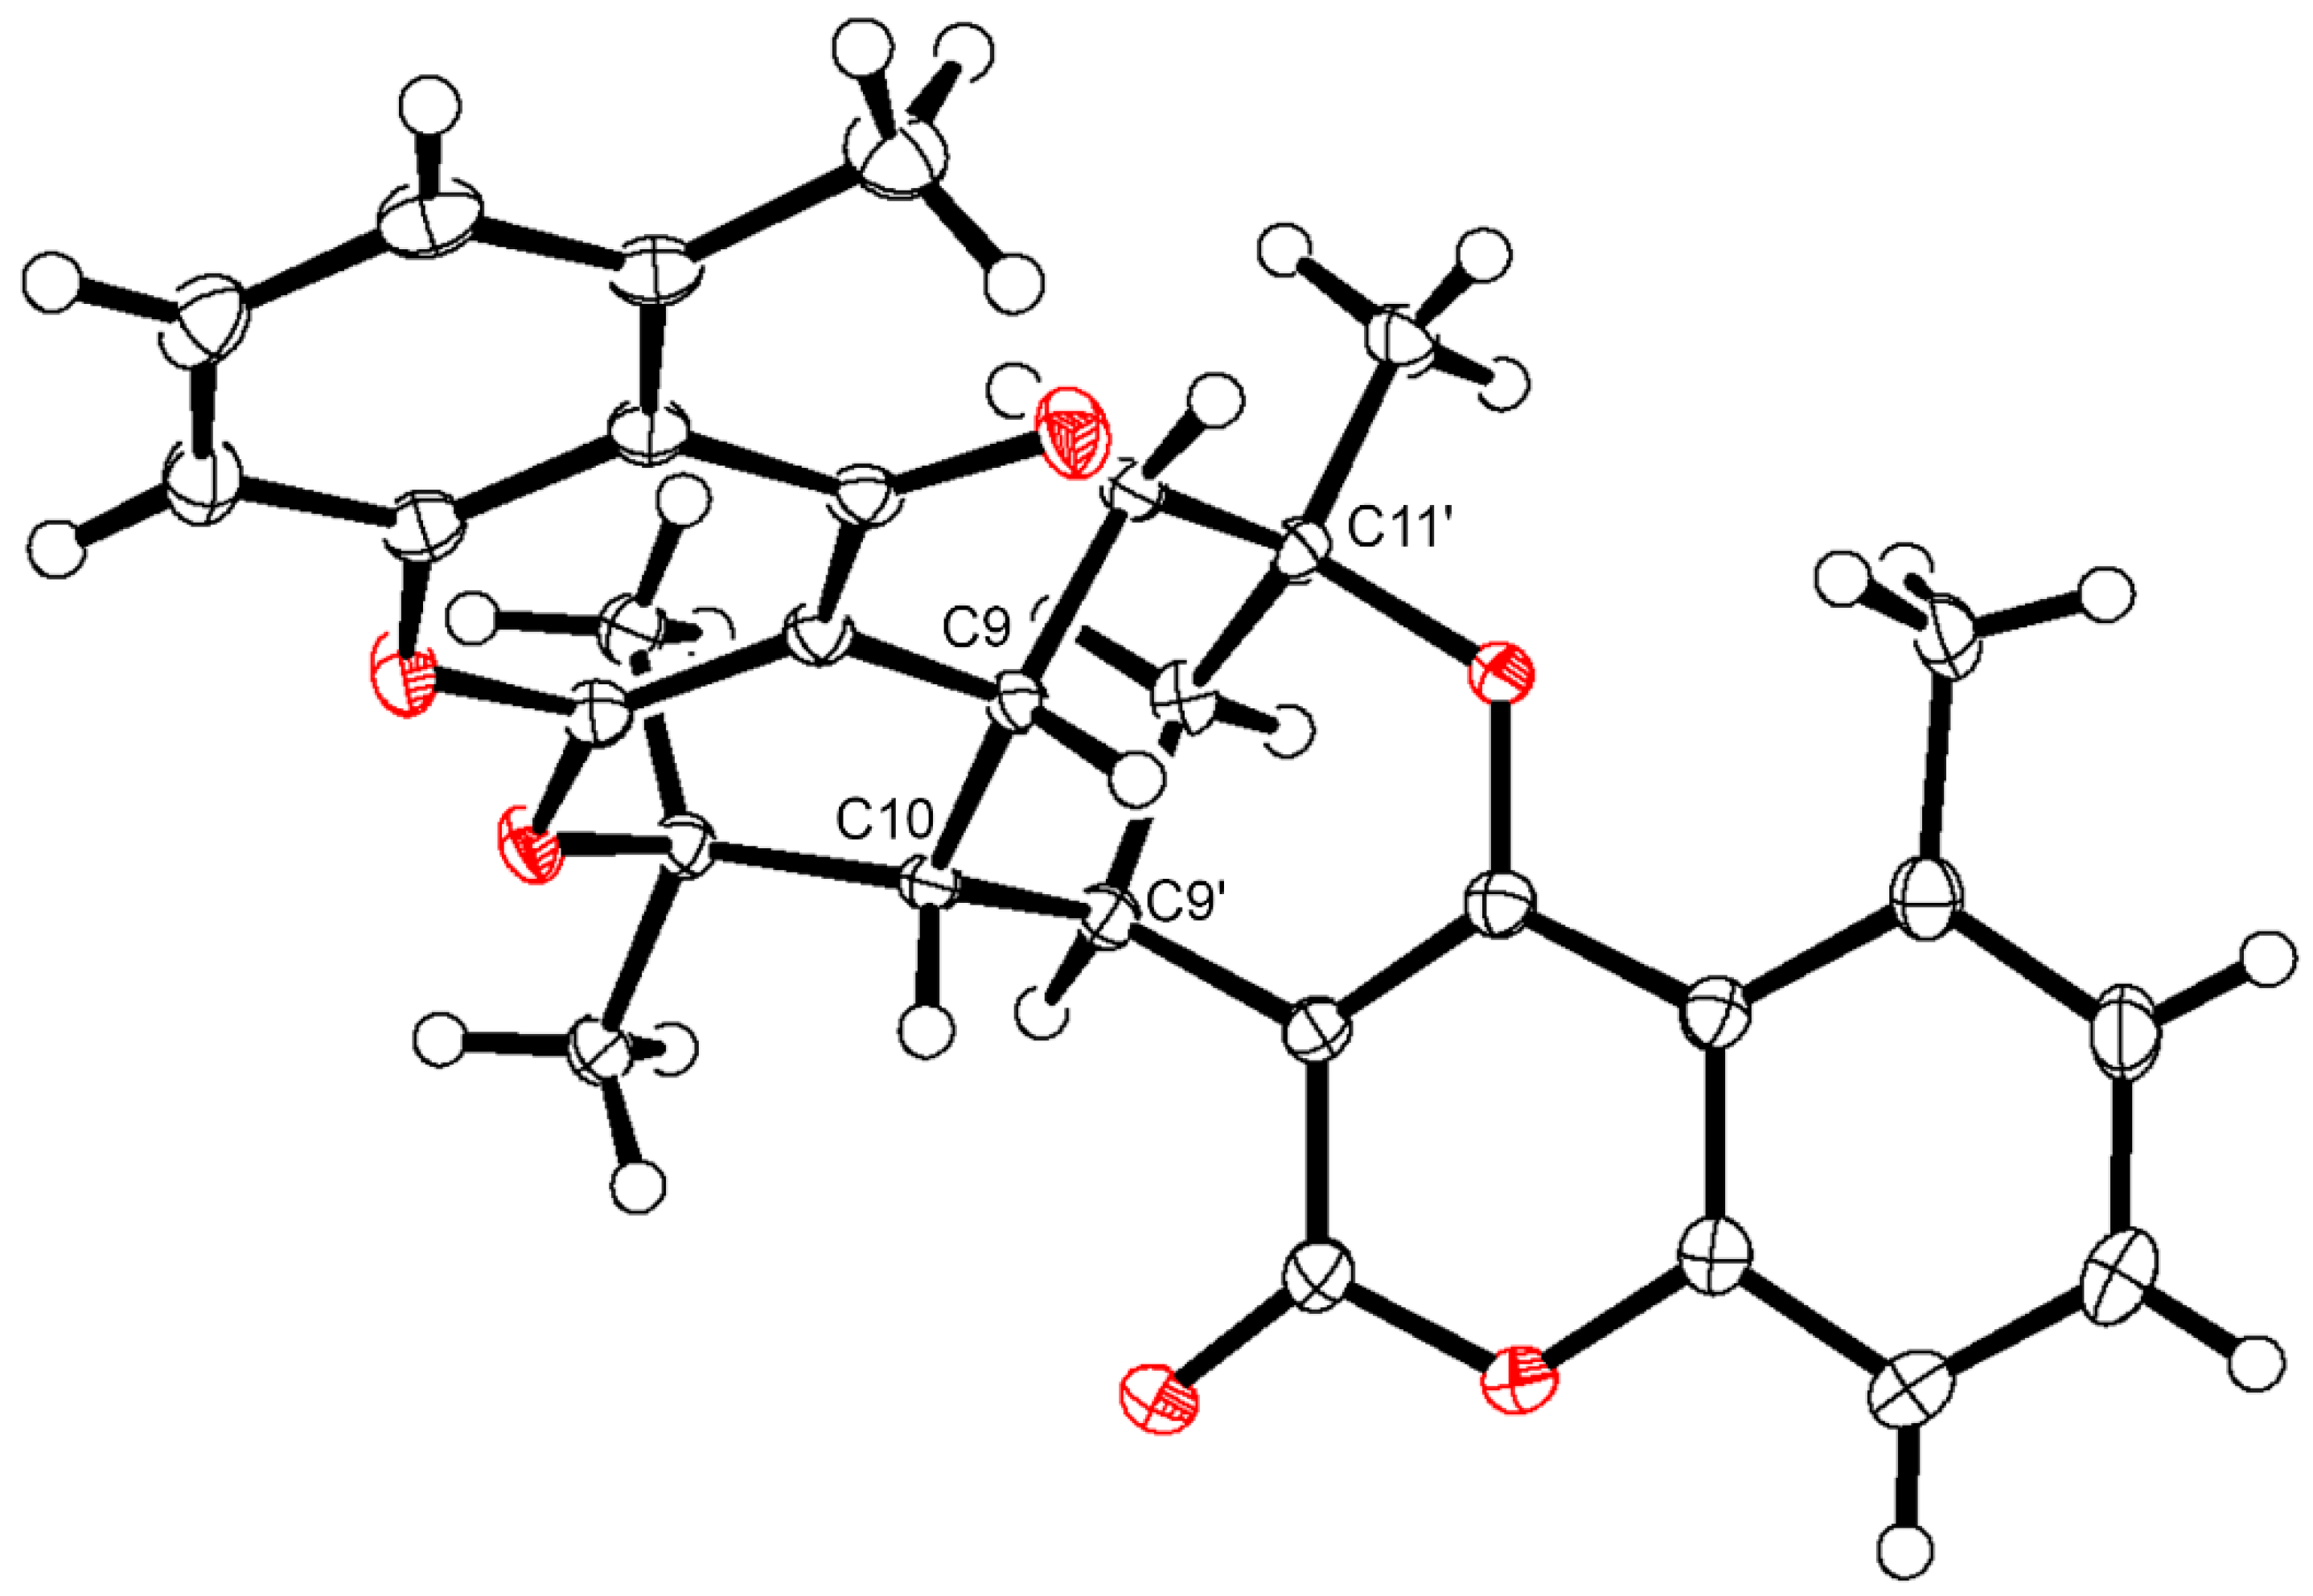
3.9. X-ray Crystallographic Analysis of 19
4. Conclusions
Supplementary Materials
Author Contributions
Funding
Acknowledgments
Conflicts of Interest
References
- International Diabetes Federation. IDF Diabetes Atlas, 9th ed.; International Diabetes Federation: Brussels, Belgium, 2019; ISBN 978-2-930229-87-4. Available online: http://www.diabetesatlas.org/ (accessed on 4 April 2020).
- Chatterjee, S.; Khunti, K.; Davies, M.J. Type 2 diabetes. Lancet 2017, 389, 2239–2251. [Google Scholar] [CrossRef]
- Marcovecchio, M.L.; Lucantoni, M.; Chiarelli, F. Role of chronic and acute hyperglycemia in the development of diabetes complications. Diabetes Technol. Ther. 2011, 13, 389–394. [Google Scholar] [CrossRef]
- Zhang, S.; Zhang, Z.Y. PTP1B as a drug target: Recent developments in PTP1B inhibitor discovery. Drug Discov. Today 2007, 12, 373–381. [Google Scholar] [CrossRef] [PubMed]
- Abdelsalam, S.S.; Korashy, H.M.; Zeidan, A.; Agouni, A. The role of protein tyrosine phosphatase (PTP)-1B in cardiovascular disease and its interplay with insulin resistance. Biomolecules 2019, 9, 286. [Google Scholar] [CrossRef]
- He, Z.X.; Zhou, Z.W.; Yang, Y.; Yang, T.; Pan, S.Y.; Qiu, J.X.; Zhou, S.F. Overview of clinically approved oral antidiabetic agents for the treatment of type 2 diabetes mellitus. Clin. Exp. Pharm. Physiol 2015, 42, 125–138. [Google Scholar] [CrossRef] [PubMed]
- Derosa, G.; Maffioli, P. α-Glucosidase inhibitors and their use in clinical practice. Arch. Med. Sci. 2012, 8, 899–906. [Google Scholar] [CrossRef] [PubMed]
- Jiangsu New Medical College. Dictionary of Traditional Chinese Medicine; Shanghai Science and Technology Publishing House: Shanghai, China, 1977; Volume 114, pp. 1009–1423. [Google Scholar]
- Nagumo, S.; Takao Inoue, K.I.; Nagai, M. Cyanogenic glycosides and 4-hydroxycoumarin glycosides from Gerbera jamesonii hybrida. Chem. Pharm. Bull. 1985, 33, 4803–4806. [Google Scholar] [CrossRef][Green Version]
- Nagumo, S.; Takao Inoue, T.T.; Nagai, M. New glucosides of a 4-hydroxy-5-methylcoumarin and a dihydro-α-pyrone from Gerbera jamesonii hybrida. Chem. Pharm. Bull. 1989, 37, 2621–2623. [Google Scholar] [CrossRef]
- Xiao, Y.; Ding, Y.; Li, J.B.; Nohara, T. Two novel dicoumaro-p-menthanes from Gerbera piloselloides (L.) CASS. Chem. Pharm. Bull. 2004, 52, 1362–1364. [Google Scholar] [CrossRef]
- Liu, S.Z.; Feng, J.-Q.; Wu, J.; Zhao, W.M. A new monoterpene-coumarin and a new monoterpene-chromone from Gerbera delavayi. Helv. Chim. Acta 2010, 93, 2026–2029. [Google Scholar] [CrossRef]
- Qiang, Y.; Chen, Y.J.; Li, Y.; Zhao, J.; Gao, K. Coumarin derivatives from Gerbera saxatilis. Planta Med. 2011, 77, 175–178. [Google Scholar] [CrossRef] [PubMed]
- He, F.; Wang, M.; Gao, M.; Zhao, M.; Bai, Y.; Zhao, C. Chemical composition and biological activities of Gerbera anandria. Molecules 2014, 19, 4046–4057. [Google Scholar] [CrossRef] [PubMed]
- Wang, J.; Petrova, V.; Wu, S.B.; Zhu, M.; Kennelly, E.J.; Long, C. Antioxidants from Gerbera piloselloides: An ethnomedicinal plant from southwestern China. Nat. Prod. Res. 2014, 28, 2072–2075. [Google Scholar] [CrossRef] [PubMed]
- Brahmachari, G.; Da, S.; Kumar, A.; Misra, N.; Sharma, S.; Gupta, V.K. Structural confirmation, single X-ray crystallographic behavior, molecular docking and other physico-chemical properties of gerberinol, a natural dimethyl dicoumarol from Gerbera lanuginosa Benth. (Compositae). J. Mol. Struct. 2017, 1136, 214–221. [Google Scholar] [CrossRef]
- Cesar, G.Z.; Alfonso, M.G.; Marius, M.M.; Elizabeth, E.M.; Angel, C.B.; Maira, H.R.; Guadalupe, C.L.; Manuel, J.E.; Ricardo, R.C. Inhibition of HIV-1 reverse transcriptase, toxicological and chemical profile of Calophyllum brasiliense extracts from Chiapas, Mexico. Fitoterapia 2011, 82, 1027–1034. [Google Scholar] [CrossRef] [PubMed]
- Ali, M.Y.; Jannat, S.; Jung, H.A.; Jeong, H.O.; Chung, H.Y.; Choi, J.S. Coumarins from Angelica decursiva inhibit alpha-glucosidase activity and protein tyrosine phosphatase 1B. Chem. Biol. Interact 2016, 252, 93–101. [Google Scholar] [CrossRef]
- Bohlmann, F.; Grenz, M. Natürlich vorkommende cumarin-derivate, XI. Über die inhaltsstoffe von Gerbera piloselloides Cass. Chem. Ber. 1975, 108, 26–30. [Google Scholar] [CrossRef]
- Schmidt, J.S.; Lauridsen, M.B.; Dragsted, L.O.; Nielsen, J.; Staerk, D. Development of a bioassay-coupled HPLC-SPE-ttNMR platform for identification of α-glucosidase inhibitors in apple peel (Malus × domestica Borkh.). Food Chem. 2012, 135, 1692–1699. [Google Scholar] [CrossRef]
- Okutan, L.; Kongstad, K.T.; Jäger, A.K.; Staerk, D. High-resolution α-amylase assay combined with high-performance liquid chromatography–solid-phase extraction–nuclear magnetic resonance spectroscopy for expedited identification of α-amylase inhibitors: Proof of concept and α-amylase inhibitor in cinnamon. J. Agric. Food Chem. 2014, 62, 11465–11471. [Google Scholar] [CrossRef]
- Tahtah, Y.; Kongstad, K.T.; Wubshet, S.G.; Nyberg, N.T.; Jønsson, L.H.; Jäger, A.K.; Qinglei, S.; Staerk, D. Triple aldose reductase/α-glucosidase/radical scavenging high-resolution profiling combined with high-performance liquid chromatography–high-resolution mass spectrometry–solid-phase extraction–nuclear magnetic resonance spectroscopy for identification of antidiabetic constituents in crude extract of Radix Scutellariae. J. Chromatogr. A 2015, 1408, 125–132. [Google Scholar]
- Tahtah, Y.; Wubshet, S.G.; Kongstad, K.T.; Heskes, A.M.; Pateraki, I.; Møller, B.M.; Jäger, A.K.; Staerk, D. High-resolution PTP1B inhibition profiling combined with high-performance liquid chromatography-high-resolution mass spectrometry-solid-phase extraction-nuclear magnetic resonance spectroscopy: Antidiabetic constituents in crude extract of Eremophila lucida. Fitoterapia 2016, 110, 52–58. [Google Scholar] [PubMed]
- Wiese, S.; Wubshet, S.G.; Nielsen, J.; Staerk, D. Coupling HPLC-SPE-NMR with a microplate-based high-resolution antioxidant assay for efficient analysis of antioxidants in food – Validation and proof-of-concept study with caper buds. Food Chem. 2013, 141, 4010–4018. [Google Scholar] [CrossRef] [PubMed]
- Li, T.; Kongstad, K.T.; Staerk, D. Identification of α-glucosidase inhibitors in Machilus litseifolia by combined use of high-resolution α-glucosidase inhibition profiling and HPLC-PDA-HRMS-SPE-NMR. J. Nat. Prod. 2019, 82, 249–258. [Google Scholar] [CrossRef] [PubMed]
- Lima, R.C.L.; Kato, L.; Kongstad, K.T.; Staerk, D. Brazilian insulin plant as a bifunctional food: Dual high-resolution PTP1B and α-glucosidase inhibition profiling combined with HPLC-HRMS-SPE-NMR for identification of antidiabetic compounds in Myrcia rubella Cambess. J. Funct. Food 2018, 45, 444–451. [Google Scholar] [CrossRef]
- Zhao, Y.; Kongstad, K.T.; Jäger, A.K.; Nielsen, J.; Staerk, D. Quadruple high-resolution α-glucosidase/α-amylase/PTP1B/radical scavenging profiling combined with high-performance liquid chromatography-high-resolution mass spectrometry-solid-phase extraction-nuclear magnetic resonance spectroscopy for identification of antidiabetic constituents in crude root bark of Morus alba L. J. Chromatogr. A 2018, 1556, 55–63. [Google Scholar] [PubMed]
- Trumble, J.T.; Millar, J.G. Biological activity of marmesin and demethylsuberosin against a generalist herbivore, Spodoptera exigua (Lepidoptera: Noctuidae). J. Agric. Food Chem. 1996, 44, 2859–2864. [Google Scholar] [CrossRef]
- Chen, Y.J.; Li, Y.; Chen, J.J.; Gao, K. Benzofuran derivatives from Gerbera saxatilis. Helv. Chim. Acta 2007, 90, 176–182. [Google Scholar] [CrossRef]
- Garc, S.K.; Gupta, S.R.; Sharma, N.D. Coumarins from Apium graveolens seeds. Phytochemistry 1979, 18, 1580–1581. [Google Scholar] [CrossRef]
- Appendino, G.; Cravotto, G.; Giovenzana, G.B.; Palmisano, G. A straightforward entry into polyketide monoprenylated furanocoumarins and pyranocoumarins. J. Nat. Prod. 1999, 62, 1627–1631. [Google Scholar] [CrossRef]
- Bohlmann, F.; Zdero, C.; Frunke, H. Uber die inhaltsstoffe der gattung Gerbera. Chem. Ber. 1973, 106, 382–387. [Google Scholar] [CrossRef]
- Bohlmann, F.; Grenz, M. Uber die inhaltsstoffe der gattung Flourensia. Chem. Ber. 1977, 110, 295–300. [Google Scholar] [CrossRef]
- Viturro, C.I.; Fuente, J.R.; Maier, M.S. Antifungal methylphenone derivatives and 5-methylcoumarins from Mutisia friesiana. Z. Nat. C 2003, 58, 533–540. [Google Scholar] [CrossRef] [PubMed]
- Lou, H.X.; Sun, L.R.; Yu, W.T.; Fan, P.H.; Cui, L.; Gao, Y.H.; Ma, B.; Ren, D.M.; Ji, M. Absolute configuration determination of angular dihydrocoumarins from Peucedanum praeruptorum. J. Asian Nat. Prod. Res. 2004, 6, 177–184. [Google Scholar] [CrossRef] [PubMed]
- Bohlmann, F.; Zdero, C.; Le Van, N. Neue geranyl-cumarin-derivate und weitere inhaltsstoffe aus der tribus Mutisieae. Phytochemistry 1979, 18, 99–102. [Google Scholar] [CrossRef]
- Marzocco, S.; Adesso, S.; Alilou, M.; Stuppner, H.; Schwaiger, S. Anti-inflammatory and anti-oxidant potential of the root extract and constituents of Doronicum austriacum. Molecules 2017, 22, 1003. [Google Scholar] [CrossRef]
- Shanmugasundaram, M.; Manikandan, S.; Raghunathan, R. High chemoselectivity in microwave accelerated intramolecular domino Knoevenagel hetero Diels-Alder reactions—An efficient synthesis of pyrano[3-2c]coumarin framework. Tetrahedron 2002, 58, 997–1003. [Google Scholar] [CrossRef]
- Farrugia, L.J. ORTEP-3 for Windows—A version of ORTEP-III with a graphical user interface (GUI). J. Appl. Crystallogr. 1997, 30, 565. [Google Scholar] [CrossRef]
- Rashid, M.A.; Armstrong, J.A.; Gray, A.I.; Waterman, P.G. Tetra- and pentacyclic 6-C-monoterpenyl-5,7-dioxycoumarins from Eriostemon brucei and E. brucei subspecies cinereus. Phytochemistry 1992, 31, 3583–3588. [Google Scholar] [CrossRef]
- Huang, G.H.; Hu, Z.; Lei, C.; Wang, P.P.; Yang, J.; Li, J.Y.; Li, J.; Hou, A.J. Enantiomeric pairs of meroterpenoids with diverse heterocyclic systems from Rhododendron nyingchiense. J. Nat. Prod. 2018, 81, 1810–1818. [Google Scholar] [CrossRef]
- Pietiainen, M.; Kontturi, J.; Paasela, T.; Deng, X.B.; Ainasoja, M.; Nyberg, P.; Hotti, H.; Teeri, T.H. Two polyketide synthases are necessary for 4-hydroxy-5-methylcoumarin biosynthesis in Gerbera hybrida. Plant J. 2016, 87, 548–558. [Google Scholar] [CrossRef]
- Shoyama, Y.; Takeuchi, A.; Taura, F.; Tamada, T.; Adachi, M.; Kuroki, R.; Shoyama, Y.; Morimoto, S. Crystallization of Delta1-tetrahydrocannabinolic acid (THCA) synthase from Cannabis sativa. Acta Cryst. Sect. F Struct. Biol. Cryst. Commun. 2005, 61, 799–801. [Google Scholar] [CrossRef] [PubMed]
- Li, H.; Tang, Y.; Hsung, R.P. Investigating thermal dimerization of N-methyl-flindersine. Syntheses and characterizations of paraensidimerines. Tetrahedron Lett. 2012, 53, 6138–6143. [Google Scholar] [CrossRef]
- Wubshet, S.G.; Tahtah, Y.; Heskes, A.M.; Kongstad, K.T.; Pateraki, I.; Hamberger, B.; Møller, B.M.; Staerk, D. Identification of PTP1B and α-glucosidase inhibitory serrulatanes from Eremophila spp. by combined use of dual high-resolution PTP1B and α-glucosidase inhibition profiling and HPLC-HRMS-SPE-NMR. J. Nat. Prod. 2016, 79, 1063–1072. [Google Scholar] [CrossRef] [PubMed]
- Pescitelli, G.; Bruhn, T. Good computational practice in the assignment of absolute configurations by TDDFT calculations of ECD spectra. Chirality 2016, 28, 466–474. [Google Scholar] [CrossRef] [PubMed]
- Becke, A.D. Density-functional thermochemistry. III. The role of exact exchange. J. Chem. Phys. 1993, 98, 5648–5652. [Google Scholar] [CrossRef]
- Stephens, P.J.; Devlin, F.J.; Chabalowski, C.F.; Frisch, M.J. Ab initio calculation of vibrational absorption and circular dichroism spectra using density functional force fields. J. Phys. Chem. 1994, 98, 11623–11627. [Google Scholar] [CrossRef]
- Miertuš, S.; Scrocco, E.; Tomasi, J. Electrostatic interaction of a solute with a continuum. A direct utilizaion of ab-initio molecular potentials for the prevision of solvent effects. Chem. Phys. 1981, 55, 117–129. [Google Scholar] [CrossRef]
- Tomasi, J.; Mennucci, B.; Cammi, R. Quantum mechanical continuum solvation models. Chem. Rev. 2005, 105, 2999–3093. [Google Scholar] [CrossRef]
- Warnke, I.; Furche, F. Circular dichroism: Electronic. Wires Comput. Mol. Sci. 2012, 2, 150–166. [Google Scholar] [CrossRef]
- Frisch, M.J.; Trucks, G.W.; Schlegel, H.B.; Scuseria, G.E.; Robb, M.A.; Cheeseman, J.R.; Scalmani, G.; Barone, V.; Petersson, G.A.; Nakatsuji, H.; et al. Gaussian 16 Rev. B.01; Gaussian Inc.: Wallingford, CT, USA, 2016. [Google Scholar]
- Bruhn, T.; Schaumloffel, A.; Hemberger, Y.; Bringmann, G. SpecDis: Quantifying the comparison of calculated and experimental electronic circular dichroism spectra. Chirality 2013, 25, 243–249. [Google Scholar] [CrossRef]
- Sheldrick, G.M. A short history of SHELX. Acta Crystallogr. Sect. A Found. Adv. 2008, 64, 112–122. [Google Scholar] [CrossRef] [PubMed]
- Sheldrick, G.M. Crystal structure refinement with SHELXL. Acta Crystallogr. Sect. C Struct. Chem. 2015, 71, 3–8. [Google Scholar] [CrossRef] [PubMed]
- International Tables for Crystallography; Wilson, A.J.C., Ed.; Kluwer Academic Publishers: Dordrecht, The Netherlands, 1995; Volume C. [Google Scholar]
Sample Availability: Not available. |


| Pos. | δH (J, in Hz) | Pos. | δH (J, in Hz) | ||
|---|---|---|---|---|---|
| 2 | 6 | 10 | 5 | ||
| 6 | 7.12, d (7.4 Hz) | 7.26, d (8.4 Hz) | 6.99, d (7.5 Hz) | 3 | 5.76, d (9.8 Hz) |
| 7 | 7.45, dd (8.3, 7.4 Hz) | 7.56, dd (8.4, 7.5 Hz) | 7.29, dd (8.3, 7.5 Hz) | 4 | 6.42, d (9.8 Hz) |
| 8 | 7.19, d (8.3 Hz) | 7.20, d (7.5 Hz) | 7.03, d (8.3 Hz) | 5 | 7.56, d (2.1 Hz) |
| 9 | 4.58, d (4.1 Hz) | 5.51, d (7.6 Hz) | 3.83, d (10.5 Hz) | 7 | 7.70, d (2.1 Hz) |
| 10 | 3.75, d (4.1 Hz) | 4.78, d (7.6 Hz) | 5.32, br s | 10 | 2.52, s |
| 11 | 11 | 1.46, s | |||
| 12 | 2.72, s | 1.98, ddd (14, 13.0, 3.3 Hz); 1.80, m | 2.25, m2.02, m | 12 | 1.47, s |
| 13 | 1.52, s | 2.00, m; 1.68, m | 1.77, m | 1′ | 2.95, dd (13.3, 5.5 Hz); 2.68, dd (13.4, 7.8 Hz) |
| 14 | 1.57, s | 3.52, d (10.0 Hz) | 2.96, br s | 2′ | 4.31, dd (7.4, 5.7 Hz) |
| 16 | 4.73b; 4.81b | 4.52, s; 4.54, s | 4′ | 4.76b; 4.83 b | |
| 17 | 1.66, s | 1.68, s | 5′ | 1.81, s | |
| 18 | 2.72, s | 2.76, s | |||
| 19 | 1.58, s | 1.70, s | |||
| Pos. | δC | Pos. | δC | |||||||
|---|---|---|---|---|---|---|---|---|---|---|
| 2 | 6 | 10 | 11 | 14 | 15 | 17 | 23 | 5 | ||
| 2 | 164.7 | 161.4 | 165.5 | 162.6 | 164.1 | 162.7 | 163.9 | 165.2 | 2 | 78.9 |
| 3 | 101.8 | 102.7 | 106.4 | 100.5 | 102.9 | 99.7 | 102.9 | 103.9 | 3 | 132.0 |
| 4 | 163.7 | 171.1 | 171.4 | 182.2 | 162.4 | 181.8 | 163.5 | 163.6 | 4 | 122.8 |
| 4a | 115.5 | 112.2 | 118.6 | 122.3 | 120 | 121 | 116.1 | 116.1 | 4a | 121.7 |
| 5 | 139.0 | 138.5 | 138.8 | 133.0 | 138.0 | 141.3 | 138.2 | 138.1 | 5 | 126.4 |
| 6 | 128.9 | 115.5 | 127.6 | 133.1 | 128.2 | 128.9 | 128.7 | 128.9 | 6 | 130.7 |
| 7 | 132.8 | 133.8 | 130.7 | 128.9 | 131.6 | 133.0 | 132.0 | 132.1 | 7 | 133.1 |
| 8 | 115.9 | 127.5 | 115.1 | 116.2 | 115.4 | 116.3 | 115.7 | 115.9 | 8 | 127.7 |
| 8a | 155.5 | 157.9 | 155.2 | 155.7 | 154.9 | 155.8 | 155.0 | 155.0 | 8a | 156.8 |
| 9 | 66.5 | 76.1 | 37.3 | 31.1 | 31.7 | 33.7 | 34.1 | 37.4 | 9 | 199.6 |
| 10 | 73.8 | 95.9 | 126.0 | 121.7 | 121.0 | 123.1 | 122.8 | 38.4 | 10 | 26.1 |
| 11 | 83.1 | 74.0 | 135.5 | 135.4 | 135.2 | 134.7 | 135.2 | 88.2 | 11 | 28.6 |
| 12 | 23.3 | 36.1 | 31.4 | 30.5 | 30.3 | 32.2 | 32.0 | 40.6 | 12 | 28.6 |
| 13 | 24.4 | 29.9 | 30.3 | 21.4 | 21.2 | 25.4 | 25.5 | 26.6 | 1′ | 36.8 |
| 14 | 22.9 | 78.3 | 45.4 | 41.0 | 40.3 | 47.1 | 46.2 | 48 | 2′ | 75.8 |
| 15 | 147.5 | 150 | 84.8 | 83.6 | 86.4 | 86.3 | 40.4 | 3′ | 148.6 | |
| 16 | 111.0 | 110.6 | 22.4 | 23.3 | 22.6 | 23.9 | 23.4 | 4′ | 111.1 | |
| 17 | 19.5 | 19.2 | 23.4 | 23.4 | 23.3 | 23.4 | 27.6 | 5′ | 17.7 | |
| 18 | 21.1 | 23.2 | 25.5 | 25.6 | 27.1 | 27.3 | 34.1 | |||
| 19 | 30.8 | 23.4 | 25.4 | 25.0 | 20.1 | 20.3 | 17.9 | |||
| Pos. | 11 | 14 | 15 | 17 | 23 |
|---|---|---|---|---|---|
| 6 | 7.13, d (7.3 Hz) | 7.08, d (7.4 Hz) | 7.14, d (7.5 Hz) | 7.08, d (7.5 Hz) | 7.11, d (7.5 Hz) |
| 7 | 7.47, dd (8.3, 7.3 Hz) | 7.39, dd (8.2, 7.4 Hz) | 7.48, dd (8.3, 7.5 Hz) | 7.39, dd (8.3, 7.5 Hz) | 7.41, dd (8.4, 7.5 Hz) |
| 8 | 7.22, d (8.3 Hz) | 7.13, d (8.2 Hz) | 7.23, d (8.3 Hz) | 7.13, d (8.3 Hz) | 7.16, d (8.3 Hz) |
| 9 | 3.51, dd (6.7, 4.0 Hz) | 3.42, dd (6.8, 5.4 Hz) | 3.21, d (10.8 Hz) | 3.11, d (10.9 Hz) | 3.01, d (9.4 Hz) |
| 10 | 6.25, br s | 6.18, br s | 6.24, m | 6.24, m | 2.72 (m) |
| 12 | 2.02, m; 1.98, m | 2.06, m; 1.98, m | 2.19, br s | 2.19, m | 1.91, dd (13.0, 7.5 Hz); 2.07, dd (12.8, 7.5 Hz) |
| 13 | 2.04, m; 1.38, m | 2.02, m; 1.34, m | 1.96, m; 1.49, m | 1.98, m; 1.47, m | 1.76, dd (14.0, 7.5 Hz); 1.73, m |
| 14 | 1.88, ddd (11.5, 6.1, 3.0 Hz) | 1.88, ddd (11.8, 6.3, 3.0 Hz) | 1.7, ddd (13.0, 10.8, 2.1 Hz) | 1.71, ddd (12.7, 11.0, 2.0 Hz) | 2.50, dd (8.1, 7.0 Hz) |
| 16 | 2.80, s | 2.69, s | 2.81, s | 2.70, s | 2.74, s |
| 17 | 1.67, s | 1.68, s | 1.68, s | 1.68, s | 1.56, s |
| 18 | 1.51, s | 1.57, s | 1.54, s | 1.61, s | 1.40, s |
| 19 | 1.42, s | 1.41, s | 1.26, s | 1.26, s | 0.88, s |
| Pos. | δC | Pos. | δC | ||||||
|---|---|---|---|---|---|---|---|---|---|
| 18 | 19 | 24 | 25 | 18 | 19 | 24 | 25 | ||
| 2 | 163.5 | 163.3 | 163.9 | 163.0 | 2′ | 165.0 | 163.8 | 163.5 | 163.4 |
| 3 | 103.0 | 99.6 | 99.2 | 102.6 | 3′ | 101.3 | 104.9 | 109.0 | 109.0 |
| 4 | 167.5 | 181.7 | 181.9 | 164.2 | 4′ | 164.0 | 166.3 | 163.1 | 163.0 |
| 4a | 115.1 | 121.5 | 122.2 | 115.8 | 4a′ | 115.7 | 115.4 | 116.0 | 115.6 |
| 5 | 138.3 | 141.2 | 141.3 | 138.3 | 5′ | 138.0 | 138.3 | 138.3 | 138.3 |
| 6 | 128.7 | 128.7 | 128.6 | 128-7 | 6′ | 128.5 | 128.5 | 128.4 | 128.8 |
| 7 | 132.4 | 133.0 | 131.9 | 132.1 | 7′ | 131.9 | 132.0 | 132.7 | 132.2 |
| 8 | 115.6 | 116.4 | 115.4 | 115.6 | 8′ | 115.3 | 115.9 | 115.9 | 115.8 |
| 8a | 154.9 | 155.8 | 155.7 | 155.1 | 8a′ | 154.7 | 155.1 | 155.1 | 155.2 |
| 9 | 28.8 | 26.2 | 25.9 | 26.4 | 9′ | 28.9 | 28.8 | 26.5 | 26.7 |
| 10 | 52.9 | 45.0 | 54.1 | 53.1 | 10′ | 38.2 | 31.9 | 30.2 | 30.5 |
| 11 | 81.4 | 86.3 | 86.4 | 85.0 | 11′ | 83.3 | 80.8 | 81.0 | 81.5 |
| 12 | 23.5 | 22.4 | 22.3 | 23.9 | 12′ | 23.6 | 23.6 | 23.4 | 23.7 |
| 13 | 26.8 | 24.9 | 28.3 | 28.9 | 13′ | 43.2 | 40.3 | 40.1 | 40.8 |
| 14 | 19.7 | 28.9 | 20.5 | 21.2 | 14′ | 27.8 | 28.3 | 28.9 | 29.3 |
| Pos. | δH (J, in Hz) | |||
|---|---|---|---|---|
| 18 | 19 | 24 | 25 | |
| 6 | 7.16, d (7.4 Hz) | 7.13, d (7.3 Hz) | 7.13, d (7.5 Hz) | 7.07, d (7.5 Hz) |
| 7 | 7.46, dd (8.2, 7.4 Hz) | 7.48, dd (8.2, 7.3 Hz) | 7.40, dd (8.2, 7.5 Hz) | 7.38, dd (8.0, 7.5 Hz) |
| 8 | 7.19, d (8.2 Hz) | 7.24, d (8.0 Hz) | 7.15, d (8.2 Hz) | 7.11, d (8.0 Hz) |
| 9 | 2.68, td (12.0, 4.2 Hz) | 3.10, br dt (13.1, 6.3 Hz) | 2.72, td (12.7, 4.2 Hz) | 2.68, td (12.6, 4.2 Hz) |
| 10 | 2.17, dd (12.0, 1.9 Hz) | 2.15, br d (6.6 Hz) | 1.62, dd (12.4, 3.2 Hz) | 1.62, dd (12.4, 3.1 Hz) |
| 12 | 2.70, s | 2.76, s | 2.78, s | 2.69, s |
| 13 | 1.91, s | 1.67, s | 1.79, s | 1.87, s |
| 14 | 1.10, s | 1.77, s | 1.43, s | 1.44, s |
| 6′ | 7.09, d (7.4 Hz) | 7.15, d (7.5 Hz) | 7.09, d (7.6 Hz) | 7.10, d (7.8 Hz) |
| 7′ | 7.39, dd (8.4, 7.4 Hz) | 7.44, dd (8.3, 7.5 Hz) | 7.46, dd (8.4, 7.6 Hz) | 7.41, dd (8.3, 7.8 Hz) |
| 8′ | 7.12, d (8.4 Hz) | 7.17, d (8.3 Hz) | 7.21, d (8.4 Hz) | 7.15, d (8.3 Hz) |
| 9′ | 3.59, q (2.7 Hz) | 3.50, br q | 3.08, q (3.2 Hz) | 3.13, q (3.1 Hz) |
| 10′ | 2.22, dd (13.2, 2.8 Hz) 1.90, dt (13.2, 2.8 Hz) | 2.31, dd (14.1, 2.8 Hz); 1.82, dt (14.1, 2.5 Hz) | 2.29, dd (14.0, 3.4 Hz); 1.53, dd (14.0, 2.6 Hz) | 2.28, dd (13.9, 3.4 Hz); 1.55, dd (13.9, 2.7 Hz) |
| 12′ | 2.81, s | 2.84, s | 2.73, s | 2.74, s |
| 13′ | 3.51, ddd (14.0, 4.2, 2.6 Hz); 1.47, dd (14.0, 12.0 Hz) | 3.02, ddd (14.2, 5.5, 2.5 Hz); 1.71, dd (14.2, 13.1 Hz) | 3.80, dd (14.7, 4.2 Hz); 1.40 dd (14.7, 13.1 Hz) | 3.68, dd (14.8, 4.3 Hz); 1.48, dd (14.8, 13.0 Hz) |
| 14′ | 1.61, s | 1.61, s | 1.78, s | 1.76, s |
| Compound | α-Glucosidase (μM) | PTP1B (μM) |
|---|---|---|
| 17 | 32% (201.6) | N.D.a |
| 18 | 40% (159.1) | N.D.a |
| 19 | 48% (129.1) | 67% (64.4) |
| 24 | 51% (129.1) | 47% (32.2) |
| 25 | 45% (64.4) | 32% (129.1) |
© 2020 by the authors. Licensee MDPI, Basel, Switzerland. This article is an open access article distributed under the terms and conditions of the Creative Commons Attribution (CC BY) license (http://creativecommons.org/licenses/by/4.0/).
Share and Cite
Li, T.; Ma, X.; Fedotov, D.; Kjaerulff, L.; Frydenvang, K.; Coriani, S.; Hansen, P.R.; Kongstad, K.T.; Staerk, D. Structure Elucidation of Prenyl- and Geranyl-Substituted Coumarins in Gerbera piloselloides by NMR Spectroscopy, Electronic Circular Dichroism Calculations, and Single Crystal X-ray Crystallography. Molecules 2020, 25, 1706. https://doi.org/10.3390/molecules25071706
Li T, Ma X, Fedotov D, Kjaerulff L, Frydenvang K, Coriani S, Hansen PR, Kongstad KT, Staerk D. Structure Elucidation of Prenyl- and Geranyl-Substituted Coumarins in Gerbera piloselloides by NMR Spectroscopy, Electronic Circular Dichroism Calculations, and Single Crystal X-ray Crystallography. Molecules. 2020; 25(7):1706. https://doi.org/10.3390/molecules25071706
Chicago/Turabian StyleLi, Tuo, Xue Ma, Daniil Fedotov, Louise Kjaerulff, Karla Frydenvang, Sonia Coriani, Paul Robert Hansen, Kenneth T. Kongstad, and Dan Staerk. 2020. "Structure Elucidation of Prenyl- and Geranyl-Substituted Coumarins in Gerbera piloselloides by NMR Spectroscopy, Electronic Circular Dichroism Calculations, and Single Crystal X-ray Crystallography" Molecules 25, no. 7: 1706. https://doi.org/10.3390/molecules25071706
APA StyleLi, T., Ma, X., Fedotov, D., Kjaerulff, L., Frydenvang, K., Coriani, S., Hansen, P. R., Kongstad, K. T., & Staerk, D. (2020). Structure Elucidation of Prenyl- and Geranyl-Substituted Coumarins in Gerbera piloselloides by NMR Spectroscopy, Electronic Circular Dichroism Calculations, and Single Crystal X-ray Crystallography. Molecules, 25(7), 1706. https://doi.org/10.3390/molecules25071706