
Physical, Thermal and Biological Properties of Yellow Dyes with Two Azodiphenylether Groups of Anthracene


Abstract
1. Introduction
2. Experimental
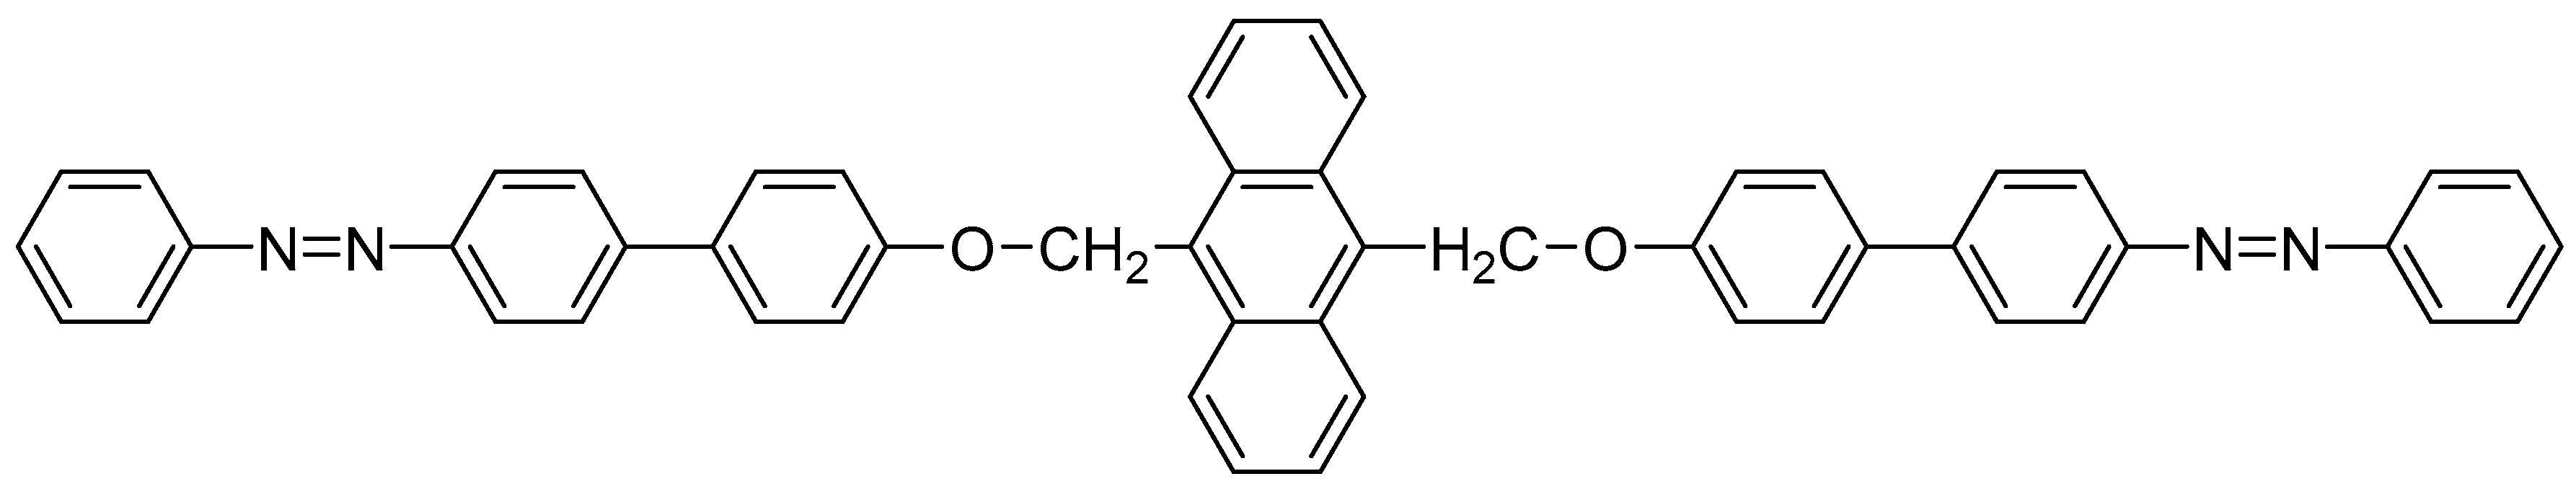
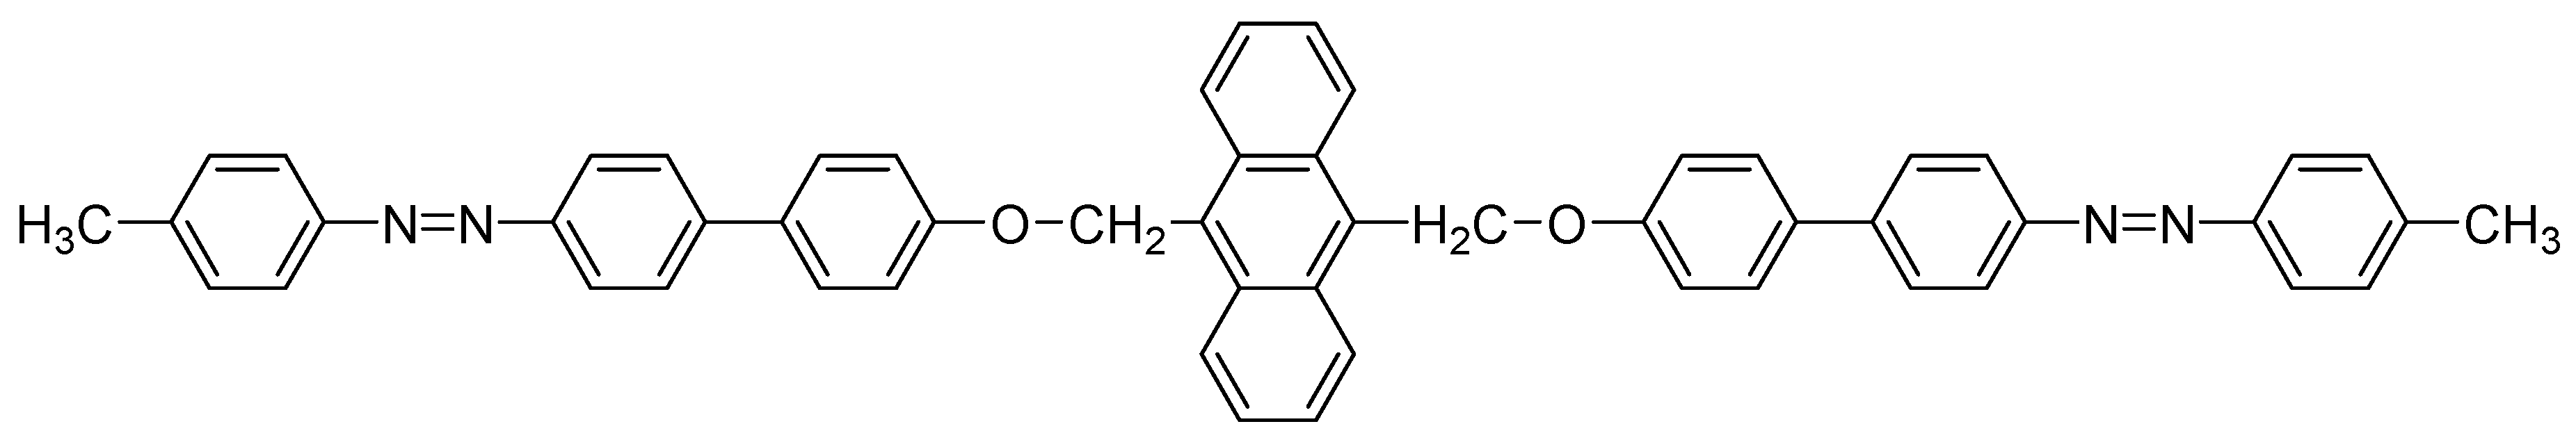
2.1. Preparation of Bis-Azo Anthracene Compounds
2.2. Methods and Techniques
3. Results and Discussions
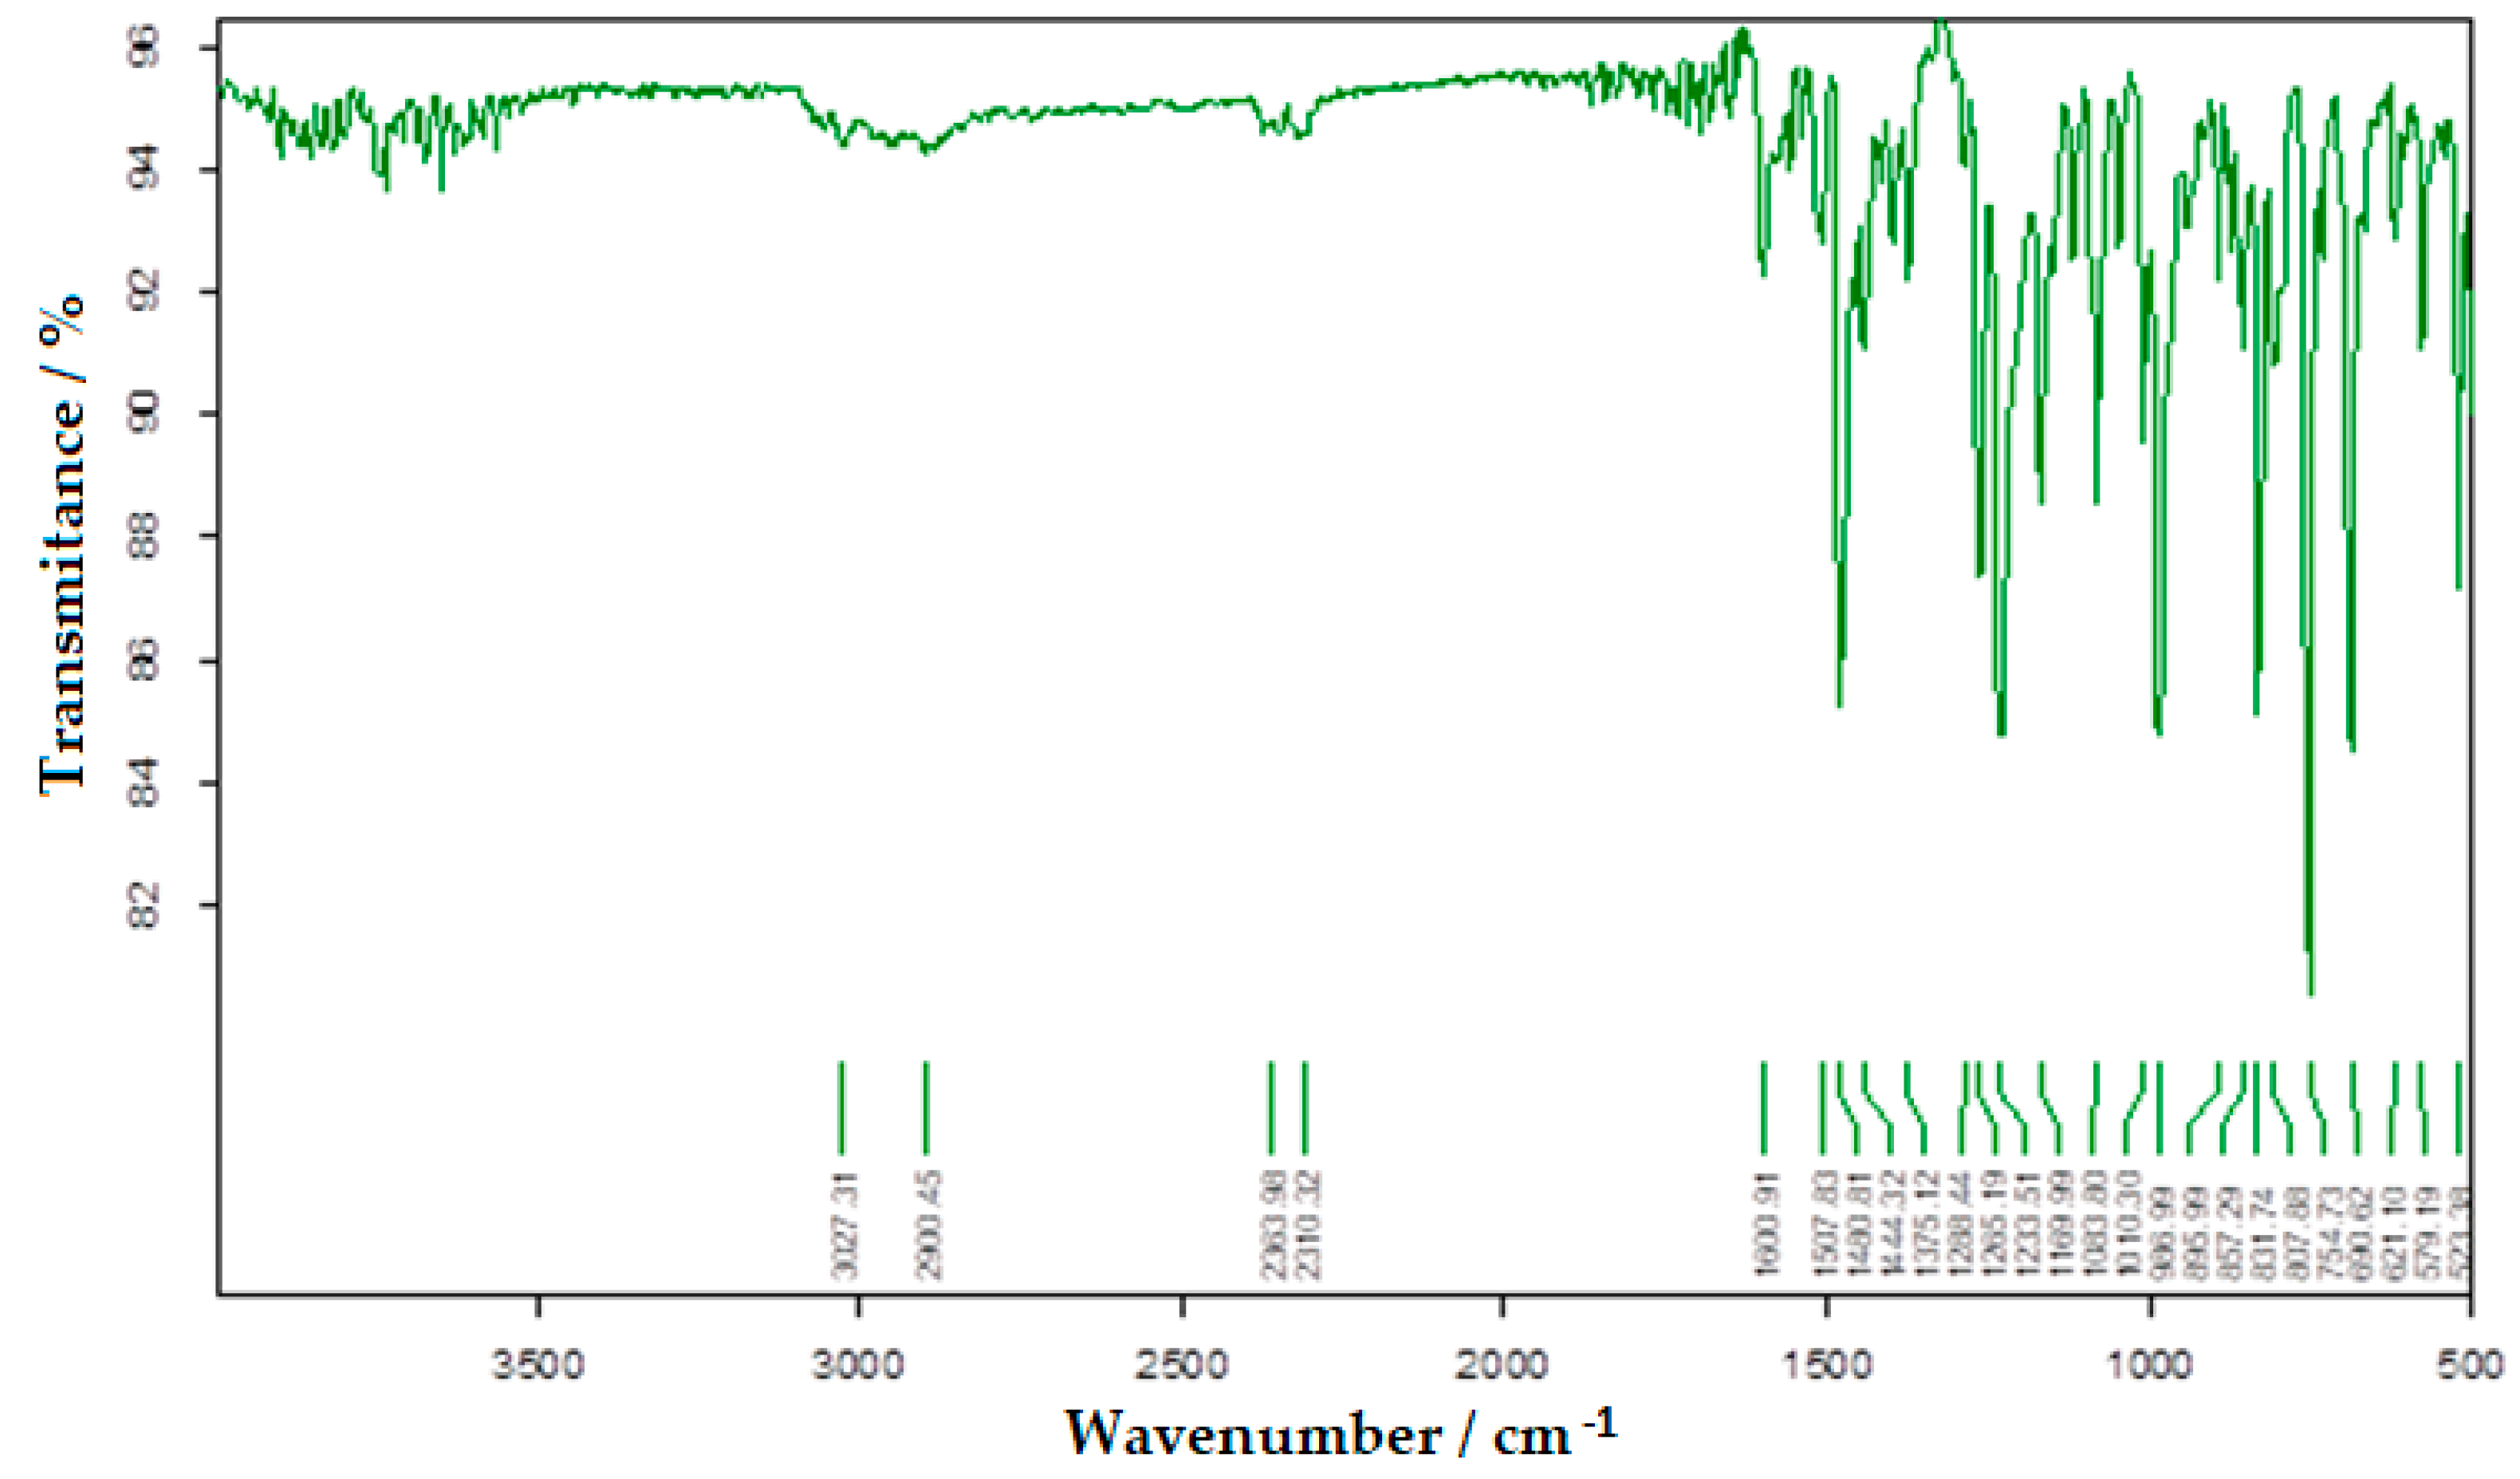
3.1. FTIR Absorption Spectrum of Bis-Azo Compounds of Anthracene
- Absorption lines at 1601 or 1602 cm−1 are related to the conjugation of the azo group with aromatic nuclei.
- Absorption lines at 1481 or 1485 cm−1 are related to the vibration of the azo group.
- Absorption lines at 1234 or 1242 and 1170 or 1172 cm−1 are related to etheric vibrations.
- Absorption lines at 1375, 808 or 813 and 753 or 755 cm−1 are related to the anthracenic radical.
3.2. UV–Vis Absorption Spectrum of the Bis-Azo Compounds of Anthracene
3.3. The Electronic Laser Fluorescence of the Bis-Azo Compounds of Anthracene
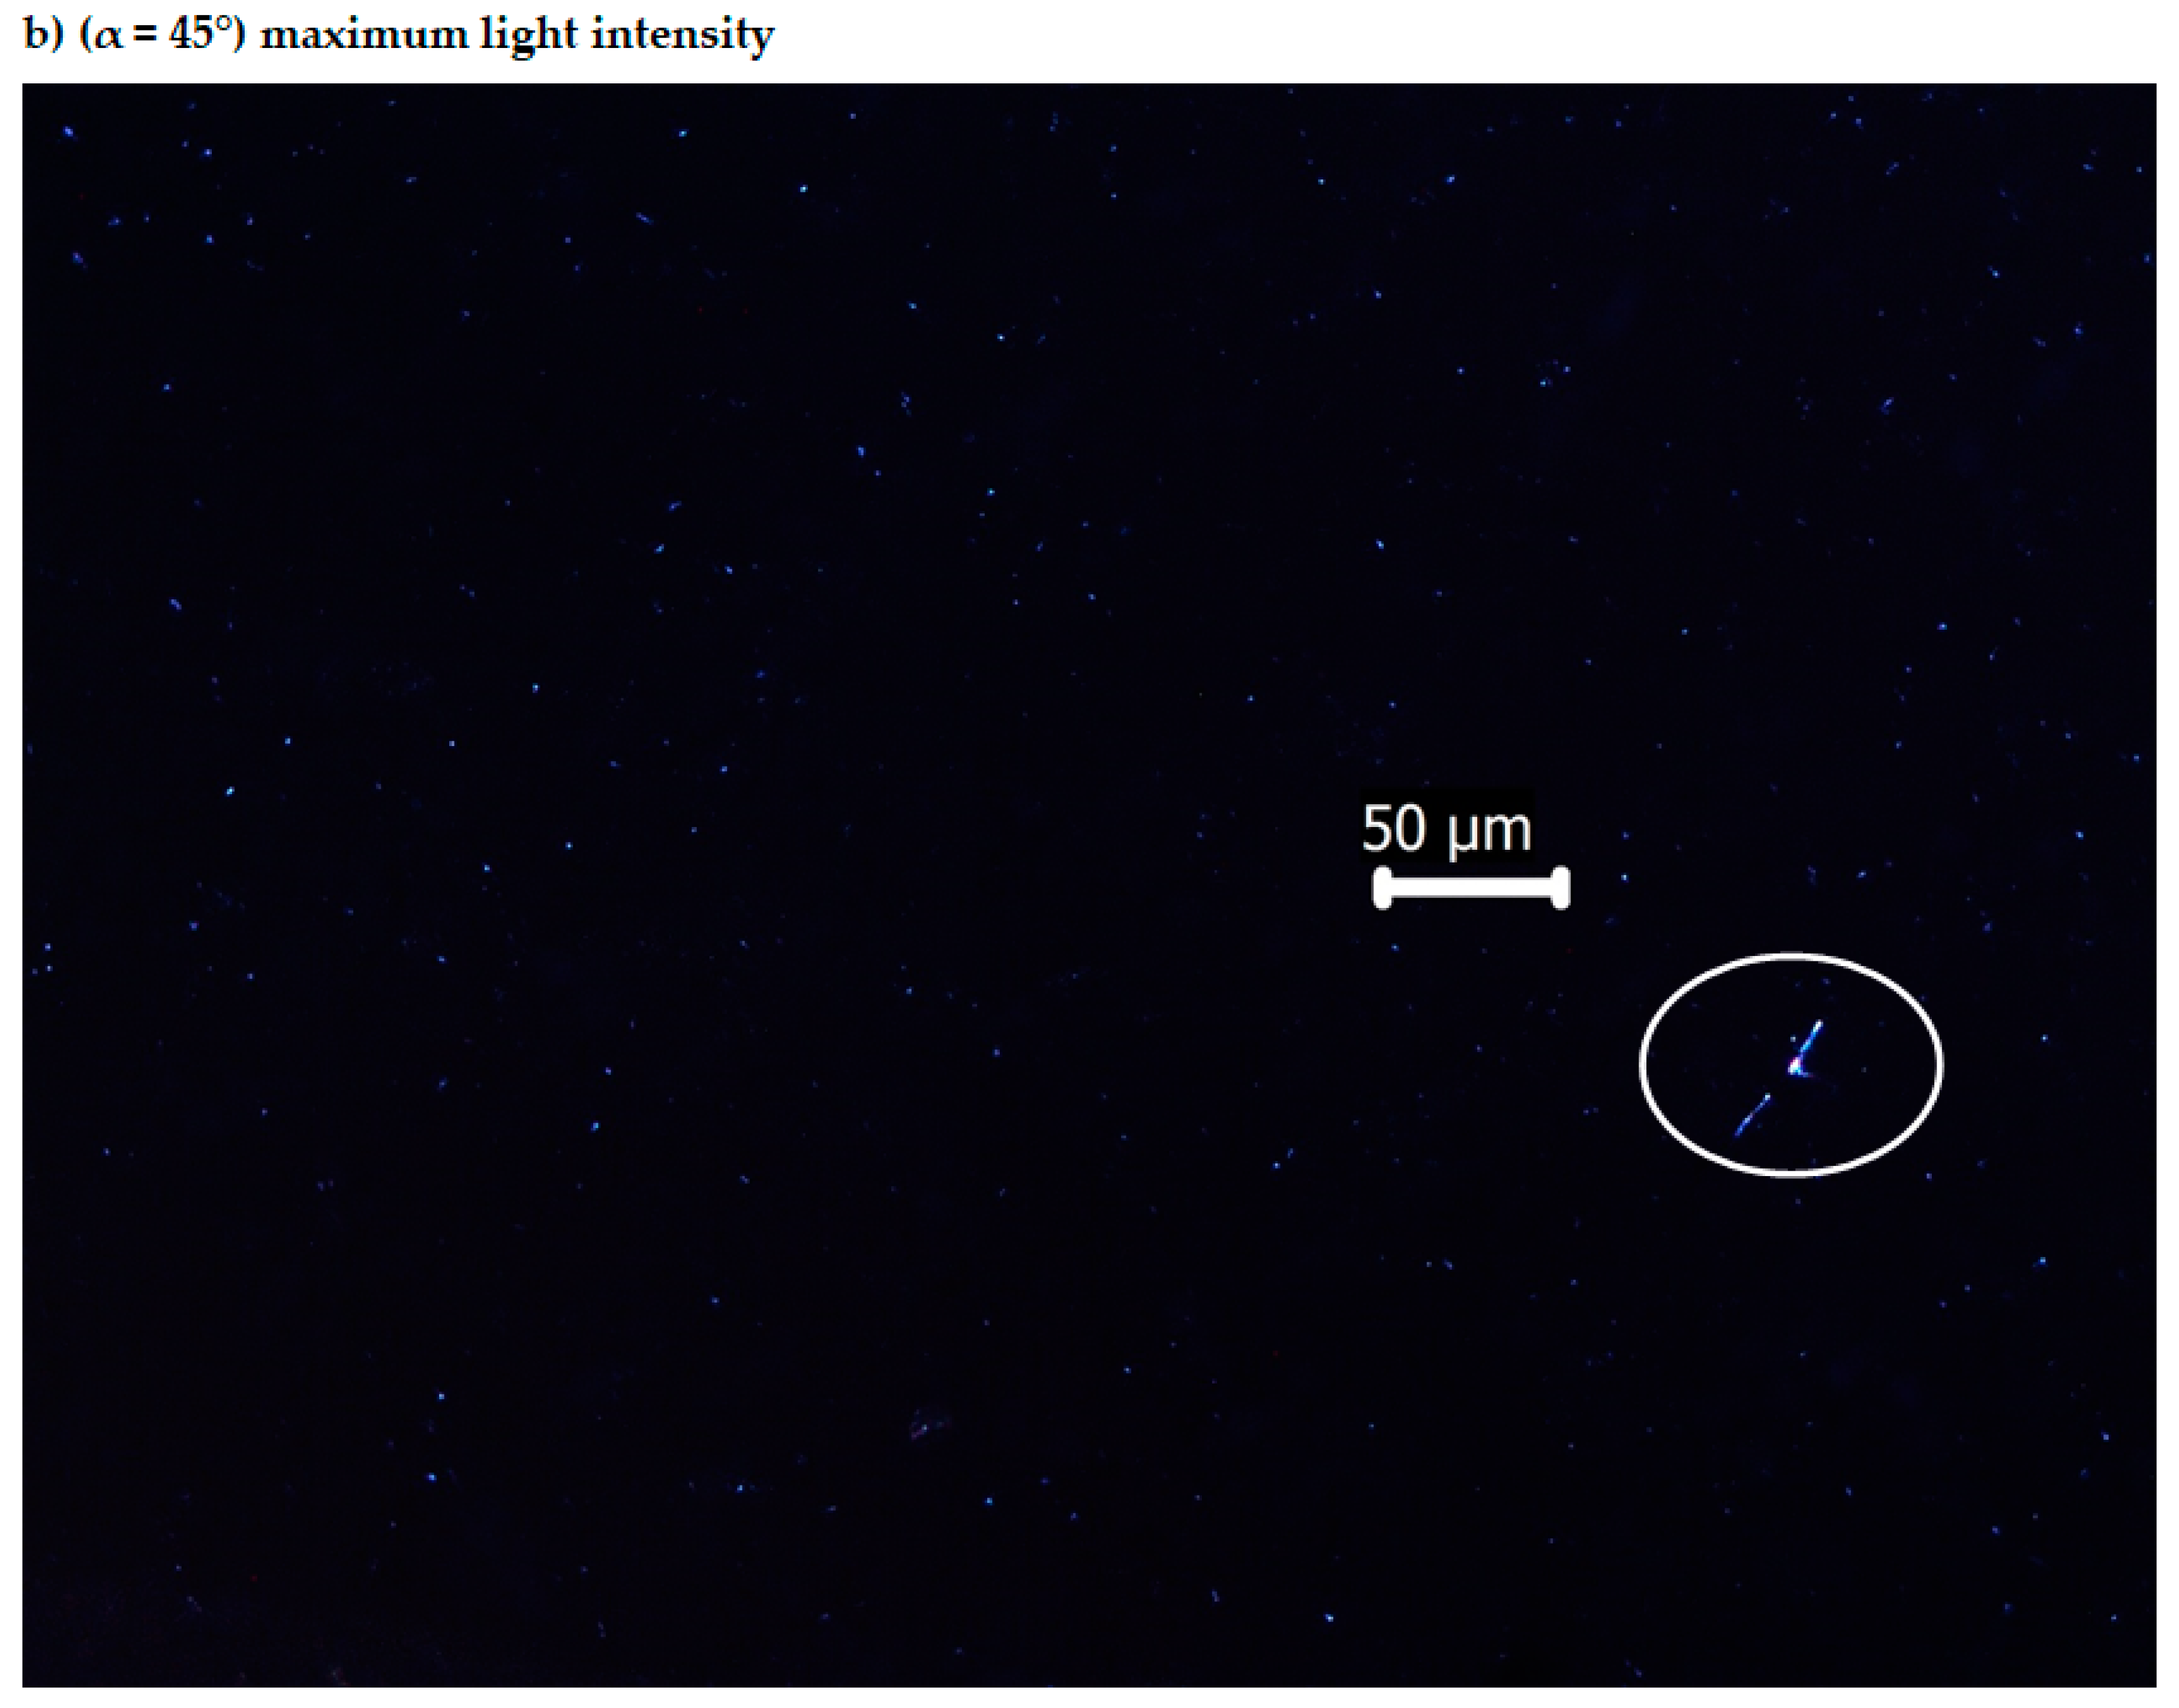
3.4. Optical Anisotropy of the Bis-Azo Compounds
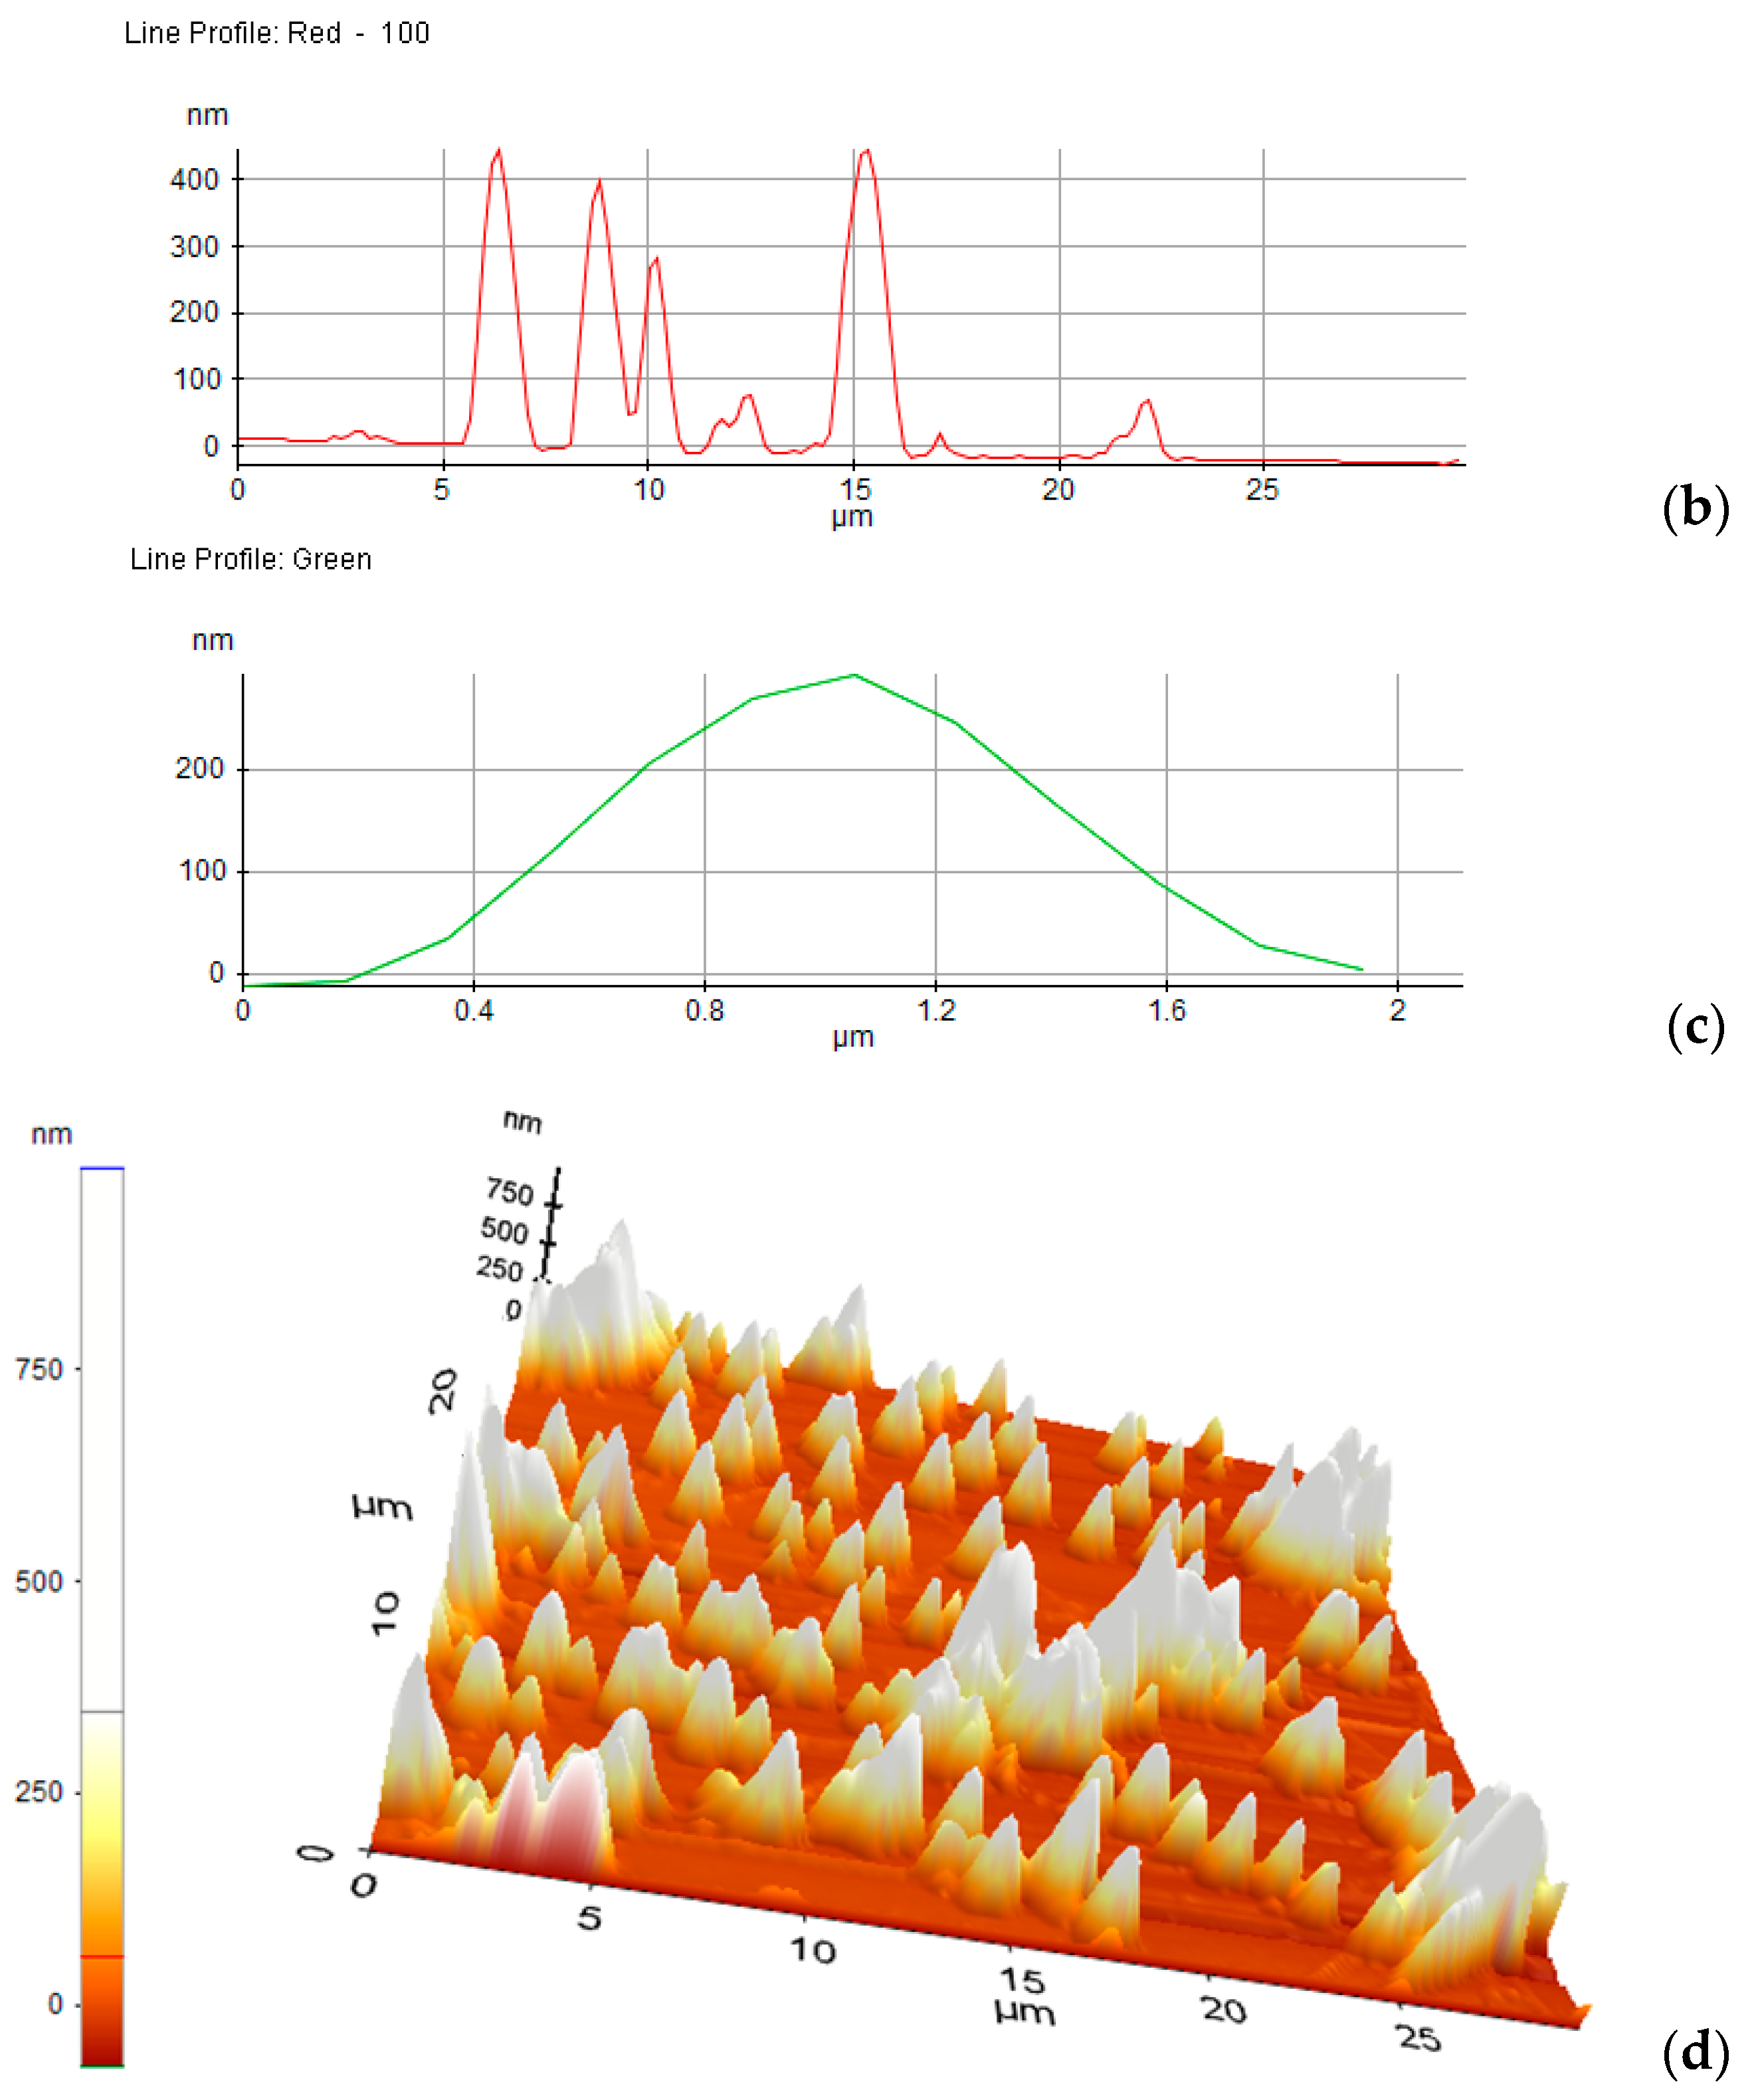
3.5. Adhesion to the Surfaces of the Bis-Azo Compounds of Anthracene
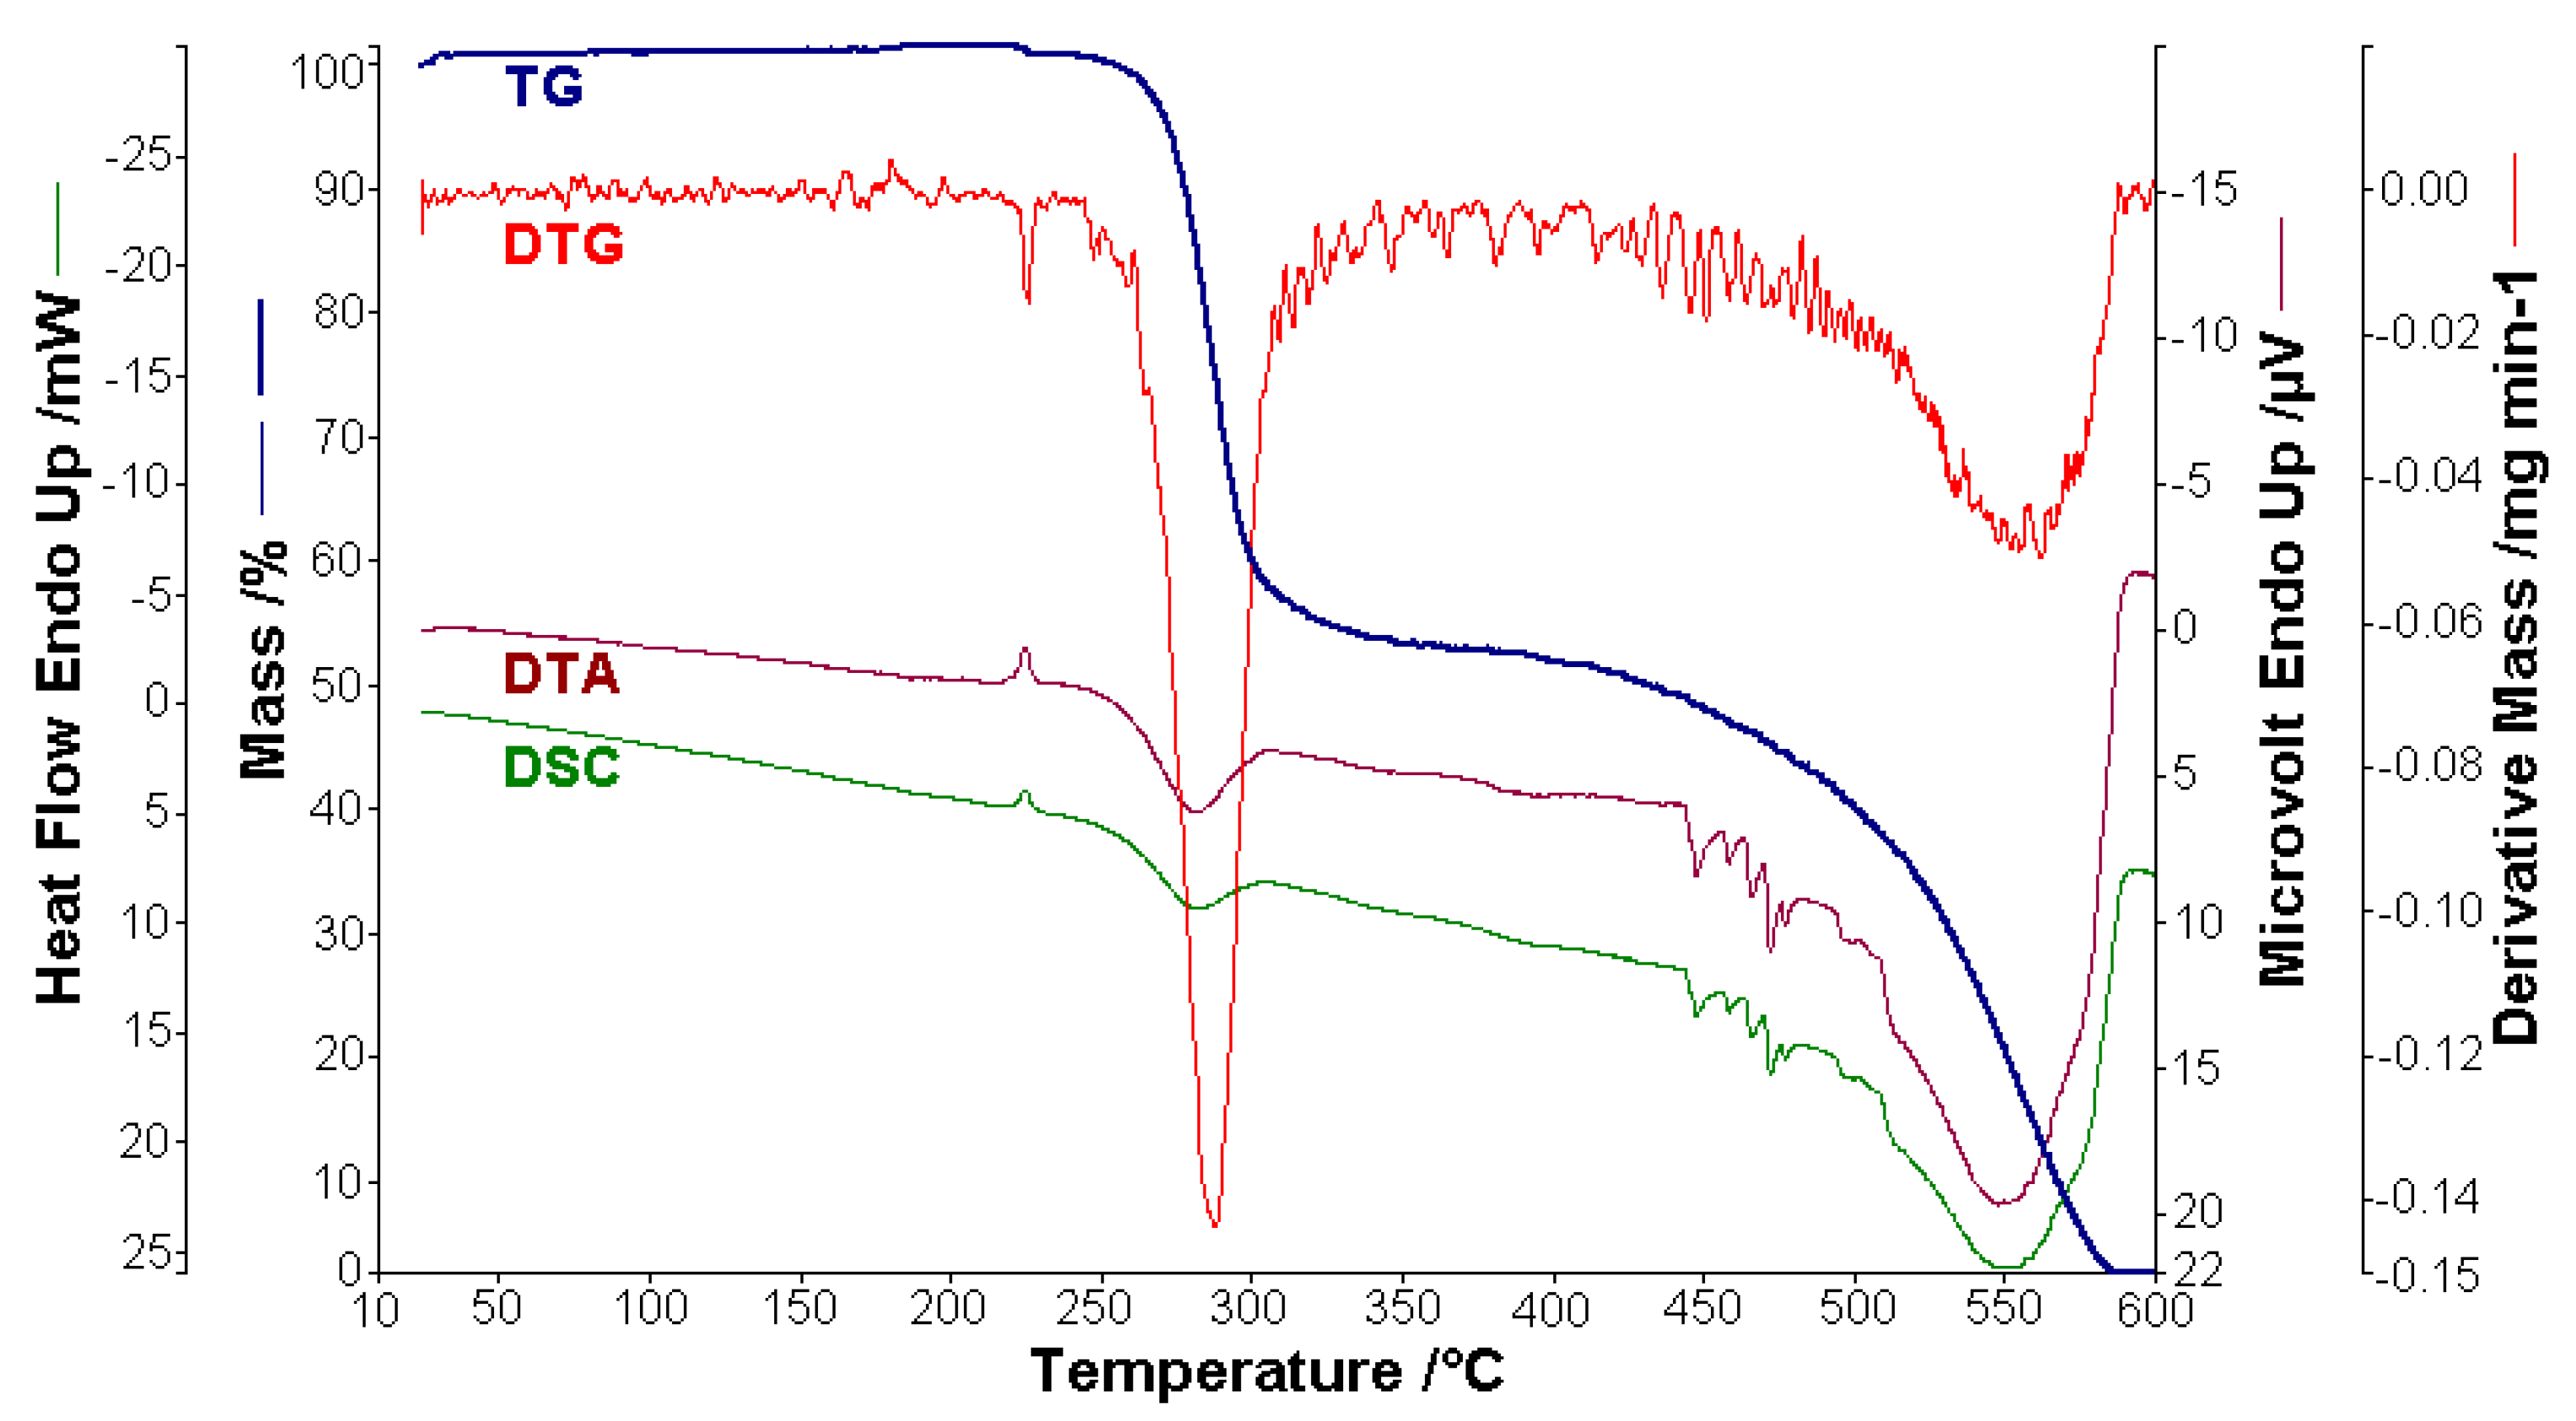
3.6. Thermal Behaviour of BPA and BTA
3.7. The Biological Properties of Bis-Azo Non-Chlorinated Anthracene Compounds
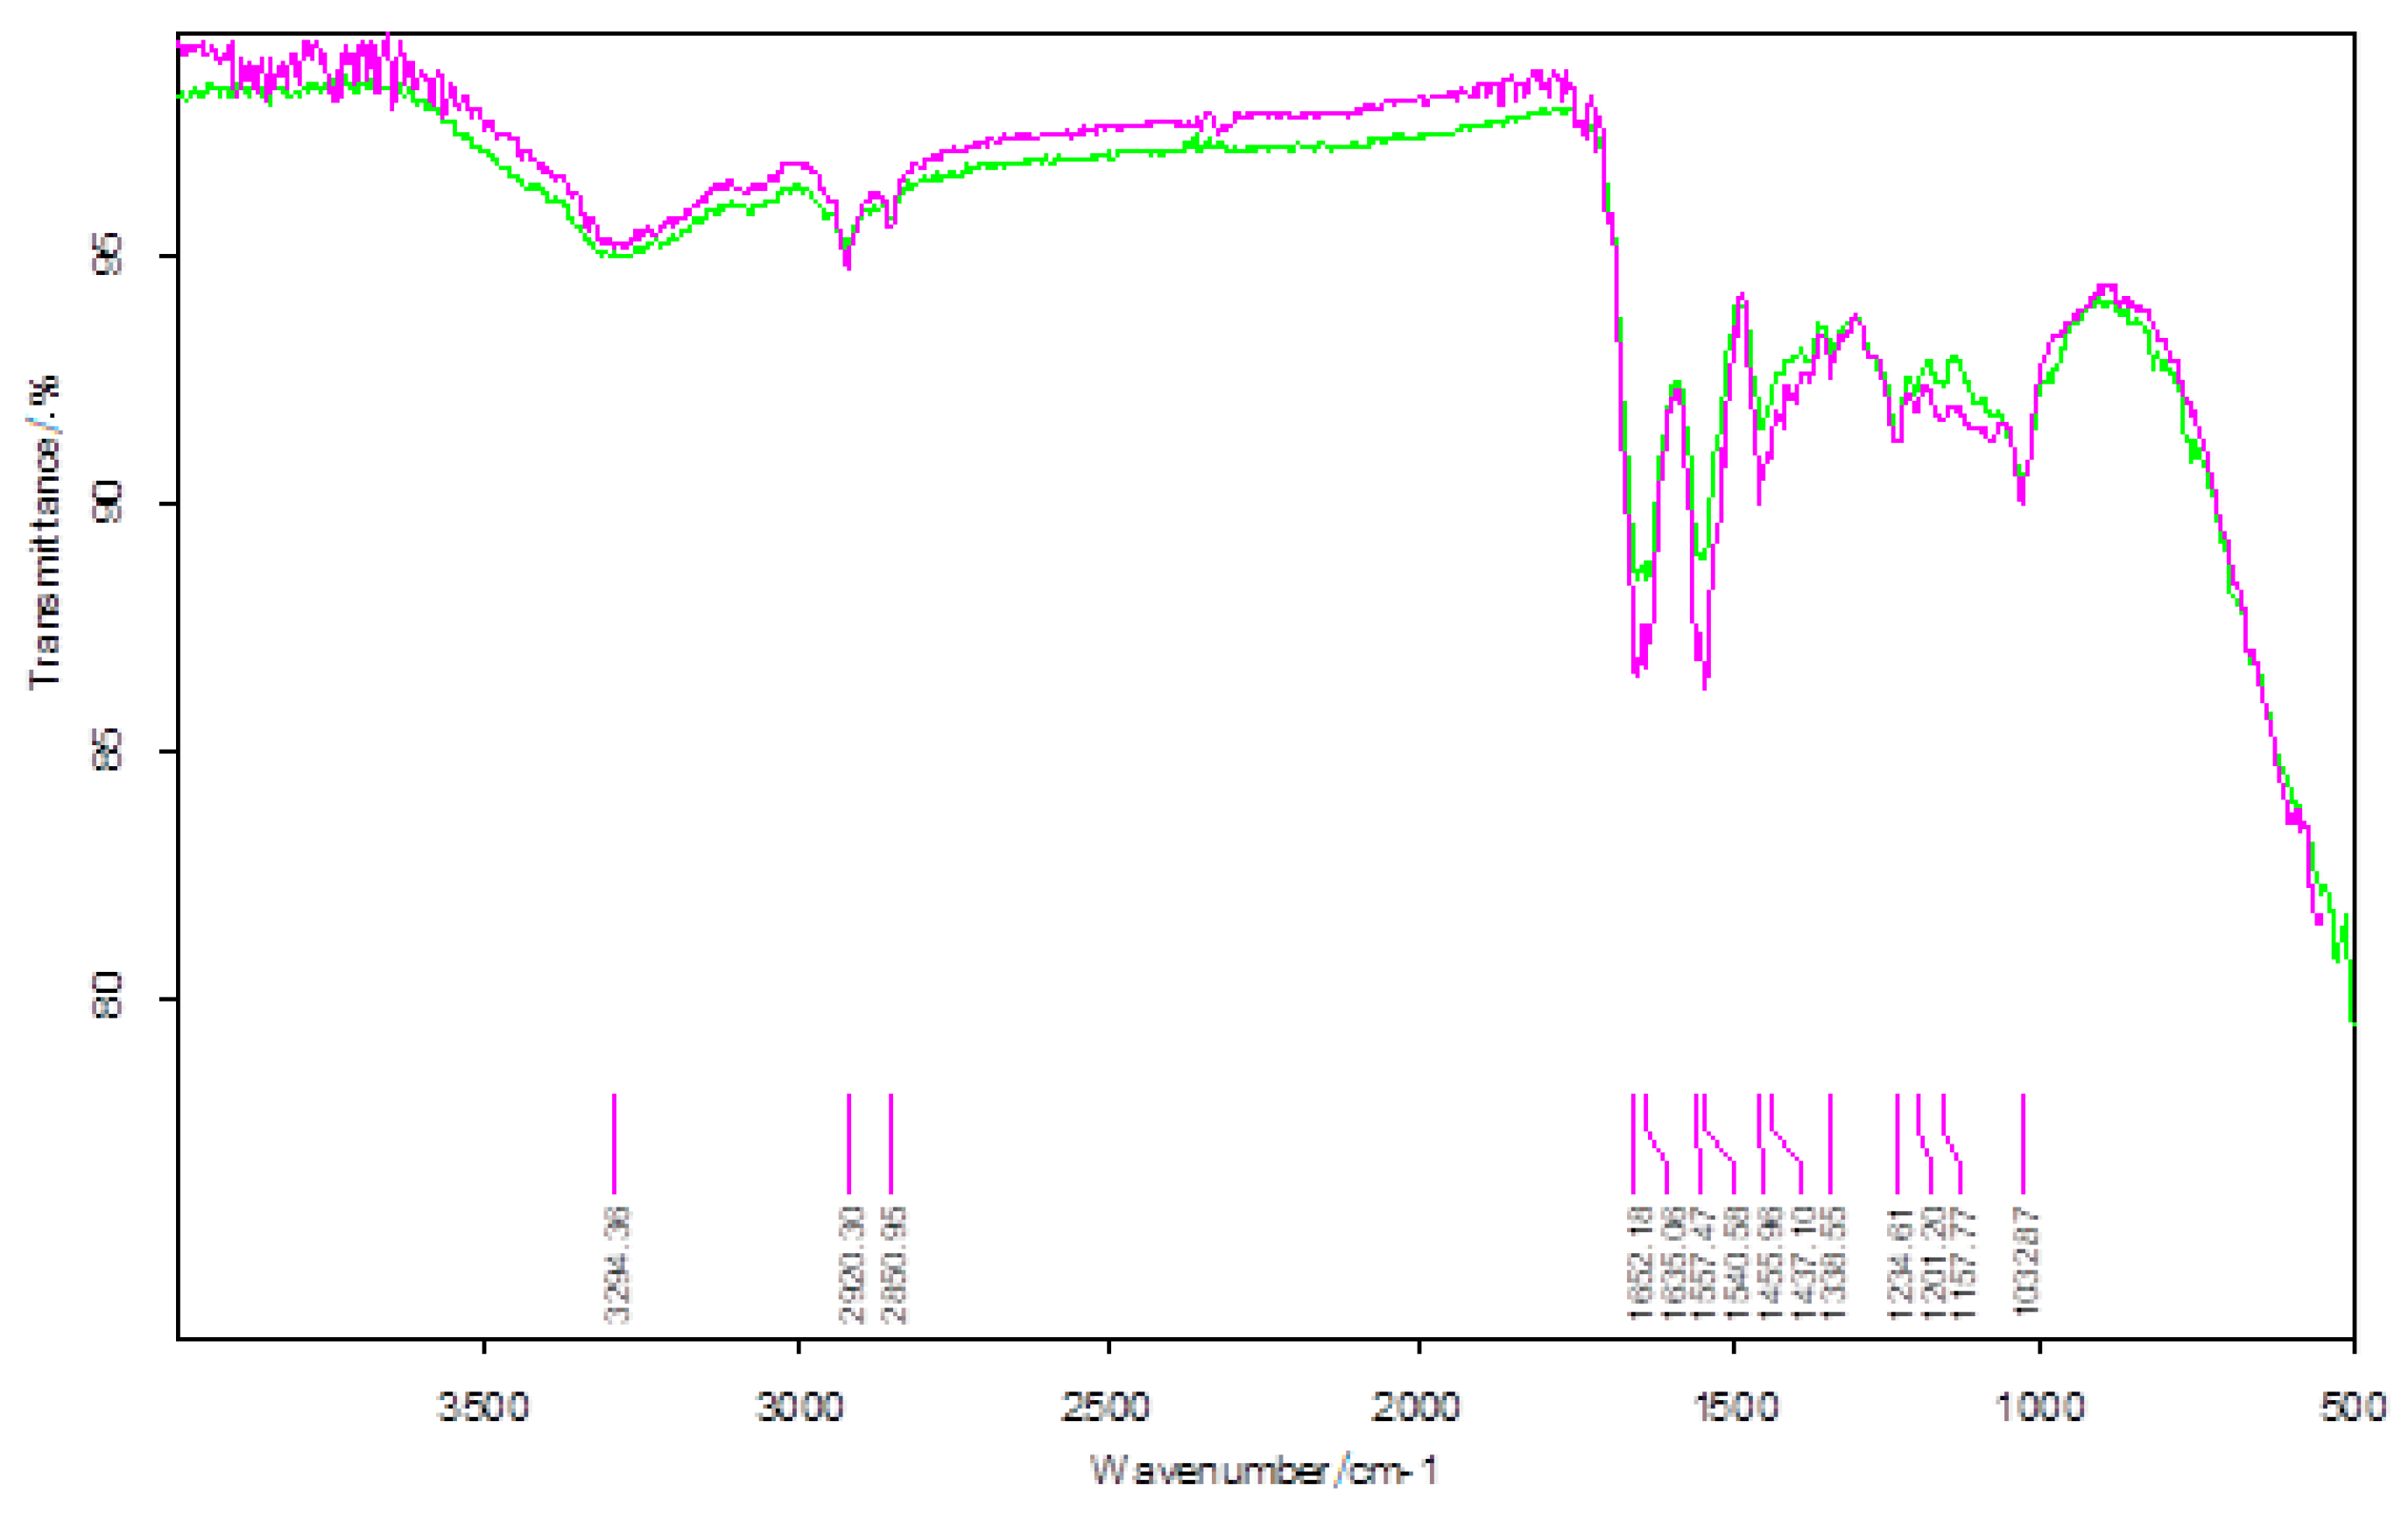
3.7.1. The Interaction of BPA and BTA with Proteins from Collagen
3.7.2. The Antioxidant Activity of BPA and BTA
4. Conclusions
- The compounds are thermally stable in air up to a temperature of 250 °C, but melt before decomposition at 224.4 °C (BPA) and 225.3 °C (BTA), respectively. Their oxidative decomposition occurs in two exothermic stages with the decomposition enthalpies of −241.4 J g−1 (BPA) and −318.7 J g−1 (BTA) in the first stage, respectively of −9820.9 J g−1 (BPA) and −10,888.2 J g−1 (BTA) in the second step.
- The FTIR spectra of the two bis-azo compounds of anthracene are similar, because their molecules contain mainly the same chemical bonds. The IR spectrum of BTA additionally contains the spectral lines of the radical -CH3, at 737, 542 and 505 cm−1.
- The UV–Vis absorption spectra allowed the evaluation of the quantum efficiency of the laser fluorescence at the 476.5 nm wavelength of the Ar+ laser, used to excite the fluorescence of the atoms in the molecules of the compounds. The quantum laser fluorescence efficiency of 0.33 is moderate for BPA and 0.50 is good for BTA.
- BPA and BTA molecules absorb light quanta with the wavelength of 476.5 nm, and electronic fluorescence quanta are emitted by de-excitation. The wavelengths and radiation energies emitted at the transition between electronic energy levels were identified, specifying the atom (the ion) or atoms (the ions) involved.
- It has been established that the BPA and BTA crystals are anisotropic, they produce double refraction of light, i.e., they are birefringent. When the table of the optical microscope with polarized light is rotated by 90°, by the interference of ordinary and extraordinary rays, maximum brightness arises, which alternates with minimum brightness (extinction).
- BPA and BTA dyes adhere well to glass surfaces, forming films with roughnesses of ~100 nm. The dispersion of the crystals on the surface, determined by AFM, is good. The dimensions of the crystals ranged from tens of nanometers to a few micrometers.
- The interaction of BPA and BTA with collagen (suede) proteins is not very high, advocating for these compounds to be used safely as coloring agents; however, no significant antioxidant activity of these bis-azo anthracene compounds was identified.
Supplementary Materials
Author Contributions
Funding
Conflicts of Interest
References
- Zollinger, H. Color Chemistry: Syntheses, Properties, and Applications of Organic Dyes and Pigments; VHCA: Zurich, Switzerland, 2003; ISBN 3-906390-23-2003. [Google Scholar]
- Rotaru, A.; Moanta, A. Azoic dyes: From thermal properties to a wide range of applications. In Advanced Engineering Materials. Recent Developments for Medical, Technological and Industrial Applications; Academica Greifswald: Greifswald, Germany, 2016; ISBN 978-3-940237-38-5. [Google Scholar]
- Sela, S.K.; Nayab-Ul-Hossain, A.; Hasan, N.; Hussain, S.Z.; Sadman, S. Surface modification and qualitative natural coloring of raw jute to reduce electrical resistance and induce anti-microbial properties. Appl. Surf. Sci. Adv. 2020, 1, 100018. [Google Scholar] [CrossRef]
- Constantinescu, C.; Morintale, E.; Ion, V.; Moldovan, A.; Luculescu, C.; Dinescu, M.; Rotaru, P. Thermal, morphological and optical investigations of Cu(DAB)2 thin films produced by matrix-assisted pulsed laser evaporation and laser-induced forward transfer for sensor development. Thin Solid Films 2012, 520, 3904–3909. [Google Scholar] [CrossRef]
- Rotaru, A.; Moanță, A.; Sălăgeanu, I.; Budrugeac, P.; Segal, E. Thermal decomposition kinetics of some aromatic azomonoethers Part I. Decomposition of 4-[(4-chlorobenzyl)oxy]-4’-nitro-azobenzene. J. Therm. Anal. Calorim. 2007, 87, 395–400. [Google Scholar] [CrossRef]
- Rotaru, A.; Kropidłowska, A.; Moanță, A.; Rotaru, P.; Segal, E. Thermal decomposition kinetics of some aromatic azomonoethers Part II. Non-isothermal study of three liquid crystals in dynamic air atmosphere. J. Therm. Anal. Calorim. 2008, 92, 233–238. [Google Scholar] [CrossRef]
- Rotaru, A.; Moanță, A.; Rotaru, P.; Segal, E. Thermal decomposition kinetics of some aromatic azomonoethers Part III. Non-isothermal study of 4-[(4-chlorobenzyl)oxy]-4′-chloroazobenzene in dynamic air atmosphere. J. Therm. Anal. Calorim. 2009, 95, 161–166. [Google Scholar] [CrossRef]
- Rotaru, A.; Moanță, A.; Popa, G.; Rotaru, P.; Segal, E. Thermal decomposition kinetics of some aromatic azomonoethers Part IV. Non-isothermal kinetics of 2-allyl-4-((4-(4-methylbenzyloxy)phenyl) diazenyl)phenol in air flow. J. Therm. Anal. Calorim. 2009, 97, 485–491. [Google Scholar] [CrossRef]
- Rotaru, A.; Constantinescu, C.; Rotaru, P.; Moanta, A.; Dumitru, M.; Socaciu, M.; Dinescu, M.; Segal, E. Thermal analysis and thin films deposition by matrix assisted pulsed laser evaporation of a 4CN type azomonoether. J. Therm. Anal. Calorim. 2008, 92, 279–284. [Google Scholar] [CrossRef]
- Huang, C.-Y.; Lin, Y.-R.; Lo, K.-Y.; Lee, C.-R. Dynamics of photoalignment in azo-dye-doped liquid crystals. Appl. Phys. Lett. 2008, 93, 181114. [Google Scholar] [CrossRef]
- Fuh, A.Y.-G.; Chen, J.-C.; Huang, S.-Y.; Cheng, K.-T. Binary liquid crystal alignments based on photoalignment in azo dye-doped liquid crystals and their application. Appl. Phys. Lett. 2010, 96, 51103. [Google Scholar] [CrossRef]
- Moanta, A.; Ionescu, C.; Rotaru, P.; Socaciu, M.; Hărăbor, A. Structural characterization, thermal investigation, and liquid crystalline behavior of 4-[(4-chlorobenzyl)oxy]-3,4′-dichloroazobenzene. J. Therm. Anal. Calorim. 2010, 102, 1079–1086. [Google Scholar] [CrossRef]
- Rotaru, A.; Dumitru, M. Thermal behaviour of CODA azoic dye liquid crystal and nanostructuring by drop cast and spin coating techniques. J. Therm. Anal. Calorim. 2016, 127, 21–32. [Google Scholar] [CrossRef]
- Rotaru, A.; Moanţă, A.; Constantinescu, C.; Dumitru, M.; Manolea, H.O.; Andrei, A.; Dinescu, M. Thermokinetic study of CODA azoic liquid crystal and thin films deposition by matrix-assisted pulsed laser evaporation. J. Therm. Anal. Calorim. 2017, 128, 89–105. [Google Scholar] [CrossRef]
- Shuji, I.; Akio, M.; Mikio, S.; Masaharu, K.; Tomio, Y.; Junko, I. Liquid Crystal Composition Containing azo Dyes. European Patent 0 087 248 A1, 31 August 1983. [Google Scholar]
- Dixit, S.; Vora, R.A. Study of Novel Liquid Crystalline Materials with Lateral Ester Group. Int. J. Eng. Res. 2015, 4, 651–655. [Google Scholar] [CrossRef]
- Al-Hamdani, U.J.; Gassim, T.E.; Radhy, H.H. Synthesis and Characterization of Azo Compounds and Study of the Effect of Substituents on Their Liquid Crystalline Behavior. Molecules 2010, 15, 5620–5628. [Google Scholar] [CrossRef] [PubMed]
- Yue, Y.; Norikane, Y.; Azumi, R.; Koyama, E. Light-induced mechanical response in crosslinkedliquid-crystalline polymers with photoswitchable glass transition temperatures. Nat. Commun. 2018, 9, 3234. [Google Scholar] [CrossRef] [PubMed]
- Zhao, H.-W.; He, X.-Z.; Zheng, J.-J.; Song, W.-L.; Meng, F.-B.; Hu, J.-S. Synthesis and properties of chiral azo-liquid crystalline terpolymer containing cyano mesogenic units. Liq. Cryst. 2017, 44, 2379–2390. [Google Scholar] [CrossRef]
- Ong, L.-K.; Ha, S.-T.; Yeap, G.-Y.; Lin, H.-C. Heterocyclic pyridine-based liquid crystals: Synthesis and mesomorphic properties. Liq. Cryst. 2018, 45, 1574–1584. [Google Scholar] [CrossRef]
- Konstantinov, I.I. Liquid crystalline properties of some monomeric azo- and azoxybenzenes and their polymers. J. Phys. Colloq. 1979, 40, 475–477. [Google Scholar] [CrossRef]
- Zhai, B.-G.; Chen, L.L.; Huang, Y.M. Photochemistry in an Azo-Containing Banana-Shaped Liquid Crystal. Key Eng. Mater. 2010, 429, 202–205. [Google Scholar] [CrossRef]
- Ouskova, E.; Vapaavuori, J.; Kaivola, M. Self-orienting liquid crystal doped with polymer-azo-dye complex. Opt. Mater. Express 2011, 1, 1463–1470. [Google Scholar] [CrossRef]
- Jull, E.I.L.; Gleeson, H.F. All-optical responsive azo-doped liquid crystal laser protection filter. Opt. Express 2018, 26, 34179–34184. [Google Scholar] [CrossRef] [PubMed]
- Inglot, K.; Martyński, T.; Bauman, D. Molecular organization and aggregation in Langmuir and Langmuir-Blodgett films of azo dye/liquid crystal mixtures. Opto-Electron. Rev. 2009, 17, 120–128. [Google Scholar] [CrossRef]
- Becchi, M.; Janossy, I.; Rao, D.S.S.; Statman, D. Anomalous intensity dependence of optical reorientation in azo-dye-doped nematic liquid crystals. Phys. Rev. E 2004, 69. [Google Scholar] [CrossRef] [PubMed]
- Oh, S.-W.; Baek, J.-M.; Kim, S.-H.; Yoon, T.-H. Optical and electrical switching of cholesteric liquid crystals containing azo dye. RSC Adv. 2017, 7, 19497–19501. [Google Scholar] [CrossRef]
- Li, H.; Wang, J.; Wang, C.; Zeng, P.; Pan, Y.; Yang, Y. Enhanced diffraction properties of photoinduced gratings in nematic liquid crystals doped with Disperse Red. Proc. Jpn. Acad. Ser. B 2016, 92, 330–335. [Google Scholar] [CrossRef]
- Yamjala, K.; Nainar, M.S.; Ramisetti, N.R. Methods for the analysis of azo dyes employed in food industry–A review. Food Chem. 2016, 192, 813–824. [Google Scholar] [CrossRef]
- Selvam, K.; Swaminathan, K.; Chae, K.-S. Decolourization of azo dyes and a dye industry effluent by a white rot fungus Thelephora sp. Bioresour. Technol. 2003, 88, 115–119. [Google Scholar] [CrossRef]
- Saratale, R.; Saratale, G.; Kalyani, D.; Chang, J.-S.; Govindwar, S.P. Enhanced decolorization and biodegradation of textile azo dye Scarlet R by using developed microbial consortium-GR. Bioresour. Technol. 2009, 100, 2493–2500. [Google Scholar] [CrossRef]
- Pinheiro, H.; Touraud, E.; Thomas, O. Aromatic amines from azo dye reduction: Status review with emphasis on direct UV spectrophotometric detection in textile industry wastewaters. Dye. Pigment. 2004, 61, 121–139. [Google Scholar] [CrossRef]
- Máximo, C.; De Amorim, M.T.P.; Costa-Ferreira, M. Biotransformation of industrial reactive azo dyes by Geotrichum sp. CCMI Enzym. Microb. Technol. 2003, 32, 145–151. [Google Scholar] [CrossRef]
- Pandey, A.; Singh, P.; Iyengar, L. Bacterial decolorization and degradation of azo dyes. Int. Biodeterior. Biodegrad. 2007, 59, 73–84. [Google Scholar] [CrossRef]
- Meehan, C.; Bjourson, A.J.; McMullan, G. Paenibacillus azoreducens sp. nov., a synthetic azo dye decolorizing bacterium from industrial wastewater. Int. J. Syst. Evol. Microbiol. 2001, 51, 1681–1685. [Google Scholar] [CrossRef] [PubMed]
- Couto, S.R. Decolouration of industrial azo dyes by crude laccase from Trametes hirsute. J. Hazard. Mat. 2007, 148, 768–770. [Google Scholar] [CrossRef] [PubMed]
- Ahmad, F.; Lee, J.W.; Jeon, Y.J.; Jamil, M. Enhanced electro-optical characteristics of dispersedAzo dye doped polymer-liquid crystal display. Optoelectron. Adv. Mater. Rapid Commun. 2017, 11, 603–607. [Google Scholar]
- Türgay, O.; Ersöz, G.; Atalay, S.; Forss, J.; Welander, U. The treatment of azo dyes found in textile industry wastewater by anaerobic biological method and chemical oxidation. Sep. Purif. Technol. 2011, 79, 26–33. [Google Scholar] [CrossRef]
- Mohan, S.V.; Rao, N.C.; Prasad, K.K.; Karthikeyan, J. Treatment of simulated Reactive Yellow 22 (Azo) dye effluents using Spirogyra species. Waste Manag. 2002, 22, 575–582. [Google Scholar] [CrossRef]
- Reza, M.S.A.; Hasan, M.M.; Kamruzzaman, M.; Hossain, M.I.; Zubair, M.A.; Bari, L.; Abedin, M.Z.; Reza, M.A.; Khalid-Bin-Ferdaus, K.M.; Haque, K.M.F.; et al. Study of a common azo food dye in mice model: Toxicity reports and its relation to carcinogenicity. Food Sci. Nutr. 2019, 7, 667–677. [Google Scholar] [CrossRef]
- Paz, A.; Carballo, J.; Pérez, M.J.; Domínguez, J.M. Biological treatment of model dyes and textile wastewaters. Chemosphere 2017, 181, 168–177. [Google Scholar] [CrossRef]
- Leulescu, M.; Rotaru, A.; Pălărie, I.; Moanță, A.; Cioateră, N.; Popescu, M.; Morîntale, E.; Bubulică, M.V.; Florian, G.; Hărăbor, A.; et al. Tartrazine: Physical, thermal and biophysical properties of the most widely employed synthetic yellow food-colouring azo dye. J. Therm. Anal. Calorim. 2018, 134, 209–231. [Google Scholar] [CrossRef]
- Leulescu, M.; Pălărie, I.; Moanță, A.; Cioateră, N.; Popescu, M.; Morîntale, E.; Văruț, M.C.; Rotaru, P. Brown HT Physical, thermal and biophysical properties of the food azo dye. J. Therm. Anal. Calorim. 2019, 136, 1249–1268. [Google Scholar] [CrossRef]
- Leulescu, M.; Iacobescu, G.; Bojan, M.; Rotaru, P. Ponceau 4R azoic red dye Thermal behavior, optical anisotropy and terahertz spectroscopy study. J. Therm. Anal. Calorim. 2019, 138, 2091–2101. [Google Scholar] [CrossRef]
- Kostić, V.; Stafilov, T.; Stojanoski, K. Hplc investigation of the degradation of some artificial azo food colorants in the presence of ascorbic acid. Contrib. Sect. Nat. Math. Biotech. Sci. 2017, 29, 89–98. [Google Scholar] [CrossRef][Green Version]
- Husain, A.; Sawaya, W.; Al-Omair, A.; Al-Zenki, S.; Al-Amiri, H.; Ahmed, N.; Al-Sinan, M. Estimates of dietary exposure of children to artificial food colours in Kuwait. Food Addit. Contam. 2006, 23, 245–251. [Google Scholar] [CrossRef] [PubMed]
- Cheng, Q.; Xia, S.; Tong, J.; Wu, K. Highly-sensitive electrochemical sensing platforms for food colourants based on the property-tuning of porous carbon. Anal. Chim. Acta 2015, 887, 75–81. [Google Scholar] [CrossRef] [PubMed]
- Zhang, Y.; Hu, L.; Liu, X.; Liu, B.; Wu, K. Highly-sensitive and rapid detection of ponceau 4R and tartrazine in drinks using alumina microfibers-based electrochemical sensor. Food Chem. 2015, 166, 352–357. [Google Scholar] [CrossRef]
- Dubin, P.; Wright, K.L. Reduction of Azo Food Dyes in Cultures ofProteus vulgaris. Xenobiotica 1975, 5, 563–571. [Google Scholar] [CrossRef]
- Uysal, H.; Genc, S.; Ayar, A. Toxic e_ects of chronic feeding with food azo dyes on Drosophila melanogaster Oregon R. Sci. Iran. C 2017, 24, 3081–3086. [Google Scholar]
- Sen, S.K.; Raut, S.; Bandyopadhyay, P.; Raut, S. Fungal decolouration and degradation of azo dyes: A review. Fungal Biol. Rev. 2016, 30, 112–133. [Google Scholar] [CrossRef]
- Sudha, M.; Saranya, A.; Selvakumar, G.; Sivakumar, N. Microbial degradation of azo dyes: A review. Int. J. Curr. Microbiol. Appl. Sci. 2014, 3, 670–690. [Google Scholar]
- Lade, H.S.; Waghmode, T.R.; Kadam, A.A.; Govindwar, S.P. Enhanced biodegradation and detoxification of disperse azo dye Rubine GFL and textile industry effluent by defined fungal-bacterial consortium. Int. Biodeterior. Biodegrad. 2012, 72, 94–107. [Google Scholar] [CrossRef]
- Mielgo, I.; Moreira, M.T.; Feijoo, G.; Lema, J. A packed-bed fungal bioreactor for the continuous decolourisation of azo-dyes (Orange II). J. Biotechnol. 2001, 89, 99–106. [Google Scholar] [CrossRef]
- Chen, K.-C.; Huang, W.-T.; Wu, J.-Y.; Houng, J.-Y. Microbial decolorization of azo dyes by Proteus mirabilis. J. Ind. Microbiol. Biotechnol. 1999, 23, 686–690. [Google Scholar] [CrossRef] [PubMed]
- Leo, L.; Loong, C.; Ho, X.L.; Raman, M.F.B.; Suan, M.Y.T.; Loke, W.M. Occurrence of azo food dyes and their effects on cellular inflammatory responses. Nutrition 2018, 46, 36–40. [Google Scholar] [CrossRef] [PubMed]
- Gholami-Borujeni, F.; Mahvi, A.H.; Naseri, S.; Faramarzi, M.A.; Nabizadeh, R.; Alimohammadi, M. Application of immobilized horseradish peroxidase for removal and detoxification of azo dye from aqueous solution. Res. J. Chem. Environ. 2011, 15, 217–222. [Google Scholar]
- Moanta, A.; Ionescu, C.; Dragoi, M.; Tutunaru, B.; Rotaru, P. A new azo-ester: 4-(phenyldiazenyl)phenyl benzene sulfonate—Spectral, thermal, and electrochemical behavior and its antimicrobial activity. J. Therm. Anal. Calorim. 2015, 120, 1151–1161. [Google Scholar] [CrossRef]
- Kazem-Rostami, M. Factors influencing the thermal stability of azo and bisazo compounds. J. Therm. Anal. Calorim. 2019, 140, 613–623. [Google Scholar] [CrossRef]
- Shikhaliyev, N.Q.; Kuznetsov, M.L.; Maharramov, A.M.; Van Tuyen, N.; Ahmadova, N.E.; Nenajdenko, V.G.; Mahmudov, K.T.; Pombeiro, A.J.L. Noncovalent interactions in the design of bis-azo dyes. CrystEngComm 2019, 21, 5032–5038. [Google Scholar] [CrossRef]
- Janssens, S.; Breukers, R.; Swanson, A.; Raymond, S. Photoinduced properties of Bis-azo chromophore host guest systems-birefringence and all optical tuneable polymer waveguide Bragg gratings. J. Appl. Phys. 2017, 122, 023107. [Google Scholar] [CrossRef]
- Garcia-Amorós, J.; Reig, M.; Cuadrado, A.; Ortega, M.; Nonell, S.; Velasco, D. A photoswitchable bis-azo derivative with a high temporal resolution. Chem. Commun. 2014, 50, 11462–11464. [Google Scholar] [CrossRef]
- Nourmohammadian, F.; Alikhani, M.; Gholami, M.; Abdi, A. Benzothiazole-Based Bis-azo Cationic Fluorescent Dyes with Extended Conjugated Systems: Synthesis and Properties. J. Appl. Solut. Chem. Model. 2015, 4, 83–94. [Google Scholar] [CrossRef][Green Version]
- Patel, D.R.; Patel, N.S.; Patel, H.S.; Patel, K.C. Synthesis, characterization and application of novel bisazo reactive dyes on various fibers. Orbital Electron. J. Chem. 2011, 3, 57–67. [Google Scholar]
- Scutaru, D.; Carlescu, I.; Cioanca, E.-R.B.; Ciobanu, C.I.; Lisa, G.; Hurduc, N. Bent-Core Liquid Crystals: Structures and Mesomorphic Properties. In Liquid Crystals Self-Organized Soft Functional Materials for Advanced Applications; IntechOpen: Iași, Romania, 2019. [Google Scholar]
- Akiyama, H.; Kawara, T.; Takada, H.; Takatsu, H.; Chigrinov, V.; Prudnikova, E.; Kozenkov, V.; Kwok, H. Synthesis and properties of azo dye aligning layers for liquid crystal cells. Liq. Cryst. 2002, 29, 1321–1327. [Google Scholar] [CrossRef]
- Saad, G.R.; Ahmed, N.H.; Fahmi, A.A.; Kaddah, M.M.; Naoum, M.M. Influence of lateral methyl and terminal substituents on the mesophase behaviour of four rings azo-ester liquid crystal compounds. Liq. Cryst. 2019, 46, 1285–1297. [Google Scholar] [CrossRef]
- Paebumrung, P.; Petsom, A.; Thamyongkit, P. Cardanol-Based Bis(azo) Dyes as a Gasoline 91 Colorant. J. Am. Oil Chem. Soc. 2011, 89, 321–328. [Google Scholar] [CrossRef]
- Mahmoud, W.H.; Omar, M.M.; Sayed, F.N. Synthesis, spectral characterization, thermal, anticancer and antimicrobial studies of bidentate azo dye metal complexes. J. Therm. Anal. Calorim. 2016, 124, 1071–1089. [Google Scholar] [CrossRef]
- Badea, M.; Emandi, A.; Marinescu, D.; Cristurean, E.; Olar, R.; Braileanu, A.; Budrugeac, P.; Segal, E. Thermal stability of some azo-derivatives and their complexes 1-(2-benzothiazolyl)-3-methyl-4-azo-pyrazil-5-one derivatives and their Cu(II) complexes. J. Therm. Anal. Calorim. 2003, 72, 525–531. [Google Scholar] [CrossRef]
- Radu, S.; Iovu, M. Éthers-oxydes polymères des composés azoïques. Hétéropolycondensation du azodiphénolate-4,4′ de sodium avec des dérivés bis(chlorométhylés) du benzène. Makromol. Chem. 1975, 176, 883–890. [Google Scholar]
- Radu, S.; Jianu, A.; Rău, G. Synthese et analyse spectrale des α,α’-bis-(azobenzene-4-oxy)-9,10-dimethyle-antracenes. Ann. Univ. Craiova. Chim. Ser. 1998, 27, 38–42. [Google Scholar]
- Radu, S.; Rău, G.; Moanță, A. Bis[(Phenylazo)biphenylenoxymethylen] anthracenes. Ann. Univ. Craiova. Chim Ser. 2000, 29, 164–169. [Google Scholar]
- Pogany, I.; Banciu, M. Physical Methods in Organic Chemistry; Scientific Publishing House: Bucharest, Romania, 1972. [Google Scholar]
- Pălărie, I. Optics of Anisotropic Materials; Universitaria Publishing House: Craiova, Romania, 2010. [Google Scholar]
- Shortley, G.; Williams, D. Elements of Physics; Prentice-Hall, Inc.: Englewood Cliffs, NJ, USA, 1971. [Google Scholar]
- Iacobescu, G.; Moţoc, C. Liquid crystals. In Physical Properties and Applications; Universitaria Publishing House: Craiova, Romania, 2004. [Google Scholar]
- Podstawka, E.; Światłowska, M.; Borowiec, E.; Proniewicz, L.M. Food additives characterization by infrared, Raman, and surface-enhanced Raman spectroscopies. J. Raman Spectrosc. 2007, 38, 356–363. [Google Scholar] [CrossRef]
- Pavia, D.L.; Lampman, G.M.; Kriz, G.S.; Vyvyan, J.R. Introduction to spectroscopy; Brooks/Cole Cengage Learning: Belmont, TN, USA, 2009. [Google Scholar]
- Peica, N. Vibrational Spectroscopy and Density Functional Theory Calculations on Biological Molecules. Ph.D. Thesis, Universität Würzburg, Fakultät für Chemie und Pharmazie, Würzburg, Germany, 2006. [Google Scholar]
- Socrates, G. Infrared and Raman Characteristic Group Frequencies: Tables and Charts, 3rd ed.; John Wiley & Sons: Chichester, UK, 2004. [Google Scholar]
- Silverstein, R.M.; Webster, F.X.; Kiemle, D.J. Spectrometric Identification of Organic Compounds; John Wiley & sons, Inc.: New York, NY, USA, 2005. [Google Scholar]
- Gunasekaran, S.; Sailatha, E.; Seshadri, S.; Kumaresan, S. FTIR FT Raman spectra and molecular structural confirmation of isoniazid. Indian J. Pure Appl. Phys. 2009, 47, 12–18. [Google Scholar]
- Lin-Vien, D.; Colthup, N.B.; Fateley, W.B.; Graselli, J.G. The Handbook of Infrared and Raman Characteristic Frequencies of Organic Molecules; Academic Press: Boston, MA, USA, 1991. [Google Scholar]
- Moanta, A.; Samide, A.; Rotaru, P.; Ionescu, C.; Tutunaru, B. Synthesis and characterization of novel furoate azodye using spectral and thermal methods of analysis. J. Therm. Anal. Calorim. 2014, 119, 1139–1145. [Google Scholar] [CrossRef]
- Beral, E.; Zapan, M. Organic Chemistry; Technical Publishing House: Bucharest, Romania, 1973. [Google Scholar]
- Pălărie, I. Spectroscopie, Lucrări Practice; Universitaria Publishing House: Craiova, Romania, 2004. [Google Scholar]
- Palarie, I.; Varut, M.C.; Chirigiu, L.M.E. Method of Determination of Rivanol by Laser Induced Fluoroscence. Rev. Chim. 2019, 70, 140–142. [Google Scholar] [CrossRef]
- Atomic Spectra Database. NIST Standard Reference Database 78. Available online: https://www.nist.gov/pml/atomic-spectra-database (accessed on 16 February 2020).
- NIST Atomic Spectra Database Lines Form. Available online: https://physics.nist.gov/PhysRefData/ASD/lines_form.html (accessed on 16 February 2020).
- Leulescu, M. Physical Aspects of the Behavior of Biological Active Materials. Ph.D. Thesis, University of Craiova, Craiova, Romania, 2019. [Google Scholar]
- Principles of Birefringence. Available online: https://www.microscopyu.com/techniques/polarized-light/principles-of-birefringence (accessed on 10 October 2020).
- Jianu, D.; Soare, B.; Matei, L. Microscopic Optical Properties of Transparent Minerals in Polarized Light. 2007. Available online: www.old.unibuc.ro (accessed on 10 October 2020).
- Polarized Light Microscopy. Available online: https://www.microscopyu.com/techniques/polarized-light (accessed on 10 October 2020).
- Wu, S.T.; Efron, U.; Hess, L.V.D. Birefringence measurements of liquid crystals. Appl. Optics 1984, 23, 3911–3915. [Google Scholar] [CrossRef] [PubMed]
- Hoffmann, R.; Baratoff, A.; Hug, H.J.; Hidber, H.R.; Löhneysen, H.V.; Güntherodt, H.-J. Mechanical manifestations of rare atomic jumps in dynamic force microscopy. Nanotechnology 2007, 18, 395503. [Google Scholar] [CrossRef]
- Ando, T.; Uchihashi, T.; Kodera, N.; Yamamoto, D.; Taniguchi, M.; Miyagi, A.; Yamashita, H. High-speed atomic force microscopy for observing dynamic biomolecular processes. J. Mol. Recognit. 2007, 20, 448–458. [Google Scholar] [CrossRef]
- Yokokawa, M.; Yoshimura, S.H.; Naito, Y.; Ando, T.; Yagi, A.; Sakai, N.; Takeyasu, K. Fast scanning atomic force microscopy reveals the molecular mechanism of DNA cleavage by Apal endonuclease. IEEE Proc. Nanobiotechnol. 2006, 153, 60–66. [Google Scholar] [CrossRef]
- Eaton, P.; West, P. Atomic Force Microscopy; Oxford University Press: Oxford, UK, 2010. [Google Scholar]
- Derkowska-Zielinska, B.; Skowronski, L.; Biitseva, A.; Grabowski, A.; Naparty, M.; Smokal, V.; Kysil, A.; Krupka, O. Optical characterization of heterocyclic azo dyes containing polymers thin films. Appl. Surf. Sci. 2017, 421, 361–366. [Google Scholar] [CrossRef]
- Derkowska, B.; Szmigiel, D.; Kysil, A.; Krupka, O.; Kozanecka-Szmigiel, A. Photoresponsive Behavior of Heterocyclic Azo Polymers with Various Functional Groups. J. Phys. Chem. C 2019, 124, 939–944. [Google Scholar] [CrossRef]
- Dabrowski, R.; Kula, P.; Herman, J. High birefringence liquid crystals. Crystals 2013, 3, 443–482. [Google Scholar] [CrossRef]
- Raman, C.V.; Bhagavantam, S. The relation between colour and molecular structure in organic compounds. In scattering of light. Indian J. Phys. 1929, 4, 57–78. [Google Scholar]
- Derkowska, B.; Skowronski, L.; Sypniewska, M.; Chomicki, D.; Smokal, V.; Kharchenko, O.; Naparty, M.; Krupka, O. Functionalized polymers with strong push-pull azo chromophores in side chain for optical application. Opt. Mater. 2018, 85, 391–398. [Google Scholar] [CrossRef]
- Wang, M.; Funabiki, K.; Matsui, M. Synthesis and properties of bis(hetaryl)azo dyes. Dye. Pigment. 2003, 57, 77–86. [Google Scholar] [CrossRef]
- Marzec, A.; Szadkowski, B.; Rogowski, J.; Maniukiewicz, W.; Zaborski, M. Characterization and Structure–Property Relationships of Organic–Inorganic Hybrid Composites Based on Aluminum–Magnesium Hydroxycarbonate and Azo Chromophore. Molecules 2019, 24, 880. [Google Scholar] [CrossRef]
- Parisi, F. Adsorption and Separation of Crystal Violet, Cerium(III) and Lead(II) by Means of a Multi-Step Strategy Based on K10-Montmorillonite. Minerals 2020, 10, 466. [Google Scholar] [CrossRef]
- Parisi, F.; Lazzara, G.; Merli, M.; Milioto, S.; Princivalle, F.; Sciascia, L. Simultaneous Removal and Recovery of Metal Ions and Dyes from Wastewater through Montmorillonite Clay Mineral. Nanomaterials 2019, 9, 1699. [Google Scholar] [CrossRef]
- Kučerík, J.; David, J.; Weiter, M.; Vala, M.; Vyňuchal, J.; Ouzzane, I.; Salyk, O. Stability and physical structure tests of piperidyl and morpholinyl derivatives of diphenyl-diketo-pyrrolopyrroles (DPP). J. Therm. Anal. Calorim. 2011, 108, 467–473. [Google Scholar] [CrossRef]
- Pausescu, I.; Todea, A.; Badea, V.; Peter, F.; Medeleanu, M.; Ledeti, I.; Vlase, G.; Titus, V. Optical and thermal properties of intelligent pH indicator flms based on chitosan/PVA and a new xanthylium dye. J. Therm. Anal. Calorim. 2020, 141, 999–1008. [Google Scholar] [CrossRef]
- Cao, C.R.; Liu, S.H.; Chi, J.H.; Yet-Pole, I.; Shu, C.M. Using thermal analysis and kinetics calculation method to assess the thermal stability of azobisdimethylvaleronitrile. J. Therm. Anal. Calorim. 2019, 138, 2853–2863. [Google Scholar] [CrossRef]
- Porobic, S.J.; Krstic, A.D.; Jovanovic, D.J.; Lađarevic, J.M.; Katnic, D.B.; Mijin, D.Z.; Marinovic-Cincovic, M. Synthesis and thermal properties of arylazo pyridone dyes. Dye. Pigment. 2019, 170, 107602. [Google Scholar] [CrossRef]
- Pellegrini, D.; Corsi, M.; Bonanni, M.; Bianchini, R.; D’Ulivo, A.; Bramanti, E. Study of the interaction between collagen and naturalized and commercial dyes by Fourier transform infrared spectroscopy and thermogravimetric analysis. Dye. Pigment. 2015, 116, 65–73. [Google Scholar] [CrossRef]
- Revanna, R.H.; Panchangam, R.K.; Bhanu, U.; Doddavenkatanna, S. Synthesis, Characterization and in vitro Antioxidant Activity of New Chiral N -boc Organotellurium Compounds, (CH 3 ) 3 OC(O)NHCH(R)C(O)NHCH 2 -CH 2 Te-C 6 H 4 -4-OCH 3, Containing Carbamate and Peptide Groups. J. Braz. Chem. Soc. 2016, 27, 1157–1164. [Google Scholar] [CrossRef]
- Ji, Z.; Sheardy, A.; Zeng, Z.; Zhang, W.; Chevva, H.; Allado, K.; Yin, Z.; Wei, J. Tuning the Functional Groups on Carbon Nanodots and Antioxidant Studies. Molecules 2019, 24, 152. [Google Scholar] [CrossRef] [PubMed]
Sample Availability: Samples of the dyes are available from the authors. |


| BPA (intensity *)/cm−1 | BTA (intensity *)/cm−1 | Assignments |
|---|---|---|
| 1600.91 (m) | 1602.06 (m) | aromatic nucleus conjugated with the azo group; -N=N-; |
| 1480.81 (s) | 1484.95 (s) | -N=N-; aromatic ring stretching vibration; |
| 1375.12 (m) | 1375.42 (m) | polynuclear aromatic compounds; |
| 1233.51 (s) | 1241.88 (s) | CAr-O-CH2- (antisymmetrical vibrations) |
| 1169.99 (s) | 1172.22 (s) | CAr-O-CH2- (symmetrical vibrations) |
| 807.88 (m) | 812.83 (m) | anthracene radical; |
| 754.73 (vs) | 752.55 (vs) | anthracene radical; |
| Ion | Wavelength Measured (in Air) λ/nm ±0.31 nm | Wavelength from the Literature (in Air) λ/nm | Wavelength Calculated Ritz (in Air) λ/nm | Energy of the Superior Level Ek/eV | Energy of the Inferior Level Ei/eV | The Electronic Configuration of the Superior Level | The Electronic Configuration of the Inferior Level |
|---|---|---|---|---|---|---|---|
| C I | 476.84 | 476.6669 | 476.6667 | 81,325.81077 | 60,352.6584 | 2s22p4p | 2s22p3s |
| C I | 477.0023 | 477.0023 | 81,311.0544 | 60,352.6584 | 2s22p4p | 2s22p3s | |
| C II | 533.75 | - | 533.4789 | 22.473901 | 20.150478 | 2s26s | 2s24p |
| C III | - | 533.7395 | 42.172212 | 39.849923 | 1s22p(2P°)3d | 1s22s4d | |
| C II | 554.07 | - | 553.7609 | 21.732866 | 19.494540 | 2s25p | 2s24s |
| C I | 554.0756 | 554.0753 | 10.880080 | 8.64302361 | 2s22p7s | 2s22p3p | |
| C I | 554.3817 | 554.3810 | 10.882983 | 8.64716033 | 2s22p6d | 2s22p3p | |
| C I | 665.02 | 665.10 | 665.1008 | 10.7142897 | 8.85066275 | 2s22p6s | 2s22p3p |
| C I | 682.08 | 681.80 | 681.7976 | 88,638.99 | 73,975.92785 | 2s22p(2P°3/2)7d | 2s22p3p |
| Ion | Wavelength Measured (in Air) λ/nm ±0.31 nm | Wavelength from the Literature (in Air) λ/nm | Wavelength Calculated Ritz (in Air) λ/nm | Energy of the Superior Level Ek/eV | Energy of the Inferior Level Ei/eV | The Electronic Configuration of the Superior Level | The Electronic Configuration of the Inferior Level |
|---|---|---|---|---|---|---|---|
| N III | 449.92 | - | 450.111 | 362,066 | 339,855.5 | 2s27d | 2s2p(3P°)3d |
| N IV | 476.84 | - | 476.986 | 505,554.0 | 484,594.9 | 1s22p(2P°)3d | 1s22p(2P°)3p |
| N II | 511.54 | - | 511.4285 | 190,120.24 | 170 607.89 | 2s22p3d | 2s22p3p |
| N I | 519.99 | - | 5519.7902 | 19,233.177 | 0.000 | 2s22p3 | 2s22p3 |
| N II | - | 519.9501 | 243,012.77 | 223,785.51 | 2s2p2(4P)3d | 2s2p2(4P)3p | |
| N I | - | 519.9837 | 112,807.567 | 93,581.550 | 2s22p2(3P)5d | 2s22p2(3P)3p | |
| N I | - | 520.0257 | 19,224.464 | 0.000 | 2s22p3 | 2s22p3 | |
| N IV | - | 520.041 | 484,594.9 | 465,371.0 | 1s22p(2P°)3p | 1s22p(2P°)3s | |
| N I | - | 520.1606 | 112,801.031 | 93,581.550 | 2s22p2(3P)5d | 2s22p2(3P)3p | |
| N II | 533.75 | - | 533.8729 | 244,353.31 | 225,627.47 | 2s2p2(4P)3d | 2s2p2(4P)3p |
| N II | - | 534.0207 | 244,391.88 | 225,671.22 | 2s2p2(4P)3d | 2s2p2(4P)3p | |
| N II | 554.07 | - | 554.0061 | 223,643.30 | 205,597.97 | 2s2p2(4P)3p | 2s2p2(4P)3s |
| N II | - | 554.3471 | 223,688.45 | 205,654.22 | 2s2p2(4P)3p | 2s2p2(4P)3s | |
| N I | 630.236 | - | 630.3915 | 112,609.612 | 96,750.840 | 2s22p2(3P)6s | 2s22p2(3P)3p |
| N I | 665.02 | - | 664.8256 | 112,807.567 | 97,770.180 | 2s22p2(3P)5d | 2s22p2(3P)3p |
| N I | - | 665.1147 | 112,801.031 | 97,770.180 | 2s22p2(3P)5d | 2s22p2(3P)3p | |
| N I | 738.34 | - | 737.8513 | 110,299.974 | 96,750.840 | 2s22p2(3P)4d | 2s22p2(3P)3p |
| N I | - | 738.010 | 96,864.050 | 83,317.830 | 2s22p2(3P)3p | 2s22p2(3P)3s |
| Ion | Wavelength Measured (in Air) λ/nm ±0.31 nm | Wavelength from the Literature (in Air) λ/nm | Wavelength Calculated Ritz (in Air) λ/nm | Energy of the Superior Level Ek/eV | Energy of the Inferior Level Ei/eV | The Electronic Configuration of the Superior Level | The Electronic Configuration of the Inferior Level |
|---|---|---|---|---|---|---|---|
| O V | 511.54 | - | 511.4057 | 580,824.9 | 561,276.4 | 1s22s3p | 1s22s3s |
| O III | - | 511.775 | 394,197.9 | 374,663.52 | 2s2p2(2D)3s | 2s2p2(4P)3p | |
| O IV | 519.68 | - | 519.822 | 573,696 | 554,464 | 2s2p(3P°)4s | 2s2p(1P°)3p |
| O V | 533.75 | - | 533.994 | 708,125.1 | 689,403.5 | 1s22p(2P°3/2)3d | 1s22p(2P°1/2)3p |
| O I | 630.24 | - | 630.0304 | 15,867.862 | 0.000 | 2s22p4 | 2s22p4 |
| O II | 665.02 | 665.2563 | 665.2559 | 246,455.629 | 231,427.970 | 2s22p2(3P)4p | 2s22p2(3P)3d |
| O II | 690.57 | 690.6443 | 690.6436 | 245,903.224 | 231,427.970 | 2s22p2(3P)4p | 2s22p2(3P)3d |
| O V | - | 690.727 | 704,182.0 | 689,708.5 | 1s22p(2P°1/2)3d | 1s22p(2P°3/2)3p | |
| O II | 690.7872 | 690.7873 | 245,768.37 | 231,296.126 | 2s22p2(3P)4p | 2s22p2(3P)3d | |
| O II | 729.05 | 728.7894 | 728.7900 | 246,320.086 | 232,602.492 | 2s22p2(3P)4p | 2s22p2(3P)3d |
| O II | 729.2129 | 729.2124 | 246,455.629 | 232,745.981 | 2s22p2(3P)4p | 2s22p2(3P)3d | |
| O II | 729.2962 | 729.2965 | 246,455.629 | 232,747.562 | 2s22p2(3P)4p | 2s22p2(3P)3d | |
| O II | 738.34 | - | 738.0307 | 246,291.822 | 232,745.981 | 2s22p2(3P)4p | 2s22p2(3P)3d |
| O II | 738.1118 | 738.1168 | 246,291.822 | 232,747.562 | 2s22p2(3P)4p | 2s22p2(3P)3d | |
| O II | 738.3744 | 738.3758 | 266,588.33 | 253,048.82 | 2s22p2(1D)4p | 2s22p2(1D)3d |
| The Measured Wavelength λ/nm (Intensity) * | The Atom (ion) in BPA That Has Electronic Fluorescence at a Certain Wavelength | ||
|---|---|---|---|
| C | O | N | |
| 449.92 (vw) | - | - | Yes |
| 476.84 (vs) | Yes | - | Yes |
| 511.54 (s) | - | Yes | Yes |
| 519.99 (m) | - | Yes | Yes |
| 533.75 (s) | Yes | Yes | Yes |
| 554.07 (vs) | Yes | - | Yes |
| 630.22 (w) | - | Yes | Yes |
| 665.02 (w) | Yes | Yes | Yes |
| 682.08 (s) | Yes | - | - |
| 690.57 (m) | - | Yes | - |
| 729.05 (w) | - | Yes | - |
| 738.34 (m) | - | Yes | Yes |
| Ion | Wavelength Measured (in Air) λ/nm ±0.31 nm | Wavelength from the Literature (in Air) λ/nm | Wavelength Calculated Ritz (in Air) λ/nm | Energy of the Superior Level Ek/eV | Energy of the Inferior Level Ei/eV | The Electronic Configuration of the Superior Level | The Electronic Configuration of the Inferior Level |
|---|---|---|---|---|---|---|---|
| C I | 476.84 | 476.6669 | 476.6667 | 81,325.81077 | 60,352.6584 | 2s22p4p | 2s22p3s |
| C I | 477.0023 | 477.0023 | 81,311.0544 | 60,352.6584 | 2s22p4p | 2s22p3s | |
| C I | 532.37 | - | 532.4065 | 87,633.77 | 68,856.35208 | 2s22p6d | 2s22p3p |
| C II | 554.07 | - | 553.7609 | 175,287.39 | 157,234.07 | 2s25p | 2s24s |
| C I | 554.0756 | 554.0753 | 87,753.763 | 69,710.68728 | 2s22p7s | 2s22p3p | |
| C I | 684.37 | 681.80 | 681.7976 | 88,638.99 | 73,975.92785 | 2s22p(2P°3/2)7d | 2s22p3p |
| Ion | Wavelength Measured (in Air) λ/nm ±0.31 nm | Wavelength from the Literature (in Air) λ/nm | Wavelength CalculatedRitz (in Air) λ/nm | Energy of the Superior Level Ek/eV | Energy of the Inferior Level Ei/eV | The Electronic Configuration of the Superior Level | The Electronic Configuration of the Inferior Level |
|---|---|---|---|---|---|---|---|
| N III | 449.92 | - | 450.111 | 362,066 | 339,855.5 | 2s27d | 2s2p(3P°)3d |
| N IV | 476.84 | - | 476.986 | 505,554.0 | 484,594.9 | 1s22p(2P°)3d | 1s22p(2P°)3p |
| N II | 511.54 | - | 511.4285 | 190,120.24 | 170,572.61 | 2s22p3d | 2s22p3p |
| N II | 519.19 | - | 519.0380 | 243,046.56 | 223,785.51 | 2s2p2(4P)3d | 2s2p2(4P)3p |
| N II | - | 519.1965 | 242,986.76 | 223,731.59 | 2s2p2(4P)3d | 2s2p2(4P)3p | |
| N III | 532.37 | 532.082 | 532.087 | 339,855.5 | 321,066.8 | 2s2p(3P°)3d | 2s2p(3P°)3p |
| N II | - | 532.0958 | 244,391.88 | 225,603.50 | 2s2p2(4P)3d | 2s2p2(4P)3p | |
| N II | 554.07 | - | 554.0061 | 223,643.30 | 205,597.97 | 2s2p2(4P)3p | 2s2p2(4P)3s |
| N II | - | 554.3471 | 223,688.45 | 205,654.22 | 2s2p2(4P)3p | 2s2p2(4P)3s | |
| N I | 738.02 | - | 737.8513 | 110,299.974 | 96,750.840 | 2s22p2(3P)4d | 2s22p2(3P)3p |
| N I | - | 738.010, | 96,864.050 | 83,317.830 | 2s22p2(3P)3p | 2s22p2(3P)3s |
| Ion | Wavelength Measured (in Air) λ/nm ±0.31 nm | Wavelength from the Literature (in Air) λ/nm | Wavelength Calculated Ritz (in Air) λ/nm | Energy of the Superior Level Ek/eV | Energy of the Inferior Level Ei/eV | The Electronic Configuration of the Superior Level | The Electronic Configuration of the Inferior Level |
|---|---|---|---|---|---|---|---|
| O V | 511.54 | - | 511.4057 | 580,824.9 | 561,276.4 | 1s22s3p | 1s22s3s |
| O III | - | 511.775 | 394,197.9 | 374,663.52 | 2s2p2(2D)3s | 2s2p2(4P)3p | |
| O II | 519.19 | 519.0496 | 519.0498 | 233,430.53 | 214,169.920 | 2s22p2(3P)3d | 2s22p2(3P)3p |
| O II | 532.37 | 532.2525 | 532.2502 | 267,298.23 | 248,515.30 | 2s22p2(3P)6s | 2s22p2(3P)4p |
| O II | 684.37 | - | 684.4098 | 245,903.224 | 231,296.126 | 2s22p2(3P)4p | 2s22p2(3P)3d |
| O II | 729.37 | 729.2129 | 729.2124 | 246,455.629 | 232,745.981 | 2s22p2(3P)4p | 2s22p2(3P)3d |
| O II | 729.2962 | 729.2965 | 246,455.629 | 232,747.562 | 2s22p2(3P)4p | 2s22p2(3P)3d | |
| O II | 729.6310 | 729.6294 | 246,455.629 | 232,753.816 | 2s22p2(3P)4p | 2s22p2(3P)3d | |
| O II | 738.02 | - | 738.0307 | 246,291.822 | 232,745.981 | 2s22p2(3P)4p | 2s22p2(3P)3d |
| O II | 738.1118 | 738.1168 | 246,291.822 | 232,747.562 | 2s22p2(3P)4p | 2s22p2(3P)3d |
| The Measured Wavelength λ/nm (Intensity) * | The Atom (ion) in BTA That Has Electronic Fluorescence at a Certain Wavelength | ||
|---|---|---|---|
| C | O | N | |
| 449.92 (vw) | - | - | Yes |
| 476.84 (vs) | Yes | - | Yes |
| 511.54 (w) | - | Yes | Yes |
| 519.19 (w) | - | Yes | Yes |
| 532.37 (w) | Yes | Yes | Yes |
| 554.07 (s) | Yes | - | Yes |
| 684.37 (m) | Yes | Yes | - |
| 729.37 (w) | - | Yes | - |
| 738.02 (w) | - | Yes | Yes |
| Line | Min/ nm | Max/ nm | Mid/ nm | Mean/ nm | Rpv/ nm | Rq/ nm | Ra/ nm | Rsk | Rku |
|---|---|---|---|---|---|---|---|---|---|
| Red | 84 | 1453 | 684 | 216 | 1573 | 394 | 284 | −1.979 | 5.910 |
| Green | 0 | 1373 | 687 | 836 | 1374 | 456 | 405 | 0.435 | 1.740 |
| Line | Min/ nm | Max/ nm | Mid/ nm | Mean/ nm | Rpv/ nm | Rq/ nm | Ra/ nm | Rsk | Rku |
|---|---|---|---|---|---|---|---|---|---|
| Red | −29 | 445 | 208 | 40 | 474 | 113 | 77 | −2.277 | 7.115 |
| Green | −12 | 292 | 140 | 119 | 303 | 108 | 97 | −0.270 | 1.552 |
| Sample | Min/ nm | Max/ nm | Mid/ nm | Mean/ nm | Rpv/ nm | Rq/ nm | Ra/ nm | Rsk | Rku |
|---|---|---|---|---|---|---|---|---|---|
| BPA | −88 | 1482 | 697 | 47 | 1570 | 186 | 107 | −4.017 | 22.630 |
| BTA | −73 | 988 | 458 | 57 | 1060 | 147 | 101 | −2.531 | 9.760 |
| Temperature Range/ °C | Mass Loss (Experimental)/ % | Mass Loss (Theoretical)/ % | Identified Lost Groups | ΔH/ J g−1 | Observations |
|---|---|---|---|---|---|
| 216.2–228.8 | - | - | - | ∆H0 = 20.8 | endotherm-melting |
| 254.2–305.8 | 47.48 | 48.00 | 2(C6H4-C6H4) 2N2 | ∆H1 = −241.4 | the first exothermic oxidative decomposition |
| 443.0–591.0 | 50.00 | 52.00 | 2C6H5 2(CH2-O) C14H8 | ∆H2 = −9820.9 | the second exothermic oxidative decomposition |
| Temperature Range/ °C | Mass Loss (Experimental)/ % | Mass Loss (Theoretical)/ % | Identified Lost Groups | ΔH/ J g−1 | Observations |
|---|---|---|---|---|---|
| 219.3–228.3 | - | - | - | ∆H0 = 14.4 | endotherm-melting |
| 259.4–301.5 | 39.36 | 39.07 | 2(C6H4-C6H4) | ∆H1 = −318.7 | the first exothermic oxidative decomposition |
| 437.8–593.0 | 54.00 | 56.30 | 2N2 2(CH3-C6H4) 2(CH2-O) C11H8 | ∆H2 = −10,888.2 | the second exothermic oxidative decomposition |
| 600 | 5.00 | 4.63 | 3C | - | residue |
| Wavenumber/cm−1 | |
|---|---|
| BPA-Untreated Skin | BPA-Treated Skin |
| 3299 | 3304 |
| 2931 | 2920 |
| - | 2851 |
| 1651 | 1652 |
| 1549 | 1541 |
| 1454 | 1456 |
| 1236 | 1234 |
| - | 1163 |
| 1033 | 1034 |
| Wavenumber/cm−1 | |
|---|---|
| BTA-Untreated Skin | BTA-Treated Skin |
| 3294 | 3284 |
| 2920 | 2921 |
| 2851 | - |
| 1652 | 1651 |
| 1635 | 1634 |
| 1557 | 1549 |
| 1456 | 1449 |
| 1437 | - |
| - | 1375 |
| 1339 | 1337 |
| 1235 | 1233 |
| 1201 | - |
| 1158 | - |
| 1033 | 1032 |
Publisher’s Note: MDPI stays neutral with regard to jurisdictional claims in published maps and institutional affiliations. |
© 2020 by the authors. Licensee MDPI, Basel, Switzerland. This article is an open access article distributed under the terms and conditions of the Creative Commons Attribution (CC BY) license (http://creativecommons.org/licenses/by/4.0/).
Share and Cite
Carabet, C.A.; Moanță, A.; Pălărie, I.; Iacobescu, G.; Rotaru, A.; Leulescu, M.; Popescu, M.; Rotaru, P. Physical, Thermal and Biological Properties of Yellow Dyes with Two Azodiphenylether Groups of Anthracene. Molecules 2020, 25, 5757. https://doi.org/10.3390/molecules25235757
Carabet CA, Moanță A, Pălărie I, Iacobescu G, Rotaru A, Leulescu M, Popescu M, Rotaru P. Physical, Thermal and Biological Properties of Yellow Dyes with Two Azodiphenylether Groups of Anthracene. Molecules. 2020; 25(23):5757. https://doi.org/10.3390/molecules25235757
Chicago/Turabian StyleCarabet, Carla Alice, Anca Moanță, Ion Pălărie, Gabriela Iacobescu, Andrei Rotaru, Marian Leulescu, Mariana Popescu, and Petre Rotaru. 2020. "Physical, Thermal and Biological Properties of Yellow Dyes with Two Azodiphenylether Groups of Anthracene" Molecules 25, no. 23: 5757. https://doi.org/10.3390/molecules25235757
APA StyleCarabet, C. A., Moanță, A., Pălărie, I., Iacobescu, G., Rotaru, A., Leulescu, M., Popescu, M., & Rotaru, P. (2020). Physical, Thermal and Biological Properties of Yellow Dyes with Two Azodiphenylether Groups of Anthracene. Molecules, 25(23), 5757. https://doi.org/10.3390/molecules25235757