Article

Thermodynamic Analysis of Trisiloxane Surfactant Adsorption and Aggregation Processes

by
Joanna Karasiewicz
1,* and
Joanna Krawczyk
2,*
1
Chemistry and Technology of Silicon Compounds, Faculty of Chemistry, Adam Mickiewicz University in Poznań, Uniwersytetu Poznańskiego 8, 61-614 Poznań, Poland
2
Department of Interfacial Phenomena, Institute of Chemical Sciences, Faculty of Chemistry, Maria Curie-Skłodowska University in Lublin, Maria Curie-Skłodowska Sq. 3, 20-031 Lublin, Poland
*
Authors to whom correspondence should be addressed.
Molecules 2020, 25(23), 5669; https://doi.org/10.3390/molecules25235669
Submission received: 9 November 2020 / Revised: 28 November 2020 / Accepted: 29 November 2020 / Published: 1 December 2020
(This article belongs to the Special Issue 25th Anniversary of Molecules—Recent Advances in Physical Chemistry)

Abstract

:
The trisiloxane polyether surfactant (3-[3-(hydroxy)(polyethoxy)propyl]-1,1,1,3,5,5,5 -heptamethyltrisiloxane) (TS-EO12) was successfully synthesized by a hydrosilylation reaction in the presence of Karstedt catalyst. The structural analysis of the surfactant was done by 1H-NMR, 13C-NMR, 29Si-NMR and FT-IR analysis. In addition the thermal stability of TS-EO12 was studied by the thermogravimetric measurements. On the one hand the surface properties of TS-EO12 at the water-air interface were investigated by surfactant aqueous solutions surface tension measurements carried out at 293 K, 303 K and 313 K, and on the other the aggregation properties were analyzed based on the solubilization properties of TS-EO12 aggregates at different temperatures. On the basis of the obtained thermodynamic parameters of adsorption and micellization of studied surfactant the temperature impact on its surface and volume properties were deduced. It was proved that the tendency of the studied surfactant molecules to adsorb at the water-air interface and to form micelles weakens with decreasing temperature. It was also concluded that the structure of the adsorption layer changes with temperature. Optical microscopy measurements were used for the TS-EO12 micelle morphology determination.

1. Introduction

Siloxanes are synthetic polymers whose skeleton is made up of alternately arranged silicon and oxygen atoms. Thanks to the presence of the Si–H bond, it is possible to attach all kinds of substituents, e.g., amino [1,2,3,4], epoxycarbo [5,6,7], aryl and methacrylic [8,9] or polyether [4,10,11] groups. Modification of polysiloxanes with organic groups provides a wide range of hybrid materials combining the properties of polysiloxanes (thermal resistance, oxidation resistance, gas permeability, low surface tension, excellent dielectric properties, physiological neutrality and moisture resistance) with those of organic functional groups. The hybrid materials obtained in this way may show a wide range of diverse properties meeting the needs of different branches of industry [12,13,14]. The most effective and widely used method for the introduction of different functional groups, for example polyether ones, to the polysiloxane chain is the addition to the Si–H bond in unsaturated compounds containing a desired functional group, so the process of hydrosilylation. The precursor containing the Si–H bond can be a siloxane polymer, cyclic siloxane oligomer and monomeric silane containing Si–H bond and two substituents prone to hydrolysis at the silicon atom. These reactions are usually catalyzed by platinum compounds [15,16,17,18]. Often encountered in literature is also the method for the synthesis of silicon polyethers by the reaction of hydrothiolation [19,20,21,22,23].
Modified siloxanes composed of the hydrophobic and hydrophilic moieties within the same molecule (amphiphilic nature) reduce the surface tension and exhibit a tendency to association and self-assembly. Thus they can be applied as surfactants [24,25,26]. Siloxane surfactants consist of a methylated siloxane hydrophobic group coupled to one or more polar groups. Functional groups can be attached through either a Si–C or a Si–O–C linkage.
The most popular hydrophilic groups present in siloxane surfactants are the non-ionic polyoxyalkylene, polyoxyethylene or copolymer of polyoxyethylene and polyoxypropylene. However, it is worth noting that a polyoxypropylene group is hydrophobic and contributes to the hydrophobicity of the surfactant rather than to its hydrophilicity. In addition, hydrophilic, higher alkyl, and fluorocarbon groups as well as a combination of these groups can be attached to the siloxane backbone to make materials that are surface active towards a variety of surfaces and interfaces. As siloxane surfactants show surface and interface activity, low toxicity and unique association behavior they find a variety of applications in the areas in which other types of surfactants are relatively ineffective. Another attractive feature of siloxane surfactants is a variety of their synthetic routes and the consequent diversity of their possible structures [27]. It is interesting that trisiloxane surfactants consisting of a polyoxyethylene polar group of four to eight units show the unique property of facilitating the spreading of water on very hydrophobic hydrocarbon surfaces such as polyethylene and paraffin [28,29]. As the special wetting properties of these surfactants are strictly connected with their unique structure, the ability to lower the liquid-air surface tension to extremely low values, fast kinetics of adsorption at different interfaces, high affinity for low energy surfaces as well as specific orientation and structure of their adsorbed molecules it is so important to establish these properties in different conditions [30].
The unique structure of siloxane surfactants results from the relatively flexible Si–O–Si bond which enables them to adopt a variety of configurations. It occurs that the molecular weight affects the relevant properties of such surfactants. However, it should be remembered that the increase in the molecular weight can be connected with the hydrophobic as well as hydrophilic part of surfactant. Compared with hydrocarbon surfactants, trisiloxane ones have considerably higher surface activity attributed to the trimethylsiloxy group on the Si−O−Si chain. Because of their unique molecular structures, they can absorb at the air/solution interface an “umbrella-like’’ configuration closely packed with the −CH3 groups and exposed to the lower surface tension values (about 21 mN/m). Gentle et al. [24] studied a series of polyether based trisiloxanes with different ethylene oxide (EO) chain lengths and proved that the critical micelle concentration (CMC) and surface tension at CMC increase with increasing EO chain length. It occurs that the increasing EO chain length can increasingly penetrate and disrupt the closely packed surface monolayer, especially polyether-based trisiloxanes above 16 EO chain length. Moreover, the surface activities of poly(ethylene glycol) grafted polysiloxane were sensitive to the weight fraction of EO, the length of the EO chain, and size of the hydrophobic siloxane (trisiloxane, tetrasiloxane or polysiloxane) part. Like all non-ionics, siloxane surfactants are characterized by low critical micelle concentration values depending on both the polymerization and structure of hydrophilic and hydrophobic (methylsiloxane) groups [27].
Thanks to the specific and favorable physicochemical properties siloxane surfactants have been widely employed as stabilizers for polyurethane foams, antifoaming in fuels and heavy oils as well as polymer-based dispersions, detergents, paints and inks. They have also been proven to be efficient wetting agents in spreading aqueous formulations [28,29].
Although the range of practical application of these surfactants is so wide, the temperature effect on their stability as well as adsorption and micellization process in aqueous media has not been sufficiently established. In addition, the literature provides many discrepancies regarding the relationship between the structure and physicochemical properties of siloxane surfactants as well as their behavior in adsorption and micellization process at different temperatures. Some of the authors explain these discrepancies in terms of polydispersity of the surfactant.
Thus the purpose of our studies was to determine the adsorption and aggregation properties of freshly synthesized trisiloxane polyether surfactant: 3-[3-(hydroxy)(polyethoxy)propyl]- 1,1,1,3,5,5,5-heptamethyltrisiloxane) (TS-EO12). These properties were studied in wide range of TS-EO12 concentrations at different temperatures (293 K, 303 K and 313 K) by using surface tension, density as well as fluorescence intensities measurements. Additionally the morphology of the aggregates formed from the aqueous solution of studied surfactant with the concentration well above the CMC were studied by confocal microscopy. The synthesized products were characterized by 1H-NMR, 13C-NMR, 29Si-NMR, FT-IR and gel permeation chromatography (GPC) analysis. Thermal stability of TS-EO12 was characterized by using thermogravimetric analysis (TGA).

2. Results and Discussion

2.1. Synthesis Results

The siloxane polyether synthesis was performed using an allyl polyether containing 12 ethoxy groups with a terminal hydroxy group. Thus, two groups of contrasting surface properties, i.e., polyether groups showing hydrophilic properties and methyl groups in the siloxane showing hydrophobic properties, were linked in one compound. The reaction substrates, 1,1,1,3,5,5,5-heptamethyltrisiloxane and the olefin used are not sensitive to moisture, so the hydrosilylation reaction could be performed in an open system, which significantly facilitated the synthesis. All reactions were carried out in toluene as a solvent. The catalyst was the commercially available Karstedt one. The hydrosilylation reaction is shown in Scheme 1.
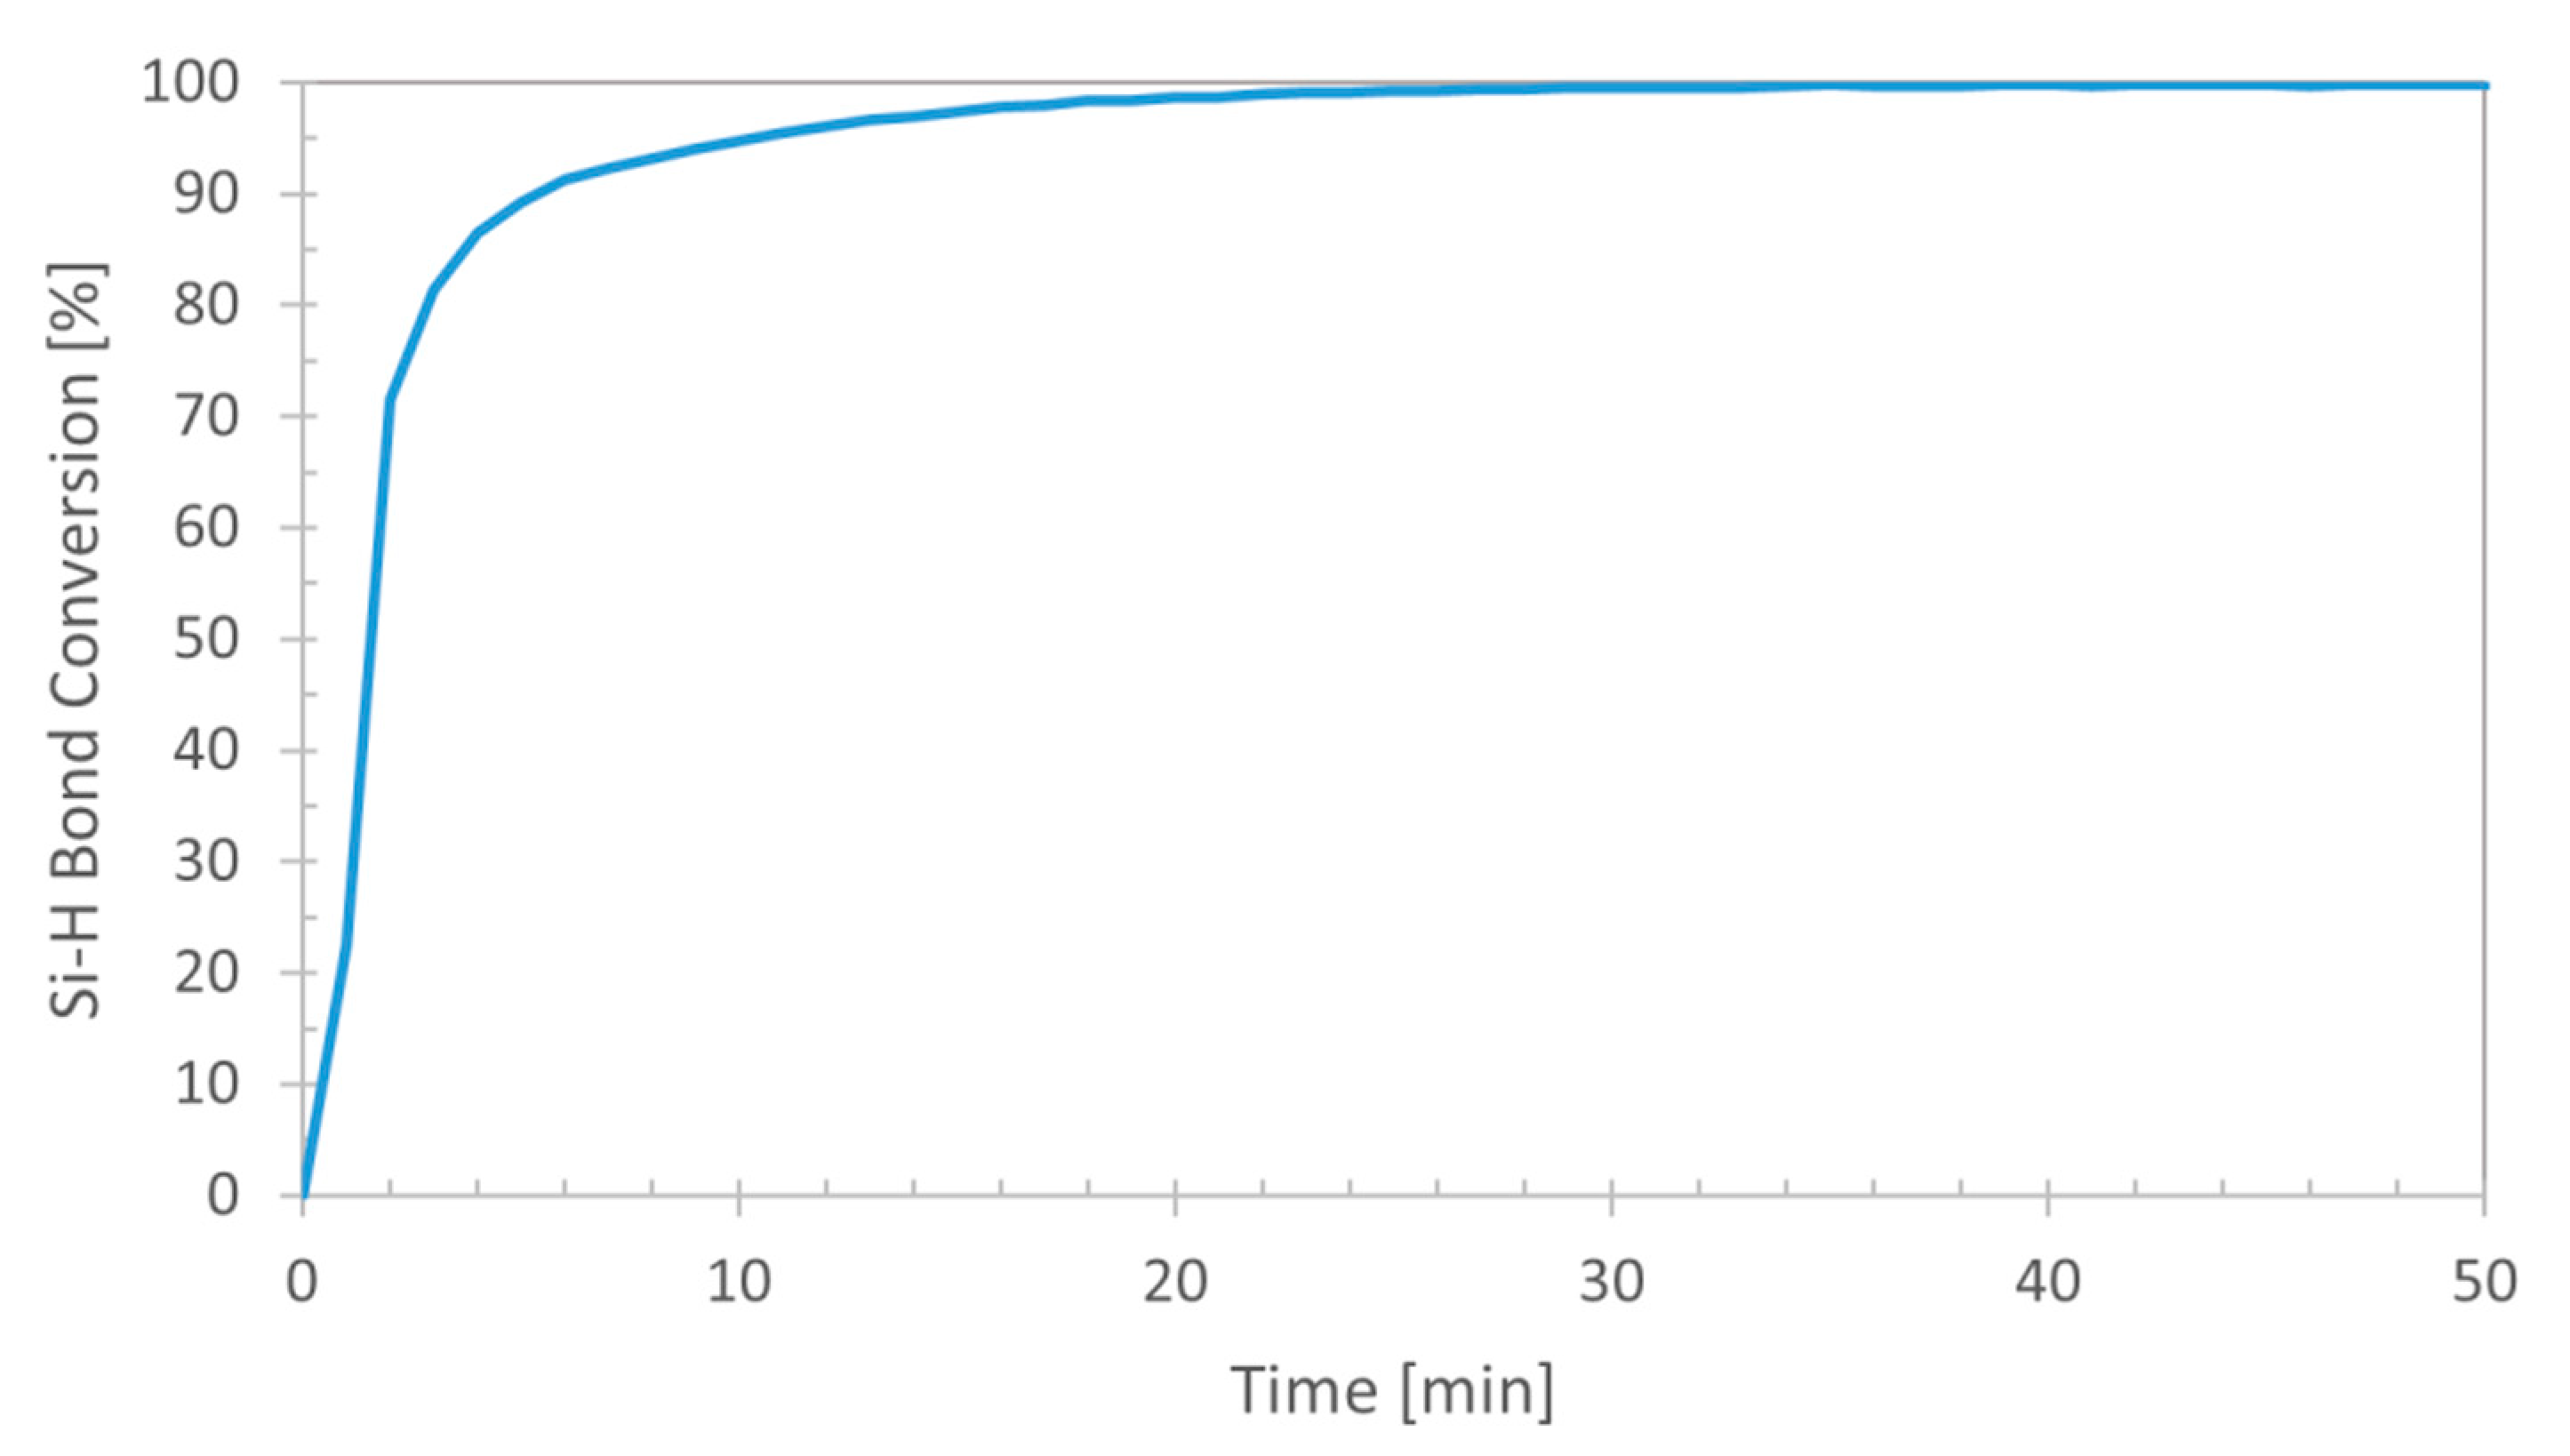
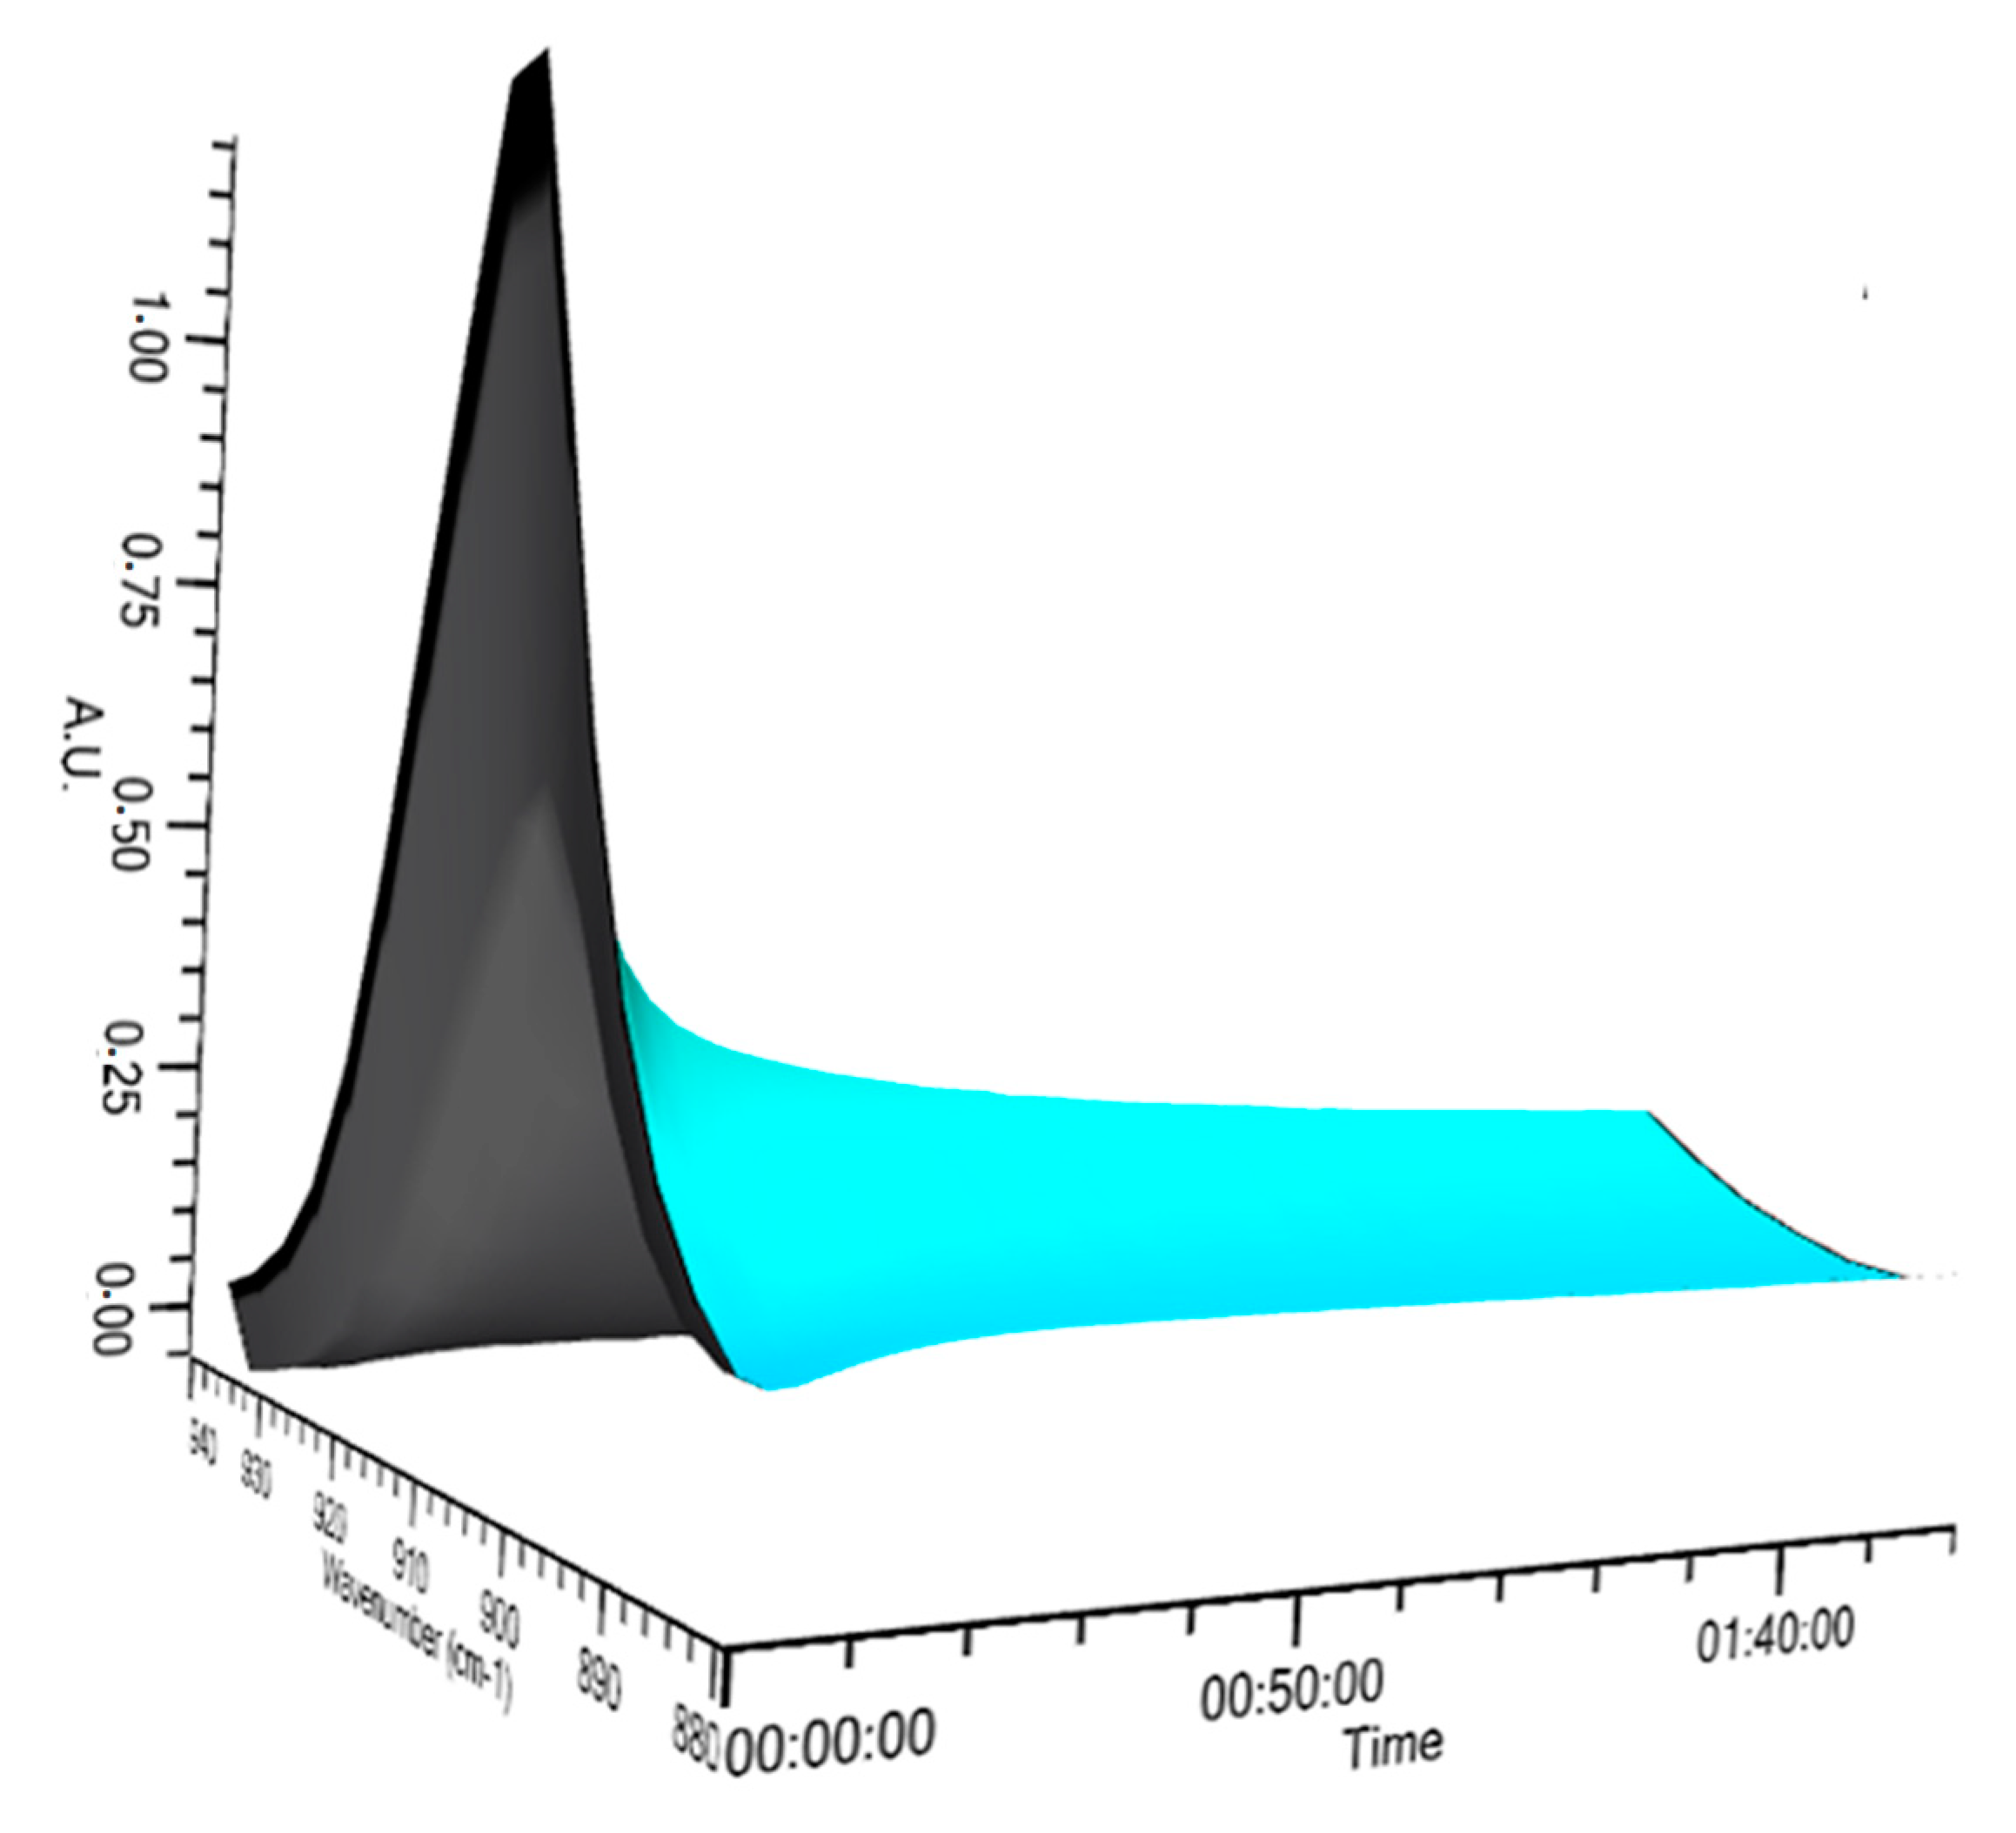
Hydrosilylation of allyl polyether with the terminal hydroxyl group with 1,1,1,3,5,5,5-heptamethyltrisiloxane was monitored using IR spectroscopy in real time. The reaction progress was quantified by checking the rate of changes in the area under the band with a maximum at a wavenumber ( υ ˜ ) equal to 904 cm−1 assigned to the stretching vibrations of the Si–H bond, illustrated in Figure 1. In order to analyze the kinetics of the process in more detail, the trend of changes in the area of the observed band at 904 cm−1 in time is shown in Figure 2, while Figure 3 presents the trend of temperature changes in time. The parameters of the process were chosen so that the catalyst in a proper stoichiometric amount would be dosed after temperature stabilization. Analysis of the trends presented in Figure 2 and Figure 3, shows that the loss of Si–H bond conversion takes place directly after addition of a catalyst portion. At that time a jump in temperature, characteristic of exothermal hydrosilylation reaction takes place (Figure 3), leading to almost immediate conversion of the Si–H conversion reaching over 90% (Figure 2). Further increase in the Si–H conversion is induced by the heating of the reaction mixture as indicated by the correlated in time temperature change. Total conversion of Si–H bonds in the system studied was reached after about 55 min of the reaction measured from the moment of the catalyst addition. To sum up, the possibility of carrying the reaction out in an open system, high conversion reached in a relatively short time and high conversion of the process, reaching 97% indicate that the system is optimal and highly effective.
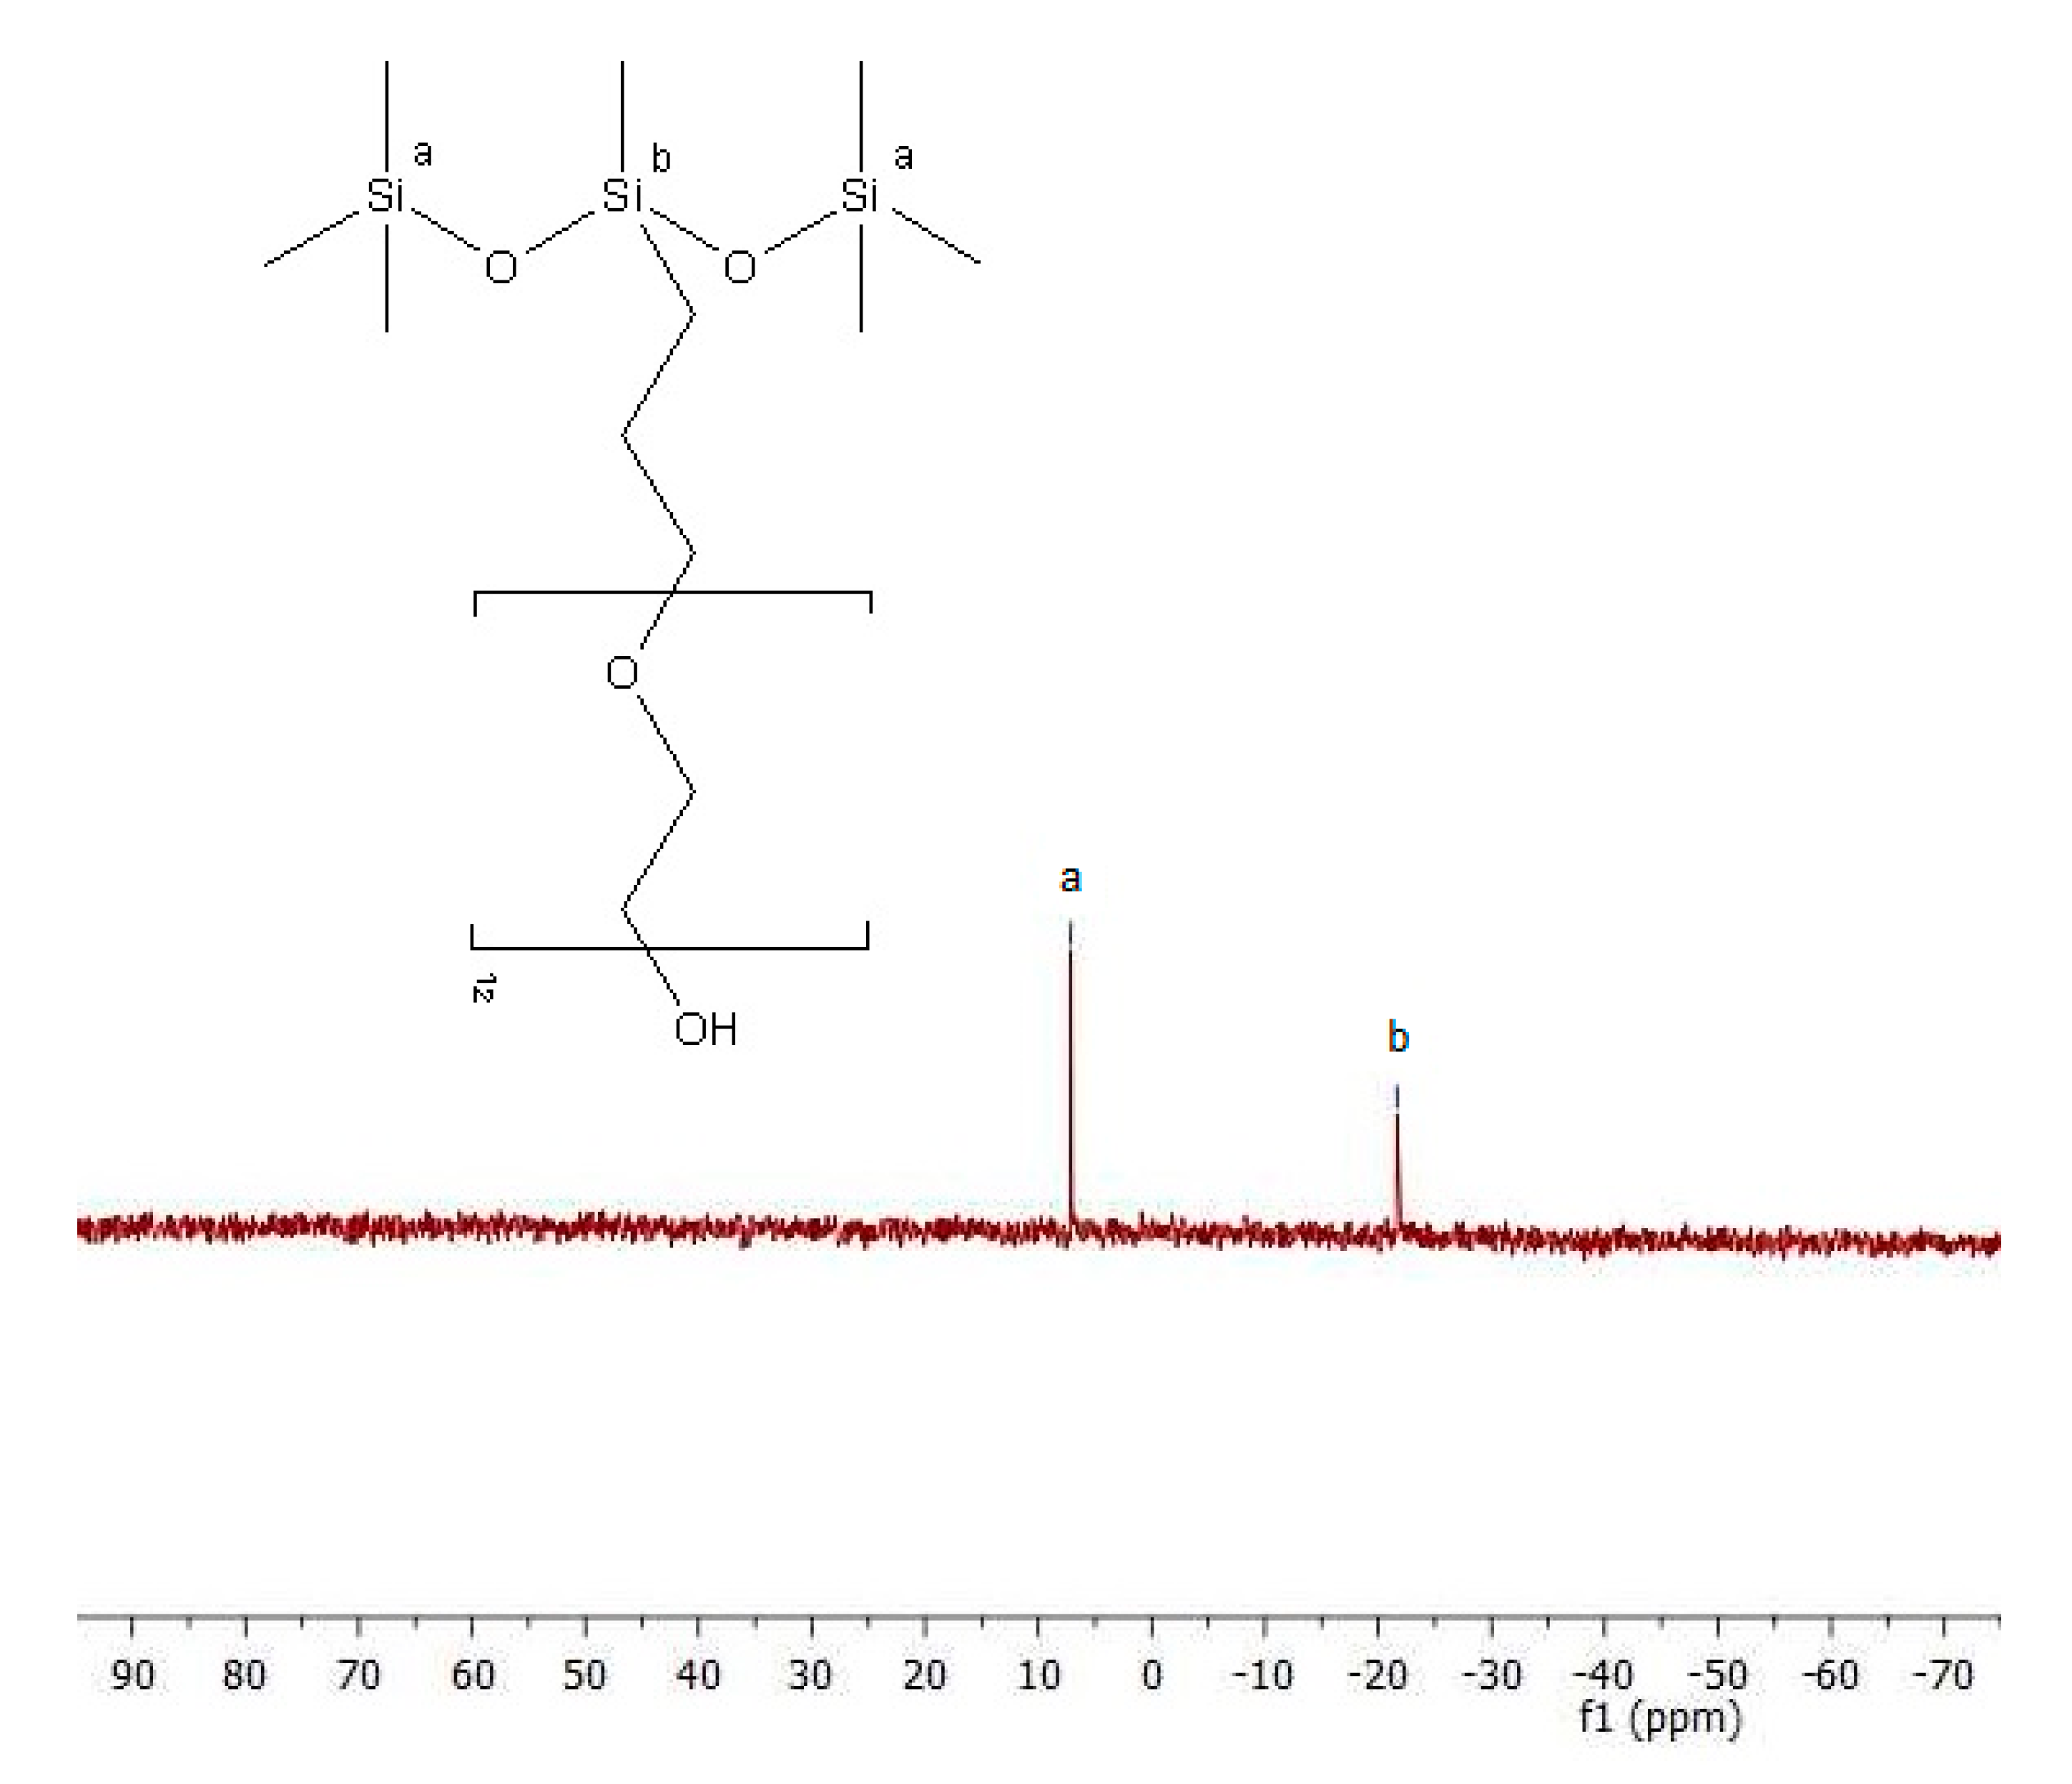
The isolated product was subjected to spectroscopic analysis (1H-NMR, 13C-NMR, 29Si-NMR) whose results are presented in Figure 4, Figure 5 and Figure 6. In the 1H-NMR spectrum of the product, 3-[3-(hydroxy)(polyethoxy)propyl]-1,1,1,3,5,5,5-heptamethyltrisiloxane (Figure 4), the characteristic signal at 5.15 ppm originating from the proton from Si–H bond disappeared. Also important is the lack of the characteristic bands assigned to the allyl groups, appearing at 5–6 ppm.
The presence of the other bands confirms the complex structure of the product. In the 29Si-NMR spectrum (Figure 6) the presence of a signal near 7 ppm testifies to the presence of Si(Me)3O groups. The signal close to 21 ppm confirms that silicon occurs in different environment Si(CH3)CH2), which is characteristic for the compounds of this type. Formation of the product (Figure 7) of the desired structure is also confirmed by analysis of its FT-IR spectrum (red line) juxtaposed to the spectra of the substrates used (yellow and blue lines). The spectrum of the product (red line) shows a band at 3500 cm−1 characteristic for the stretching vibrations of hydroxyl groups (−OH).
The presence of this band in the spectrum, along with the disappearance of the bands at 2100 and 903 cm−1 assigned to the stretching vibrations of Si–H group present in the spectra of the substrate, testify to the formation of the product of hydrosilylation and not condensation of Si–H and −OH groups. The product structure is also confirmed by the presence of the overlapping symmetric and antisymmetric stretching vibrations, characteristic of C–H bonds of methyl and methylene groups in the range 2700–3000 cm−1 and the overlapping bands originating from the stretching vibrations of C–O–C bonds present in the polyether chains and asymmetric stretching vibrations of Si–O–Si bond in the range 1000–1200 cm−1.
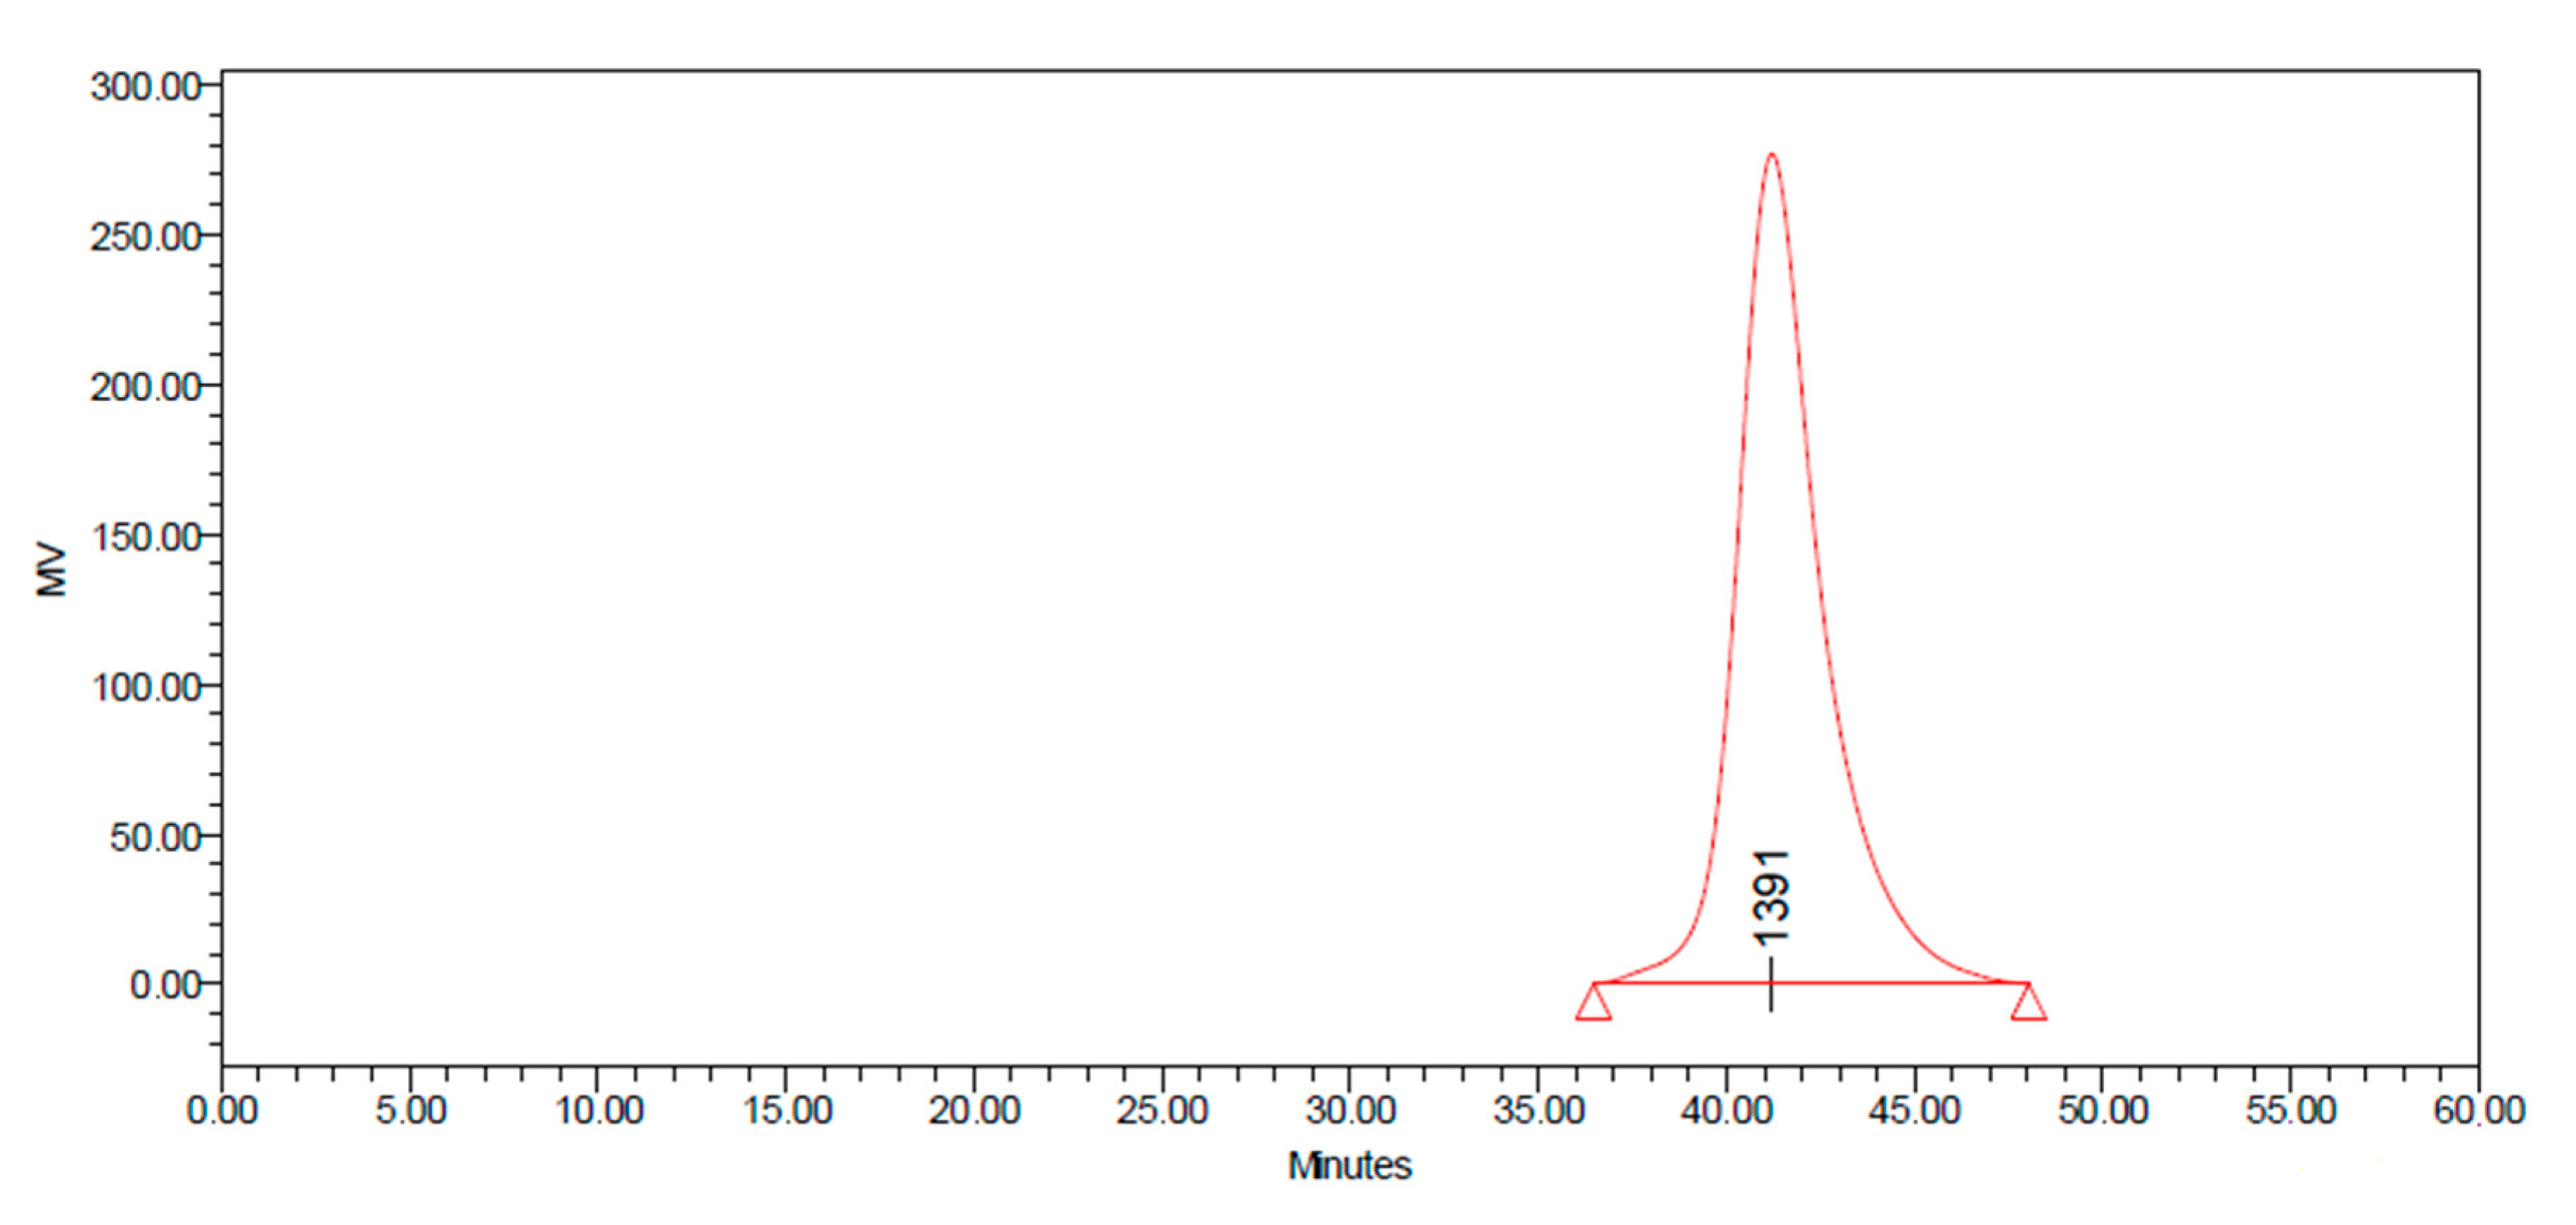
The molecular weight distributions of product was determined by GPC. The weight average molecular weight (MV) of functionalized siloxane was 1307 g/mol, with polymer dispersity index (PDI) of 1.353, indicating that the molecular weight distribution of product was relatively uniform (Figure 8).
As shown in Figure 9, the thermogravimetry of the product was also investigated. In Figure 9 the TGA and DTG curves are compared. The polymer chains presented several decomposition stages. After an initial loss of solvents and absorbed water observed in sample, a decomposition step with complex shape was registered around 523.15 K and was assigned to cleavage of aliphatic fragments and ether bonds in the functional group and agree well with the molecular structure. Obviously, the siloxane backbone decomposes in higher temperature. The maximum weight loss appeared above 685.15 K.
There is only 1.37% of residue, which could be explained by the fact that siloxane backbone was decomposed into dimethylcyclosiloxane (DMC) at around 773.15 K, even under a nitrogen atmosphere, and pulled out along with the carrier gas. The decomposition mechanism seems to be affected by the chain structure and distribution. The decomposition temperature of a polymer is determined by the thermal stability of the molecules.

2.2. Equilibrium Surface Tension

From the practical point of view not only the knowledge of thermal stability of studied surfactant but also the temperature effect on the surface and aggregation properties are very desirable. They can be very helpful for understanding and explaining the large activity of TS-EO12 at the water-air interface under different conditions as well as low sensitivity of these surfactant properties with temperature.
In the case of siloxane surfactants the properties of the adsorbed monolayer at the water-air interface, which influences the changes in surface tension of their aqueous solutions, might depend on the structure and polymerization degree of the methylated siloxane hydrophobic moiety [27] as well as on the type and length of a polyether polar chain of surfactant.
Determination of the properties of the adsorbed monolayer of 3-[3-(hydroxy)(polyethoxy) propyl]-1,1,1,3,5,5,5-heptamethyltrisiloxane) (TS-EO12) (Scheme 1) as well as the thermodynamics of its adsorption at the water-air interface, requires the knowledge of the surface tension of aqueous solutions of the studied surfactant at different temperatures. The measured values of the equilibrium surface tension ( γ L V ) of the studied surfactant aqueous solutions at 293 K, 303 K and 313 K are presented in Figure 10.
As follows from this figure, at all studied temperatures, the surface tension of the studied trisiloxane surfactant aqueous solutions decreases with increasing surfactant concentration (CS). It is similar as in the case of classical hydrocarbon surfactants as well as some others. In addition the surface tension of aqueous solutions of TS-EO12 depends quite strongly on temperature and increases with decreasing temperature. These results are in a good agreement with the data presented earlier for other siloxane surfactants [24,31] as well as many classical hydrocarbon surfactants and biosurfactants [32,33,34]. However, they are in contrast to those of some different siloxane surfactants [35] whose surface tension increases with increasing temperature.
For TS-EO12 aqueous solutions the minimal surface tension decreases with increasing temperature and changes from 23.7 mN/m at 293 K to 22.5 mN/m in 313 K. It is worth noting that the changes in the surface tension of TS-OE12 aqueous solutions with temperature are similar to those of pure POE (wt. 3400 gmol−1) aqueous solutions [35]. This fact suggests that the orientation of TS-EO12 molecules at the water-air interface can change with temperature. Probably the OE chain in the surfactant molecule is bent or crooked at the water-air interface. As mentioned above the temperature influences the orientation of the TS-EO12 molecules at the water-air interface, which is also connected with the area occupied by a surfactant molecule at the interface or the surfactant surface excess concentration.

2.3. Surface Excess Concentration of TS-EO12 at the Water-Air Interface at Different Temperatures

In order to calculate the amount of the adsorbed studied surfactants per unit area at the air-water interface (the Gibbs surface excess concentration of surfactant at the water-air interface (ΓS), the measured equilibrium surface tension ( γ L V ) values (Figure 10) were treated in terms of the Gibbs adsorption equation [36]. This equation for dilute solutions (10−2 M/dm3 or less) of surfactants has the following form [36]:
Γ S = C S n R T ( γ L V C S ) T = 1 n R T ( γ L V l n C S ) T = 1 2.303 n R T ( γ L V log C S ) T
where R is the gas constant, T is the absolute temperature, γ L V is the surfactant solution surface tension, CS is the concentration of surfactant and n is the constant which depends on the kind of surfactant (for studied nonionic trisiloxane surfactant it is equal to 1).
ΓS of the studied surfactants corresponding to the unsaturated adsorption monolayer at the water-air interface was determined from Equation (1) and using the second order polynomial equations describing the relationship between γ L V and CS of a given surfactant at a given temperature. The maximal ΓS values ( Γ S max ) corresponding to the saturated adsorption monolayer of TS-OE12 at the water-air interface (Table 1) at a given temperature were determined from the linear dependence of γ L V vs. logCS and it is the parameter describing the effectiveness of a given surfactant adsorption at the water-air interface [36]:
A S min = 1 N A   Γ S max
where NA is Avogadro’s number.
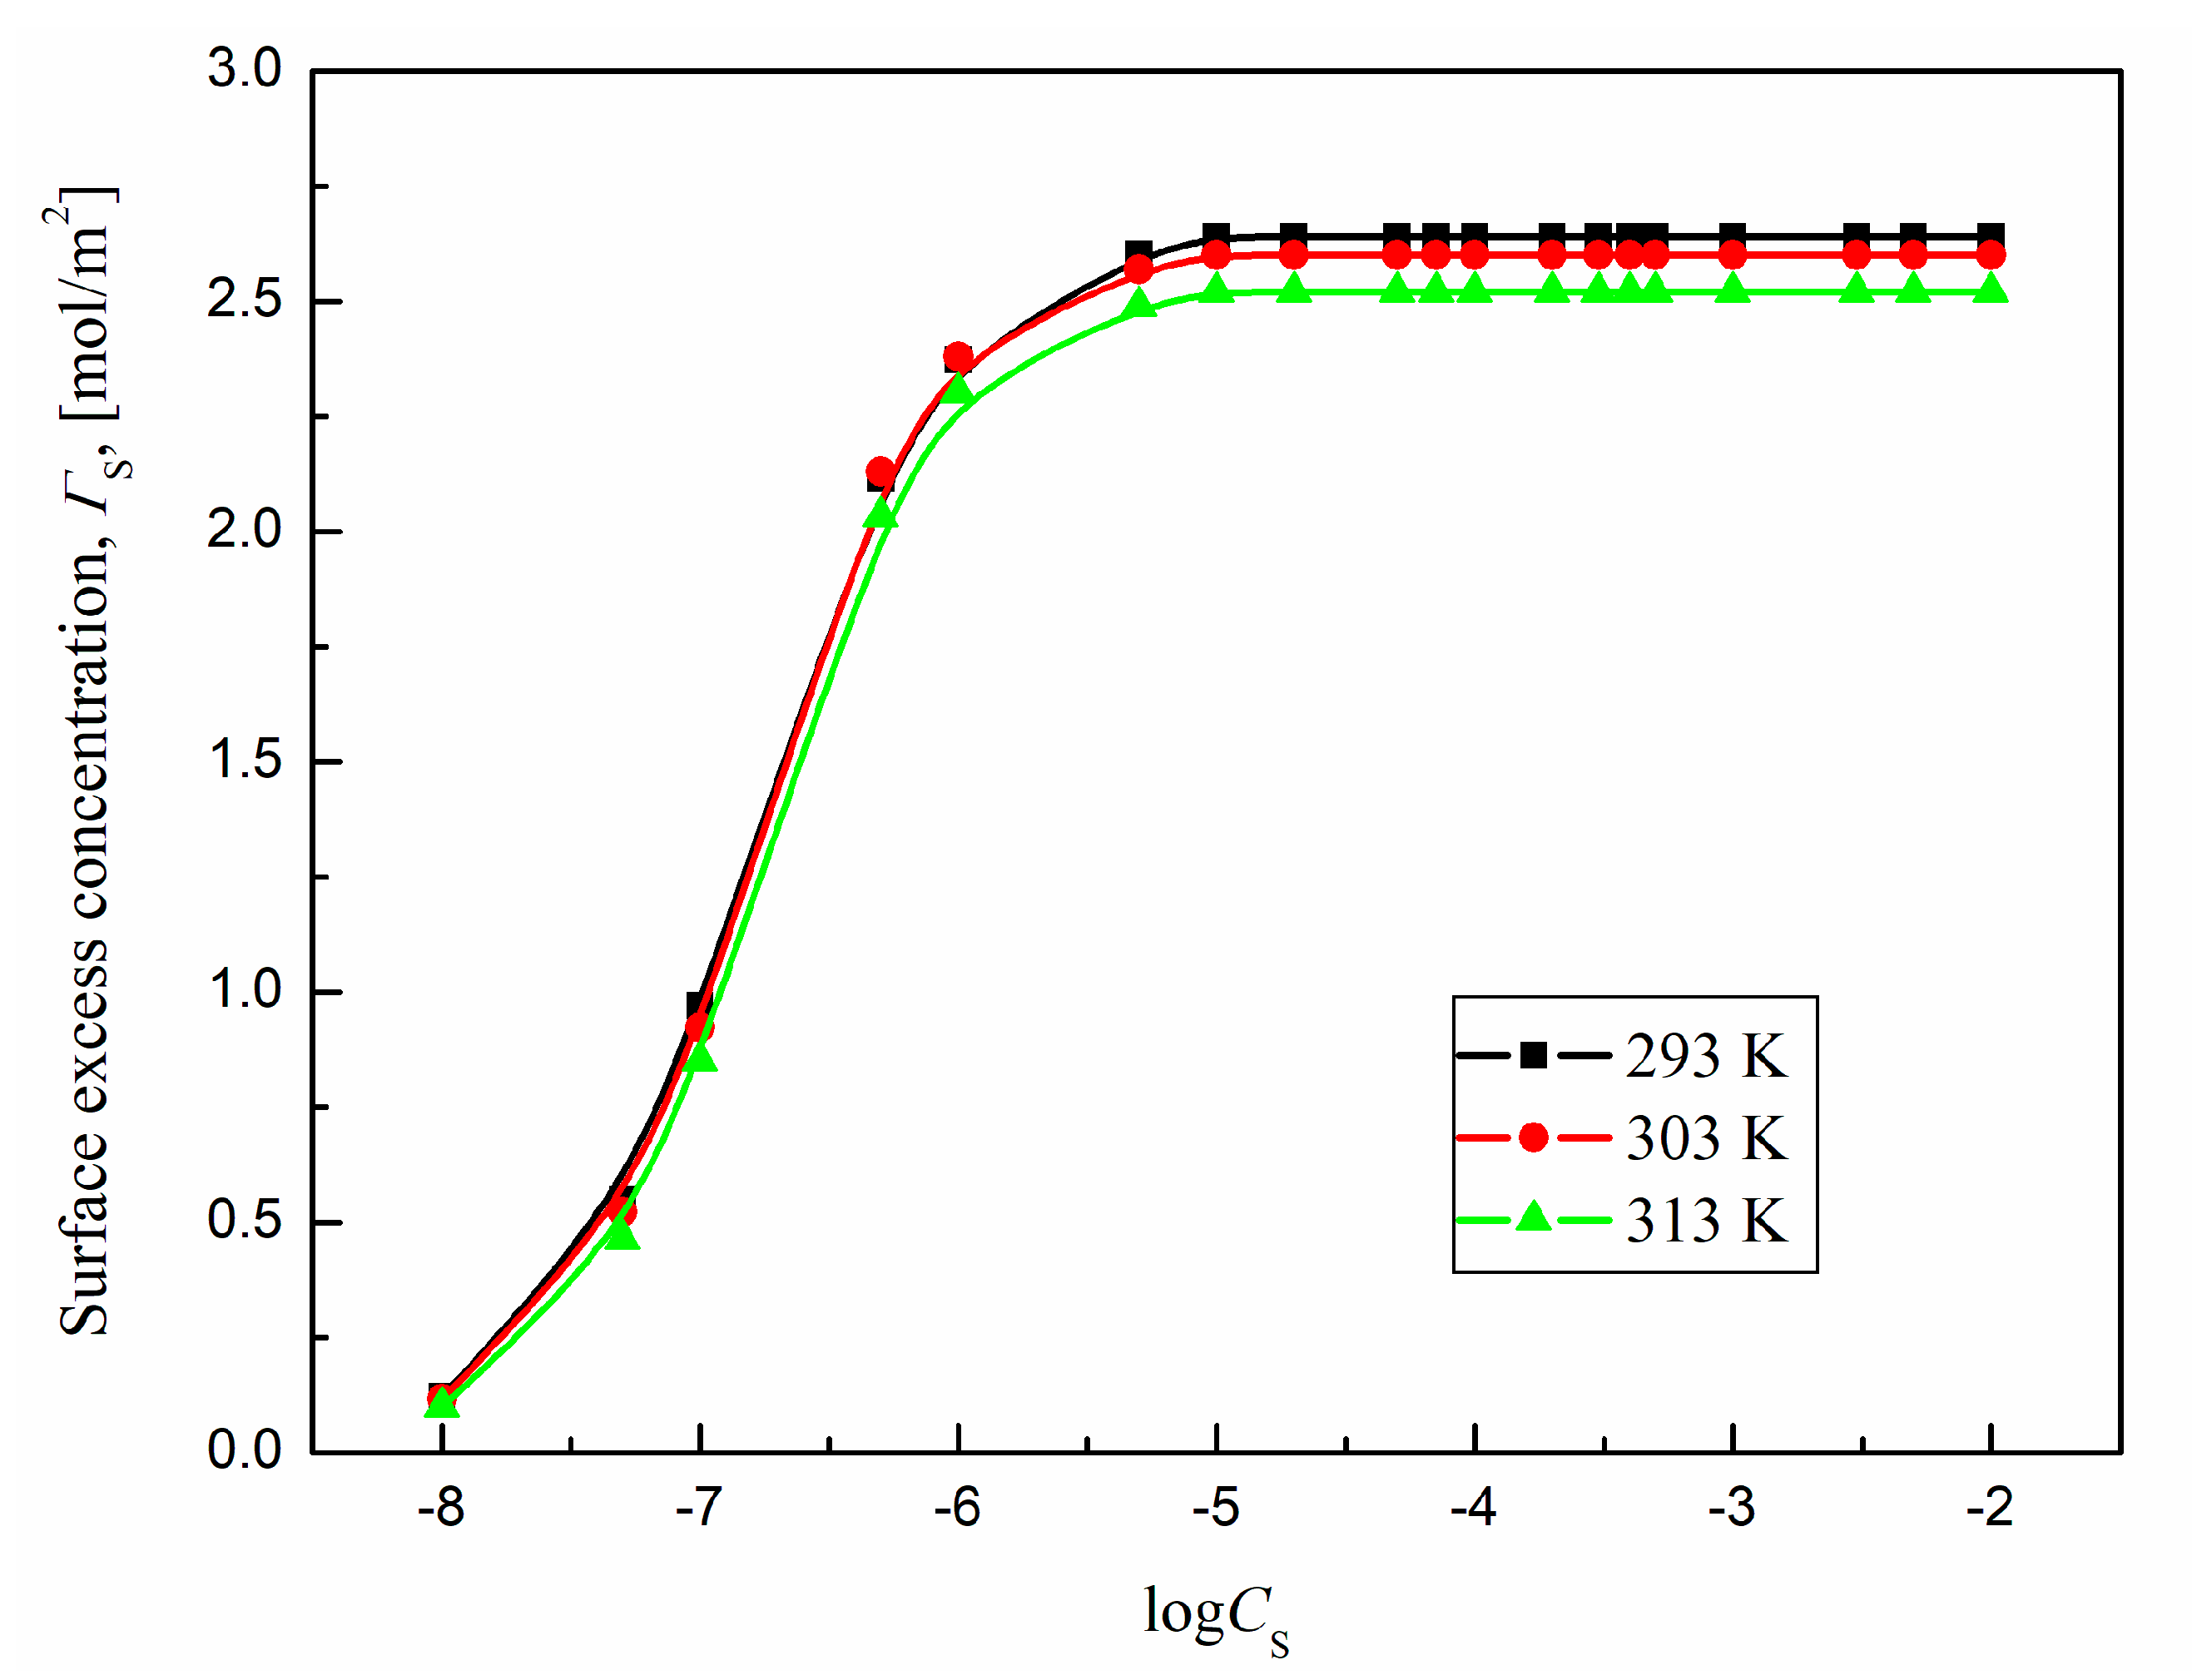
The changes in ΓS values of TS-OE12 at 293 K, 303 K and 313 K with the surfactant concentration in the bulk phase are presented in Figure 11. The Γ S max and A S min values calculated from Equations (1) and (2) for TS-OE12 at different temperatures are presented in Table 1 and they are close to those reported in literature [37]. It is difficult to compare the obtained Γ S max values at different temperatures with those reported in literature because of the lack of such data.
On the basis of our results it can be concluded that the minimal area per TS-OE12 molecule at the water-air interface rises with increasing temperature and according to Equation (2) it leads to a decrease in the maximal surface excess concentration of the studied surfactant at the interface with increasing temperature. However the changes in Γ S max and A S min with growing temperature are not significant (Table 1).
In addition, using the values of ΓS obtained from Equation (1) in a wide concentration range of TS-OE12 at different temperatures, the mole fraction of the area occupied by the molecules of the studied surfactant in the adsorption layer (XS) at a given temperature was determined from the relation [36]:
Γ W N A   A W 0 + Γ S N A   A S 0 = 1
where ΓW and ΓS are the surface excess concentrations of water and surfactant at the water-air interface, A W 0 and A S 0 are the limiting areas of water or surfactant molecule at the water-air interface, respectively and:
X S = Γ S Γ S + Γ W
For calculations of XS a proper A W 0 value at a given temperature was used. AW values at different temperatures were calculated taking into account the increase of the distance between the water molecules in the surface region.
The value of A S 0 (Table 1) can be determined from the Joos equation of state which for the aqueous solutions of surfactants can be written in the form [38]:
e x p ( π R T Γ W ) + e x p ( π R T Γ S ) C S a S s = 1
where Γ W and Γ S are the limiting Gibbs surface excess concentrations of water and surfactant at the water-air interface, respectively, π is the film pressure and a S s is the activity of a given surfactant at the water-air interface.
The XS values against logCS for TS-OE12 obtained from Equation (4) at different temperatures are presented in Figure S1 (Supplementary Materials).
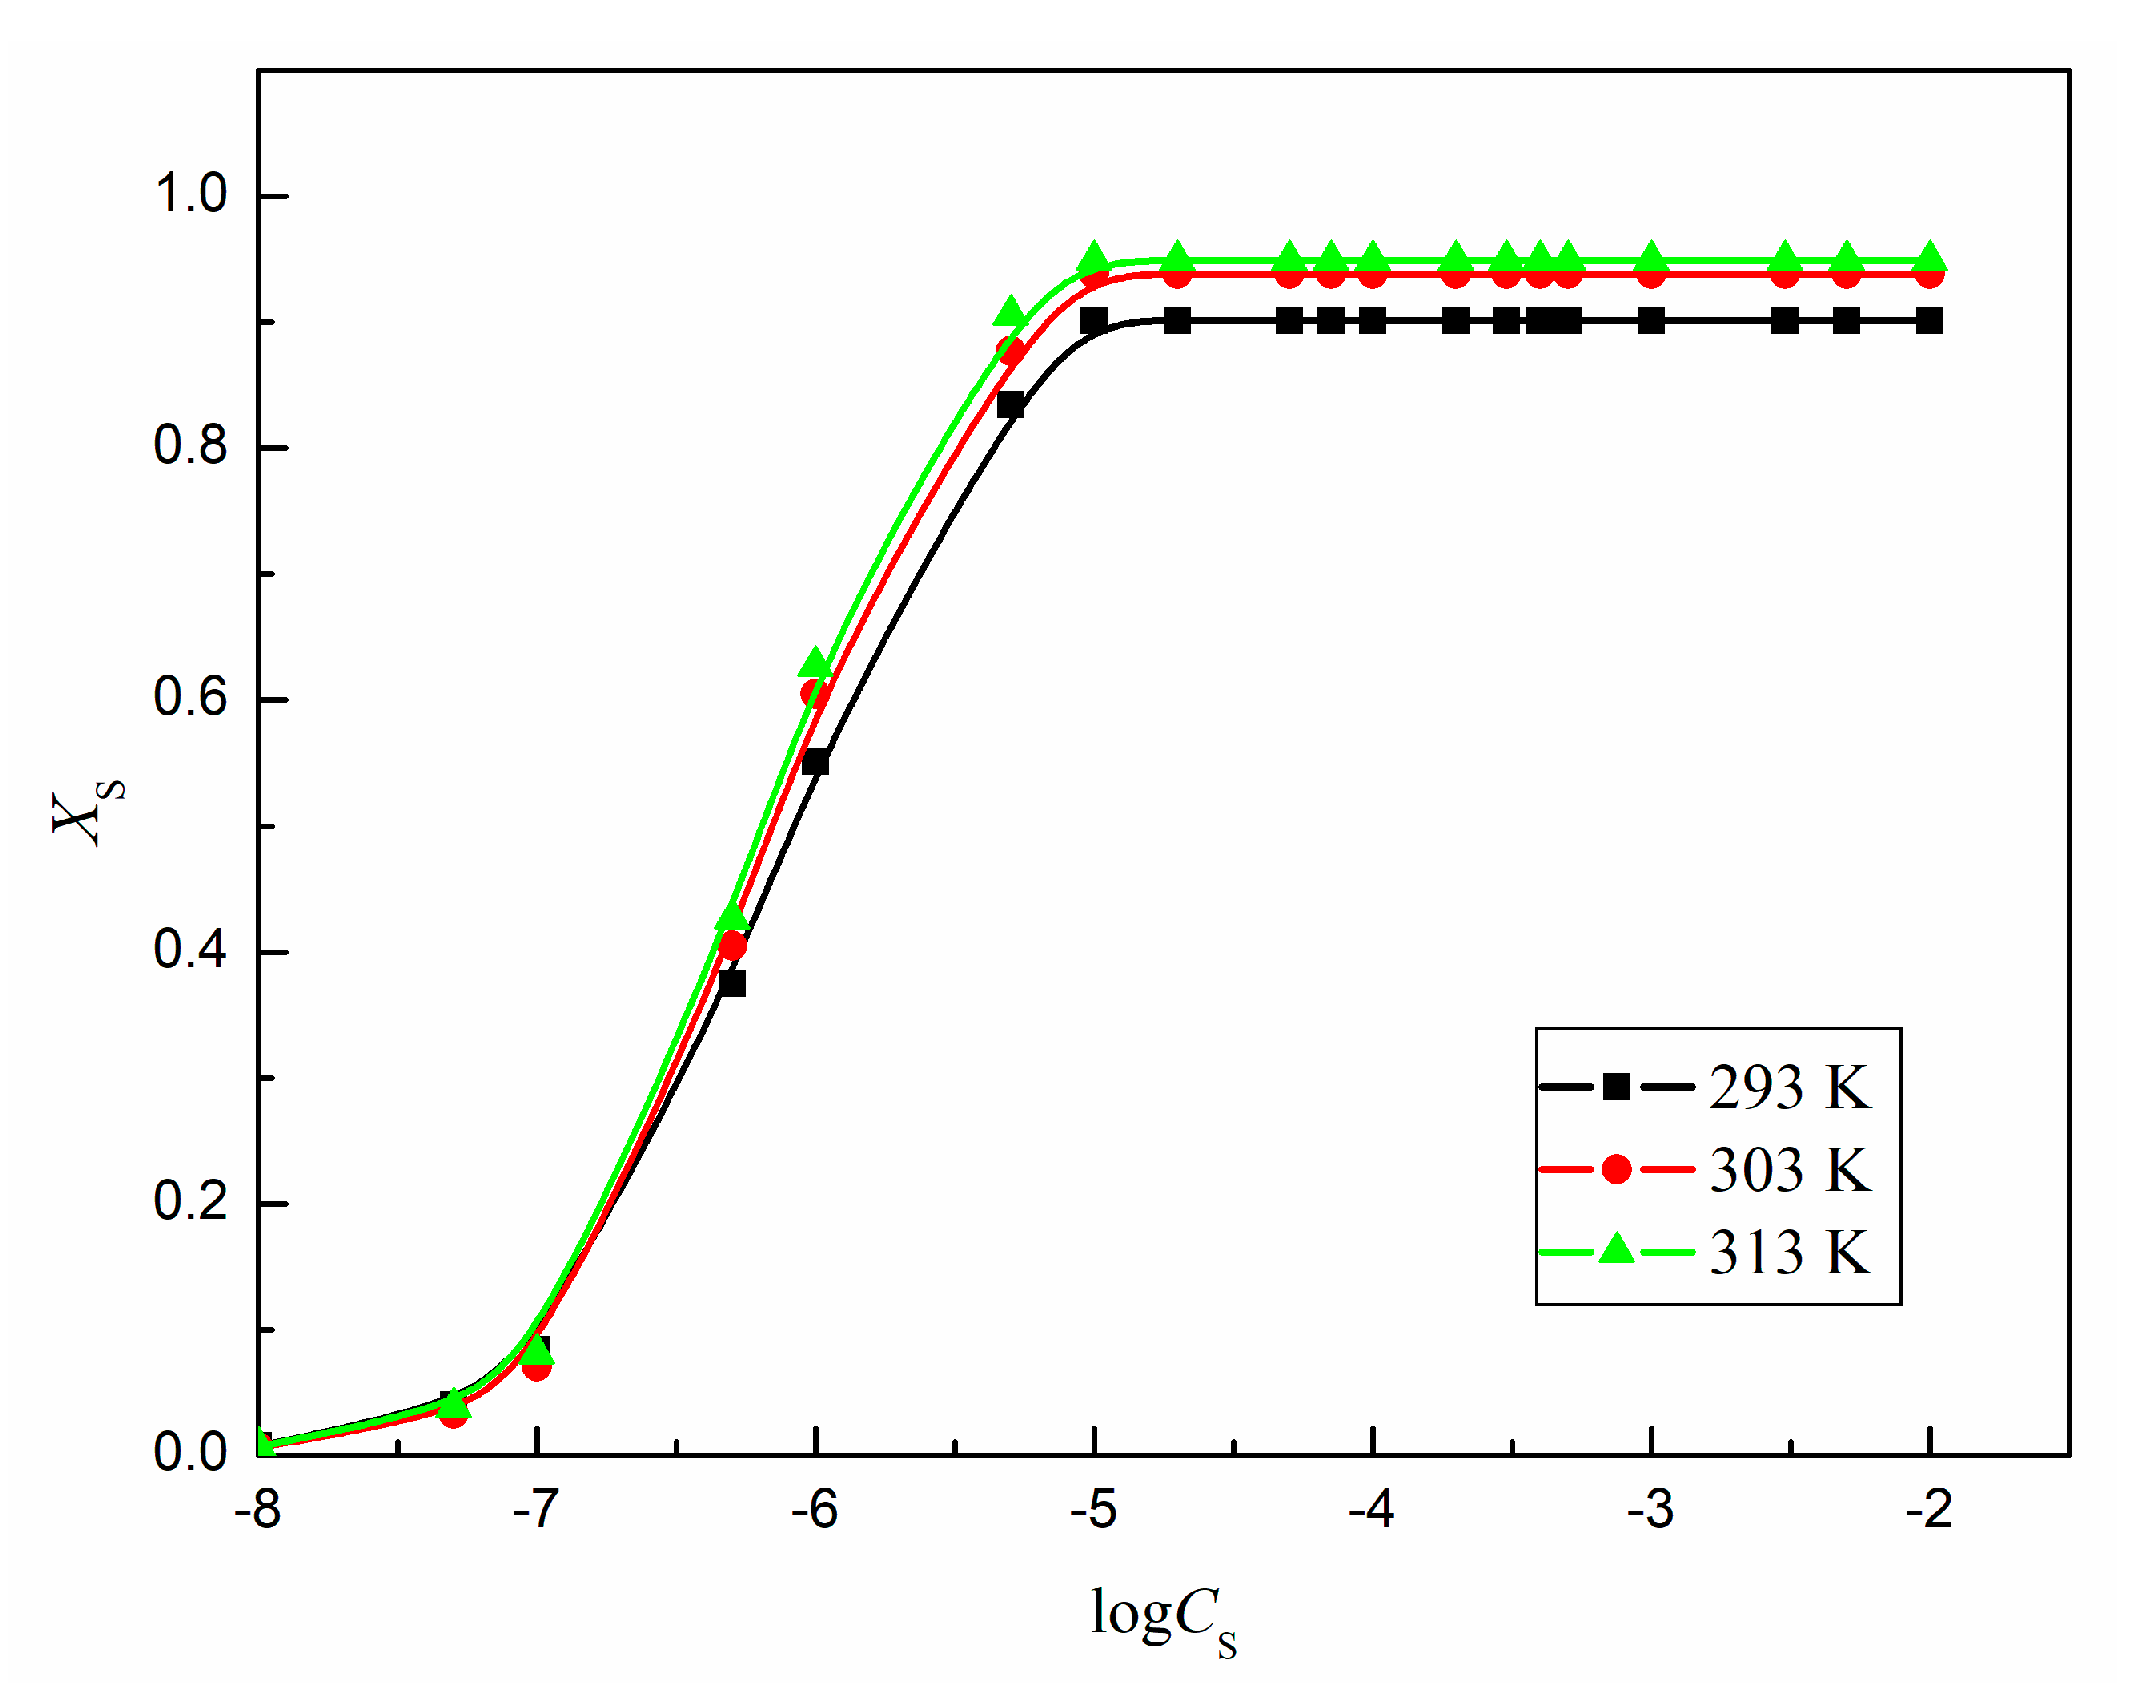
As follows from the obtained values, XS only slightly increases with temperature but its maximal value is close to 1 and suggest that the adsorption layer of TS-OE12 at the water-air interface is more densely packed than, for example, that of hydrocarbon surfactants [32,33,34].
On the other hand, as follows from Table 1, the Γ S values of the studied surfactant calculated from Equation (5) are somewhat higher than those of Γ S max in every case. Thus, on the basis of Γ S Γ S   , it is possible to determine the extent of coverage at the water-air interface by the surfactant molecules and the obtained values should be equal to those calculated from Equation (4) [39]. The values of XS of particular surfactants obtained from the ratio Γ S Γ S     are significantly higher than those calculated from Equation (4). As mentioned in earlier studies [39] the discrepancies can result from different values of the surface area occupied by the water and surfactant molecules because one molecule of surfactant can replace more than one molecule of water. The number of water molecules which can be replaced by one surfactant molecule at the water-air interface can be equal to the ratio of Γ S Γ W   .
Assuming that Γ S Γ W = 1 k [33,36,39], Equation (4) can be written as follows:
X S = 1 k Γ S Γ W + Γ S
The values of XS for TS-OE12 calculated from Equation (6) are practically the same as those obtained from the ratio Γ S Γ S   (Figure 12 and Figure S2). In addition, all isotherms of logXS for TS-OE12 in the studied temperature range are of the Langmuir type, which indicates that the adsorbed monolayer is formed at the water-air interface (Figure S3).
Analysis of the XS values of TS-OE12 and their changes with temperature (in the studied range) indicates that the dehydration process of polar heads probably proceeds to a smaller extent. Further consideration of the TS-OE12 adsorption at the water-air interface changes with temperature requires the knowledge of changes in the standard Gibbs free energy, enthalpy and entropy of adsorption.
It is also interesting from the practical point of view, whether it is possible to describe the changes in the surface tension of aqueous solutions of the studied surfactant as a function of its concentration on the basis of the solution components’ properties.
For this purpose the Szyszkowski equation [36,40] was used:
γ W γ L V = R T Γ S max l n ( 1 + C S b )
where Γ S max is the maximal surface excess of the studied surfactant concentration in the surface layer,   γ W is the water surface tension and b is a constant.
To solve Equation (7) the maximal and limiting Gibbs surface excess concentrations of TS-OE12 (Table 1) were used.
Similarly as for the other quite different surfactants [41,42], the use of the limiting area of the surfactant at the water-air interface instead of the minimal one, gives better agreement of γ L V values measured and those calculated from Equation (7) (Figure S4).

2.4. Critical Micelle Concentration (CMC) of TS-OE12

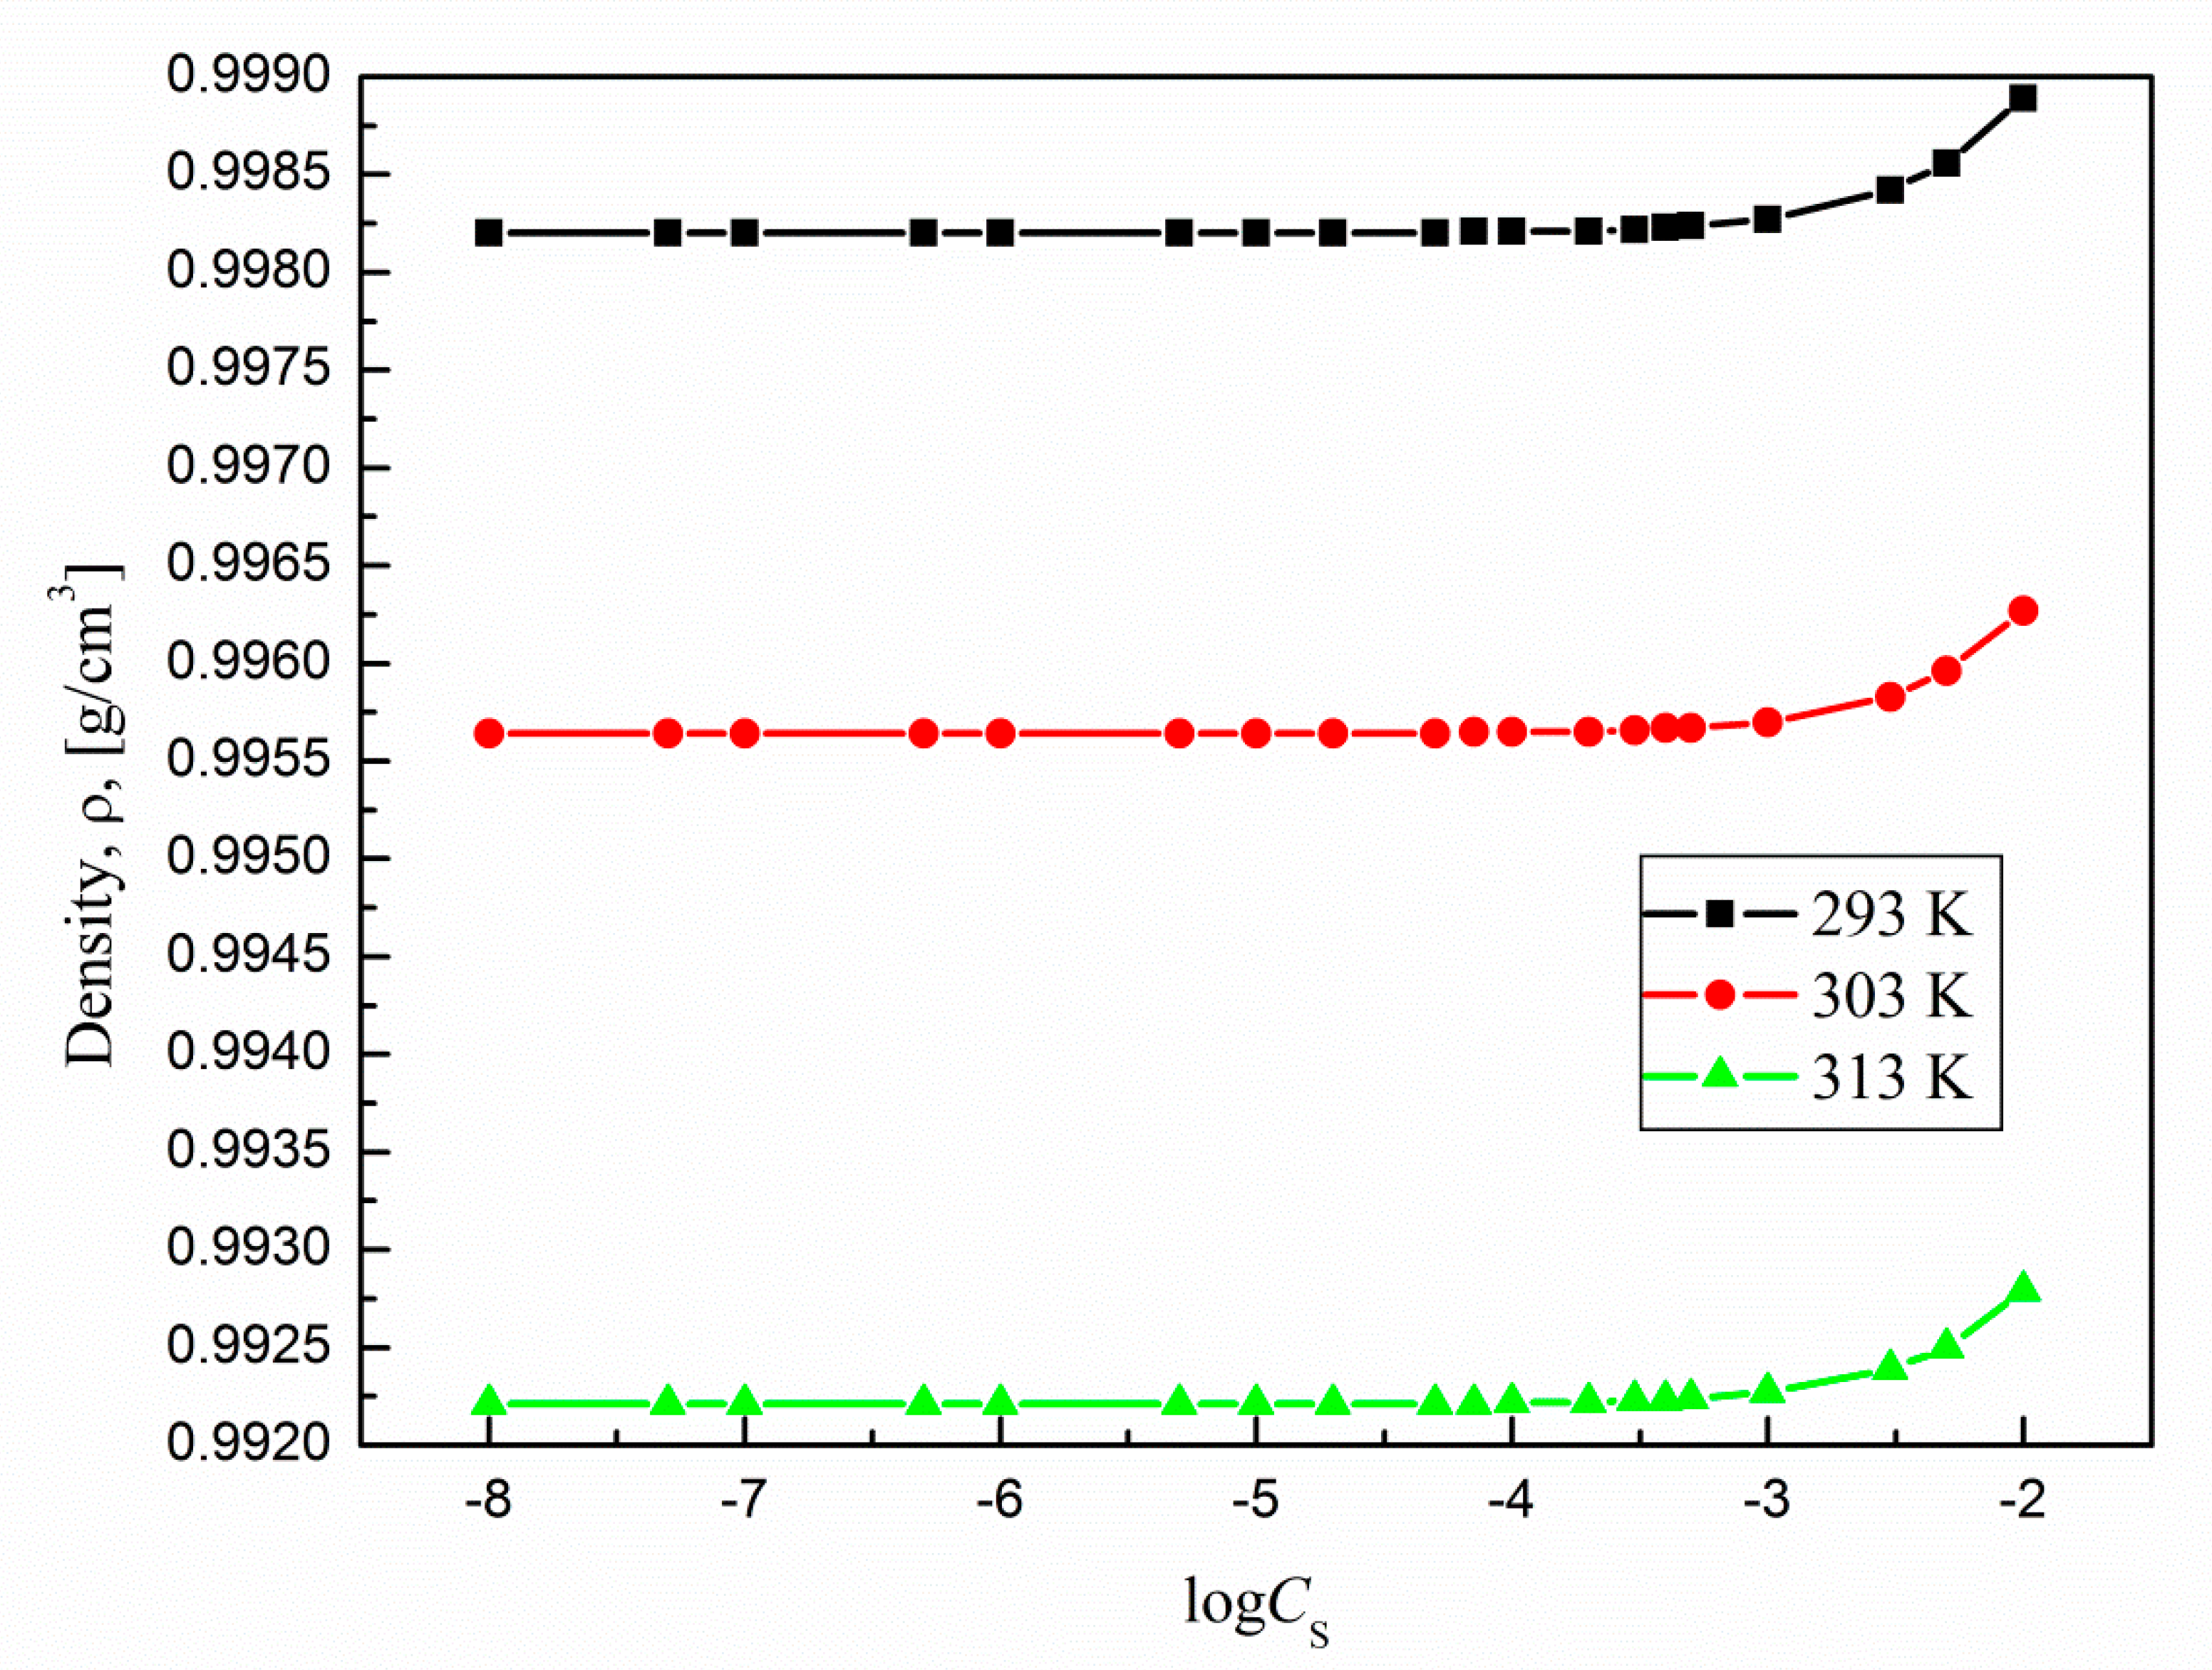
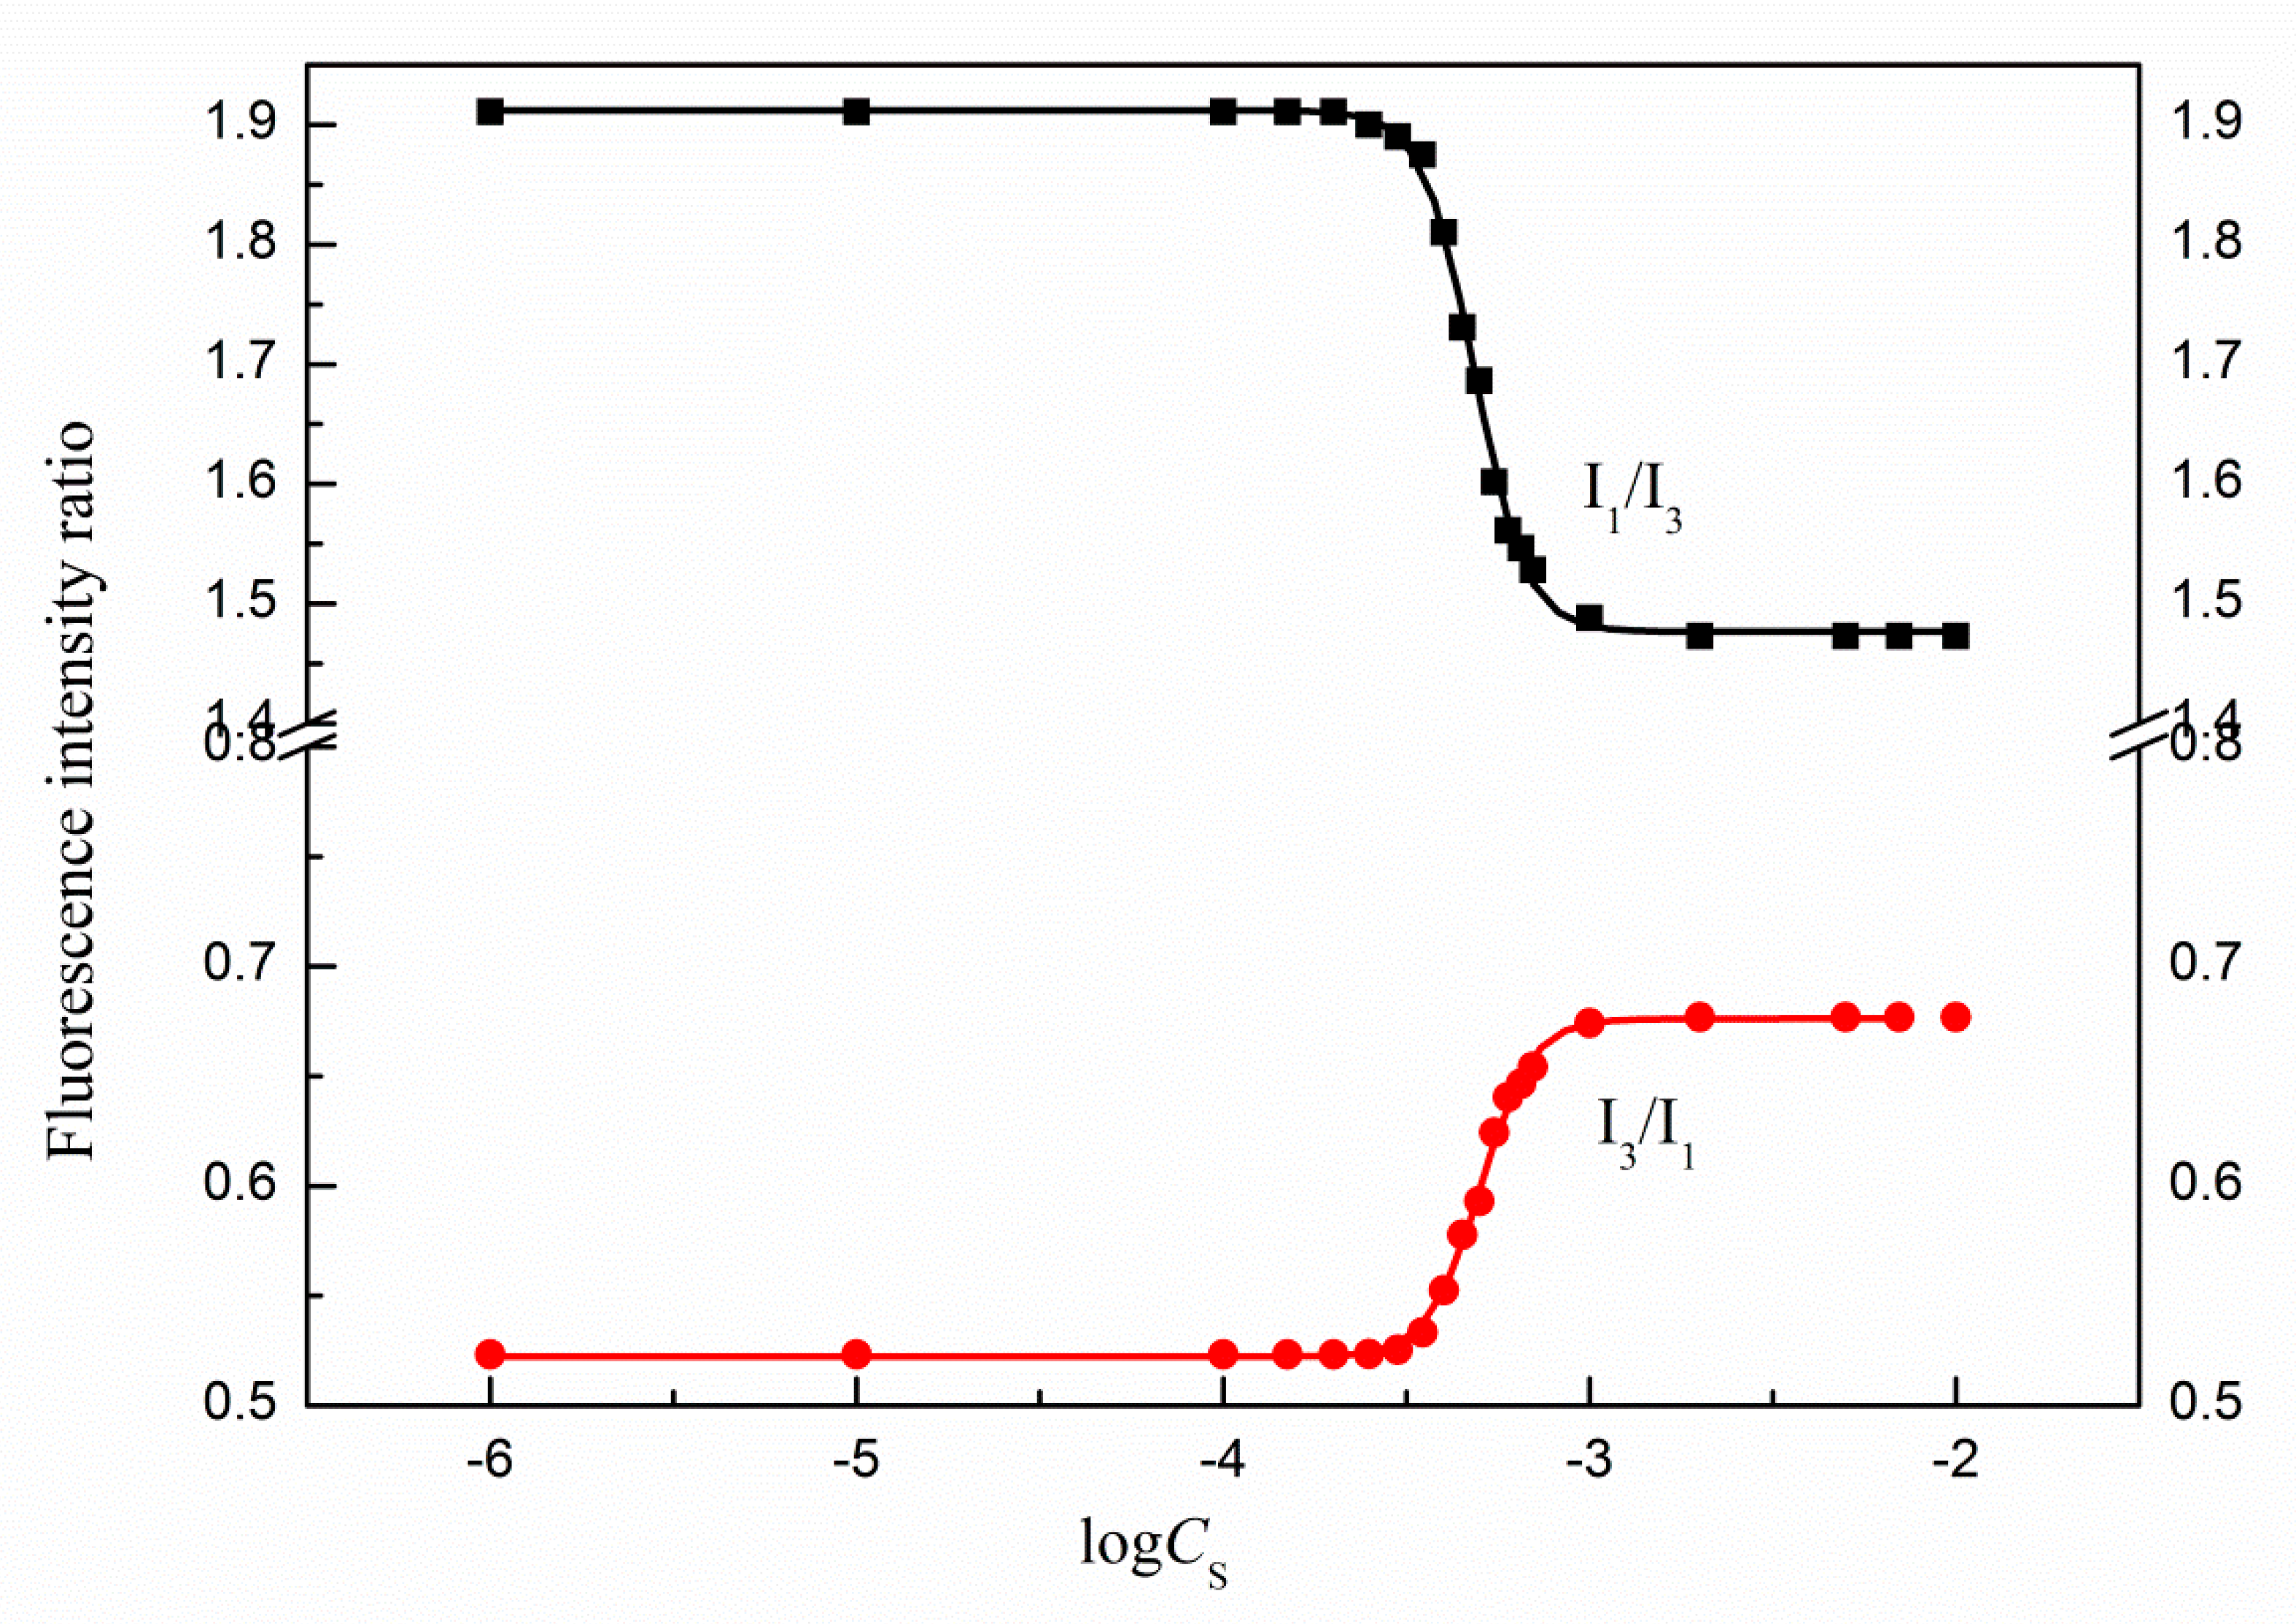
Based on the literature data it is difficult to find systematic informations about the mechanism of temperature effect on siloxane surfactants aggregation properties. Thus, at the beginning, the critical micelle concentration (CMC) of TS-OE12 in aqueous solutions were determined at different temperatures (293 K, 303 K and 313 K) by using different methods. Of all the methods that can be used for estimation of CMC the surface tension method is the most popular. In this method the CMC value can be determined from plots of surface tension versus log of surfactant concentration. In our studies the CMC of TS-OE12 at a given temperature was also determined on the basis of the density (ρ) (Figure 13) as well as pyrene (Py) (Figure 14) fluorescence intensity values changes as a function of the surfactant concentration in the solution. In the case of the Py fluorescence intensity measurements the CMC values of studied surfactants were determined from the changes in the first and third vibronic bands ratio (I1/I3) on the pyrene fluorescence spectra with the surfactant concentration in the solution.
The CMC values obtained in such a way for the studied surfactant are presented in Table 1. According to Table 1, TS-OE12 is not characterized by a single CMC value but can assume values from a certain range and depends on the method of its determination. The obtained CMC values for TS-OE12 are consistent with literature data [24,27]. However, it is difficult to compare all the obtained values of CMC in different temperatures because of the lack of such data.
The Table 1 data also imply that CMC of TS-OE12 determined from the surface tension measurements decreases slightly with increasing temperature. This decrease can be connected with the dehydration process and the loss of hydration water. On the other hand the rise of temperature increases the flexibility of Si–O–Si linkage and extends the minimal area of surfactant at the water-air interface. This conclusion was also deduced from the spectroscopic measurement results as well as thermodynamic considerations.
The CMC values of TS-OE12 were also determined from the changes of the first and third vibronic bands ratio on the pyrene fluorescence spectra with the surfactant concentration in the solution (Figure 14, Figures S5 and S6). Pyrene is a strongly hydrophobic fluorescence probe and its solubility in water is in the range of 2–3 μM. Thus, in the presence of micelles, pyrene is preferentially solubilized in the interior hydrophobic regions of these micelles. This is the basis of successful use of pyrene as a fluorescence probe in the study of micellization process [43]. For TS-OE12, like for the other types of surfactants, the changes in the ratio I1/I3 as a function of surfactant concentration can be described by the decreasing Boltzman sigmoid (Figure 14, Figures S5 and S6). As follows from the fluorescence measurements also for TS-OE12 its CMC decreases with temperature (Table 1).
For pyrene, the ratio I1/I3 takes values of 1.04, 1.33 and 1.84 for toluene, methanol and water, respectively. The values of I1/I3 for TS-OE12 presented in Figure 14 and Figures S5 and S6 are in the range from 1.9 (no micelles) to about 1.5 (micellar solution) and decrease with increasing temperature. Above CMC it remains nearly constant and independent of the surfactant concentration, which confirms that the probe is located close to the micellar surface and the temperature increase induces changes in the I1/I3 values in the same direction as the CMC changes. In addition, it confirms high water penetration into the so-called palisade layer of the micelle and lose packing of the SF-OE12 micelles. As results from the changes in the ratio I1/I3 with the logarithm of the surfactant concentration at a given temperature, pyrene is a sensitive probe for determination of the TS-OE12 CMC. In addition, as follows from Figure 12, Figures S5 and S6, and from the changes in the third and first vibronic bands ratio, with increasing temperature the hydrophobicity of the interior of the studied micelles increases. However, this effect is not significant in the studied temperature range.
Additionally the morphology of TS-OE12 aggregates in the aqueous solution at the surfactant concentration well above its CMC (and at 293 K) was determined by using the confocal microscopy (Figure 15a,b). From this analysis it results that aggregates of the surfactant could be considered as more or less spherical or ellipsoidal ones. It occurred that similar shape of aggregates were obtained by using both methods of glass surface modification that is sonication and immersing method. These findings demonstrate the need for further analysis of TS-OE12 aggregates structure.
Analysis of the changes in CMC and hydrophobicity of the interior of TS-OE12 micelles should be supplemented with thermodynamic considerations taking into account the standard Gibbs free energy, enthalpy and entropy of micellization as well as temperature changes in molar volume.

2.5. Apparent and Partial Molar Volume

The micellization process should be also reflected by changes in the surfactant aqueous solutions density (Figure 13). As follows from this figure, the slopes of the plots of density vs concentration of surfactants before and after CMC are different, which allows determination of CMC values for a studied surfactant (Table 1). However, the influence of surfactant concentration on the structure of the solution can be more visible from changes in the apparent ( ϕ V ) and partial ( V ¯ M ) molar volumes with the surfactant concentration in the micellization process.
The apparent molar volume can be determined from the following equation [44,45]:
ϕ V = M S ρ 0 + 1000 ( ρ 0 ρ ) C
where MS is the molecular weight of the surface active agent, C is the concentration of the surface active agent in mol/cm3 and ρ0 is the density of the solvent.
The partial molar volume V ¯ M   can be calculated from the equation [45]:
V ¯ M = M S ρ [ 1 ( 100 C p ) ρ d ρ d C p ]
It appeared that the ρ data measured for TS-OE12 at different temperatures (Figure 13) fit a polynomial of Cp (the mass percentage concentration) given by:
ρ = a + b C p + d C p 2
where a, b and d are constants.
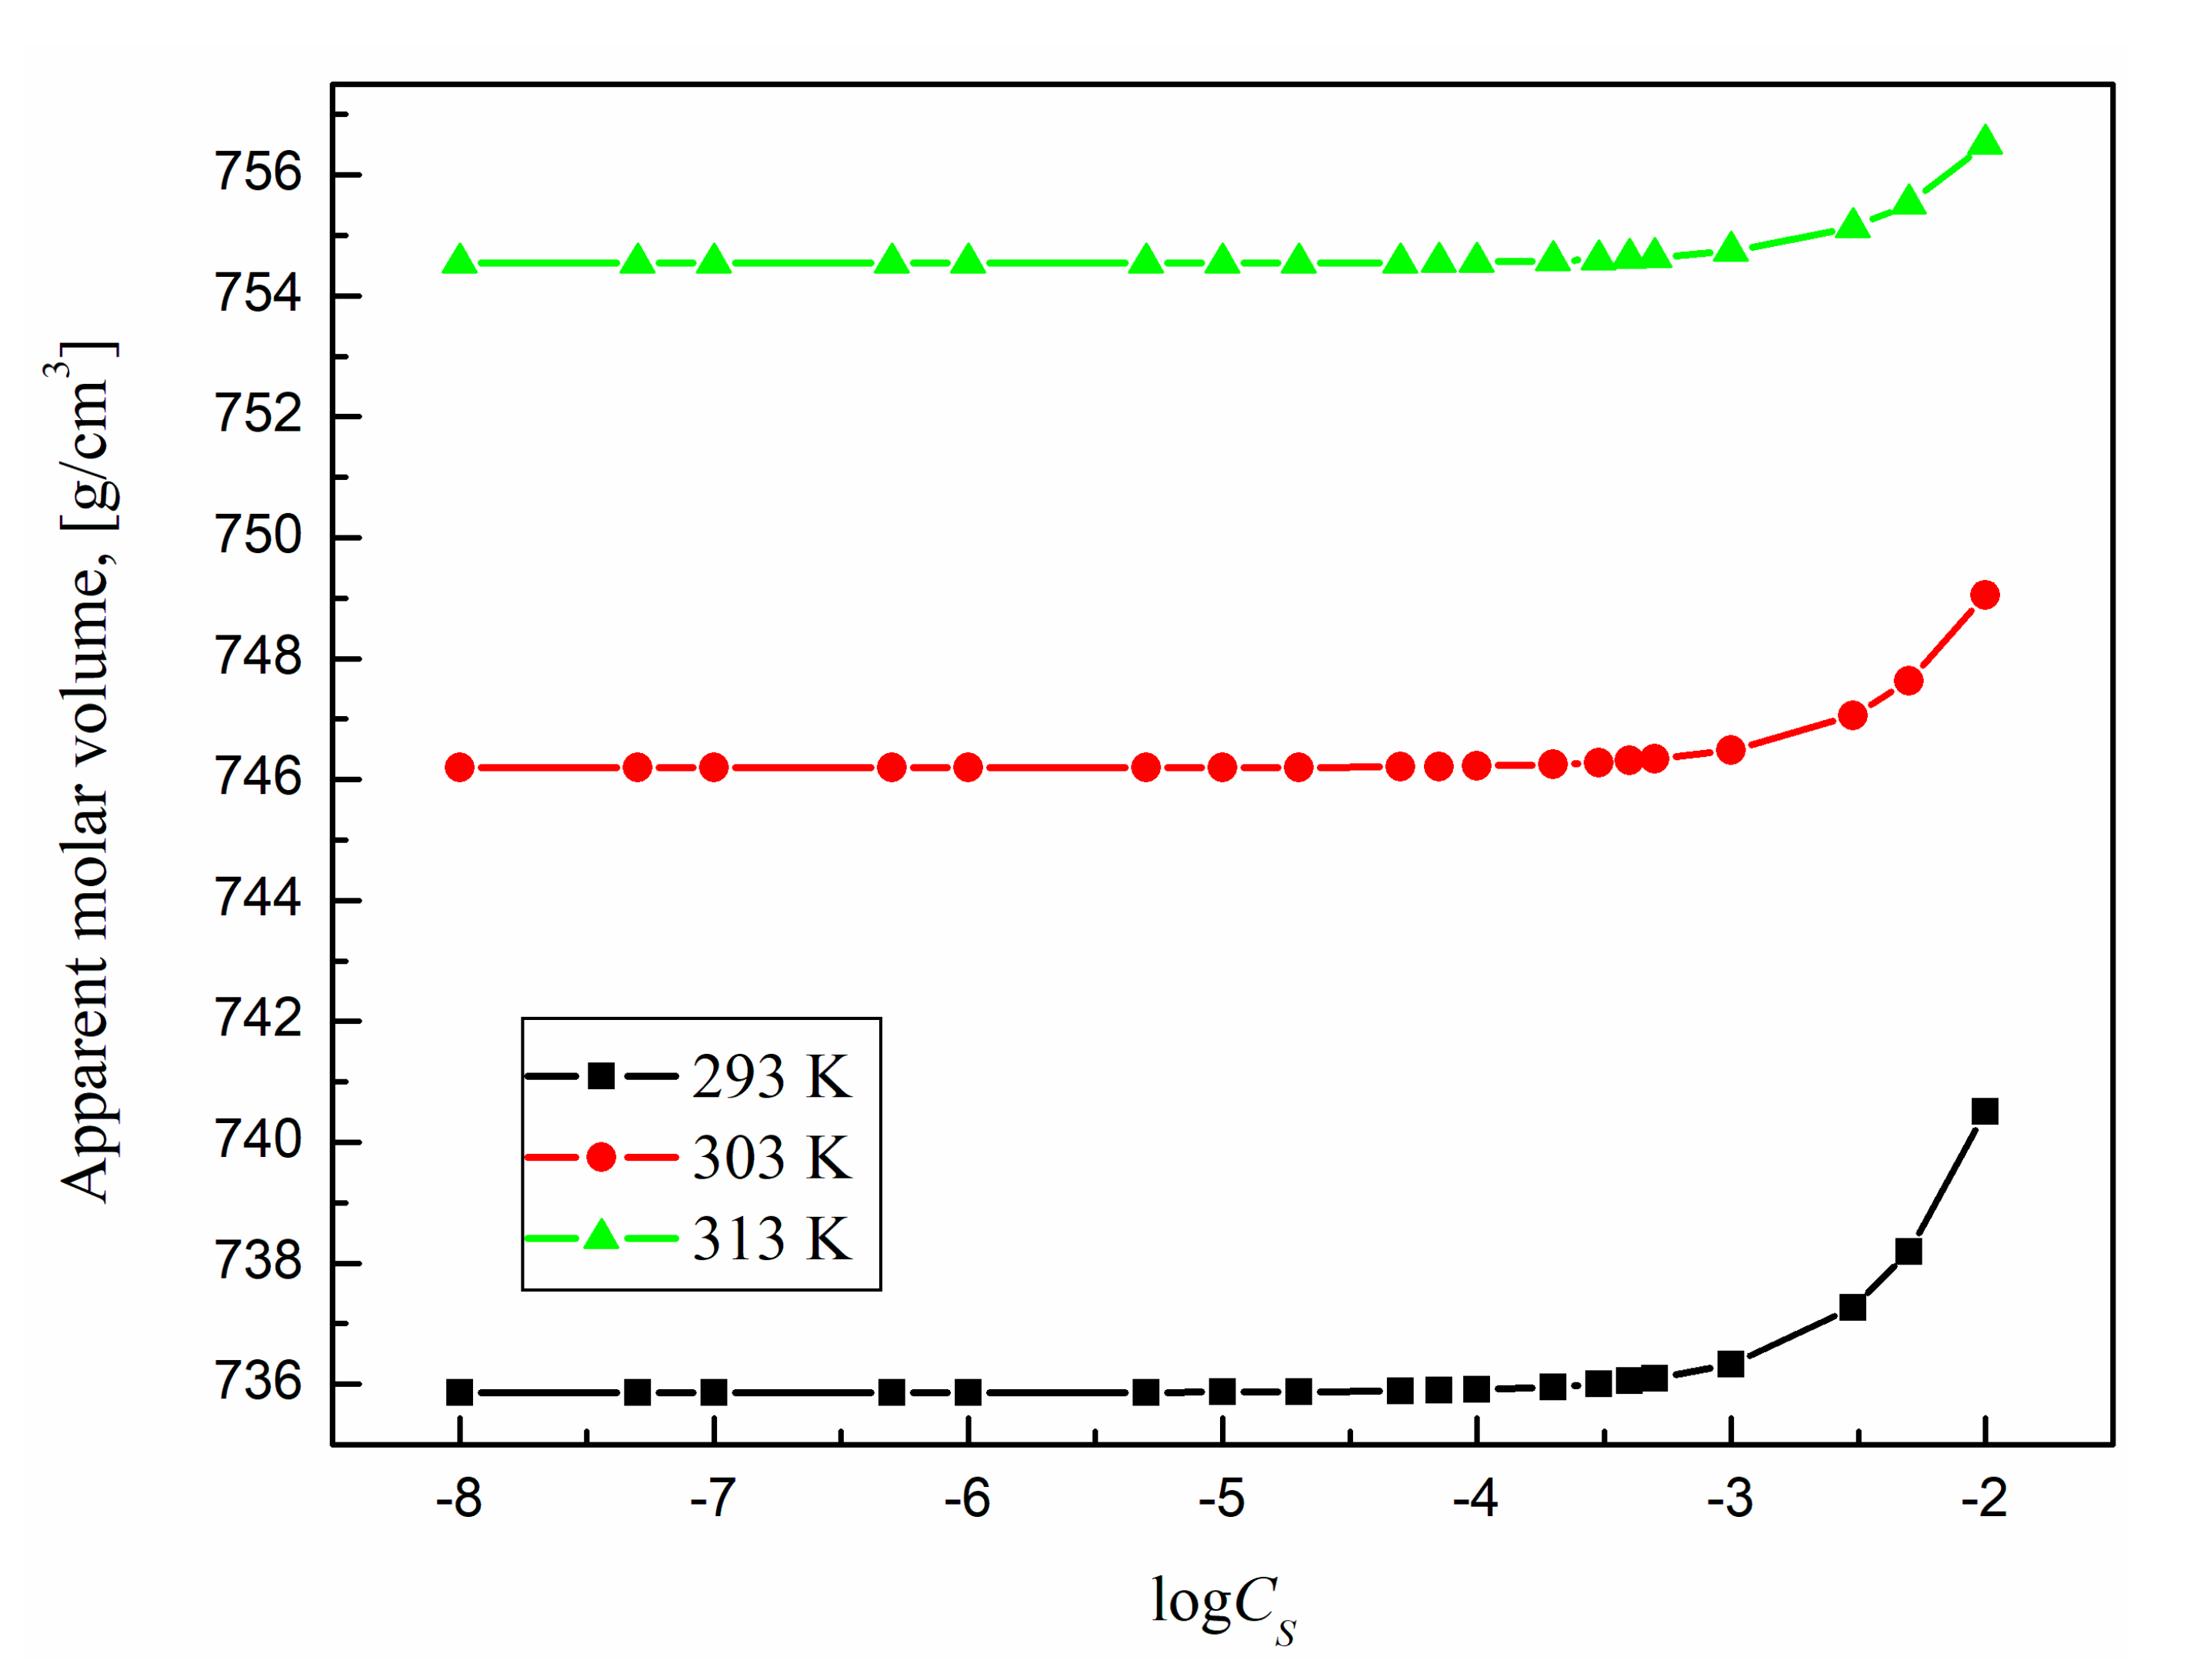
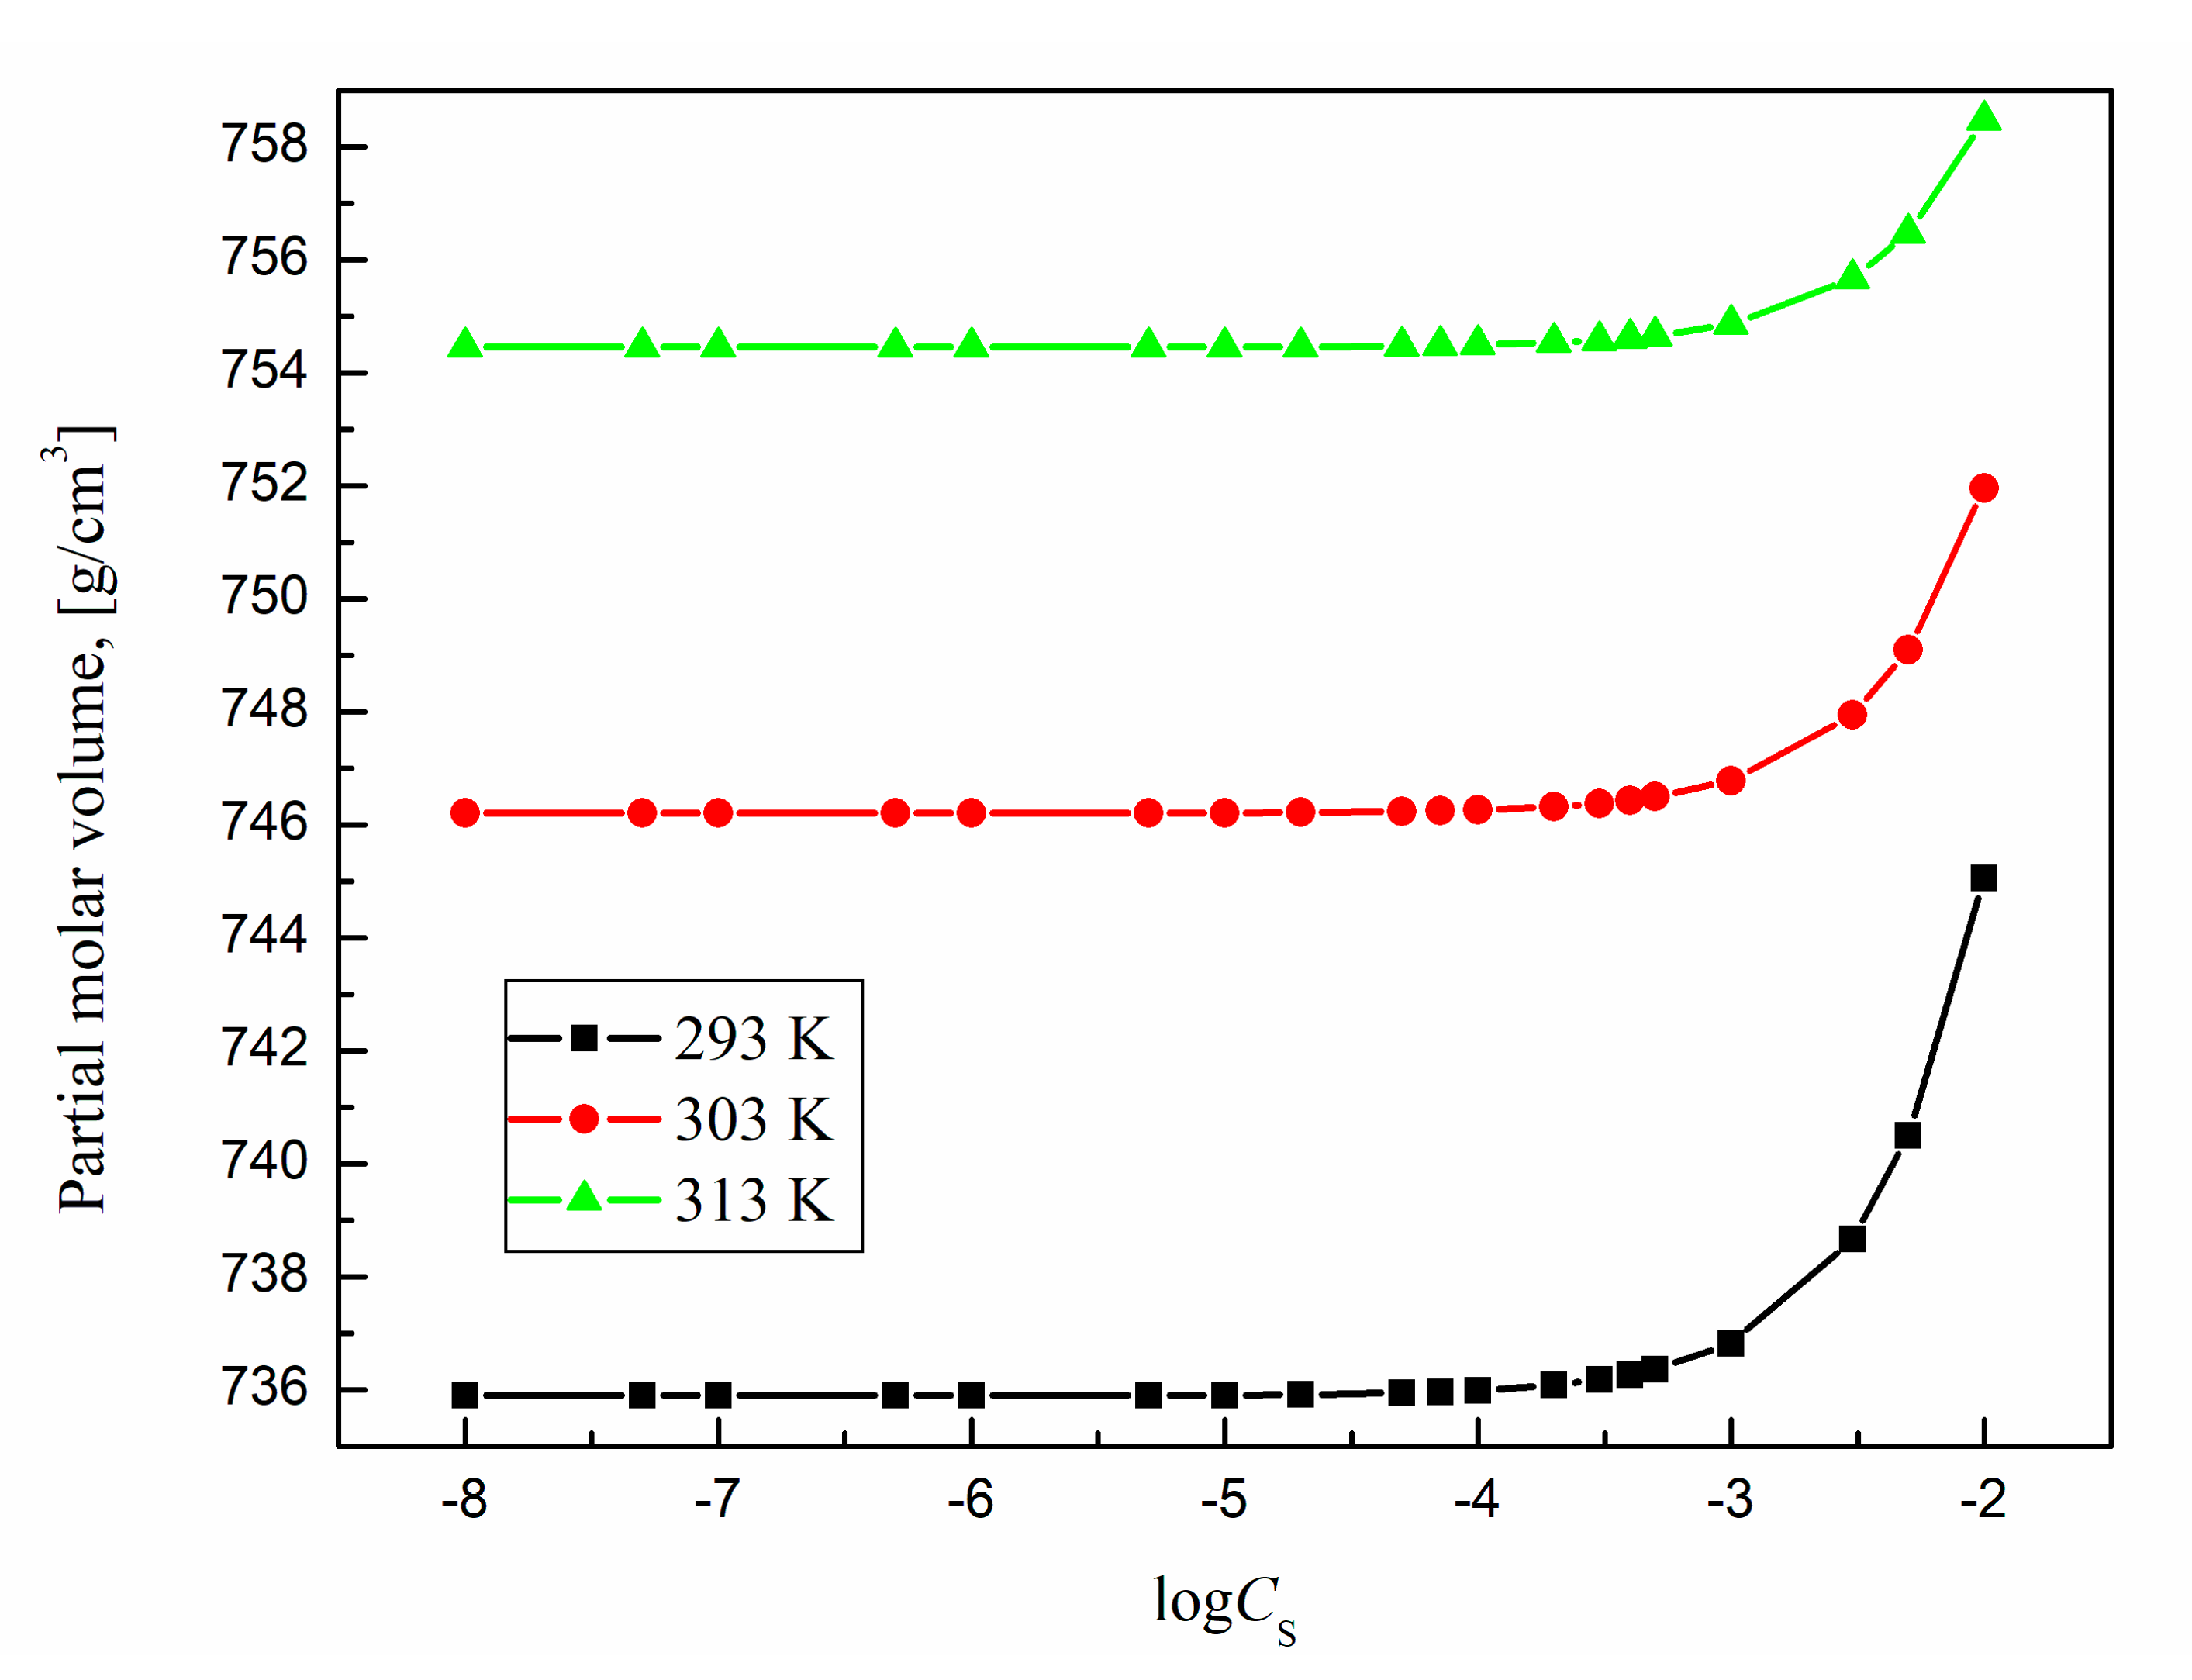
On the basis of the above- mentioned relations between ρ and Cp, the apparent ( ϕ V ) and partial ( V ¯ M ) molar volumes as well as their changes with the surfactant concentration and temperature were determined (Figure 16 and Figure 17).
From these figures it results that the partial and apparent molar volume values for TS-OE12 increase with surfactant concentration and there is no characteristic point corresponding to CMC. The growth of density with TS-OE12 concentration (Figure 13) indicates also that the density of the micellar solution is higher than that of the surfactant in the monomeric form and that the size of micelles increases as a function of TS-OE12 concentration. It is possible to calculate the the size of aggregates as well as a mean aggregation number based on the length of the hydrophobic part of surfactant and its volume as well as on the basis of a diameter of the surfactant aggregate and molar volume of one molecule of surfactant determined from the density measurements. From Figure 15a,b it is difficult to state one unequivocal diameter value of the studied surfactant micelles. Thus additional measurements should be done. In addition the siloxane chains in the core part are expected to be in a coiled form because of the high flexibility of the Si–O–Si bonds.
According to Figure 16 and Figure 17, the values of V ¯ M similarly as those of ϕ V insignificantly increase with increasing temperature. This small increase probably results from the increase in the average distance between the surfactant and water molecules for the surfactant concentrations lower than CMC and between surfactant molecules in the micelles for the surfactant concentrations higher than CMC.

2.6. Thermodynamic Parameters of Adsorption and Micellization

Determination of standard thermodynamic functions (Gibbs free energy, enthalpy and entropy) of the studied surfactants adsorption at the water-air interface gives us more information about the mechanism of the process. Similarly, the standard enthalpy of micellization ( Δ H m i c 0 ), Gibbs free energy of micellization ( Δ G m i c 0 ) and entropy of micellization ( Δ S m i c 0 ) are important in understanding micelle formation in aqueous solution.
For these reasons, on the basis of the dependence of ΓS on CS for TS-OE12 at different temperatures, the standard Gibbs free energy ( Δ G a d s 0 ) and next enthalpy ( Δ H a d s 0 ) and entropy ( Δ S a d s 0 ) of their adsorption at the water-air interface at a given temperature were determined. There are many approaches which can be used to determine Δ G a d s 0 [36,40]. Among others, for dilute aqueous solutions whose concentration corresponds to the unsaturated monolayer at the water-air interface, the Langmuir equation can be used [36,40]. If mutual interactions between the adsorbed molecules are taken into account, the Langmuir equation is as follows [36]:
A S 0 A S A S 0 e x p A S 0 A S A S 0 = C ω e x p ( Δ G a d s 0 R T )
where AS is the area occupied by the surfactant molecule at the interface, ω is the number of water moles in 1 dm3 (at a given temperature). To calculate Δ G a d s 0 from Equation (11), the values of A S 0 for a given surfactant must be known. These values were determined earlier from Equation (5) (Table 2). The values of AS at the water-air interface for studied surfactants at a given temperature were determined from the appropriate values of ΓS (Figure 11). The obtained Δ G a d s 0 values of TS-OE12 are presented in Table 2.
As follows from this table, the Δ G a d s 0 values calculated from Equation (11) are constant only in the range of surfactants concentrations corresponding to the unsaturated monolayer at the water-air interface and the Δ G a d s 0 values decrease with increasing temperature. According to the thermodynamic rule Δ G a d s 0 fulfils the relationship [36,40]:
Δ G a d s 0 = Δ H a d s 0 T Δ S a d s 0
Δ S a d s 0 can be calculated from the relation:
d Δ G a d s 0 d T = Δ S a d s 0
if Δ H a d s 0 is constant over the investigated temperature range. To calculate the standard enthalpy of adsorption of the studied surfactant, the standard entropy of adsorption determined from the Δ G a d s 0 (from Equation (11)) linear changes with temperature in the studied temperature range was used. The obtained values of Δ H a d s 0 and Δ S a d s 0 for TS-OE12 are presented in Table 2. The obtained values of standard Gibbs free energy ( Δ G a d s 0 ), enthalpy ( Δ H a d s 0 ) and entropy ( Δ S a d s 0 ) of TS-OE12 adsorption at the water-air interface indicate the positive values of Δ S a d s 0 . As the Δ H m i c 0 values are influenced by bonds formation, thus positive values of standard enthalpy and entropy of TS-OE12 adsorption suggest that bond breaking predominates in the adsorption process. In addition, the Δ H a d s 0 values suggest that in the studied temperature range, dehydration of the TS-OE12 molecules takes place (Table 2).
There are also different approaches to determination of Δ G m i c 0 . The phase separation model is the simplest one and treats micelles as a simple phase. In this model, micelle formation is treated as a phase separation phenomenon. In the mass action model, micelles and single surfactant molecules or ions are assumed to be in the association-dissociation equilibrium [40].
According to the micellization process, for nonionic surfactants such as TS-OE12, Δ G m i c 0 assumes the following form [36]:
Δ G m i c 0 = R T l n C M C ω
According to the thermodynamic rule, in the exothermic and isobaric conditions, Δ G a d s 0 fulfills the relationship [36,40]:
Δ G m i c 0 = Δ H m i c 0 T Δ S m i c 0
Knowing the values of the standard Gibbs free energy of micellization at different temperatures it is possible to determine the standard enthalpy and entropy of micellization.
Δ S m i c 0 can be calculated from the relation:
d Δ G m i c 0 d T = Δ S m i c 0
if Δ H m i c 0 is constant over the investigated temperature range.
Alternatively, when Δ S m i c 0 is constant over the temperature range investigated, then it is possible to calculate Δ H m i c 0 from the following equation:
T 2 d ( Δ G m i c 0 T ) d T = Δ H m i c 0
As mentioned above, there are some differences in CMC for the same surfactant determined from the surface tension, density and spectrofluorimetric measurements (Table 2). In the calculations of Δ G m i c 0 of TS-OE12 only the CMC values obtained from the surface tension measurements were taken into account. The obtained Δ G m i c 0 values are presented in Table 2.
It occurs that the Gibbs free energy of micellization becomes more negative as the temperature increases, indicating that the formation of micelle becomes more spontaneous at higher temperatures. Next, taking into account the relation between Δ G m i c 0 and T, it was possible to determine Δ S m i c 0 of micellization of TS-OE12 assuming that Δ H m i c 0 of micellization in the studied range of temperatures is constant. It appeared that there is a linear dependence between Δ G m i c 0 and temperature. The slope of this dependence is equal to Δ S m i c 0 . Knowing the values of Δ S m i c 0 , Δ H m i c 0 were found from Equation (17). The obtained values of Δ S m i c 0 and Δ H m i c 0 are presented in Table 2. According to this table, the standard enthalpy and entropy of TS-OE12 micellization take positive values and those of Δ S m i c 0 are higher than zero. The values of Δ H m i c 0 indicate that the micellization process is endothermic. This parameter shows a very strong dependence on temperature, indicating changes in the environment surrounding the hydrocarbon chain of the surfactant molecule with temperature changes. It is also known that Δ H m i c 0 indicates whether during the micellization process more bonds are formed than broken.

3. Materials and Methods

3.1. Materials

All commercially available chemicals were used as received without any further purification. 1,1,1,3,5,5,5-heptamethyltrisiloxane was purchased from Sigma-Aldrich (St. Louis, MO, USA). Allyl polyether was purchased from ICSO Chemical Production (Kędzierzyn-Koźle, Poland). The hydrosilylation catalyst was a commercially available Karstedt catalyst purchased from Sigma-Aldrich.
Doubly distilled and deionized water (Destamat Bi18E, Heraeus, Hanau, Germany) was used for 3-[3-(hydroxy)(polyethoxy)propyl]-1,1,1,3,5,5,5-heptamethyltrisiloxane) (TS-EO12) solutions preparation. Pyrene (Py, purity > 99%) was purchased from Sigma-Aldrich and used without further purification. Ethanol (EtOH) for the pyrene stock solutions preparation was purchased from Avantor Performance Materials Poland S.A. (Gliwice, Poland). The ethanol stock solution of pyrene as well as aqueous stock solutions of TS-EO12 of the appropriate concentrations were prepared by weighing using an analytical balance (model XA105, Mettler-Toledo, Columbus, OH, USA). All the aqueous solutions at a given surfactant concentration lower than that at the stock solution were prepared by dilution of the appropriate stock solution. The pyrene concentration in the stock ethanol solution and in the surfactant solution was equal to 1 × 10⁻² mol/dm3 and 2 × 10⁻⁶ mol/dm3, respectively.

3.2. Methods

Magnetic Nuclear Resonance spectra: 1H-NMR, 13C-NMR and 29Si-NMR were taken on an Ascent 400 instrument (Bruker, Billica, MA, USA) at room temperature, with CDCl3 as a solvent. FT-IR spectra were recorded on a Bruker Tensor 27 spectrophotometer equipped with a SPECAC Golden Gate diamond ATR attachment. The spectra were collected in the range 500–4000 cm−1, with the resolution of 2 cm−1, recording always 16 scans of the background and the sample. The hydrosilylation process was monitored with IR spectroscopy in real time. The measurements were made using a ReactIR 15 spectrometer (Mettler Toledo), equipped with a 9-unit reflection probe with an AgX DiComp diamond window of 9.5 mm (Mettler Toledo) and an MCT detector cooled with nitrogen. The spectra were recorded at a resolution of 4 cm−1, accumulating 50 scans of each spectrum, at 15 s intervals. The reaction progress was quantified by observation of the rate of changes in the area of the band with a maximum at 904 cm−1, assigned to the stretching vibrations of Si–H.
The gel permeation chromatography (GPC) measurements were made using a 2414 RI detector (Waters, Milford, MA, USA) and three 7.8 × 300 mm columns connected in series (HR1, HR2 and HR4). THF with a flow of 0.6 mL/ min was used as the mobile phase, column temperature was 308.15 K (35 °C), detector temperature was 313.15 K (40 °C). All molecular weights and mass distribution coefficients (PDIs) were calculated from a calibration curve for polystyrene standards (Shodex, Tokyo, Japan) in the mass range from 1.31 × 10³ to 3.64 × 10⁶ Da. Thermogravimetric analysis (TGA) was performed on a Q50 apparatus (TA Instruments, New Castle, PA, USA), under nitrogen flow (60 mL/min) from room temperature to 1173.15 K (900 °C), at a heating rate of 283.15 K/min (10 °C/min).
The equilibrium surface tension of water and freshly prepared aqueous solutions of the studied surfactants was measured at 293 K, 303 K and 313 K by a KC100 tensiometer (Krüss, Hamburg, Germany) according to the platinum ring tensiometer (or du Nouy’s) method. The solution to be measured was transferred to the measurement vessel, taking care to avoid foaming. In addition, before the measurement the measurement vessel was washed with hot chromo-sulfuric acid and subsequently with syrupy phosphoric acid (83 to 98% by weight of H3PO4), thoroughly rinsed in tap water and finally washed with double distilled water. The measured surface tension values were corrected according to the procedure of Harkins and Jordan. They have empirically determined correction factors which are dependent on ring dimensions, the density of the liquid and its surface tension. The ring was cleaned with acetone and next with distilled water and heated to red color with a Bunsen burner before each measurement. In all cases more than 10 successive measurements were performed. The standard deviation depending on the surfactant concentration range was from ± 0.1 to ± 0.2 mN/m (depending on the surfactant concentration range). The temperature was controlled by a jacketed vessel joined to the thermostatic water bath with the accuracy ± 0.01 K.
The density of aqueous solutions of surfactants studied was measured with a U-tube densitometer (DMA 5000, Anton Paar, Graz, Austria) at constant temperatures equal to 293, 303 and 313 K. The accuracy of temperature and density measurements were ±0.01 K and ± 0.005 kg/m3, respectively. The precision of the density and temperature measurements declared by the manufacturer is ±0.001 kg/m3 and ±0.001 K. The densitometer was calibrated regularly with distilled and deionized water.
The fluorescence intensities of the probe (pyrene) in aqueous solutions of studied surfactant were measured at 293, 303 and 313 K on a F-2700 fluorescence spectrophotometer (Hitachi, Tokyo, Japan) using 10 mm quartz cell. A 300 nm/min scan speed was used.
The emission spectra of pyrene were monitored at the excitation wavelength at 335 nm and the excitation and emission slits were set at 2.5 nm. The intensities I1 and I3 were read at the wavelengths corresponding to the first and third vibronic bands close to 372 and 384 nm, respectively.
Morphology of TS-EO12 aggregates was characterized by a Quanta FEG 250 scanning electron microscope (FEI, Morristown, NJ, country) under high vacuum conditions using an accelerating voltage of 1.2 kV. Optical microscopy imaging was realized by a LEXT OLS4100 laser scanning confocal microscope (Olympus, Tokyo, Japan). In a both cases (SEM, optical microscopy) measurements were performed on a glass plate. For this purpose glass plates were modified in two different ways: by sonication and immersing methods. In the first way the surfactant solution (2 × 10⁻² mol/dm3) was applied directly on a cleansed substrate by means of ultrasounds. The plates were placed in a beaker filled with a modifying compound solution and subjected to the action of ultrasound for 15 min. Glass plates were dried in a desiccator at room temperature for 24 h. In the second method glass plates were immersed in surfactant solution for 30 min. After this time, excess solution was removed and plates were dried in a desiccator at room temperature for 24 h.

3.3. Synthesis of 3-[3-(Hydroxy)(polyethoxyy)propyl]-1,1,1,3,5,5,5-Heptamethyltrisiloxane

The siloxane-containing polyether group was synthesized in the hydrosilylation reaction of 1,1,1,3,5,5,5-heptamethyltrisiloxane and allyl polyether containing twelve ethoxy groups with the terminal hydroxy group. The process was carried out in the presence of Karstedt catalyst and using toluene as a solvent. 1,1,1,3,5,5,5-heptamethyltrisiloxane was placed in a three-necked round-bottom flask equipped with a reflux, thermometer and magnetic stirrer and then dissolved in toluene. The mixture was heated to the process temperature of 383.15 K (110 °C), then the olefin was added in a stoichiometric amount. A portion of Karstedt catalyst corresponding to 1 × 10⁻⁴ mol Pt/ 1 mol of Si–H bonds, was added. The reaction mixture was maintained at 383.15 K (110 °C) until the substitution of the olefin. The course of the reaction was monitored by IR spectroscopy, by observation of disappearance of the band at 904 cm−1, assigned to the Si–H bond in the substrate. After completion of the process, the post-reaction mixture was cooled and the products were isolated by distilling off the solvent and excessive olefin under reduced pressure. The pure product was obtained in high yields of 97%. The products were subjected to spectroscopic analysis to verify obtainment of the assumed structure.

3.4. Product Characterization

1H-NMR (CDCl3, TMS) δ (ppm): −0.06 (–Si(CH3)3); 0.02 (–SiCH3); 0.36 (–SiCH2–); 1.51 (–CH2CH2CH2–); 3.34 (–CH2O–); 3.59 (–OCH2CH2–); 3.61 (–OH).
13C-NMR (CDCl3, TMS) δ (ppm): −0.65 (–SiCH3); 1.59 (–Si(CH3)3); 13.19 (–SiCH2–); 22.81 (–CH2CH2CH2–); 61.32 (–CH2O–); 70.27 (–OCH2CH2–).
29Si-NMR (CDCl3, TMS) δ (ppm): −21.93 (–Si(CH3)CH2); 7.36 (–Si(CH3)3).

4. Conclusions

The above presented analyses and interpretations permit drawing the following conclusions. Analysis of the research results shows that the loss of Si–H bond conversion takes place directly after introduction of a catalyst portion to the reaction mixture. At that time a jump in temperature takes place leading to almost immediate conversion of Si–H bonds reaching over 90%. Total conversion of Si–H bonds in the system studied was reached after about 55 min of the reaction measured from the moment of the catalyst addition. To sum up a relatively short reaction time and high conversion of the process, reaching 97%, indicate that the system is highly effective. The isolated product was subjected to spectroscopic analysis (1H-NMR, 13C-NMR, 29Si-NMR). A GPC measurement was also performed to analyze the size and molecular weight distribution of the product. In addition, thermal stability tests of the product were carried out. The product structure was confirmed.
As shown by the surface tension, density as well as spectrofluorimetric measurements the critical micelle concentration as well as the surface tension of aqueous solutions of TS-OE12 decrease with increasing temperature. This is probably related to the fact that the degree of hydration of the studied surfactant (TS-OE12) molecules is reduced when they are at the water-air interface and in the micelles.
The partial molar volume, likewise the apparent molar volume of TS-OE12 increase with temperature, which is probably connected with the increase in the average distance between TS-OE12 and water molecules for the surfactant concentrations lower than the critical micelle concentration and between surfactant molecules in the micelles for the surfactant concentrations higher than CMC.
During the micellization process of the studied surfactant, more bonds are broken than formed.
Aggregates of studied surfactant, formed in aqueous solution, could be considered as more or less spherical or ellipsoid ones.

Supplementary Materials

The following are available online, Figure S1: A plot of mole fraction of the area occupied by TS-OE12 at the water-air interface ( X S ) vs. the logarithm of its concentration ( log C S ) at a temperature equal to 293 K, 303 K and 313 K determined from Equation (4), Figure S2: A plot of mole fraction of the area occupied by TS-OE12 at the water-air interface ( X S ) vs. the logarithm of its concentration ( log C S ) at a temperature equal to 293 K, 303 K and 313 K determined from Equation (6), Figure S3: A plot of logarithm of mole fraction of the area occupied by TS-OE12 at the water-air interface ( log X S ) vs. the logarithm of its concentration ( log C S ) at a temperature equal to 293 K, 303 K and 313 K determined from Equation (6), Figure S4: Values of surface tension ( γ LV ) of aqueous solutions of TS-OE12 (curves 1–3) determined from Equation (7) at 298 K, 303 K and 313 K vs. the logarithm of surfactant concentration ( log C S ). Figure S5: A plot of the pyrene (I1/I3) and (I3/I1) ratios vs. the logarithm of TS-OE12 concentration ( log C S ) at 303 K, Figure S6: A plot of the pyrene (I1/I3) and (I3/I1) ratios vs. the logarithm of TS-OE12 concentration ( log C S ) at 313 K.

Author Contributions

Conceptualization, J.K. (Joanna Karasiewicz) and J.K. (Joanna Krawczyk); methodology, J.K. (Joanna Karasiewicz) and J.K. (Joanna Krawczyk); software, J.K. (Joanna Krawczyk); validation, J.K. (Joanna Krawczyk); formal analysis, J.K. (Joanna Karasiewicz) and J.K. (Joanna Krawczyk); investigation, J.K. (Joanna Karasiewicz) and J.K. (Joanna Krawczyk); resources, J.K. (Joanna Karasiewicz) and J.K. (Joanna Krawczyk); data curation, J.K. (Joanna Karasiewicz) and J.K. (Joanna Krawczyk); writing—original draft preparation, J.K. (Joanna Karasiewicz) and J.K. (Joanna Krawczyk); writing—review and editing, J.K. (Joanna Krawczyk) and J.K. (Joanna Karasiewicz); visualization, J.K. (Joanna Karasiewicz); supervision, J.K. (Joanna Karasiewicz) and J.K. (Joanna Krawczyk); project administration, J.K. (Joanna Karasiewicz); funding acquisition, J.K. (Joanna Krawczyk) and J.K. (Joanna Karasiewicz). All authors have read and agreed to the published version of the manuscript.

Funding

The financial support from National Science Centre in Poland, Project No. 2019/03/X/ST5/00021 is gratefully acknowledged.

Conflicts of Interest

The authors declare no conflict of interest.

References

  1. Li, X.; Yu, R.; Zhao, T.; Zhang, Y.; Yang, X.; Zhao, X.; Huang, W. A self-healing polysiloxane elastomer based on siloxane equilibration synthesized through amino-ene Michael addition reaction. Eur. Polym. J. 2018, 108, 399–405. [Google Scholar] [CrossRef]
  2. Zheng, F.-T.; Kai, T.; Lu, Z.; Yamamoto, K.; Ohshita, J. Preparation of polydimethylsiloxane with amino end group via Pd-catalyzed dehydrogenative coupling of terminal hydrosilyl unit and amine. J. Organomet. Chem. 2018, 860, 9–13. [Google Scholar] [CrossRef]
  3. Cheng, Z.; Li, Q.; Yan, Z.; Liao, G.; Zhang, B.; Yu, Y.; Yi, C.; Xu, Z. Design and synthesis of novel aminosi loxane crosslinked linseed oil-basedwaterborne polyurethane composites and its physicochemical properties. Prog. Org. Coat. 2019, 127, 194–201. [Google Scholar] [CrossRef]
  4. Wei, Y.; Zheng, C.; Chen, P.; Yu, Q.; Mao, T.; Lin, J.; Liu, L. Synthesis of multiblock linear polyether functional amino silicone softener and its modification of surface properties on cotton fabrics. Polym. Bull. 2019, 76, 447–467. [Google Scholar] [CrossRef]
  5. Suna, X.; Chena, R.; Gaob, X.; Liua, Q.; Liua, J.; Zhanga, H.; Yua, J.; Liub, P.; Takahashib, K.; Wanga, J. Fabrication of epoxy modified polysiloxane with enhanced mechanical properties for marine antifouling application. Eur. Polym. J. 2019, 117, 77–85. [Google Scholar] [CrossRef]
  6. Herr, D.; Chaplinsky, S.; Romanelli, A.L.; Zadjura, R. Synthesis and Study of New Radial Organic/Inorganic Hybrid Epoxides. J. Appl. Polym. Sci. 2008, 107, 3244–3257. [Google Scholar] [CrossRef]
  7. Jia, P.; Liu, H.; Wang, Y.; Cai, X. A novel epoxy-functionalized hyperbranched polysiloxane (HPSi) endowing methyl phenyl silicone resin (Si603)/epoxy systems with enhanced compatibility and fire retardancy performance. RSC Adv. 2015, 5, 97413–97421. [Google Scholar] [CrossRef]
  8. Yang, X.; Tu, Q.; Shen, X.; Jiang, C.; Pan, M.; Zhu, P.; Li, Y.; Hu, C.; Zhang, Q. Study on interfacial adhesion of the aramid fibers/rubber matrix by grafting mercapto hyperbranched polysiloxane. Polym. Test. 2020, 81, 106259. [Google Scholar] [CrossRef]
  9. Xia, Y.; Liu, Z.; Feng, S.; Ye, F.; Zhang, Y.; Wang, J. Rh(I)-Catalyzed Cross-Coupling of α-Diazoesters with Arylsiloxanes. Org. Lett. 2015, 17, 956–959. [Google Scholar] [CrossRef] [PubMed]
  10. Fang, P.; Bai, Y.; Wang, W.; Ma, X.; Mei Tai, X.; Wang, G. Properties of ABA and BA polysiloxane amphiphiles modified by polyether. J. Dispers. Sci. Technol. 2018, 39, 1010–1017. [Google Scholar] [CrossRef]
  11. Jin, Y.; Pu, Q.; Fan, H. Synthesis of Linear Piperazine/Polyether Functional Polysiloxane and Its Modification of Surface Properties on Cotton Fabrics. ACS Appl. Mater. Interfaces 2015, 7, 7552–7558. [Google Scholar] [CrossRef]
  12. Holberg, S.; Losada, R.; Blaikie, F.H.; Hansen, H.H.W.B.; Soreau, S.; Onderwater, R.C.A. Hydrophilic silicone coatings as fouling release: Simple synthesis, comparison to commercial, marine coatings and application on fresh watercooled heat exchangers. Mater. Today Commun. 2020, 22, 100750. [Google Scholar] [CrossRef]
  13. Eduok, U.; Faye, O.; Szpunar, J. Recent developments and applications of protective silicone coatings: A review of PDMS functional materials. Prog. Org. Coat. 2017, 111, 124–163. [Google Scholar] [CrossRef]
  14. Ren, Z.; Yan, S. Polysiloxanes for optoelectronic applications. Prog. Mater. Sci. 2016, 83, 383–416. [Google Scholar] [CrossRef]
  15. Putzien, S.; Nuyken, O.; Kühn, F.E. Functionalized polysilalkylene siloxanes (polycarbosiloxanes) by hydrosilylation—Catalysis and synthesis. Prog. Polym. Sci. 2010, 35, 687–713. [Google Scholar] [CrossRef]
  16. Shi, Q.; Qiao, W. Synthesis of siloxane polyether surfactants and their solubility in supercritical CO2. J. Surf. Deterg. 2017, 20, 453–458. [Google Scholar] [CrossRef]
  17. Fu, K.; Xu, M.; Zhong, R.; Yang, Z.; Zhou, A. Preparation, characterization and application of polyether and long-chain alkyl co-modified polydimethylsiloxane. J. Polym. Res. 2019, 26, 261–269. [Google Scholar] [CrossRef]
  18. Kim, D.-W.; Noh, S.-T. Synthesis and surface-active properties of a trisiloxane modified oligo(propylene oxide-block-ethylene oxide) wetting agent. J. Appl. Polym. Sci. 2004, 92, 3292–3302. [Google Scholar] [CrossRef]
  19. Tan, J.; Xiong, X.; He, Z.; Cao, F.; Sun, D. Aggregation behavior of polyether based Siloxane Surfactants in Aqueous Solutions: Effect of Alkyl Groups and Steric Hindrance. J. Phys. Chem. B 2019, 123, 1390–1399. [Google Scholar] [CrossRef]
  20. Tan, J.; He, Z.; Miao, Y.; Lin, M. Synthesis and Surface Properties of Polyether-Based Silicone Surfactants with Different Siloxane Groups. J. Surf. Deterg. 2019, 22, 875–883. [Google Scholar] [CrossRef]
  21. Tan, J.; Liu, Y.; Ye, Z. Synthesis, aggregation behavior of polyether based carbosilane surfactants in aqueous solution. J. Mol. Liq. 2019, 279, 657–661. [Google Scholar] [CrossRef]
  22. Cao, J.; Wang, Y.D.; Zhang, J.; Feng, S. Functional polysiloxanes: A novel synthesis method and hydrophilic applications. New J. Chem. 2017, 41, 8546–8553. [Google Scholar] [CrossRef]
  23. Tan, J.; He, Z.; Bai, Y.; Yan, P. Synthesis, characterization and surface properties of novel polyether based siloxane surfactants. J. Disp. Sci. Technol. 2020, 41, 188–194. [Google Scholar] [CrossRef]
  24. Gentle, T.E.; Snow, S.A. Adsorption of Small Silicone Polyether Surfactants at the air-water Interface. Langmuir 1995, 11, 2905–2910. [Google Scholar] [CrossRef]
  25. Pukale, D.D.; Bansode, A.S.; Jadhav, N.L.; Pinjari, D.V.; Kulkarni, R.R. Review on Silicone Surfactants: Silicone-based Gemini Surfactants, Physicochemical Properties and Applications. Tenside Surf. Deterg. 2019, 56, 268–278. [Google Scholar] [CrossRef]
  26. O’Lenick, A.J., Jr. Silicone Emulsions and Surfactants. J. Surf. Deterg. 2000, 3, 387–393. [Google Scholar] [CrossRef]
  27. Hill, R.M. Siloxane surfactants. In Specialist Surfactants; Robb, I.O., Ed.; Blackie Academic and Professional: London, UK, 1997; p. 143. [Google Scholar]
  28. Hill, R.M. Superspreading. Curr. Opin. Colloid Interface Sci. 1998, 3, 247. [Google Scholar] [CrossRef]
  29. Hill, R.M. Dynamics of surfactant enhanced spreading. ECJ Eur. Coat. J. 1998, 7–8, 550. [Google Scholar]
  30. Ananthapadmanabhan, K.P.; Goddard, E.D.; Chandar, P. A study of the solution, interfacial and wetting properties of silicone surfactants. Colloids Surf. 1990, 44, 281–297. [Google Scholar] [CrossRef]
  31. Gradzielski, M.; Hoffman, H.; Robisch, P.; Ulbricht, W.; Gruning, B. Aggregation behaviour of silicone surfactants in aqueous solutions. Tenside Surf. Deterg. 1990, 27, 366–374. [Google Scholar]
  32. Zdziennicka, A.; Szymczyk, K.; Krawczyk, J.; Jańczuk, B. Activity and thermodynamic parameters of some surfactants adsorption at the water-air interface. Fluid Phase Equilibria 2012, 318, 25–33. [Google Scholar] [CrossRef]
  33. Zdziennicka, A.; Jańczuk, B. Thermodynamic parameters of some biosurfactants and surfactants adsorption at water-air interface. J. Mol. Liq. 2017, 243, 236–244. [Google Scholar] [CrossRef]
  34. Szymczyk, K.; Zdziennicka, A.; Krawczyk, J.; Jańczuk, B. Behaviour of cetyltrimethylammonium bromide, Triton X-100 and Triton X-114 in mixed monolayer at the water-air interface. J. Chem. Thermodyn. 2014, 69, 85–92. [Google Scholar] [CrossRef]
  35. Soni, S.S.; Sastry, N.V.; Aswal, V.K.; Goyal, P.S. Micellar structure of silicone surfactants in water from surface activity, SANS and viscosity studies. J. Phys. Chem. B 2002, 106, 2606–2617. [Google Scholar] [CrossRef]
  36. Rosen, J.M. Surfactants and Interfacial Phenomena, 3rd ed.; Wiley: New York, NY, USA, 2004. [Google Scholar]
  37. Svitova, T.; Hill, R.M.; Smirnova, Y.; Stuermer, A.; Yakubov, G. Wetting and interfacial trsnsitions in dilute solutions of trisiloxane surfactants. Langmuir 1998, 14, 5023–5031. [Google Scholar] [CrossRef]
  38. Joos, P. Thermodynamics of mixed monolayers. Bull. Soc. Chim. Belg. 1967, 76, 591. [Google Scholar] [CrossRef]
  39. Zdziennicka, A.; Krawczyk, J.; Szymczyk, K.; Jańczuk, B. Macroscopic and Microscopic Properties of Some Surfactants and Biosurfactants. Int. J. Mol. Sci. 2018, 19, 1934. [Google Scholar] [CrossRef] [Green Version]
  40. Adamson, A.W. Physical Chemistry of Surfaces, 5th ed.; Wiley: New York, NY, USA, 1990. [Google Scholar]
  41. Mańko, D.; Zdziennicka, A.; Jańczuk, B. Thermodynamic properties of adsorption and micellization of n-oktyl-β-D-glucopiranoside. Colloids Surf. B 2014, 114, 170–176. [Google Scholar] [CrossRef]
  42. Krawczyk, J. Thermodynamic properties of disaccharide based surfactants adsorption at the water-air interface. Colloids Surf. A 2018, 551, 50–57. [Google Scholar] [CrossRef]
  43. Kalyanasundaram, K.; Thomas, J.K. Enviromental effects on vibronic band intensities in pyrene monomer fluorescence and their application in studies of micellar systems. J. Am. Chem. Soc. 1977, 99, 2039–2044. [Google Scholar] [CrossRef]
  44. Kale, K.M.; Zana, R. Effect of the nature of the counterion on the volume change upon micellization of ionic detergents in aqueous solutions. J. Colloid Interface Sci. 1977, 61, 312–322. [Google Scholar] [CrossRef]
  45. Boden, N.; Corne, S.A.; Jolley, K.W. Lyotropic mesomorphism of the cesium pentadecafluorooctanoate/water system: High-resolution phase diagram. J. Phys. Chem. 1987, 1, 4092–4105. [Google Scholar] [CrossRef]
Scheme 1. Hydrosilylation of allyl ether with 1,1,1,3,5,5,5-heptamethyltrisiloxane.
Molecules 25 05669 sch001
Figure 1. Surface plot illustrating the rate of changes in the area under the band at υ ˜ = 904   cm−1 for the catalytic system studied.
Molecules 25 05669 g001
Figure 2. Analysis of real-time FTIR measurements showing changes in the intensity of the band at υ ˜ = 904 cm−1 with time during the hydrosilylation of 5-(allyloxy)-1,1,2,2,3,3,4,4-octafluoropentane in the presence of Karstedt’s catalyst.
Molecules 25 05669 g002
Figure 3. The course of hydrosilylation presented as the time dependence of temperature.
Molecules 25 05669 g003
Figure 4. 1H-NMR spectrum of the product.
Molecules 25 05669 g004
Figure 5. 13C-NMR spectrum of the product.
Molecules 25 05669 g005
Figure 6. 29Si-NMR spectrum of the product.
Molecules 25 05669 g006
Figure 7. FT-IR spectrum of the product (red line) and the substrates 1,1,1,3,5,5,5-heptamethyltrisiloxane (yellow line) and allyl polyether (blue line).
Molecules 25 05669 g007
Figure 8. The GPC results of the product.
Molecules 25 05669 g008
Figure 9. TGA and DTG curves of the product.
Molecules 25 05669 g009
Figure 10. Measured values of surface tension ( γ L V ) of aqueous solutions of TS-OE12 (curves 1–3) at 298 K, 303 K and 313 K vs. the logarithm of surfactant concentration (logCS).
Molecules 25 05669 g010
Figure 11. TS-OE12 Gibbs surface excess concentration (ΓS) at 298 K, 303 K and 313 K vs. the logarithm of surfactant concentration (logCS).
Molecules 25 05669 g011
Figure 12. Mole fraction of the area occupied by TS-OE12 at the water-air interface (XS) vs. the logarithm of its concentration (logCS) at 293 K, 303 K and 313 K, determined from Γ S Γ S   .
Molecules 25 05669 g012
Figure 13. Density (ρ) of aqueous solutions of TS-OE12 at 298 K, 303 K and 313 K vs. the logarithm of surfactant concentration (logCS).
Molecules 25 05669 g013
Figure 14. The ratios of I1/I3 and I3/I1 for pyrene vs. the logarithm of TS-OE12 concentration (logCS) at 298 K.
Molecules 25 05669 g014
Figure 15. (a) Confocal microscopy images of glass plates modified with TS-OE12 aqueous solutions by sonication (GPM1) method. (b) Confocal microscopy images of glass plates modified with TS-OE12 aqueous solutions by immersing (GPM2) method.
Molecules 25 05669 g015
Figure 16. The apparent molar volume ( ϕ V ) of TS-OE12 vs. the logarithm of its concentration (logCS) at 293 K, 303 K and 313 K.
Molecules 25 05669 g016
Figure 17. The partial molar volume ( V ¯ M ) of TS-OE12 vs. the logarithm of its concentration (logCS) at 293 K, 303 K and 313 K.
Molecules 25 05669 g017
Table 1. The values of maximal Gibbs surface excess concentration ( Γ S max ), minimal area of TS-OE12 molecules at the water-air interface ( A S min ), limiting Gibbs surface excess concentration ( Γ S ), limiting area ( A S 0 ), critical micelle concentration (CMC) at 293 K, 303 K and 313 K.
Temperature [K]
293303313
Γ S max × 106
[mol/m2] a
2.642.602.52
A S min
2] b
62.9063.8665.89
Γ S × 106
[mol/m2] c
2.692.642.55
A S 0
2] d
61.8063.0065.00
CMC × 10−4 [mol/dm3] e
(from γ L V )
3.122.532.08
CMC × 10−4 [mol/dm3] f
(from ρ)
2.202.182.15
CMC × 10−4 [mol/dm3] g
(from I1/I3)
4.94.073.89
a Uncertainty of calculation was ±0.12 mol/m2; b Uncertainty of calculation was ±1.02 Ǻ2; c Uncertainty of calculation was ±0.14 Ǻ2; d Uncertainty of calculation was ±1.04 Ǻ2; e Uncertainty of calculation was ±0.13 × 10⁻⁴ mol/dm3; f Uncertainty of calculation was ±0.3 × 10⁻⁴ mol/dm3; g Uncertainty of calculation was ±0.25 × 10⁻⁴ mol/dm3.
Table 2. The values of standard Gibbs free energy ( Δ G a d s 0 ), standard enthalpy ( Δ H a d s 0 ) and standard entropy ( Δ S a d s 0 ) of TS-OE12 adsorption as well as standard Gibbs free energy ( Δ G m i c 0 ), standard enthalpy ( Δ H m i c 0 ) and standard entropy ( Δ S m i c 0 ) of TS-OE12 micellization at 293 K, 303 K and 313 K.
Temperature [K]
293303313
Δ G a d s 0 [kJ/mol] a−45.91−48.3−50.33
Δ H a d s 0
[kJ/mol] b
18.7818.7818.78
Δ S a d s 0
[kJ/molK] c
0.220.220.22
Δ G m i c 0
[kJ/mol] d
−29.45−30.97−32.49
Δ H m i c 0
[kJ/mol] e
15.1215.1215.12
Δ S m i c 0
[kJ/molK] f
0.150.150.15
a–f Uncertainty of Δ G m i c 0 , Δ H m i c 0 and Δ S m i c 0 calculation was ±0.35 KJ/mol.
Sample Availability: Not available.
Publisher’s Note: MDPI stays neutral with regard to jurisdictional claims in published maps and institutional affiliations.