Article

Modulation of Lipid Metabolism by Trans-Anethole in Hepatocytes

1
Department of Integrated Biomedical and Life Science, College of Health Science, Korea University, Seoul 02841, Korea
2
Department of Clinical Laboratory Sciences, College of Health Science, Korea University, Seoul 02841, Korea
3
Life Together, 13 Gongdan-ro, Chuncheon-si 24232, Gangwon, Korea
4
Mitosbio, 13, Gongdan-ro, Chuncheon-si 24232, Gangwon, Korea
*
Authors to whom correspondence should be addressed.
These authors contributed equally to this work.
Molecules 2020, 25(21), 4946; https://doi.org/10.3390/molecules25214946
Submission received: 19 August 2020 / Revised: 12 October 2020 / Accepted: 22 October 2020 / Published: 26 October 2020
(This article belongs to the Special Issue Natural Products: Isolation, Identification and Biological Activity)

Abstract

:
Non-alcoholic fatty liver disease is caused by excessive lipid accumulation in hepatocytes. Although trans-anethole (TAO) affects hypoglycemia and has anti-immune activity and anti-obesity effects, its role in non-alcoholic fatty liver disease remains unknown. This study aimed to evaluate the effects of TAO on cellular senescence, lipid metabolism, and reinforcement of microenvironments in HepG2 cells. To analyze the lipid metabolic activity of TAO, PCR analysis, flow-cytometry, and Oil Red O staining were performed, and mitochondrial membrane potential (MMP) and cellular senescence kits were used for assessing the suppression of cellular senescence. At 2000 μg/mL TAO, the cellular viability was approximately 99%, and cell senescence decreased dose-dependently. In the results for MMP, activity increased with concentration. The levels of lipolytic genes, CPT2, ACADS, and HSL, strongly increased over 3 days and the levels of lipogenic genes, ACC1 and GPAT, were downregulated on the first day at 1000 μg/mL TAO. Consequently, it was found that TAO affects the suppression of cellular senescence, activation of lipid metabolism, and reinforcement of the microenvironment in HepG2 cells, and can be added as a useful component to functional foods to prevent fatty liver disease and cellular senescence, as well as increase the immunoactivity of the liver.

1. Introduction

Non-alcoholic fatty liver disease (NAFLD), the most common liver disorder, causes nonalcoholic steatohepatitis, which can further lead to severe diseases, including hepatocarcinoma, cirrhosis, and cardiovascular disease [1,2]. Metabolic dysfunctions such as excessive lipogenesis in hepatocytes, accumulated triglycerides (TGs), and cholesterol causes NAFLD [3].
To hydrolyze accumulated TGs, hepatocytes modulate the activation of various enzymes, including glycerol-3-phosphate acyltransferase (GPAT) [4], diglyceride acyltransferase [5], acetyl-coA carboxylase 1 (ACC1) [6], hormone sensitive lipase (HSL) [7], adipocyte protein 2 (AP2) [8], and lipoprotein lipase (LPL). To modulate the activation of the lipolytic enzymes, activation of AMP-activated protein kinase (AMPK), an upstream regulator, is conducted by hepatocytes [9]. By activating AMPK, β-oxidation of fatty acids is activated in hepatocytes. Notably, activated AMPK increases the levels of HSL and LPL associated with lipolysis. Phosphorylated Perilipin-1 (PLIN1), a lipid droplet-associated protein, activates HSL to lyse TGs [10]. In β-oxidation, acyl-CoA synthetase (ACS) converts the free fatty acids to acyl-CoAs and carnitine palmitoyltransferase (CPT) transports them into the mitochondrial matrix [11,12,13]. The converted acyl-CoAs are fragmented by acyl-CoA dehydrogenase (ACAD). To activate lipolysis, ACC1, a major enzyme in lipogenesis, is inhibited by several factors, including activated AMPK, glucagon, and increased levels of acyl-CoA [14].
Trans-anethole [TAO, 1-methoxy-4-(1-propenyl)benzene], an aromatic organic compound, is a colorless and slightly volatile liquid with a distinctive odor [15]. In nature, high levels of TAO are found in many herbs, including fennel (Foeniculum vulgare), anise (Pimpinella anisum L.), and star anise (Illicium verum) [16,17,18]. Likewise medicinal compounds in a plant [19], TAO is studied for its bioactive functions, including antimicrobial, antifungal, and insecticidal activity [20,21,22]. It is also known for its blood sugar lowering activity [23], and for inducing browning in white adipocytes and activating brown adipocytes [24]. Additionally, TAO suppresses tumorigenesis and oxidative stress by scavenging free radicals in humans [25]. Although there have been many studies focusing on the lipid metabolism of hepatocytes, the modulatory mechanism of TAO remains elusive.
We aimed to evaluate the bioactive effects of TAO on cellular senescence, lipid metabolism, and reinforcement of microenvironments in HepG2 cells. We presented possibility for the utility of TAO as functional foods through the establishment of its above-mentioned bioactive effects.

2. Results

Under TAO, signal pathways of lipid metabolism in HepG2 cells were schematized at Figure 1.

2.1. Effects of TAO on Cytotoxicity and Cellular Metabolism

Despite high concentrations (1000, 1500, and 2000 μg/mL), TAO was nontoxic in HepG2 cells (Figure 2a). Moreover, even at 2000 μg/mL of TAO, the cellular viability was approximately 99% (Figure 2a). When exposed to 100 and 500 μg/mL of TAO, the senescence was estimated to be 0.40 and 0.37 times greater than those of the control, respectively. Although the difference in cellular senescence between the two concentrations was not significant (p < 0.07), senescence dramatically decreased by 0.14 times at 1000 μg/mL (Figure 2b). In the case of MMP, the activity increased by 1.50 and 1.55 times at 500 μg/mL and 1000 μg/mL of TAO, respectively (Figure 2c). As these results are for the stained cell counts, the geometric means of fluorescence intensity also had the same tendency with the counts. At 500 μg/mL and 1000 μg/mL of TAO, the fluorescence intensity increased by 1.27 and 1.59 times, respectively (Figure 2c).

2.2. Analysis of the Expression Levels of Lipid Metabolism Genes

TAO activated several lipolytic genes, including AMPK, ACS, ACADS, LPL, CPT1, CPT2, PLIN1, and HSL, in HepG2. After exposure to TAO for one day, the levels of AMPK, an upstream molecule, increased by 1.35 and 2.50 times at 500 and 1000 μg/mL of TAO, respectively (Figure 3a). Under increased AMPK levels, the levels of GLUT4 increased by 2.5 times in 3 days at 1000 μg/mL of TAO (Figure 3a,c). For ACS, a molecule downstream of AMPK, the levels increased by 1.59 times for 1000 μg/mL TAO (Figure 3a,c). With an increase in CPT level by 25.82 times, ACAD on day three was increased considerably by approximately 11.76 times for 1000 μg/mL TAO (Figure 3b,c). On day one, the levels of HSL and LPL were also upregulated by 1.29 and 1.45 times under the effect of 1000 μg/mL of TAO (Figure 4a,b). On day three, the AP2 level increased by approximately 3.68 times at 1000 μg/mL TAO. PLIN1 level increased dose-dependently and HSL increased considerably at 1000 μg/mL TAO (Figure 4c,d). Compared to the control, the level of HSL was 9.35 times higher at 1000 μg/mL TAO (Figure 4d). Correspondently with the result for SREBP1(Supplementary Data), in lipogenic genes, including ACC1 and GPAT, TAO (1000 μg/mL TAO) downregulated the gene levels by 30% and 54%, respectively, on day one (Figure 5a,b). To validate the lipolytic effects of TAO, the lipid accumulation levels were estimated using ORO staining (Figure 5c). The number of stained granules in HepG2 cells decreased dose-dependently, and a significant TAO dose was found to be 1000 μg/mL (Figure 2b).

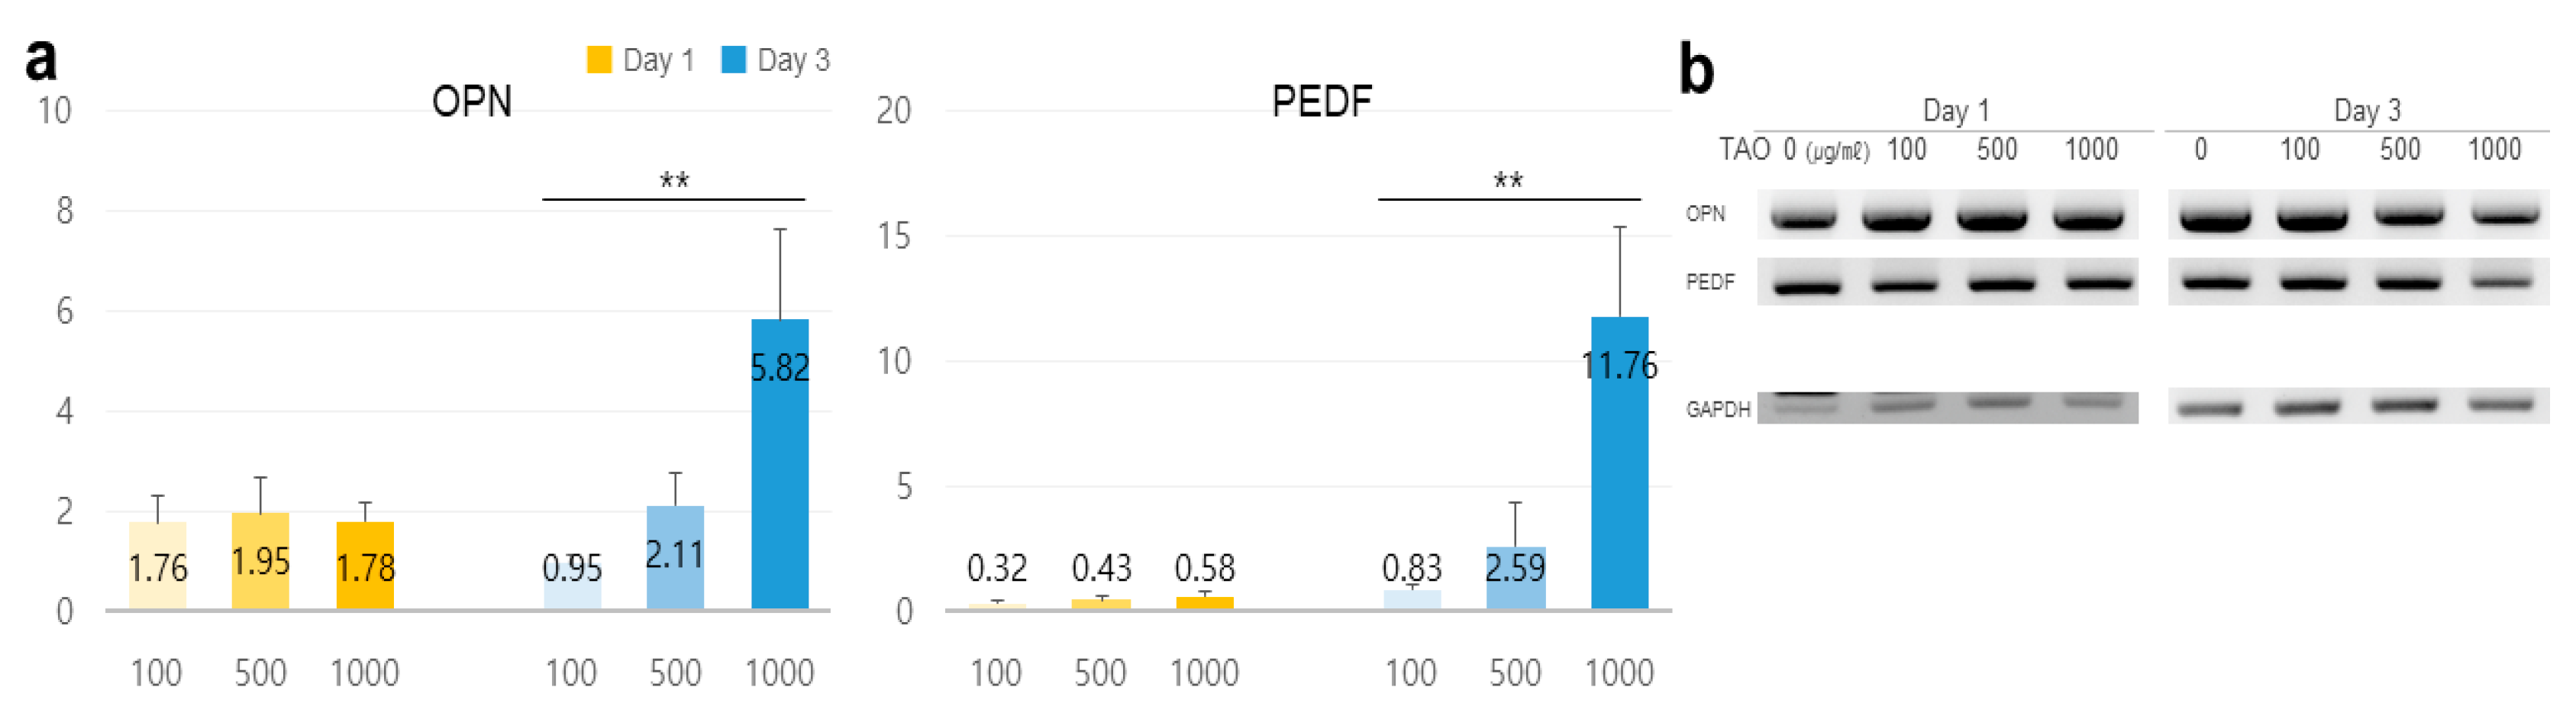
2.3. Potentiality for Reinforcement of the Microenvironment

On day one, the levels of osteopontin (OPN) increased by 1.32 times at 500 μg/mL, and on day three, the levels of pigment epithelium-derived factor (PEDF) increased by 2.88 times. It was observed that the levels were upregulated in a dose-dependent manner (Figure 6).

3. Discussion

There have been no studies, to our knowledge, investigating the effects of TAO on lipid metabolism. However, the present study demonstrated the bioactive effects of TAO in HepG2 cells. The bioactive effects of TAO are classified into three categories, including the activation of cellular respiration without cytotoxicity, the enhancement of lipolysis, and the reinforcement of the microenvironment in hepatocytes. First, TAO activated cellular respiration without cytotoxicity in HepG2 cells, even when a high concentration of TAO was used for treatment of cells. Although the cytotoxic activities of TAO have been reported, including antimicrobial and antifungal activities [20,21] and insecticidal effects [22], it showed no cytotoxicity in mouse lymphoma cells [26]. Moreover, the administration of 5000 mg/kg TAO to rabbits [27] and treatment of 3T3-L1 cells with 200 μM (29.64 μg/mL TAO) have been described previously. Despite these high concentrations (Figure 2), TAO decreased cellular senescence without cytotoxicity in the HepG2 cells. Based on these results, it is safe to say that TAO can be adequately applied to various industries, including functional foods, and medicine. As the activation of β-oxidation and inhibition of cellular senescence induces the activation of MMP, TAO enhanced the activity of MMP and inhibited cellular senescence in HepG2 cells. Activation of the mitochondrial respiratory system in hepatocytes protects against fatty liver disease by the degradation of fatty acids [28]. These results suggest that TAO is a useful compound for preventing fatty liver disease as well as maintaining cellular viability and activity.
Second, TAO strongly activated lipolysis and inhibited accumulation of TG in HepG2 cells. Lipolysis in cells is stimulated by extracellular signals, including catecholamines, glucocorticoids, and tumor necrosis factor-α [29]. Under the effect of these extracellular signals, activated AMPK in hepatocytes activates several metabolic pathways, including fatty acid oxidation, ketogenesis, inhibition of lipogenesis, and insulin secretion by pancreatic cells [30]. Notably, TAO at a concentration of 1000 μg/mL, upregulated the levels of AMPK, GLUT2 (Supplementary Data) and GLUT4 in HepG2 cells, on day one or three. Additionally, the activated AMPK inhibited SREBP1c (Supplementary Data) and ACC1 and lipogenic enzymes, and activated HSL and lipolytic protein in HepG2 cells. TAO has a role as the extracellular lipolytic signal, including thyroxine or glucocorticoids, for hepatocytes, and modulates lipolytic signals, including HSL, ACC1, ACS, CPT1 (Supplementary Data), CPT2, and ACAD, in numerous lipolytic markers. In the case of obesity, increased ROS in hepatocytes induces AP2 and macrophage-induced inflammation of hepatocytes with the help of inflammatory cytokines [31]. Based on these results, it can be concluded that TAO is very effective at suppressing NAFLD and is an important modulator for lipid metabolism in hepatocytes. Insulin resistance is an important risk factor for NAFLD, and the metabolism of carbohydrates and lipids is regulated by blood glucose levels and insulin. When there is high insulin resistance, insulin strongly suppresses HSL and activates lipogenesis in hepatocytes. Additionally, insulin resistance induces the reduction of GLUT4 protein in adipocytes, muscles, and hepatocytes [32]. Functions of GLUT4 include the modulation of glucose in several cell types [33], and muscle contraction and stretching [34]. Moreover, GLUT4 is a key protein for regulating glucose levels in the entire body and for the development of type 2 diabetes [35]. Additionally, approximately 80% of liver cirrhosis is induced by impaired glucose tolerance, and approximately 10% of these cases develop diabetes mellitus [35]. Upregulation of GLUT4 and GLUT2 (Supplementary Data) in HepG2 cells treated with TAO indicates that TAO activates the storage of imported glucose by increasing AMPK and ATP levels by lipolysis, besides regulating homeostasis to maintain blood sugar levels. Furthermore, based on the supplementary data, TAO activated up regulation of TG secretory genes, ApoB100 and ApoC3, and down regulation of TG intake genes, CD36 and FABP1. These results documented protective function of TAO for NAFLD in hepatocytes.
Third, OPN increased by 32% on day one, and PEDF increased strongly on day three. Although OPN was overexpressed in hepatocyte injury, inflammation, liver fibrosis, and steatosis [36], optimally secreted OPN has been found to promote the hepatic recruitment of macrophages and neutrophils [37]. PEDF has various functions, including the inhibition of endothelial cell migration, angiogenesis, immunomodulatory properties, and tumorigenesis [38]. In lipid metabolism, PEDF binds to adipose TG lipase to activate lipolysis in cells. In the presence of TAO, hepatocytes enhanced the secretion of OPN, and PEDF played a role as a reinforcing factor for microenvironments, including immunoactivity, anti-apoptosis, cellular proliferation, anti-angiogenesis, and cellular survival [39] in adjacent hepatocytes.
Consequently, TAO affects the suppression of cellular senescence, modulation of lipid metabolism, and the microenvironment in hepatocytes. First, TAO enhances the respiratory metabolism by activating the mitochondrial potential and suppressing senescence in HepG2 cells. Second, TAO modulates lipid metabolism by the activation of lipolytic markers and inhibition of lipogenic markers in HepG2 cells. Third, under the effect of TAO, HepG2 cells secrete OPN and PEDF to alter processes, such as immunoactivity, anti-apoptosis, cellular proliferation, anti-angiogenesis, and cellular survival. In summary, TAO is an excellent bioactive compound that can be added as a useful component in functional foods because it is effective at preventing fatty liver disease and cellular senescence and improving immunoactivity.

4. Materials and Methods

4.1. Cell Culture and Treatment

HepG2 cells (Korea Cell Line Bank, Seoul, Korea) were cultured in low glucose Dulbecco’s Modified Eagle’s Medium (Invitrogen, Carlsbad, CA, USA) with 10% fetal bovine serum (Sigma-Aldrich, St. Louis, MO, USA) and 100 U/mL penicillin (Invitrogen, Carlsbad, CA, USA) at 37 °C under 5% humidified CO2. Further, 100, 500, and 1000 μg/mL of TAO (Sigma-Aldrich, St. Louis, MO, USA), dissolved in DMSO, were prepared to treat the cultured HepG2 cells.

4.2. Cytotoxicity

To determine the optimal treatment doses of TAO, cell viability was assessed by the MTT assay, using the EZ-Cytox cell viability assay kit (DAEILL LAB Service Co., Seoul, Korea). Cells were cultured in 96-well microplates and treated with various concentrations (0, 100, 200, 300, 400, 500, 100, 1500, and 2000 μg/mL) of TAO for 3 days.

4.3. Oil Red O (ORO) Staining

Cultured cells exposed to various concentrations of TAO were fixed with 4% paraformaldehyde for 20 min and washed with phosphate-buffered saline. To detect neutral lipids and lipid droplets, cultured cells were stained with ORO (Sigma-Aldrich) prepared in isopropanol. Stained cells were observed under a fluorescence microscope (Eclipse Ts-2, Nikon, Shinagawa, Japan), and the intensity of ORO staining was analyzed with NIS-elements V5.11 (Nikon, Shinagawa, Japan).

4.4. Conventional Polymerase Chain Reaction (PCR) for Lipid Metabolism Markers

Cultured cells in conditioned media (containing 0, 100, 500, and 1000 μg/mL of TAO) were lysed immediately with a RibospinTM kit (GeneAll Biotech, Seoul, Korea) to extract total RNA. Quantification and quality assessment of RNA was undertaken with a NanoDrop2000 spectrophotometer (Thermo Fisher Scientific, Waltham, MA, USA). Isolated RNA was converted to cDNA using CycleScript RT Premix (dT20) (Bioneer, Dajeon, Korea), and cDNA was amplified using conventional PCR (PCR PreMix, Bioneer, Dajeon, Korea) under the following conditions: denaturation steps for 15 min at 95 °C, 40 amplification cycles (95 °C for 10 s, 59 °C for 15 s, 72 °C for 30 s) for annealing, a melting curve, and a final cooling step [40]. The sequences of the PCR primers used are provided in Table 1, and the products were analyzed using iBright (FL1000, Thermo Fisher Scientific, Waltham, MA, USA) and iBright Analysis software 3.1.3 (Thermo Fisher Scientific, Waltham, MA, USA).

4.5. Flow Cytometry

Fixated cells were treated with 0.02% tween 20 for 10 min and were stained with allophycocyanin-anti-HSL (Abcam, Cambridge, MA, USA) and fluorescein isothiocyanate-anti-perilipin-1 (Abcam, Cambridge, MA, USA). The stained cells were analyzed using a flow cytometer (BD FACScalibur) and FlowJo 10.7.0 (BD biosciences, San Diego, CA, USA) [41].

4.6. Mitochondrial Membrane Potential (MMP) and Cellular Senescence

Cells exposed to 0, 100, 500, and 1000 μg/mL of TAO were harvested immediately and their MMP and senescence were measured using a mitochondrial membrane potential assay kit (Abcam, Cambridge, MA, USA) and CellEvent™ senescence green flow cytometry Assay Kit (Thermo Fisher Scientific, Waltham, MA, USA), respectively. The treated cells were analyzed for their membrane potential using a flow cytometer (BD FACScalibur) and FlowJo 10.7.0 (BD bioscience, San Diego, CA, USA).

4.7. Statistical Analysis

Statistical analyses were conducted using SigmaPlot, version 12.5 software. All statistical analyses were performed using a t-test and one-way analysis of variance. A p-value < 0.05 was considered significant [40].

Supplementary Materials

The following are available online, Figure S1: Expression levels for modulating genes of lipid metabolism in HepG2 cells, Table S1: PCR primer sequences.

Author Contributions

Conceptualization and methodology, A.S. and Y.P.; writing—original draft preparation, A.S.; writing—review and editing, B.K.; supervision, B.K. and S.G.L. All authors have read and agreed to the published version of the manuscript.

Funding

This study was supported by LIFE TOGETHER.

Acknowledgments

This study was supported by LIFE TOGETHER and Korea University.

Conflicts of Interest

The authors declare no conflict of interest.

References

  1. Engin, A. Non-Alcoholic Fatty Liver Disease. Obes. Lipotoxicity 2017, 960, 443–467. [Google Scholar] [CrossRef]
  2. Ipsen, D.H.; Lykkesfeldt, J.; Tveden-Nyborg, P. Molecular mechanisms of hepatic lipid accumulation in non-alcoholic fatty liver disease. Cell. Mol. Life Sci. 2018, 75, 3313–3327. [Google Scholar] [CrossRef] [PubMed] [Green Version]
  3. Wu, K.-T.; Kuo, P.-L.; Meng-Hsuan, H.; Chen, Y.-Y.; Yeh, M.-L.; Huang, C.-I.; Yang, J.-F.; Lin, C.-I.; Hsieh, M.-H.; Hsieh, M.-Y.; et al. Nonalcoholic fatty liver disease severity is associated with the ratios of total cholesterol and triglycerides to high-density lipoprotein cholesterol. J. Clin. Lipidol. 2016, 10, 420–425.e1. [Google Scholar] [CrossRef] [PubMed]
  4. Takeuchi, K.; Reue, K. Biochemistry, physiology, and genetics of GPAT, AGPAT, and lipin enzymes in triglyceride synthesis. Am. J. Physiol. Metab. 2009, 296, E1195–E1209. [Google Scholar] [CrossRef] [PubMed] [Green Version]
  5. Yen, C.-L.E.; Stone, S.J.; Koliwad, S.; Harris, C.; Farese, R.V., Jr. Thematic Review Series: Glycerolipids.DGAT enzymes and triacylglycerol biosynthesis. J. Lipid Res. 2008, 49, 2283–2301. [Google Scholar] [CrossRef] [Green Version]
  6. Tong, L. Acetyl-coenzyme A carboxylase: Crucial metabolic enzyme and attractive target for drug discovery. Cell. Mol. Life Sci. 2005, 62, 1784–1803. [Google Scholar] [CrossRef]
  7. Kraemer, F.B.; Shen, W.-J. Hormone-sensitive lipase. J. Lipid Res. 2002, 43, 1585–1594. [Google Scholar] [CrossRef] [Green Version]
  8. Furuhashi, M.; Saitoh, S.; Shimamoto, K.; Miura, T. Fatty Acid-Binding Protein 4 (FABP4): Pathophysiological Insights and Potent Clinical Biomarker of Metabolic and Cardiovascular Diseases. Clin. Med. Insights Cardiol. 2014, 8, CMC.S17067-33. [Google Scholar] [CrossRef]
  9. Garcia, D.; Shaw, R.J. AMPK: Mechanisms of Cellular Energy Sensing and Restoration of Metabolic Balance. Mol. Cell 2017, 66, 789–800. [Google Scholar] [CrossRef] [Green Version]
  10. Sztalryd, C.; Xu, G.; Dorward, H.; Tansey, J.T.; Contreras, J.A.; Kimmel, A.R.; Londos, C. Perilipin A is essential for the translocation of hormone-sensitive lipase during lipolytic activation. J. Cell Biol. 2003, 161, 1093–1103. [Google Scholar] [CrossRef]
  11. Moczulski, D.; Majak, I.; Mamczur, D. An overview of beta-oxidation disorders. Postępy Higieny i Medycyny Doświadczalnej 2009, 63, 266–277. [Google Scholar] [PubMed]
  12. Nakamura, M.T.; Yudell, B.E.; Loor, J.J. Regulation of energy metabolism by long-chain fatty acids. Prog. Lipid Res. 2014, 53, 124–144. [Google Scholar] [CrossRef] [PubMed]
  13. Rui, L. Energy Metabolism in the Liver. Compr. Physiol. 2014, 4, 177–197. [Google Scholar] [CrossRef] [PubMed] [Green Version]
  14. Hillgartner, F.; Charron, T.; Chesnut, K.A. Triiodothyronine Stimulates and Glucagon Inhibits Transcription of the Acetyl-CoA Carboxylase Gene in Chick Embryo Hepatocytes: Glucose and Insulin Amplify the Effect of Triiodothyronine. Arch. Biochem. Biophys. 1997, 337, 159–168. [Google Scholar] [CrossRef] [PubMed]
  15. Elgendy, E.; Khayyat, S. Oxidation reactions of some natural volatile aromatic compounds: Anethole and eugenol. Russ. J. Org. Chem. 2008, 44, 823–829. [Google Scholar] [CrossRef]
  16. Bilke, S.; Mosandl, A. 2H/1H and13C/12C Isotope Ratios oftrans-Anethole Using Gas Chromatography−Isotope Ratio Mass Spectrometry. J. Agric. Food Chem. 2002, 50, 3935–3937. [Google Scholar] [CrossRef]
  17. Muckensturm, B.; Foechterlen, D.; Reduron, J.-P.; Danton, P.; Hildenbrand, M. Phytochemical and chemotaxonomic studies of Foeniculum vulgare. Biochem. Syst. Ecol. 1997, 25, 353–358. [Google Scholar] [CrossRef]
  18. Shin, Y.J.; Jung, M.J.; Kim, N.S.; Kim, K.; Lee, D.S. Characterization of Fennel Flavors by Solid Phase Trapping-Solvent Extraction and Gas Chromatography-Mass Spectrometry. Bull. Korean Chem. Soc. 2007, 28, 2389–2395. [Google Scholar] [CrossRef] [Green Version]
  19. Pejin, B.; Bianco, A.; Newmaster, S.; Sabovljevic, M.; Vujisic, L.; Tesevic, V.; Vajs, V.; De Rosa, S. Fatty acids of Rhodobryum ontariense (Bryaceae). Nat. Prod. Res. 2011, 26, 696–702. [Google Scholar] [CrossRef]
  20. De, M.; De, A.K.; Sen, P.; Banerjee, A.B. Antimicrobial properties of star anise (Illicium verum Hook f). Phytother. Res. 2002, 16, 94–95. [Google Scholar] [CrossRef]
  21. Fujita, K.-I.; Fujita, T.; Kubo, I. Anethole, a potential antimicrobial synergist, converts a fungistatic dodecanol to a fungicidal agent. Phytother. Res. 2006, 21, 47–51. [Google Scholar] [CrossRef]
  22. Knio, K.; Usta, J.; Dagher, S.; Zournajian, H.; Kreydiyyeh, S. Larvicidal activity of essential oils extracted from commonly used herbs in Lebanon against the seaside mosquito, Ochlerotatus caspius. Bioresour. Technol. 2008, 99, 763–768. [Google Scholar] [CrossRef] [PubMed]
  23. Sheikh, B.A.; Pari, L.; Rathinam, A.; Chandramohan, R. Trans-anethole, a terpenoid ameliorates hyperglycemia by regulating key enzymes of carbohydrate metabolism in streptozotocin induced diabetic rats. Biochimie 2015, 112, 57–65. [Google Scholar] [CrossRef]
  24. Kang, N.H.; Mukherjee, S.; Min, T.; Kang, S.C.; Yun, J.W. Trans-anethole ameliorates obesity via induction of browning in white adipocytes and activation of brown adipocytes. Biochimie 2018, 151, 1–13. [Google Scholar] [CrossRef]
  25. Dawidar, A.; Mogib, M.A.; El-Ghorab, A.; Mahfouz, M.; Elsaid, F.; Hussien, K. Chemical Composition and Effect of Photo-Oxygenation on Biological Activities of Egyptian Commercial Anise and Fennel Essential Oils. J. Essent. Oil Bear. Plants 2008, 11, 124–136. [Google Scholar] [CrossRef]
  26. Gorelick, N. Genotoxicity of trans-anethole in vitro. Mutat. Res. Mol. Mech. Mutagen. 1995, 326, 199–209. [Google Scholar] [CrossRef]
  27. Europe Co. Active Ingredients Used in Cosmetics: Safety Survey; Committee of Experts on Cosmetic Products; Council of Europe: Strasbourg, France, 2008. [Google Scholar]
  28. Barbier-Torres, L.; Fortner, K.A.; Iruzubieta, P.; Delgado, T.C.; Giddings, E.; Chen, Y.; Champagne, D.; Fernández-Ramos, D.; Mestre, D.; Gomez-Santos, B.; et al. Silencing hepatic MCJ attenuates non-alcoholic fatty liver disease (NAFLD) by increasing mitochondrial fatty acid oxidation. Nat. Commun. 2020, 11. [Google Scholar] [CrossRef]
  29. Deng, J.; Liu, S.; Zou, L.; Xu, C.; Geng, B.; Xu, G. Lipolysis Response to Endoplasmic Reticulum Stress in Adipose Cells. J. Biol. Chem. 2012, 287, 6240–6249. [Google Scholar] [CrossRef] [Green Version]
  30. Winder, W.W.; Hardie, D.G. AMP-activated protein kinase, a metabolic master switch: Possible roles in Type 2 diabetes. Am. J. Physiol. Metab. 1999, 277, E1–E10. [Google Scholar] [CrossRef]
  31. Lakhani, H.V.; Sharma, D.; Dodrill, M.W.; Nawab, A.; Sharma, N.; Cottrill, C.L.; Shapiro, J.I.; Sodhi, K. Phenotypic Alteration of Hepatocytes in Non-Alcoholic Fatty Liver Disease. Int. J. Med Sci. 2018, 15, 1591–1599. [Google Scholar] [CrossRef] [PubMed] [Green Version]
  32. Minokoshi, Y.; Kahn, C.R.; Kahn, B.B. Tissue-specific Ablation of the GLUT4 Glucose Transporter or the Insulin Receptor Challenges Assumptions about Insulin Action and Glucose Homeostasis. J. Biol. Chem. 2003, 278, 33609–33612. [Google Scholar] [CrossRef] [PubMed] [Green Version]
  33. Karim, S.; Liaskou, E.; Fear, J.; Garg, A.; Reynolds, G.; Claridge, L.; Adams, D.H.; Newsome, P.N.; Lalor, P.F. Dysregulated hepatic expression of glucose transporters in chronic disease: Contribution of semicarbazide-sensitive amine oxidase to hepatic glucose uptake. Am. J. Physiol. Liver Physiol. 2014, 307, G1180-90. [Google Scholar] [CrossRef] [PubMed] [Green Version]
  34. Lund, S.; Holman, G.D.; Schmitz, O.; Pedersen, O. Contraction stimulates translocation of glucose transporter GLUT4 in skeletal muscle through a mechanism distinct from that of insulin. Proc. Natl. Acad. Sci. USA 1995, 92, 5817–5821. [Google Scholar] [CrossRef] [PubMed] [Green Version]
  35. Shan, W.-F.; Chen, B.-Q.; Zhu, S.-J.; Jiang, L.; Zhou, Y.-F. Effects of GLUT4 expression on insulin resistance in patients with advanced liver cirrhosis. J. Zhejiang Univ. Sci. B 2011, 12, 677–682. [Google Scholar] [CrossRef]
  36. Nuñez-Garcia, M.; Gomez-Santos, B.; Buqué, X.; García-Rodríguez, J.L.; Romero, M.R.; Marin, J.J.; Arteta, B.; García-Monzón, C.; Castaño, L.; Syn, W.-K.; et al. Osteopontin regulates the cross-talk between phosphatidylcholine and cholesterol metabolism in mouse liver. J. Lipid Res. 2017, 58, 1903–1915. [Google Scholar] [CrossRef] [Green Version]
  37. Wen, Y.; Feng, D.; Wu, H.; Liu, W.; Li, H.; Wang, F.; Xia, Q.; Gao, W.-Q.; Kong, X. Defective Initiation of Liver Regeneration in Osteopontin-Deficient Mice after Partial Hepatectomy due to Insufficient Activation of IL-6/Stat3 Pathway. Int. J. Biol. Sci. 2015, 11, 1236–1247. [Google Scholar] [CrossRef] [Green Version]
  38. Rychli, K.; Huber, K.; Wojta, J. Pigment epithelium-derived factor (PEDF) as a therapeutic target in cardiovascular disease. Expert Opin. Ther. Targets 2009, 13, 1295–1302. [Google Scholar] [CrossRef]
  39. Ma, S.; Wang, S.; Li, M.; Zhang, Y.; Zhu, P. The effects of pigment epithelium-derived factor on atherosclerosis: Putative mechanisms of the process. Lipids Heal. Dis. 2018, 17, 240. [Google Scholar] [CrossRef] [Green Version]
  40. Song, A.; Kim, B.; Kim, E.; Sung, J.H.; Park, Y.; Park, S.; Park, T.; Kim, J.K.; Jeong, Y.; Lee, S.G. Protective Functions of Group 3 Late Embryogenesis Abundant (G3LEA) Proteins in Enterococcus faecium During Vancomycin Treatment. Indian J. Microbiol. 2020, 60, 1–9. [Google Scholar] [CrossRef]
  41. Park, Y.; Lee, K.; Lee, C.; Song, A.; Kim, J.; Kim, B.; Lee, S.G. Protection and immune modulation of activated human vaginal epithelial cells by Aurea helianthus extract. Sci. Rep. 2020, 10, 1–10. [Google Scholar] [CrossRef]
Figure 1. Signal pathways of lipid metabolism in hepatocytes under the effect of trans-anethole. The green boxes indicate activated signal molecules and the red boxes indicate inhibited signal molecules by TAO in HepG2 cells. TG: triglyceride, FFA: free fatty acid, AMPK: AMP-activated protein kinase, HSL: hormone sensitive lipase, LPL: lipoprotein lipase, PLIN1: Perilipin-1, GPAT: glycerol-3-phosphate acyltransferase, ACS: acyl-CoA synthetase, ACC1: acetyl-coA carboxylase 1, CPT1: carnitine palmitoyltransferase-1, CPT2: carnitine palmitoyltransferase-2, ACAD: acyl-CoA dehydrogenase, GLUT 2, 4: glucose transporter type 2, 4, ApoB100: Apolipoprotein B100, ApoC3: Apolipoprotein C3.
Molecules 25 04946 g001
Figure 2. Non-cytotoxicity and catabolic activation of trans-anethole in hepatocytes. (a) The curve shows cellular viability in HepG2 cells under the effect of trans-anetholes. (b) The histogram and bar graphs show counts of senescent cells under the effect of trans-anetholes using a flow cytometer. (c) The histogram and bar graphs show counts for MMP activated cells under the effect of trans-anetholes using a flow cytometer. GM: geometric mean, *** p < 0.001.
Molecules 25 04946 g002
Figure 3. Expression of lipid metabolic markers in hepatocytes under the effect of trans-anethole. (a) The bar graphs show the relative fold-changes for the expression of lipolysis markers. (b) The bar graph shows the relative fold-changes for the expression of the β-oxidation markers (yellow: day 1, blue: day 3, * p < 0.05, ** p < 0.01.). (c) The gel images indicate the expression of the lipid metabolic markers.
Molecules 25 04946 g003
Figure 4. The expression of lipolytic markers in hepatocytes under the effect of trans-anethole. (a) The bar graphs show the relative fold-changes for the expression of lipolytic markers. (b) The gel images indicate the expression of the lipolytic markers. (c,d) The histograms and bar graphs show counts of perilipin-1 (PLIN1) and hormone-sensitive lipase (HSL) positive cells using flow cytometry. GM: geometric mean, * p < 0.05, ** p < 0.01, *** p < 0.001.
Molecules 25 04946 g004
Figure 5. Expression of lipogenic markers and measurements of stained lipids in hepatocytes under the effect of trans-anethole. (a) The bar graphs show the relative fold-changes for the expression of lipogenic markers. (b) The gel images indicate the expression of the lipogenic markers. (c). The images show the Oil Red O-stained cells and the bar graphs show relative fold-changes for intensity in stained cells * p < 0.05, ** p < 0.01.
Molecules 25 04946 g005
Figure 6. Estimation of potentiality for reinforcement of the microenvironment in hepatocytes under the effect of trans-anethole. (a) The bar graphs show the relative fold-changes for the expression of the reinforcers in HepG2 cells under trans-anetholes (** p < 0.01.). (b) The gel images indicate the expression of the secretory reinforcers.
Molecules 25 04946 g006
Table 1. PCR primer sequences.
PrimerFunctionF/RSeq (5′ → 3′)Product Size
AMPKLipid oxidationFCGCCTTGATTCTTTTGAGGCTT190
RAGGATCAGACTACACCTGGCT
GLUT4Glucose uptakeFTCTCCAACTGGACGAGCAAC269
RAGTTATGCCACTGGTGCGTT
ACSLipid oxidationFCCTGGGATCTCTCTCATGGC289
RCCCCAACAACTTGCAGTGAT
CPT2Lipid oxidationFGACTCGGCAGTGTTCTGTCT674
RGTCAGCTGGCCATGGTACTTG
ACADSLipid oxidationFTTCATCAAGGAGCCGGCAAT306
RAGGGTAAAGGCACATGGCTC
HSLTriglyceride lipolysis enzymeFAGCTGAGACACTTAGCCCCT383
RCACTCCGGAGCTCTTTTTCC
AP2LipolysisFTGGTGGTGGTGAGTATCTTCT574
RGGTCAACGTCCCTTGGCTTA
LPLTriglyceride lipolysis enzymeFGGCAGCTTCATGCATTCCTC326
RCAGCCAGAACGGCAACTACT
ACC1Lipid synthesisFGCACATCTTCACACTCCTGAA110
RGTACCACTCACCTGCCGTAT
GPATTriglyceride synthesisFTGGGTGAAGAATTCTGGTGGA292
RCATGAGGGGTGCAGGTGTAG
OPNChanging micro-environmentFGAATCTCCTAGCCCCACAGACC379
RGTGTGAGGTGATGTCCTCGTC
PEDFChanging micro-environmentFGCTGAGTTACGAAGGCGAAGT102
RGCTGAGTTACGAAGGCGAAGT
GAPDHHousekeepingFGTGGTCTCCTCTGACTTCAACA210
RCTCTTCCTCTTGTGCTCTTGCT
Sample Availability: Samples of the compound is not available from the authors.
Publisher’s Note: MDPI stays neutral with regard to jurisdictional claims in published maps and institutional affiliations.

