
Computational Studies towards the Identification of Novel Rhodopsin-Binding Compounds as Chemical Chaperones for Misfolded Opsins

 , ,
, ,  , and
, and
Abstract
1. Introduction
2. Results and Discussion
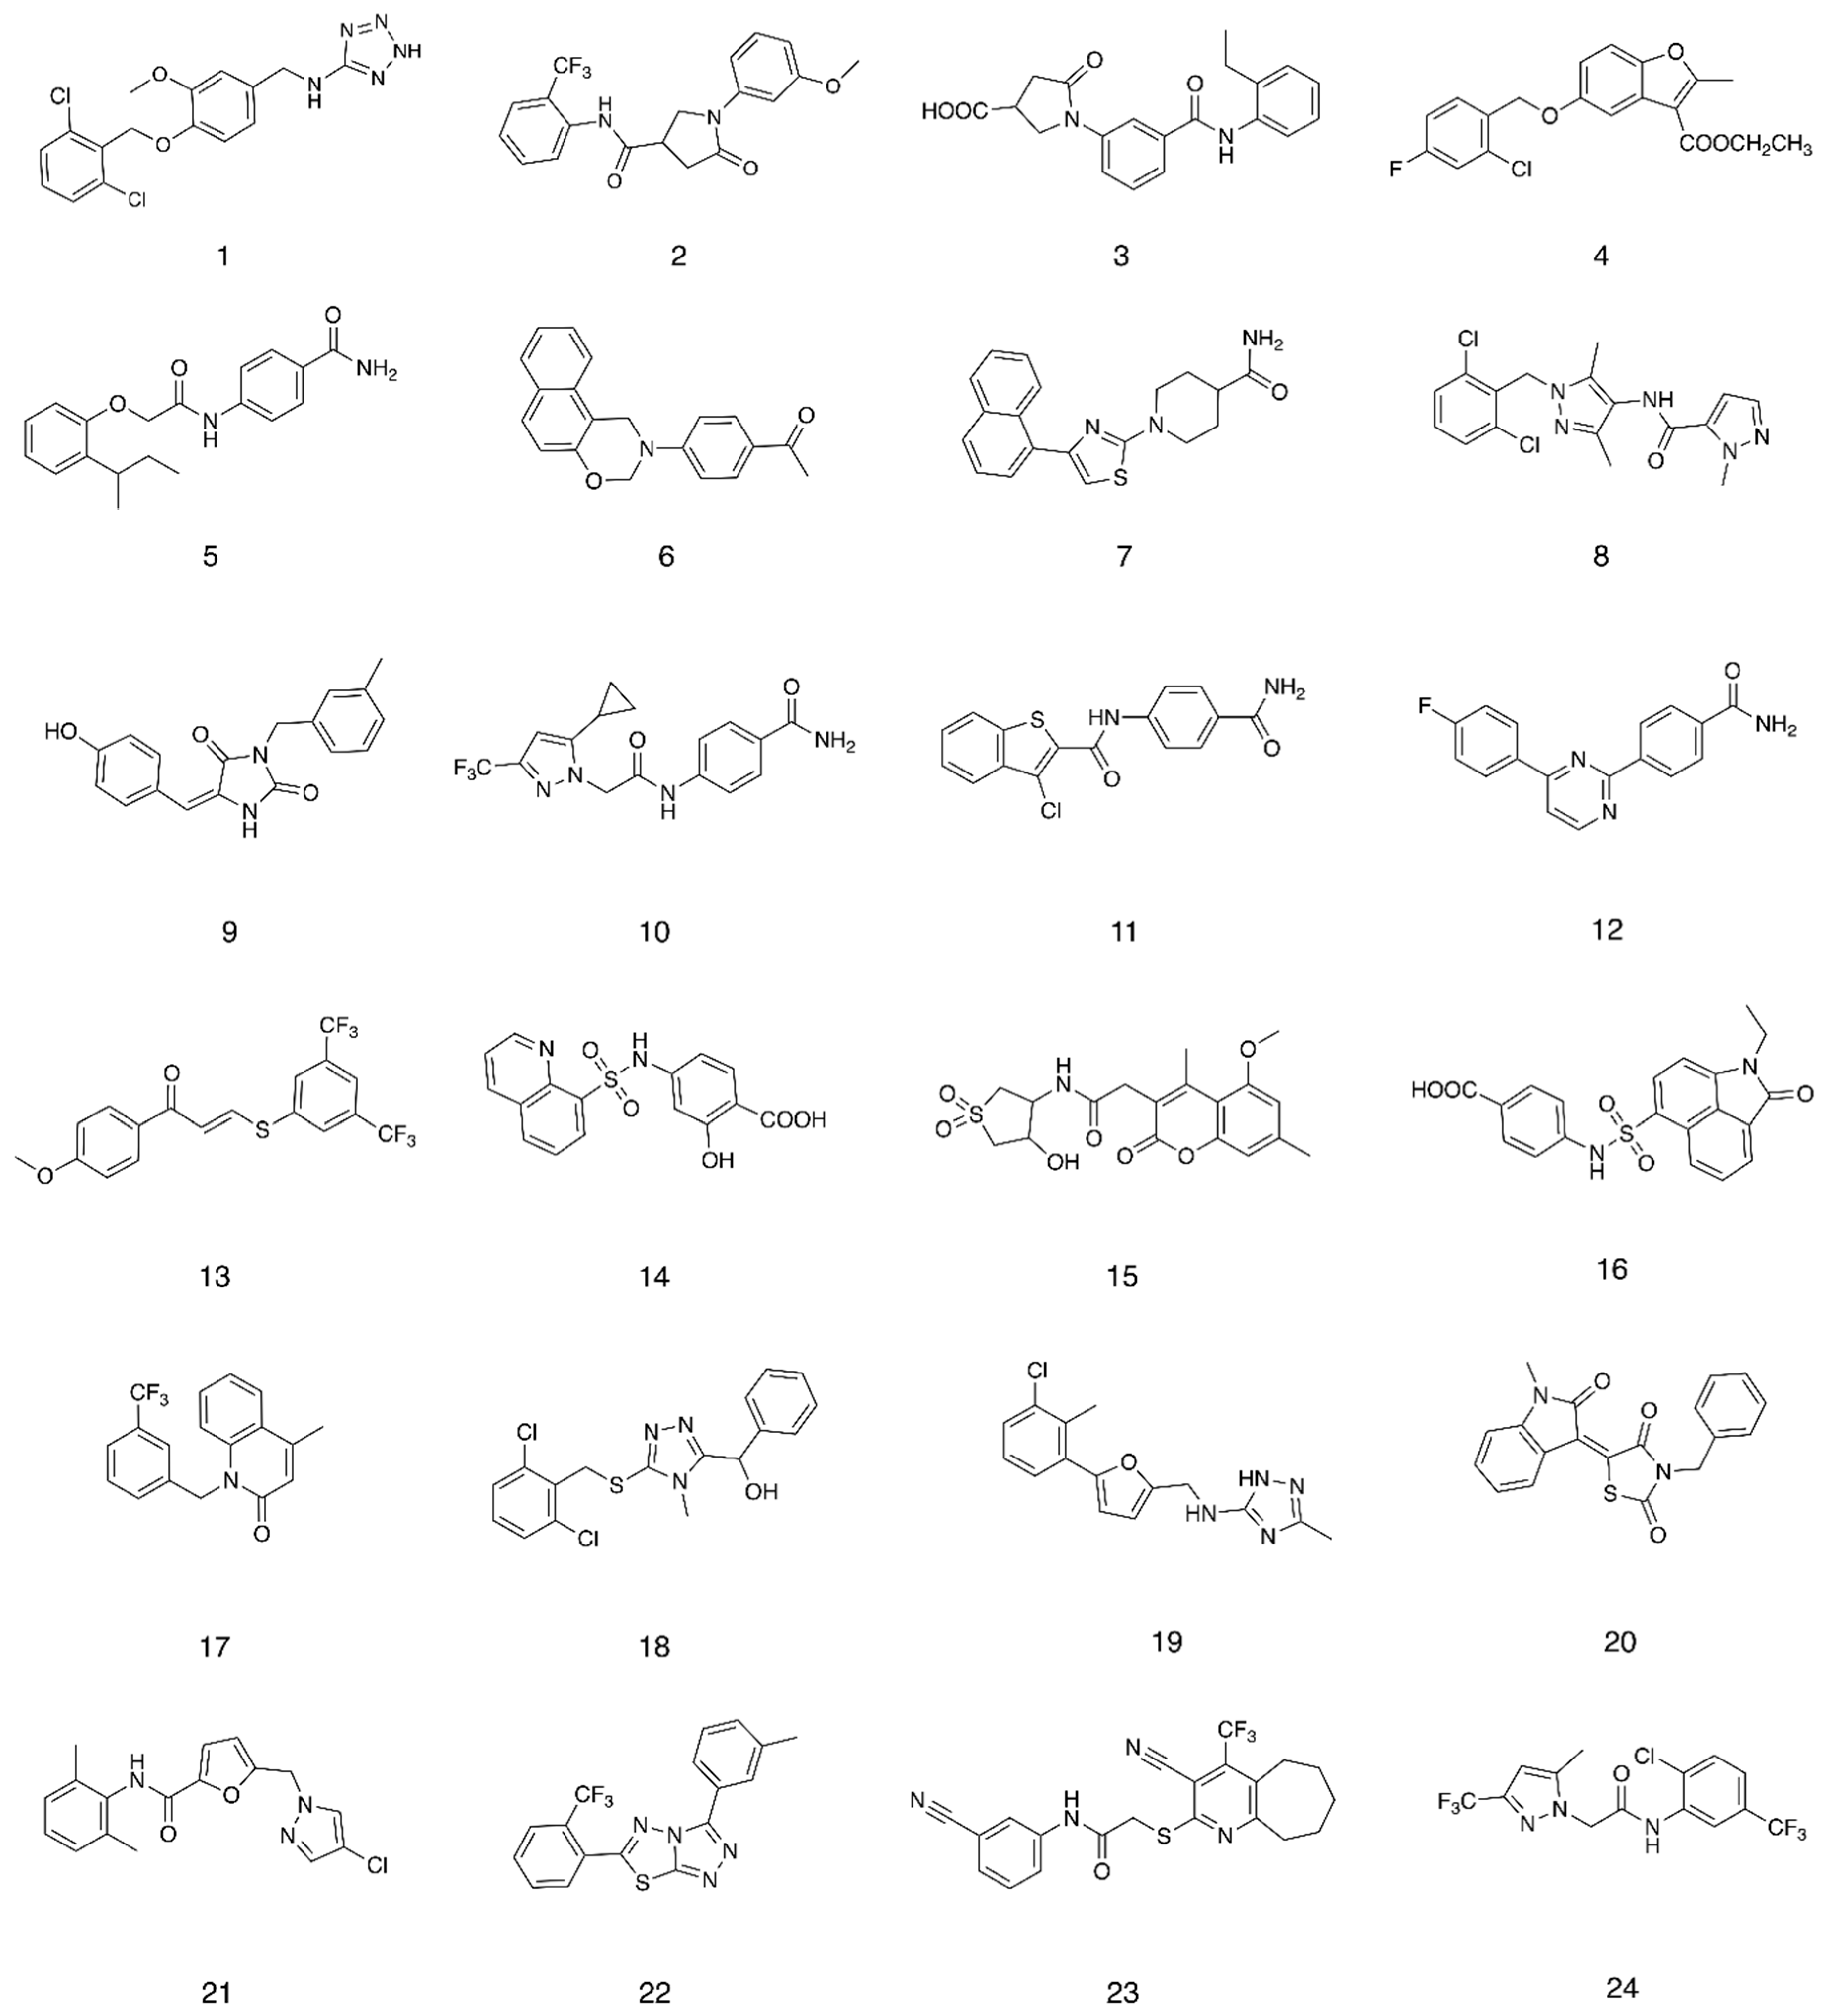
2.1. Structure-Based Virtual Screening
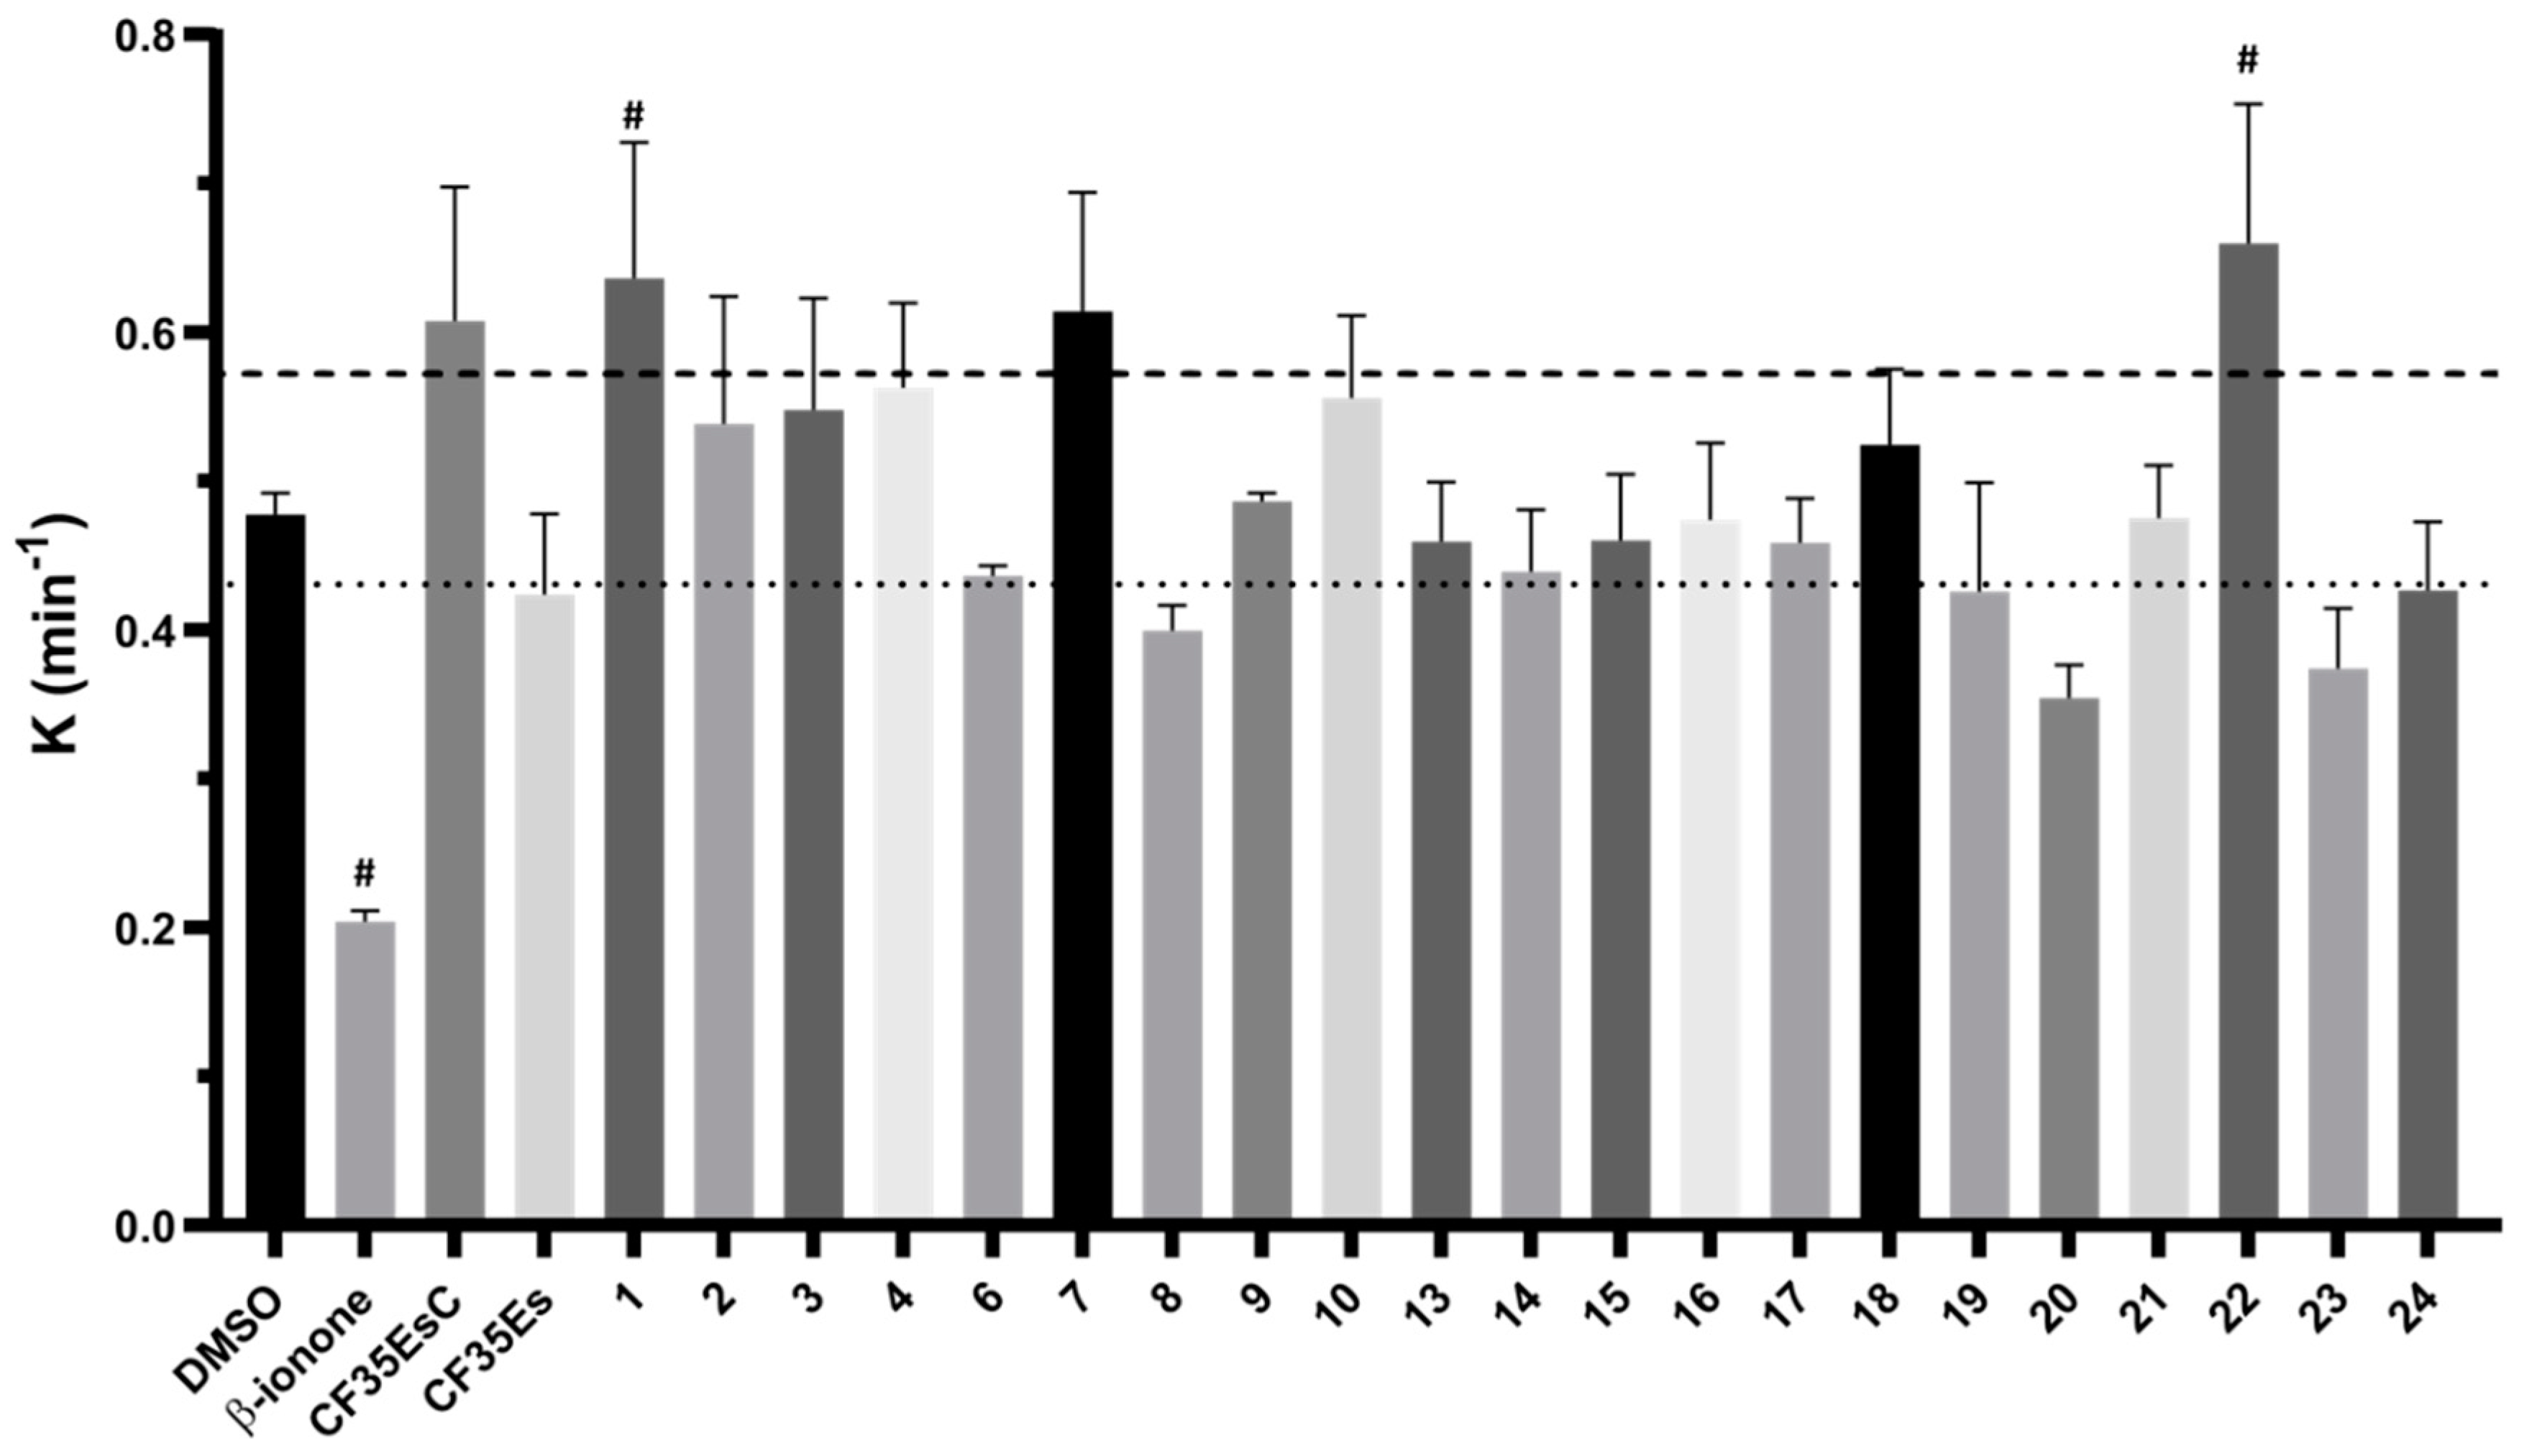
2.2. Competitive Binding Assay
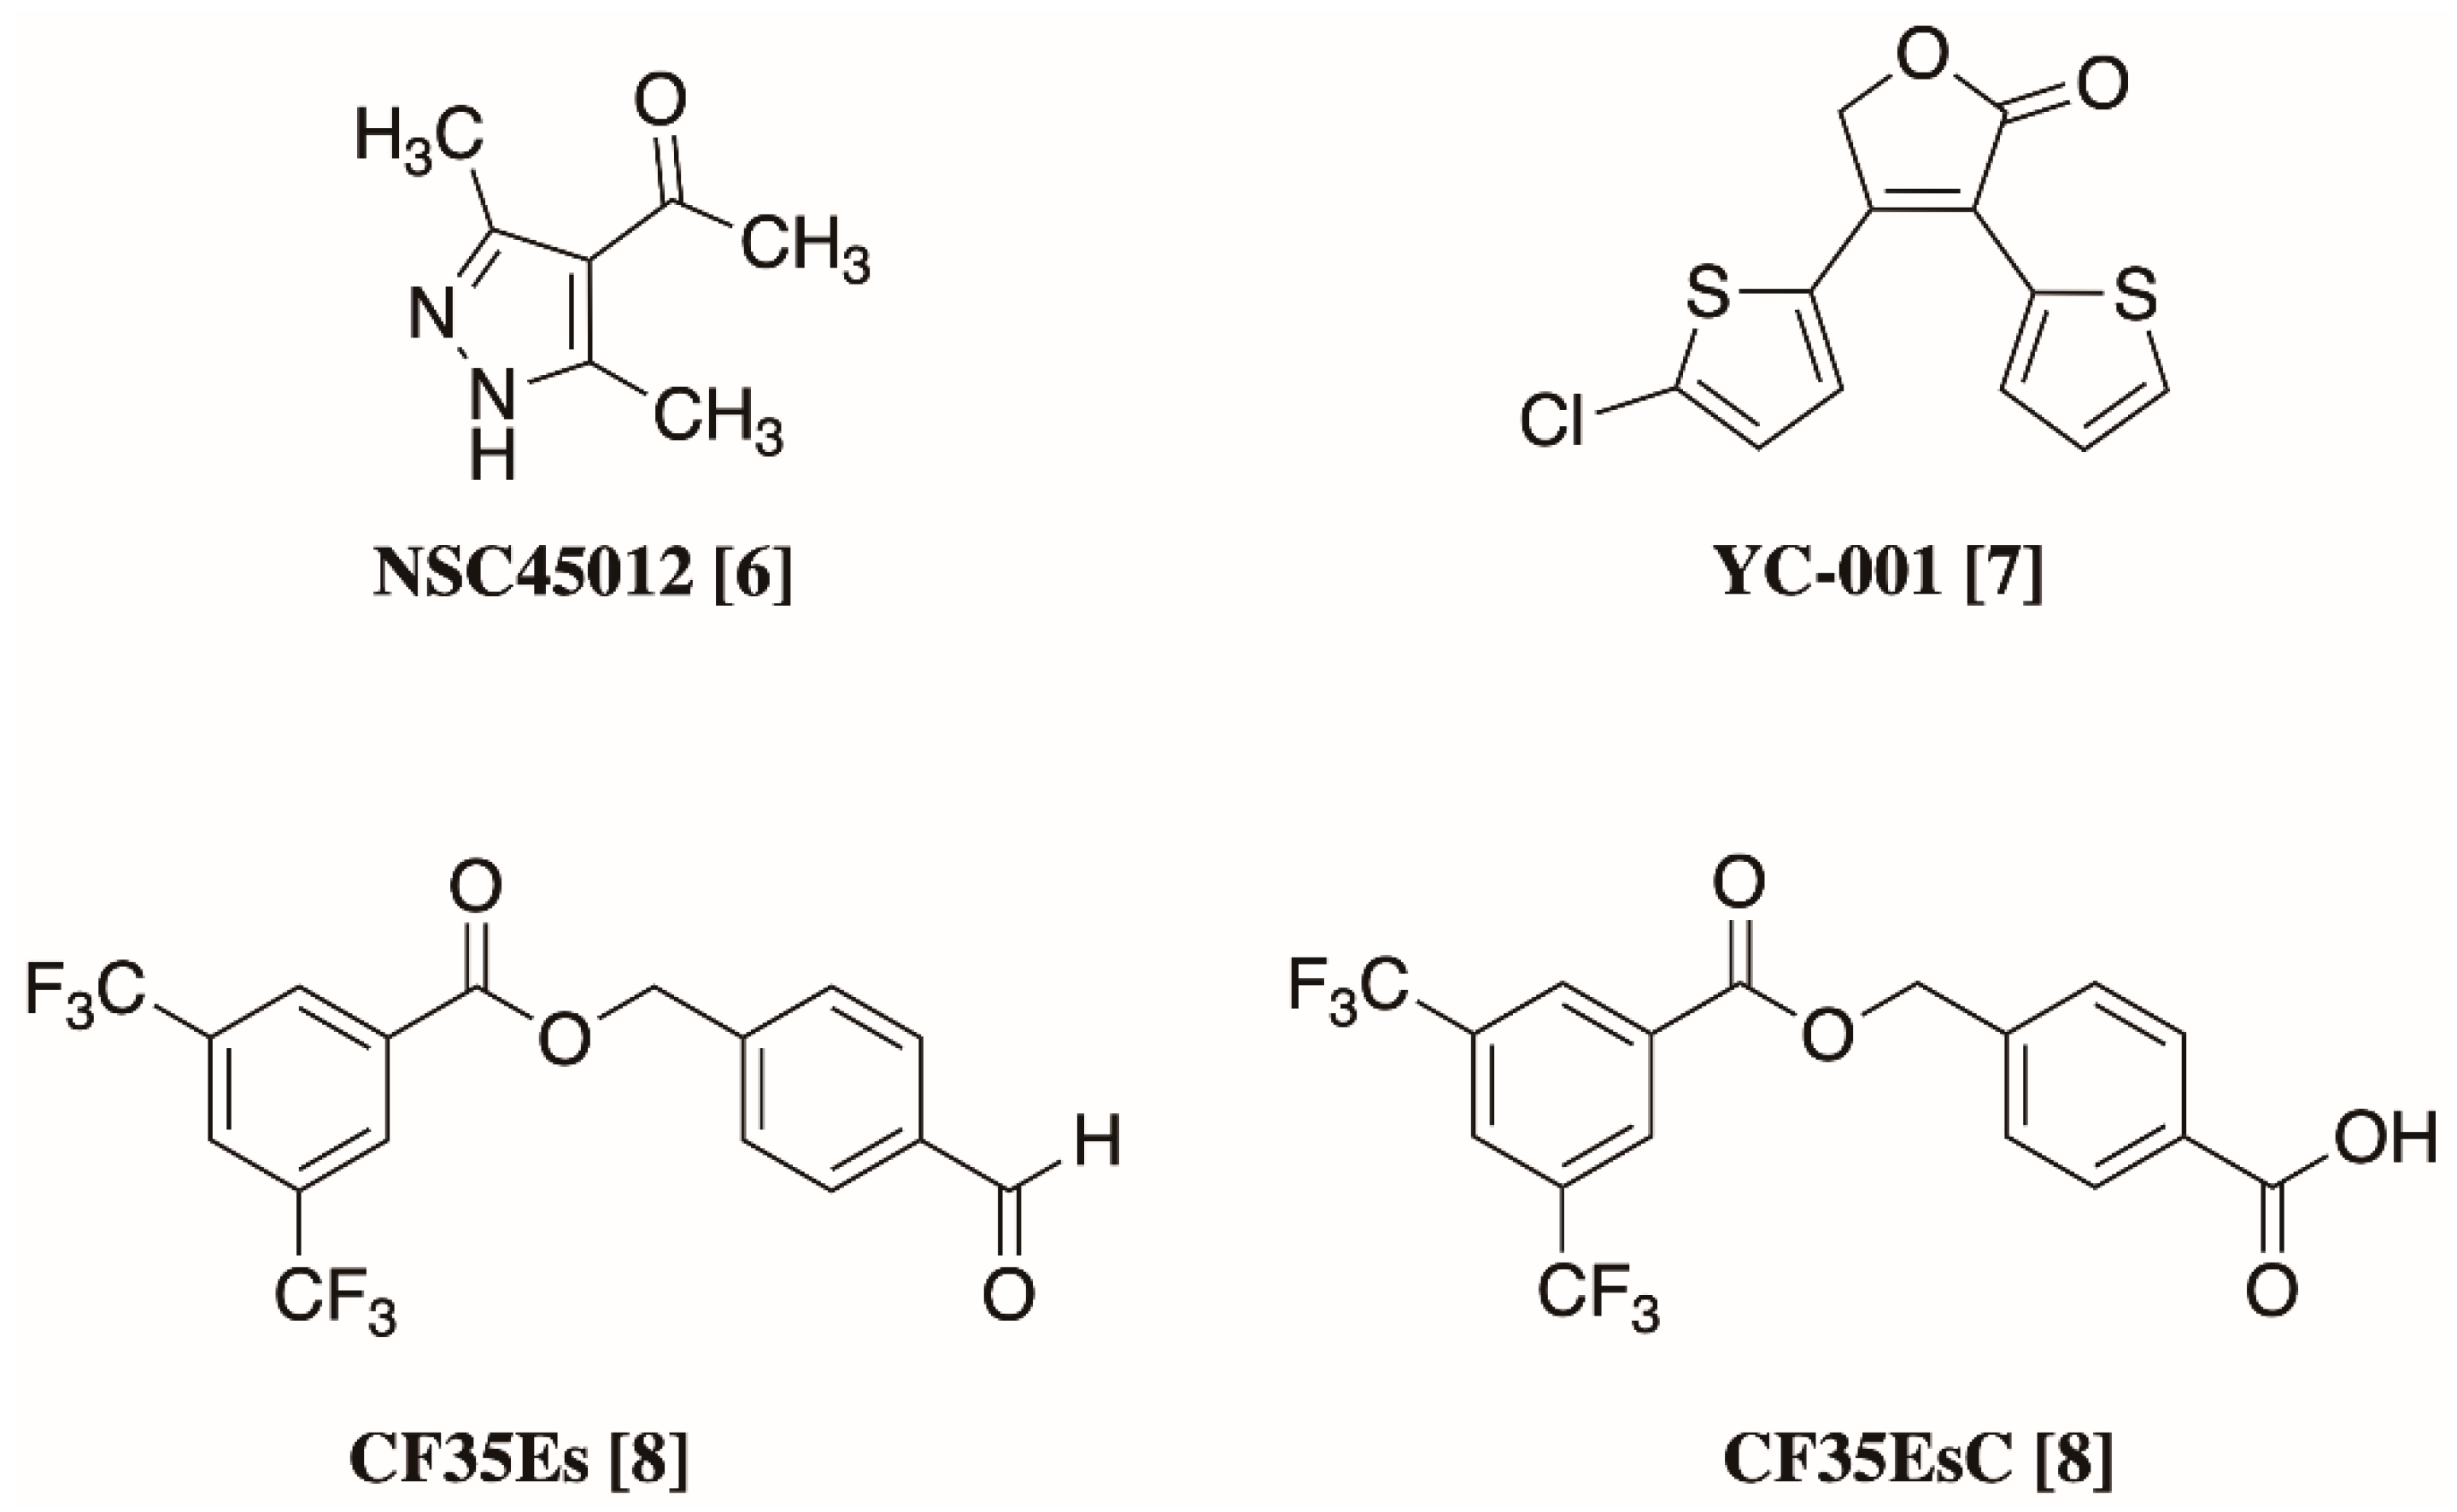
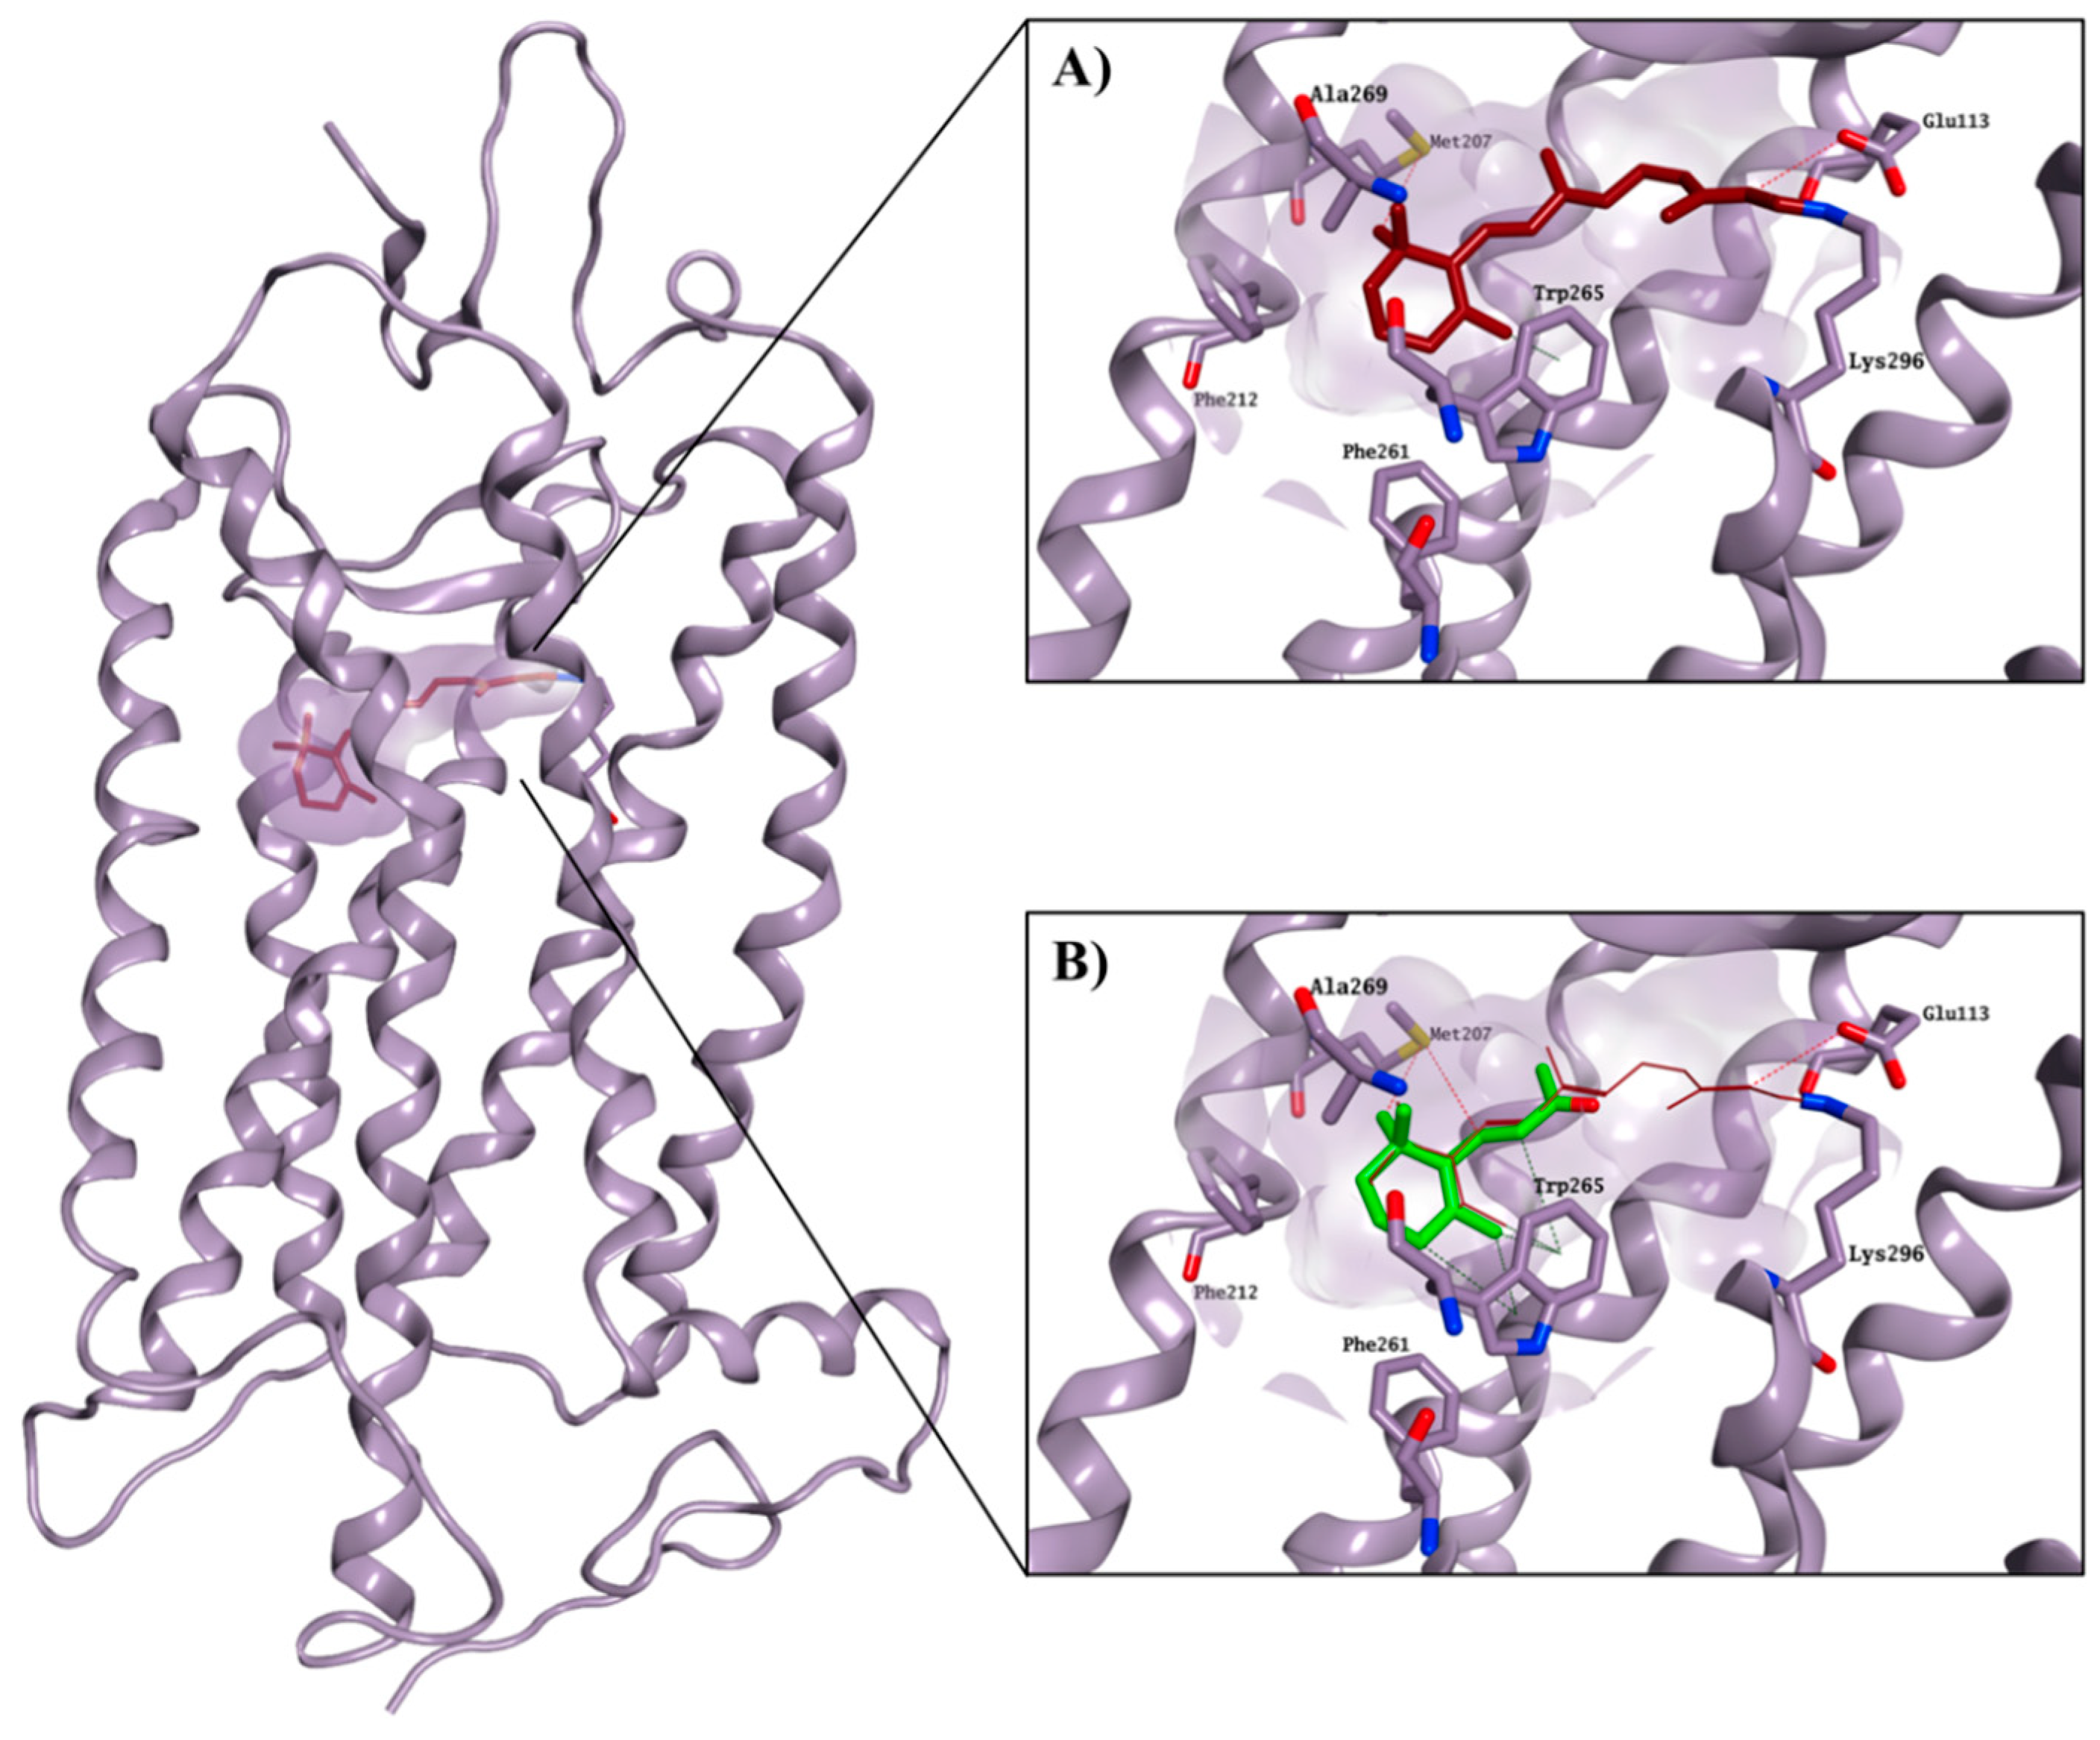
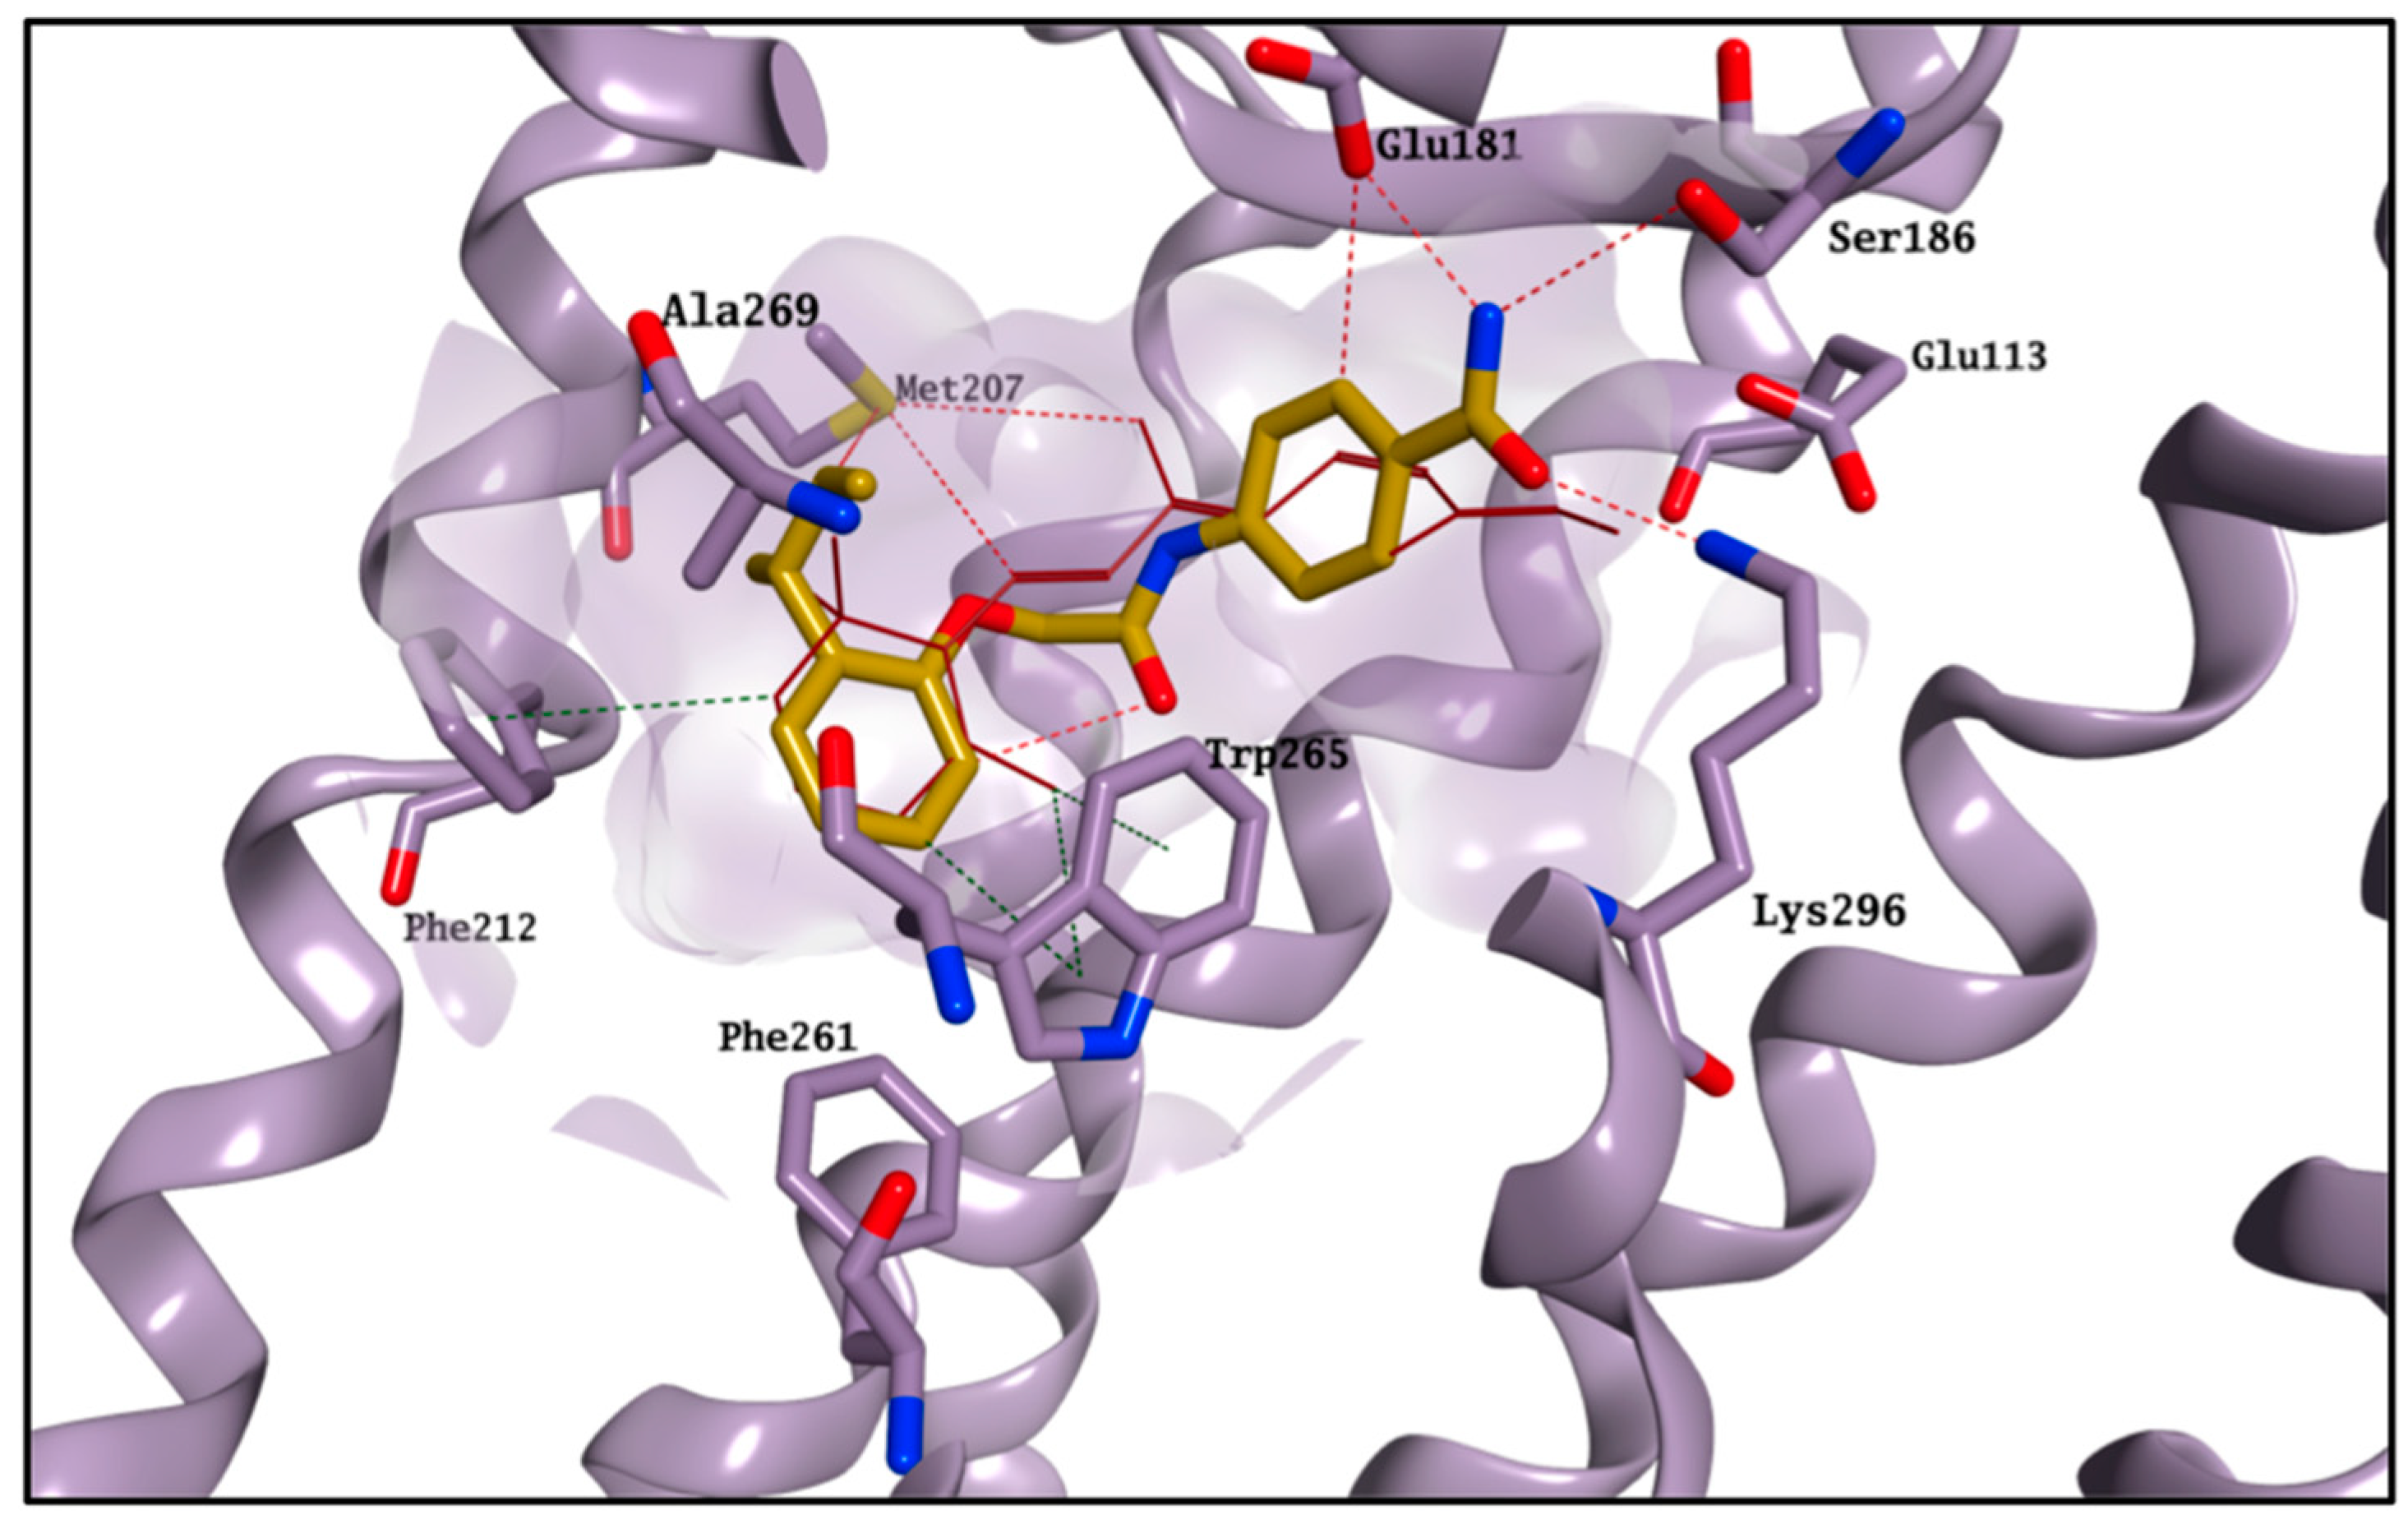
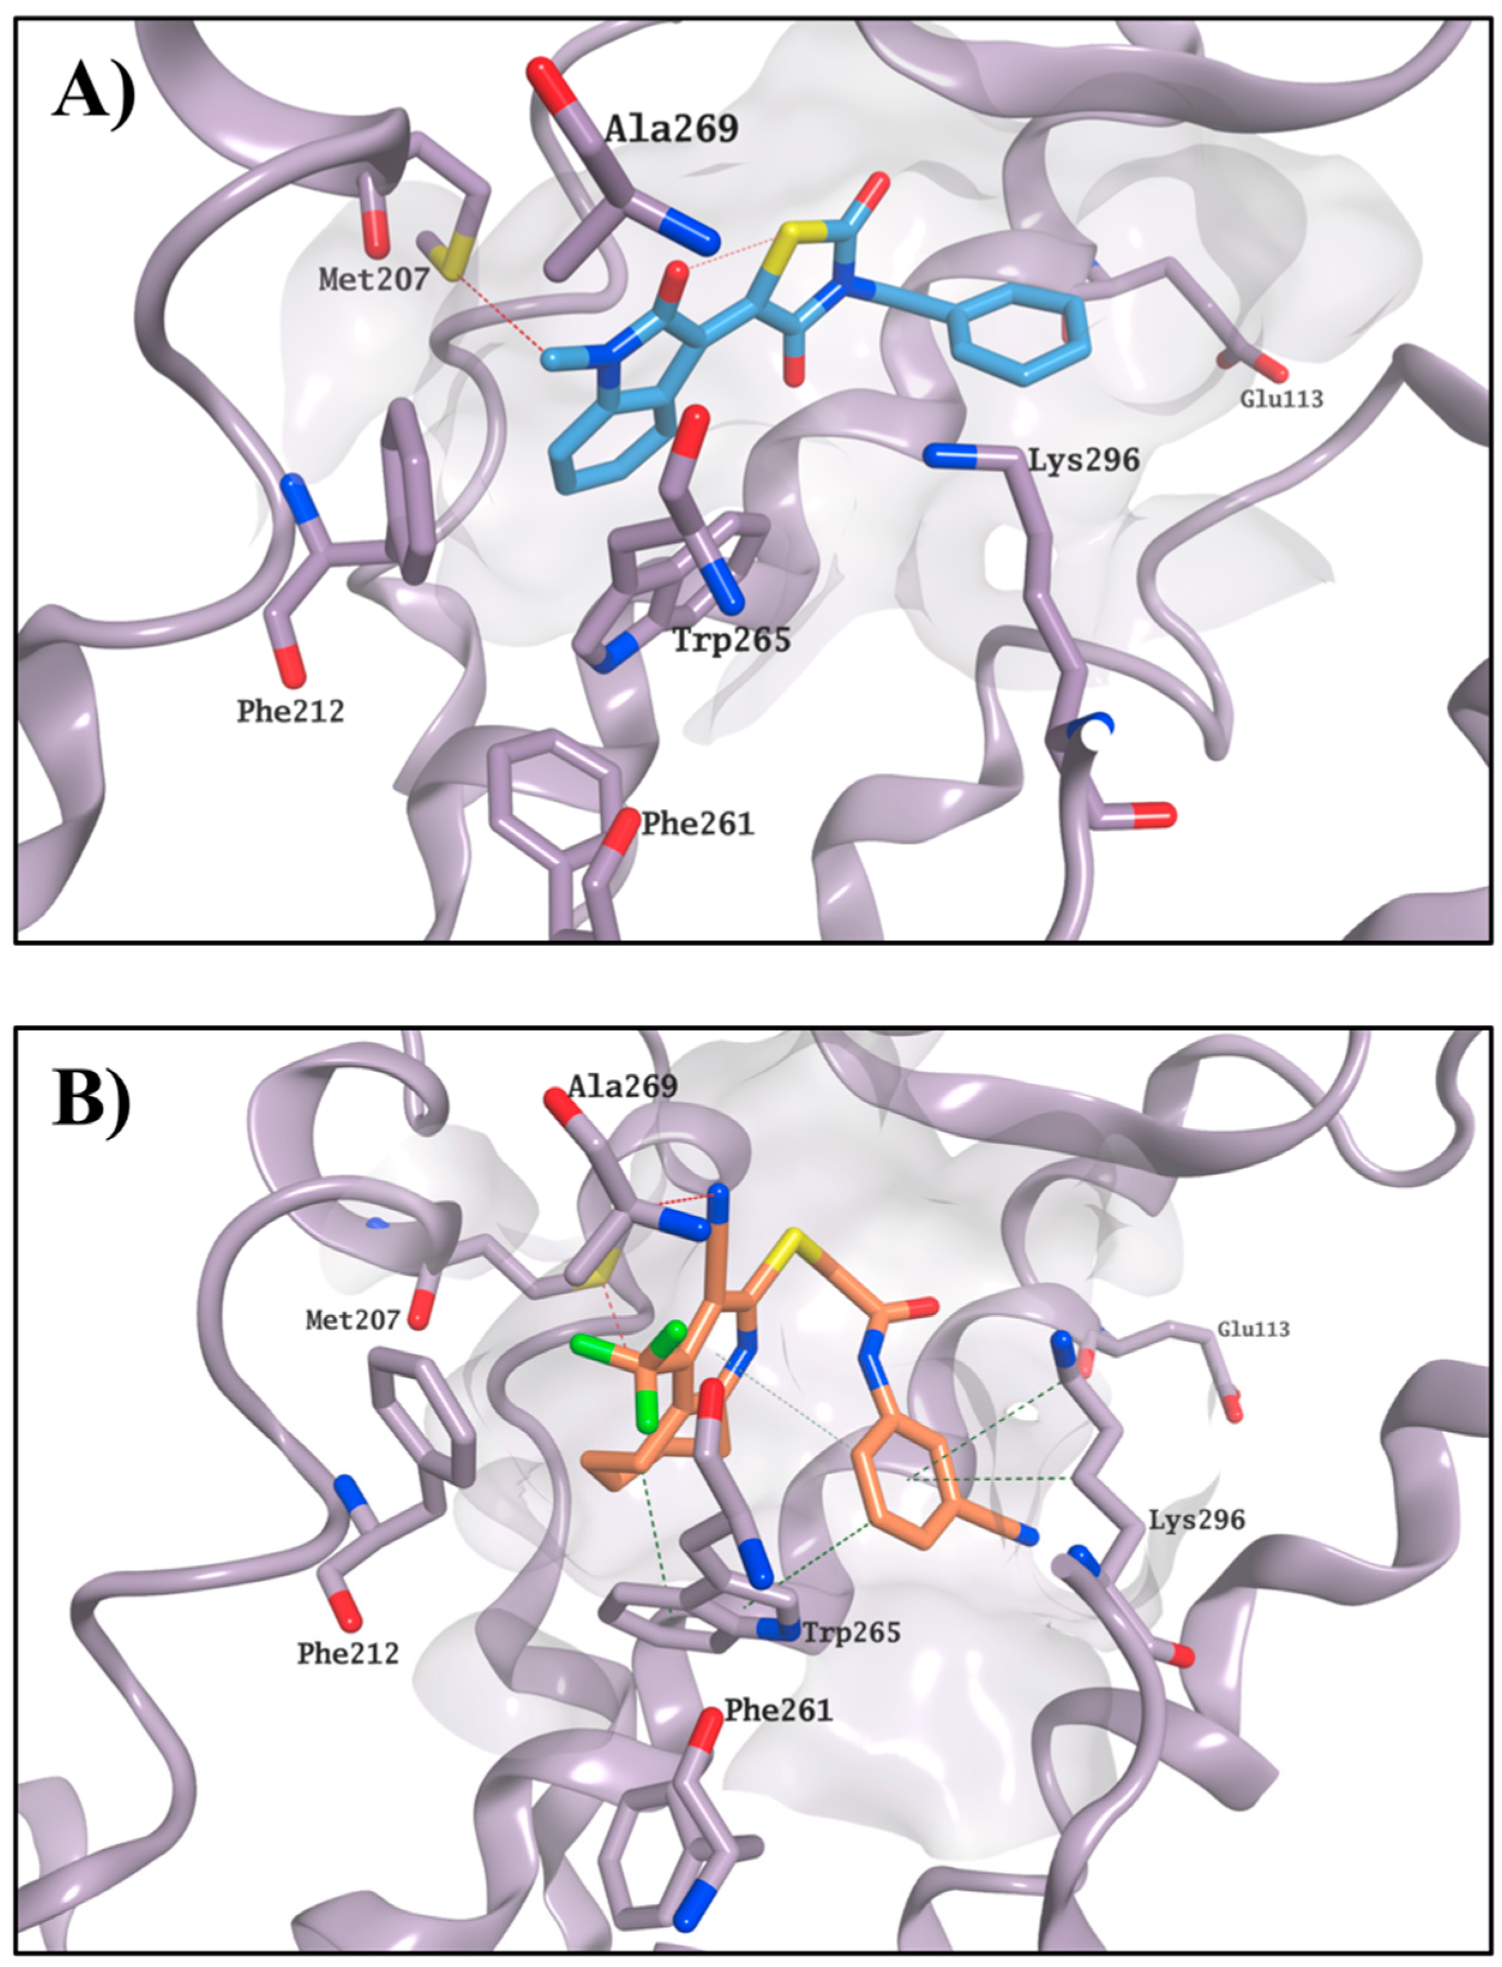
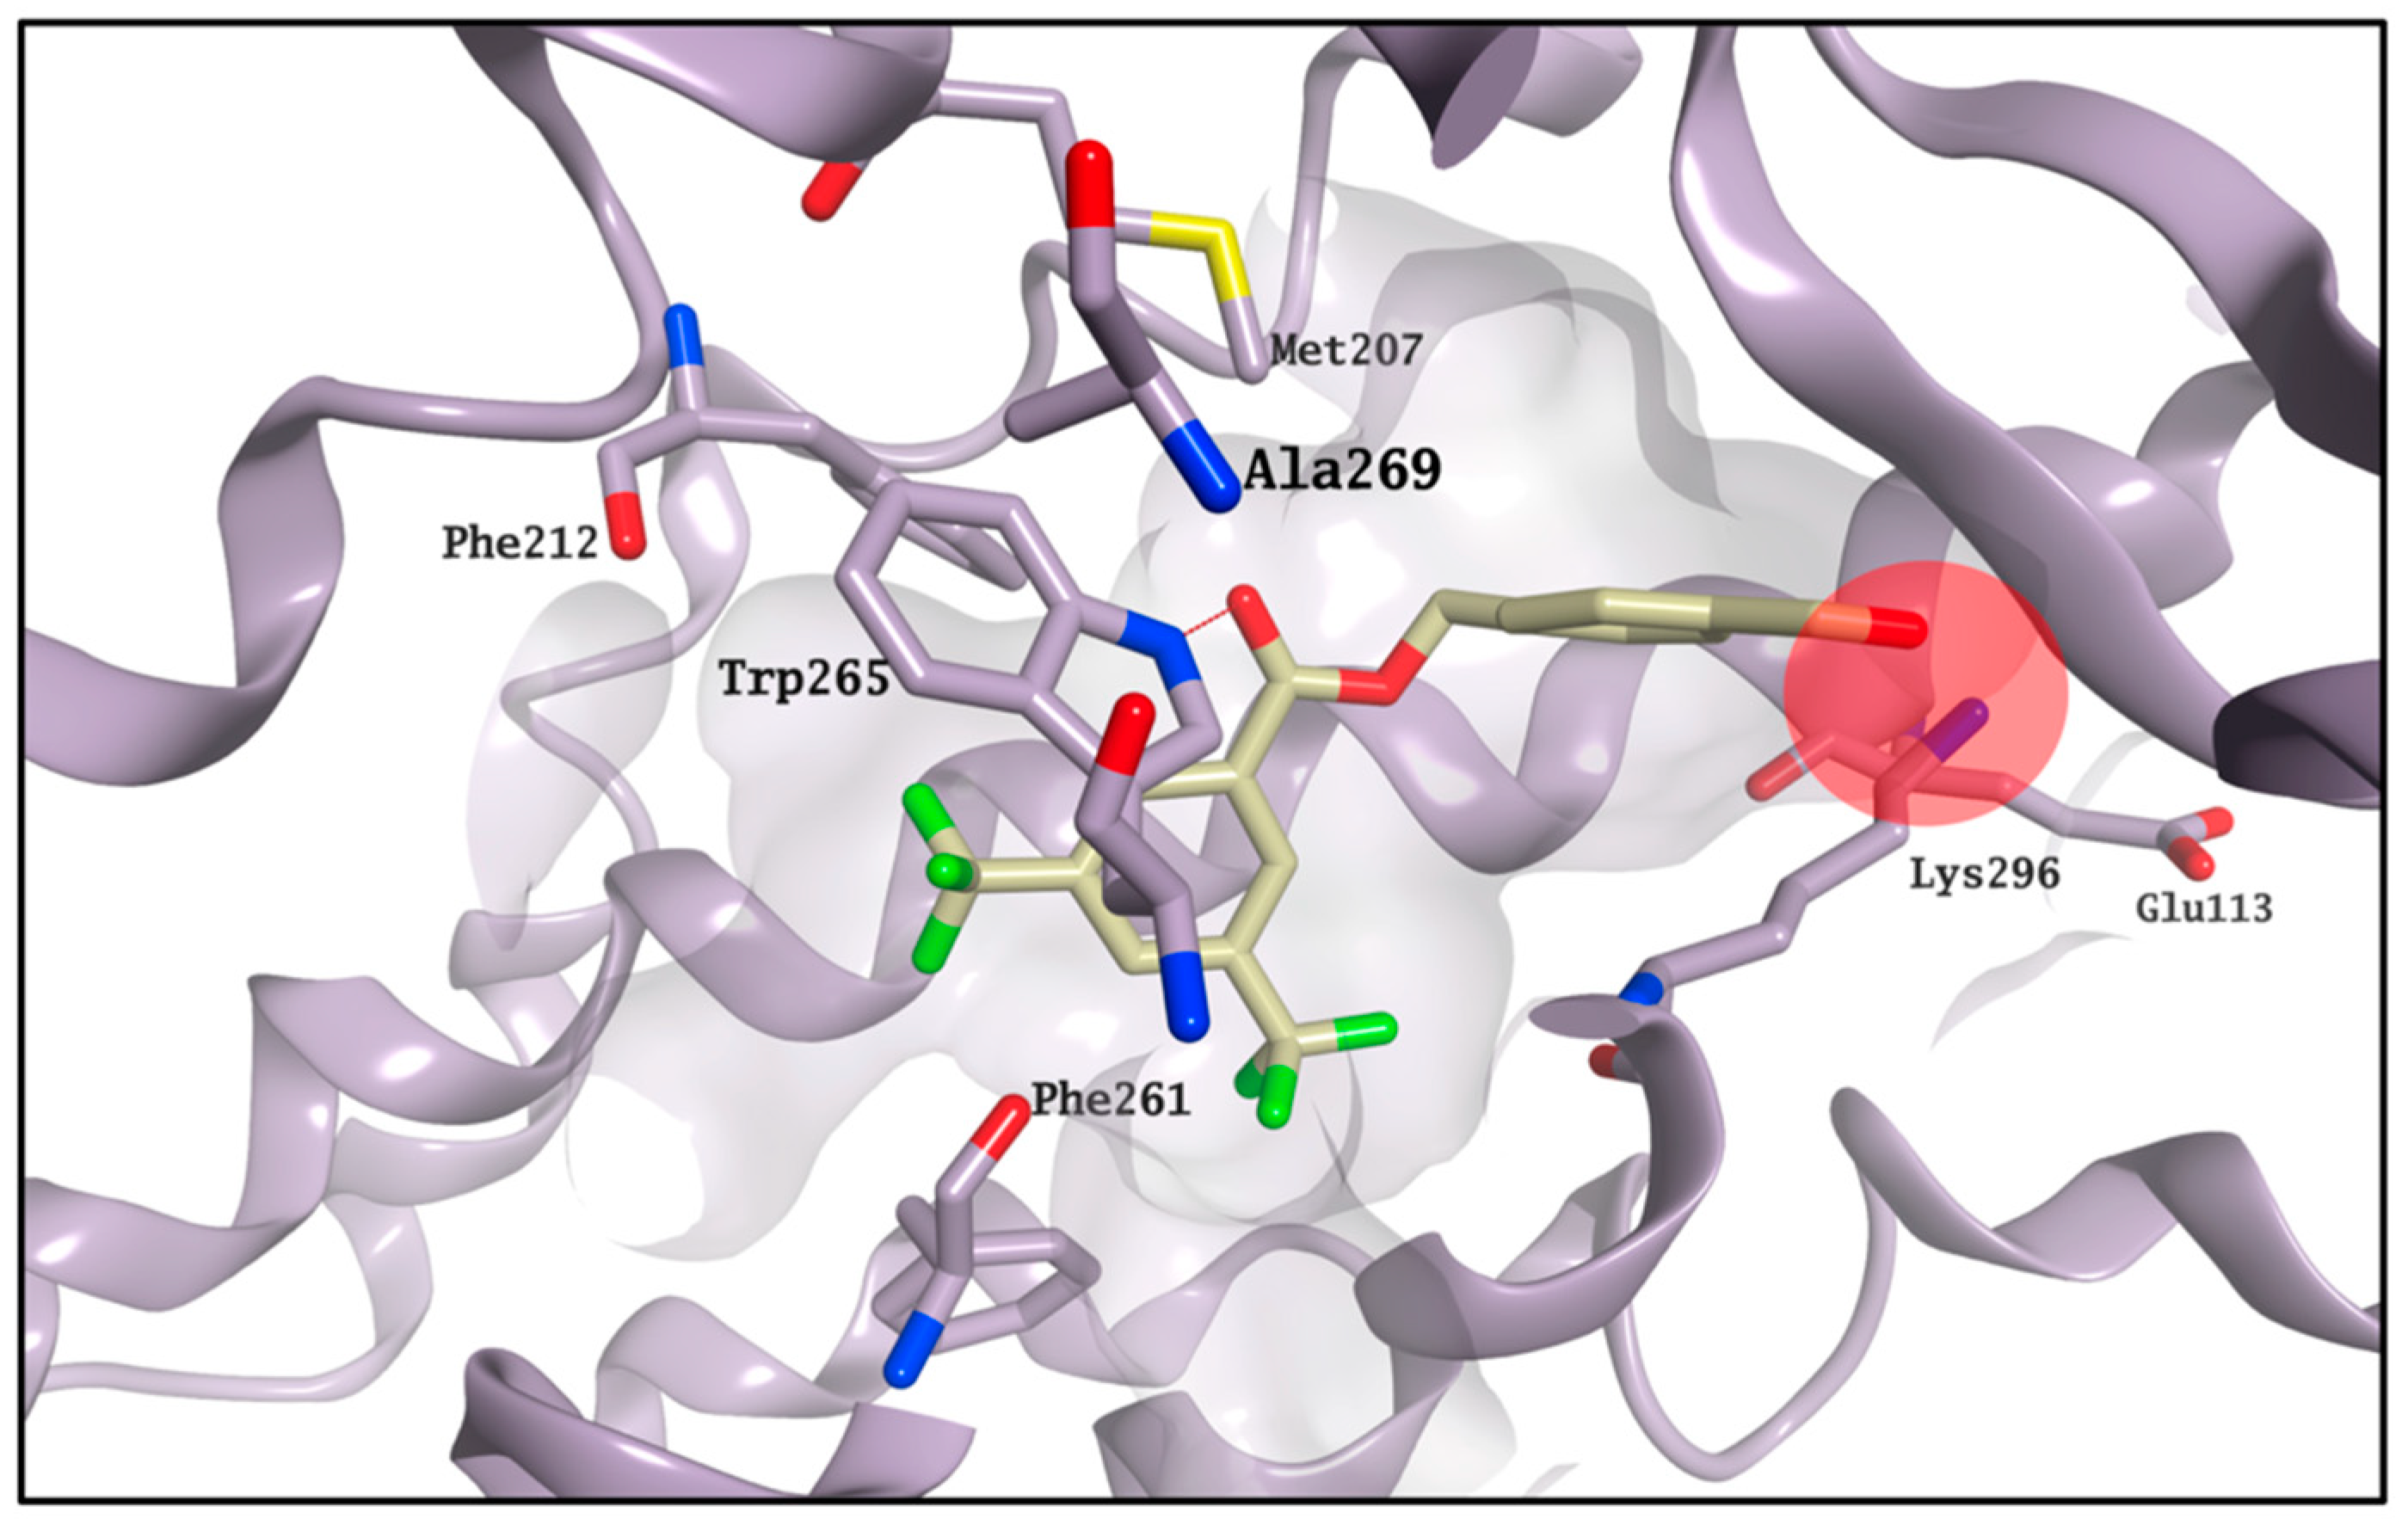
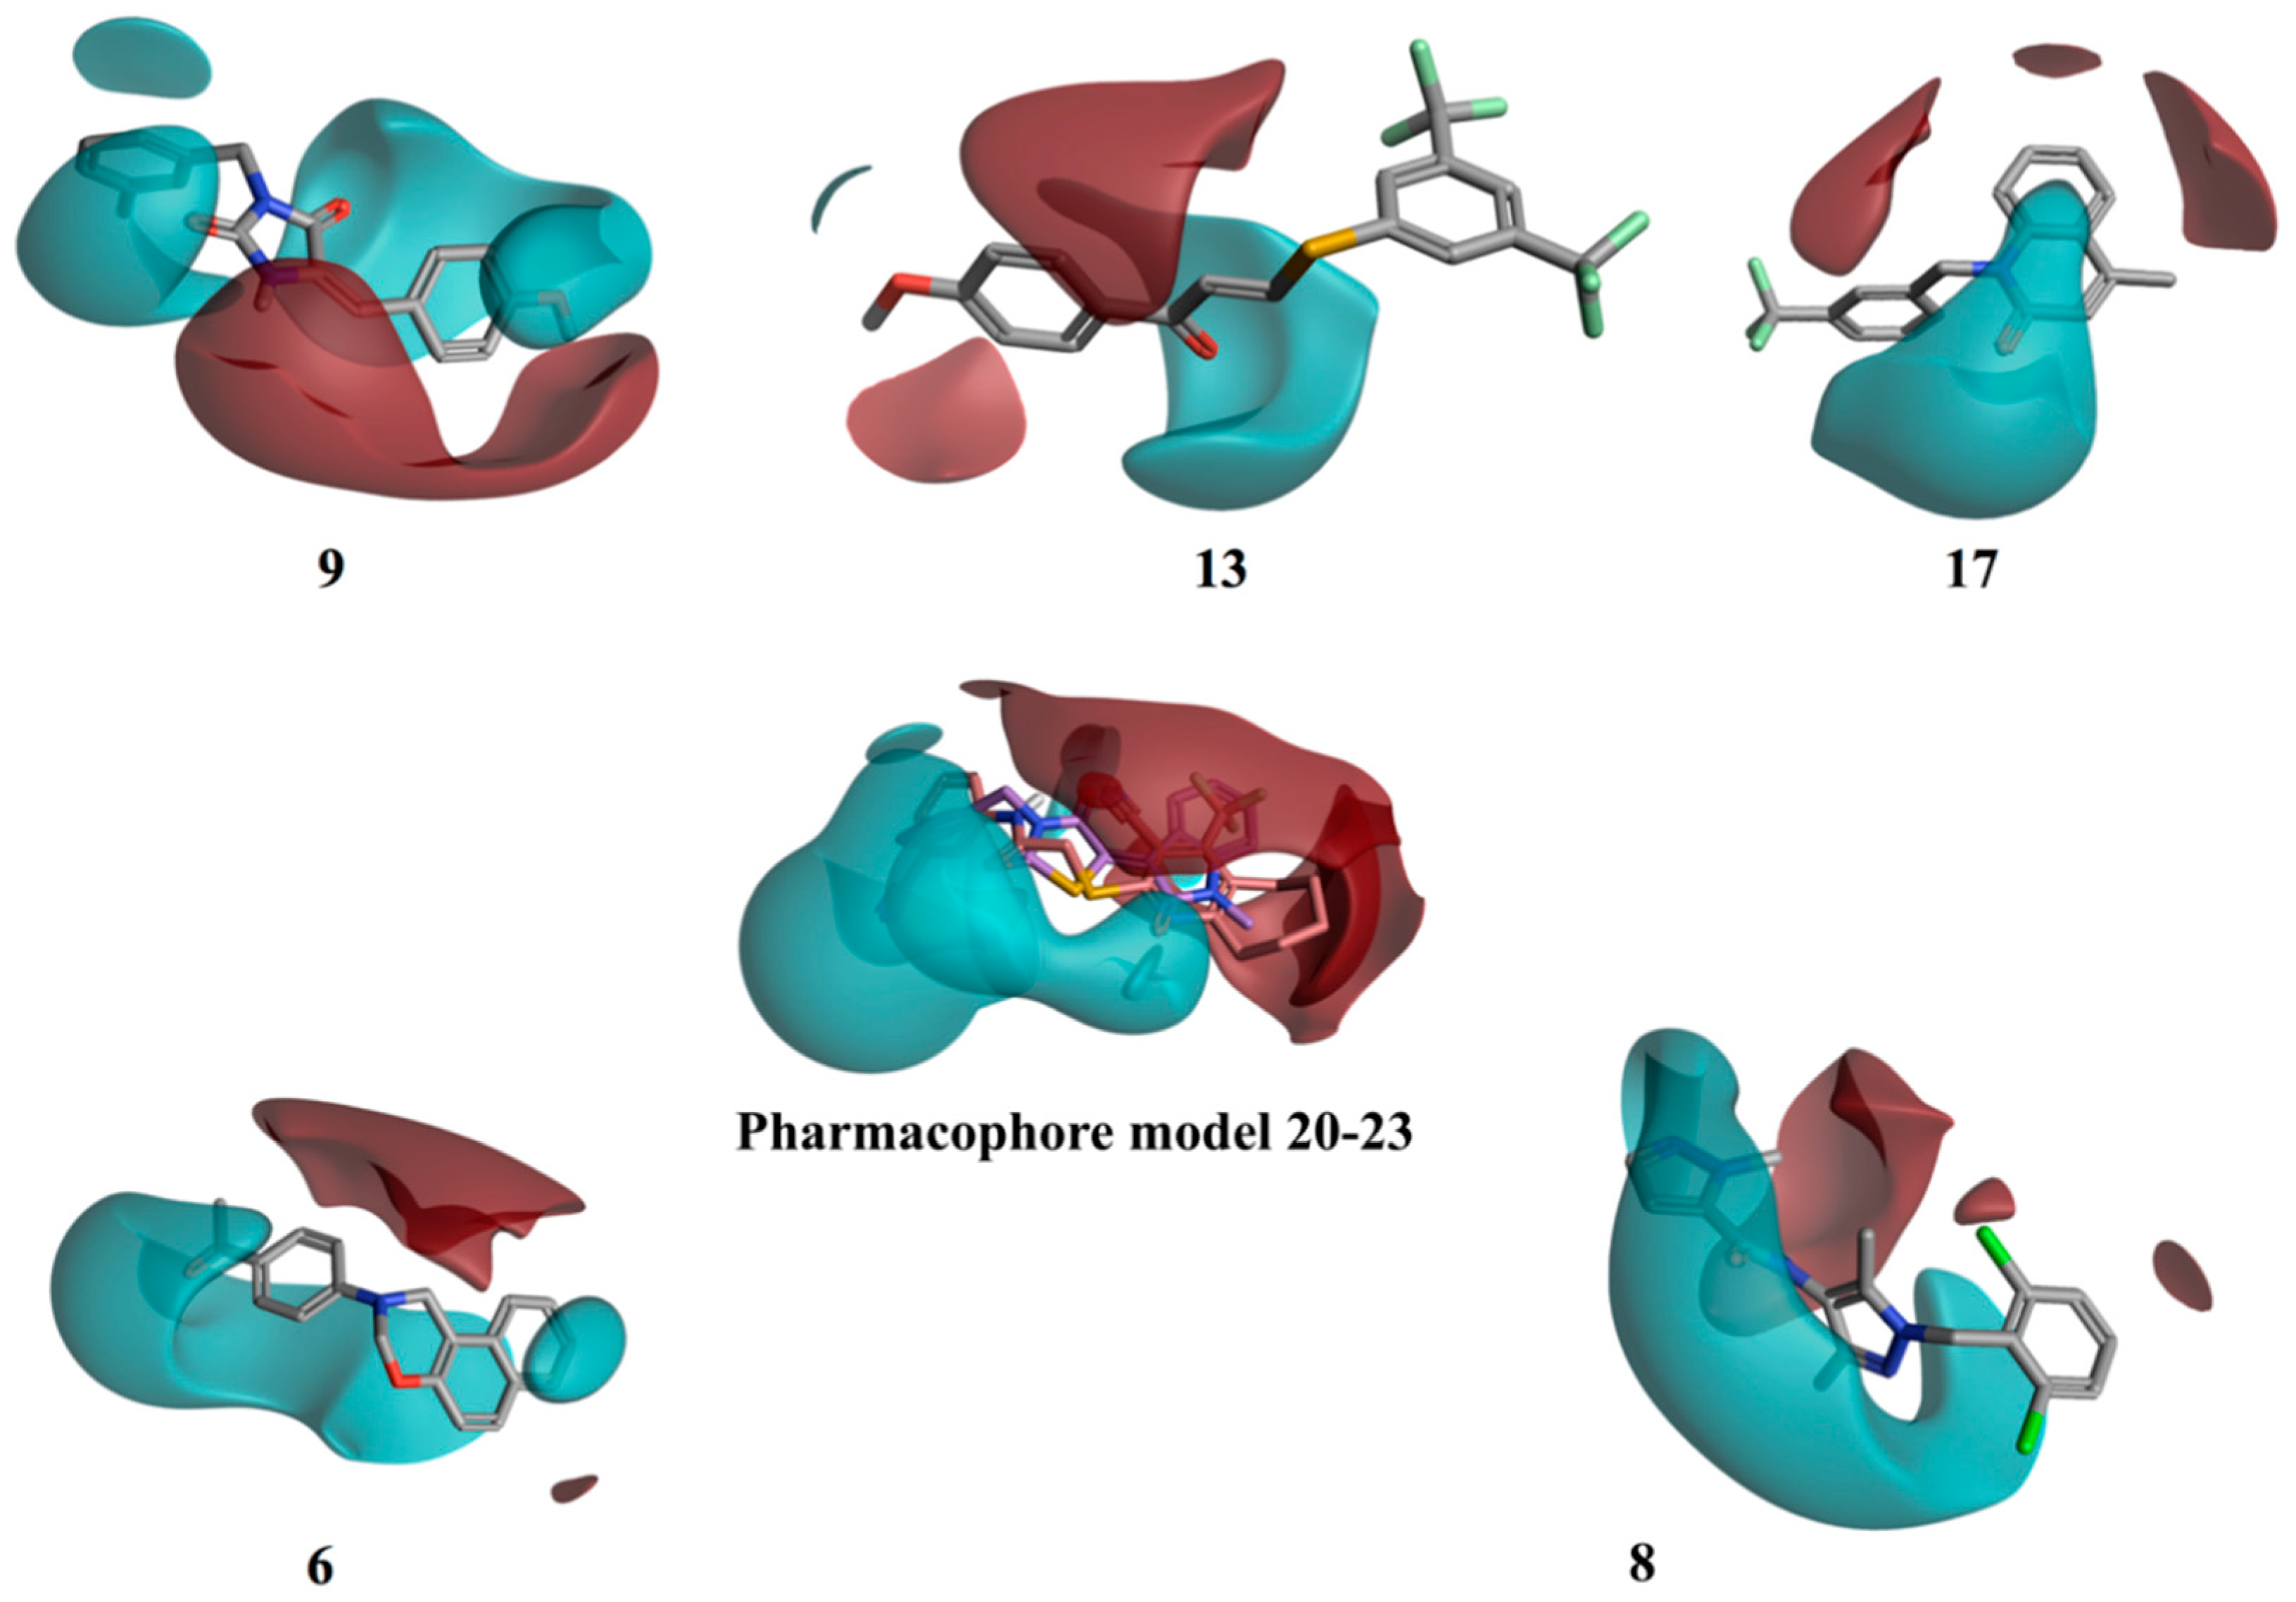
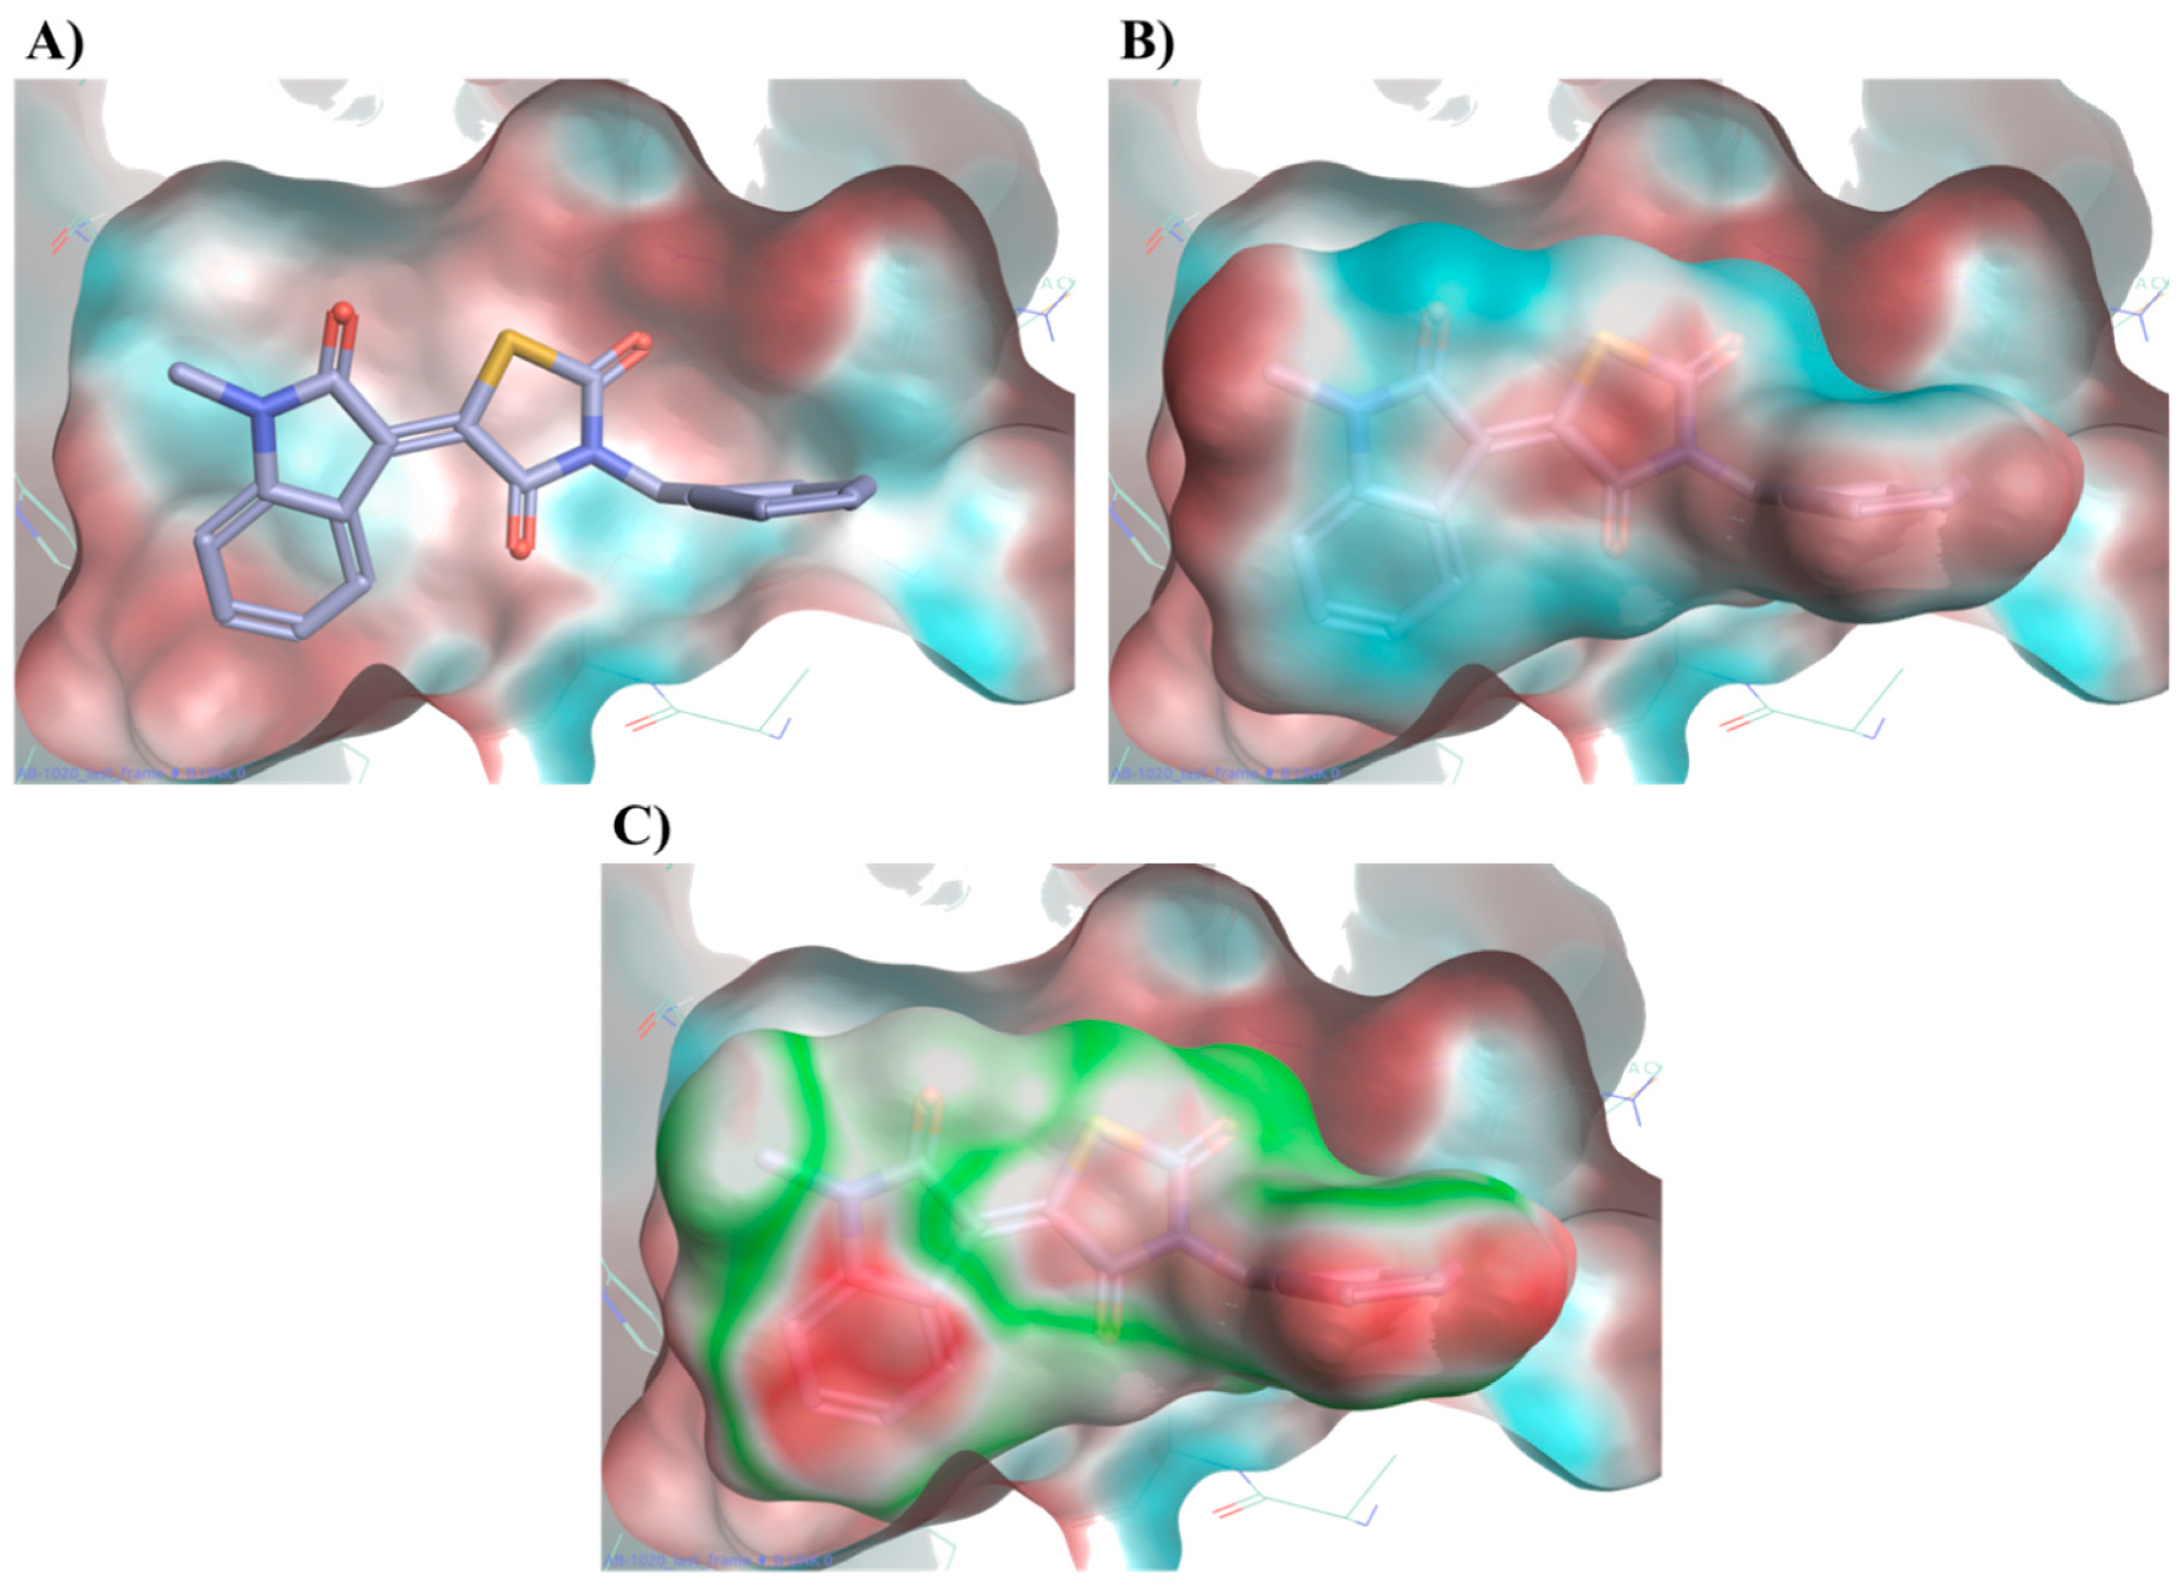
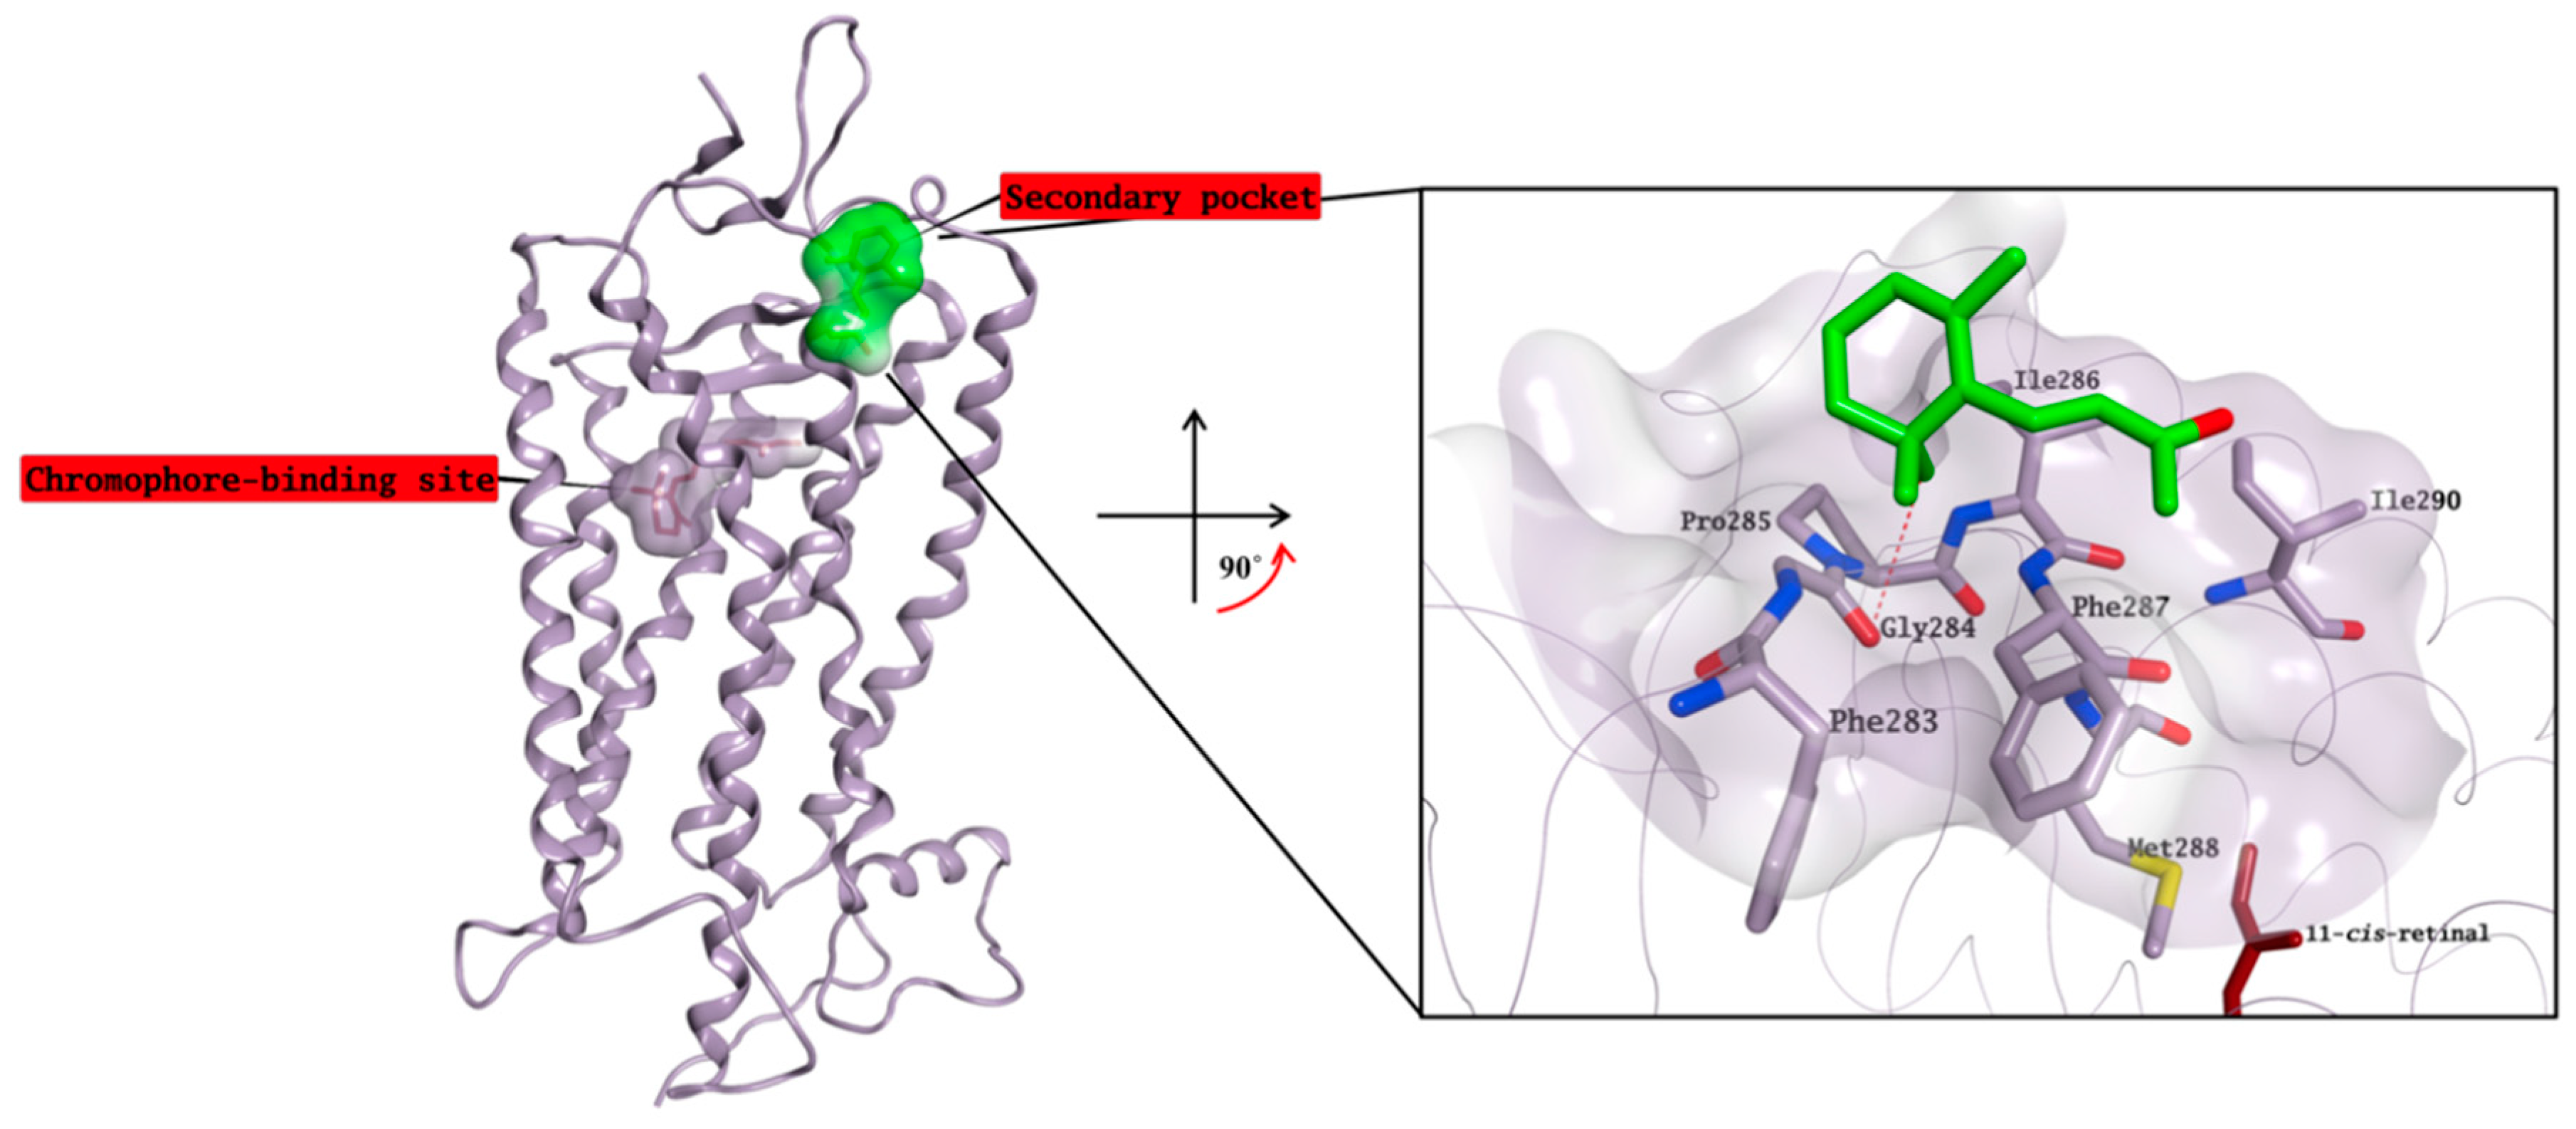
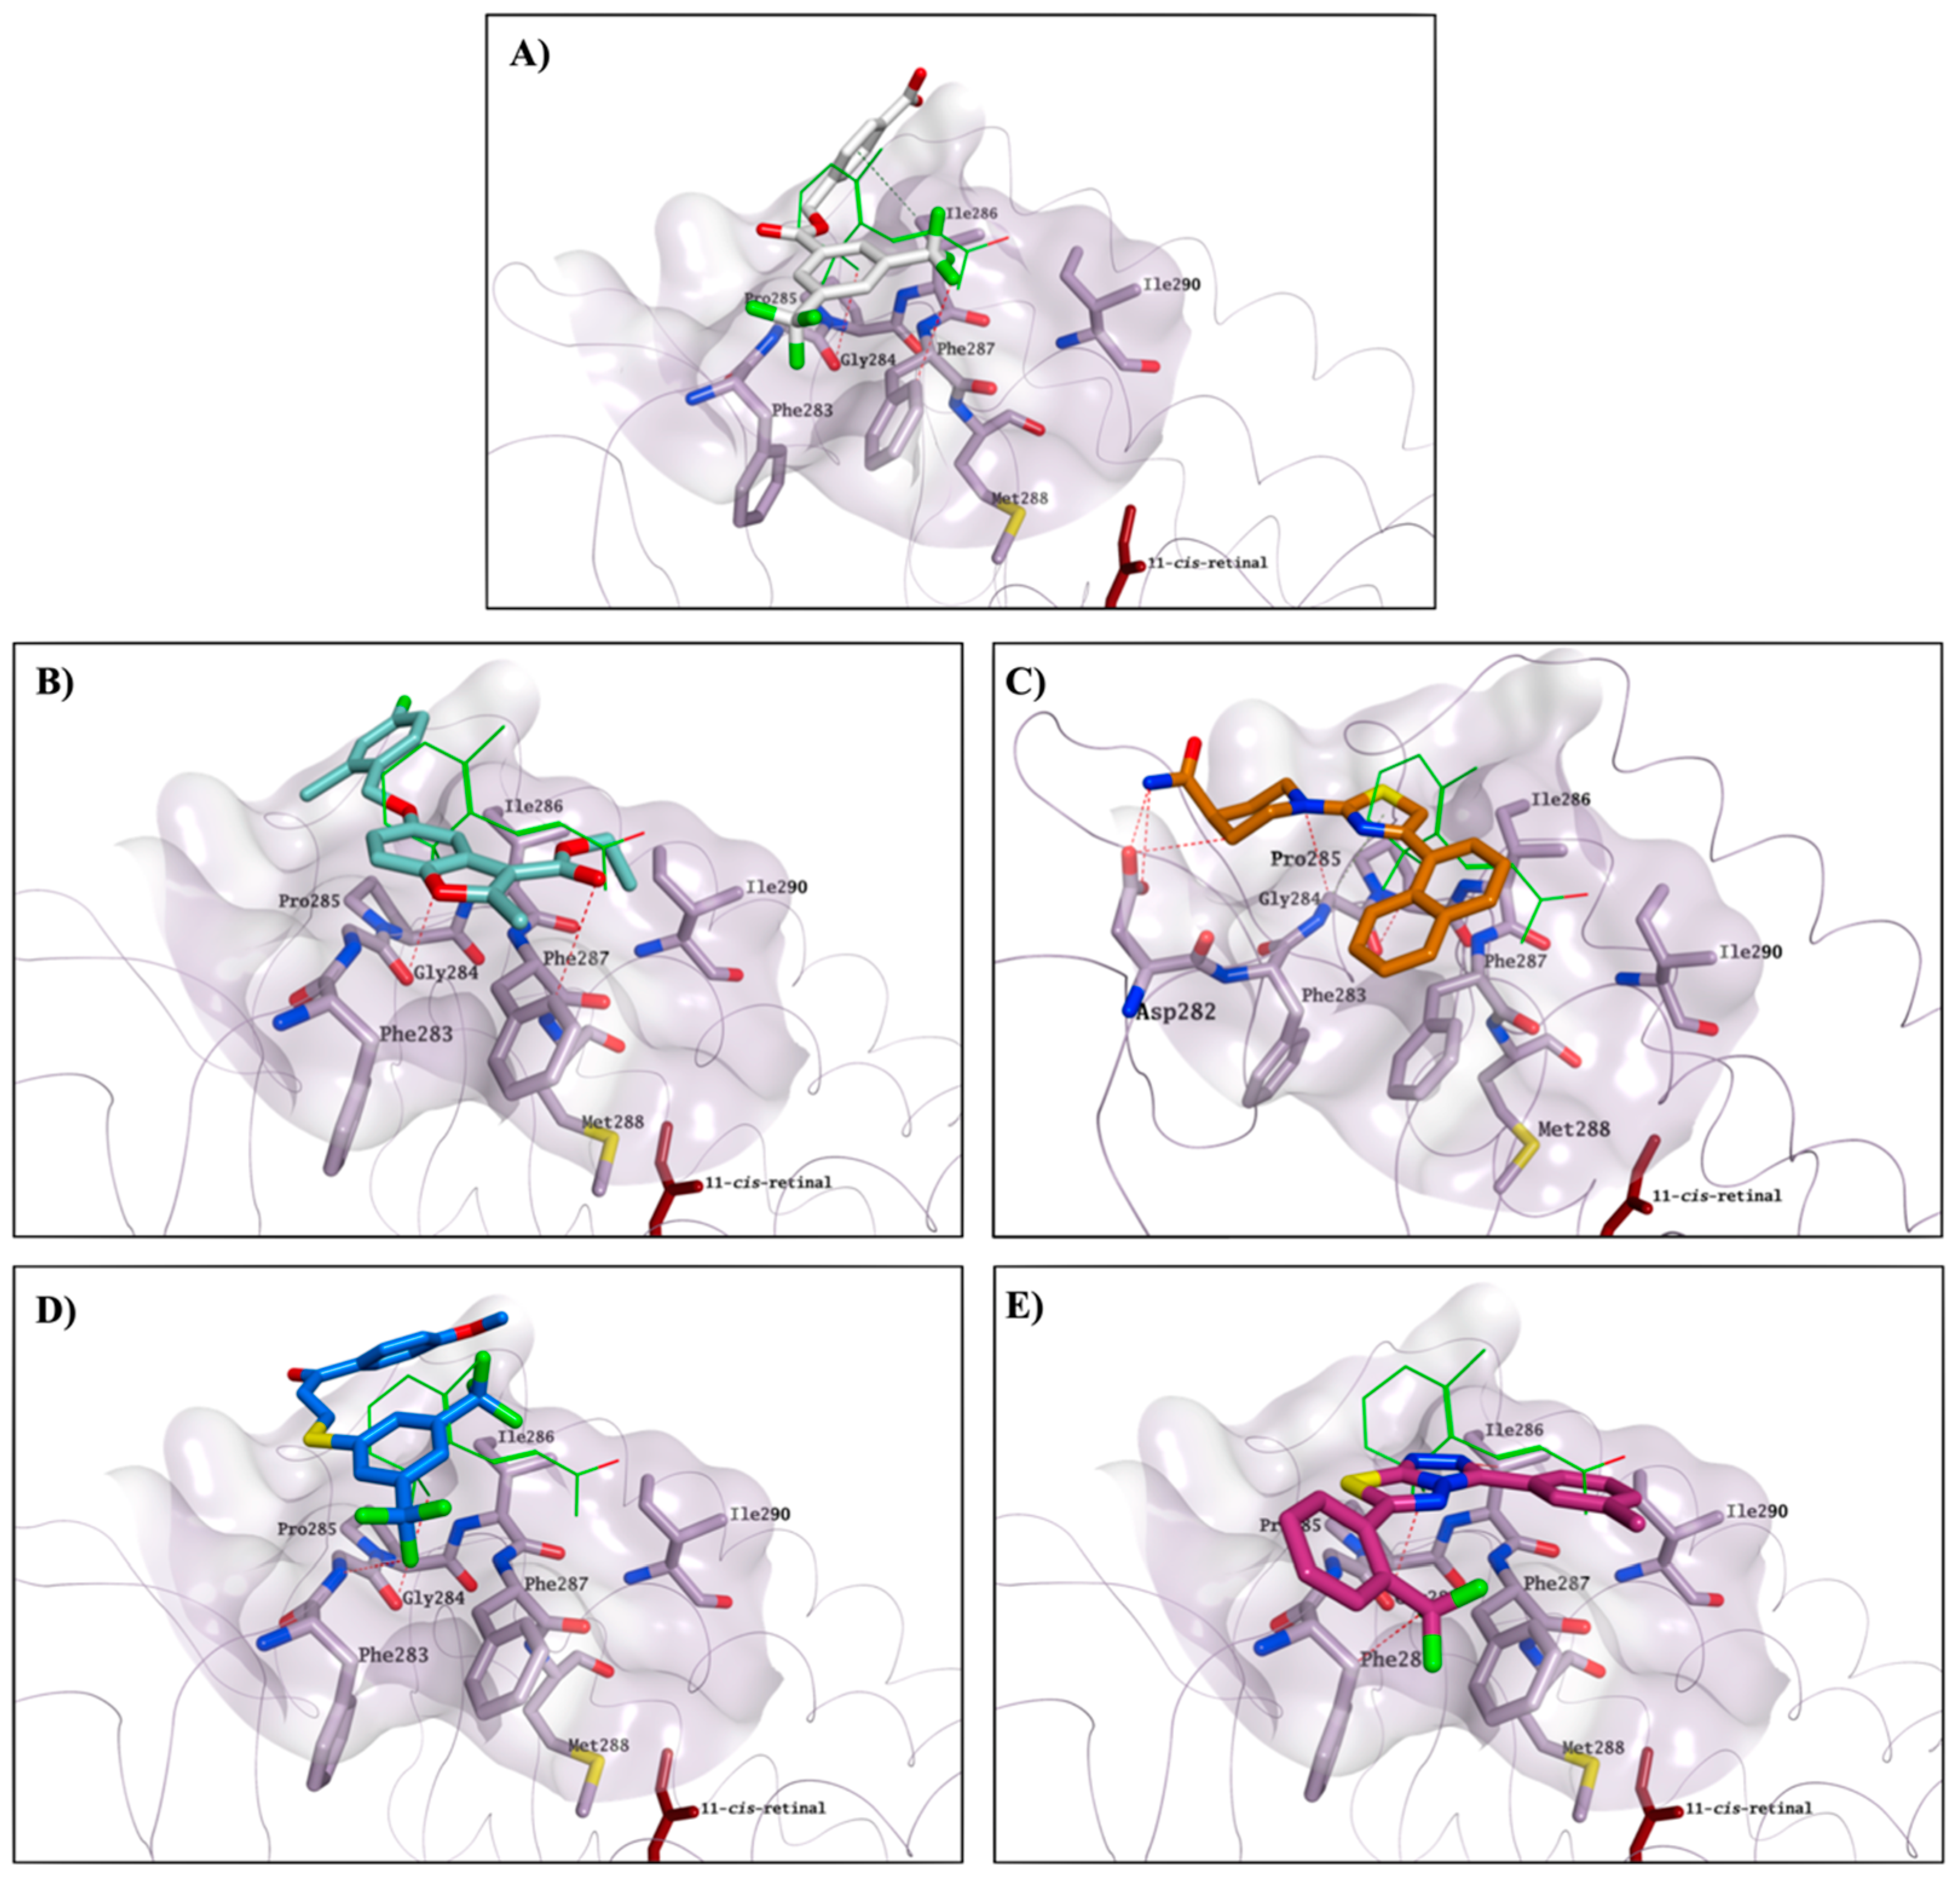
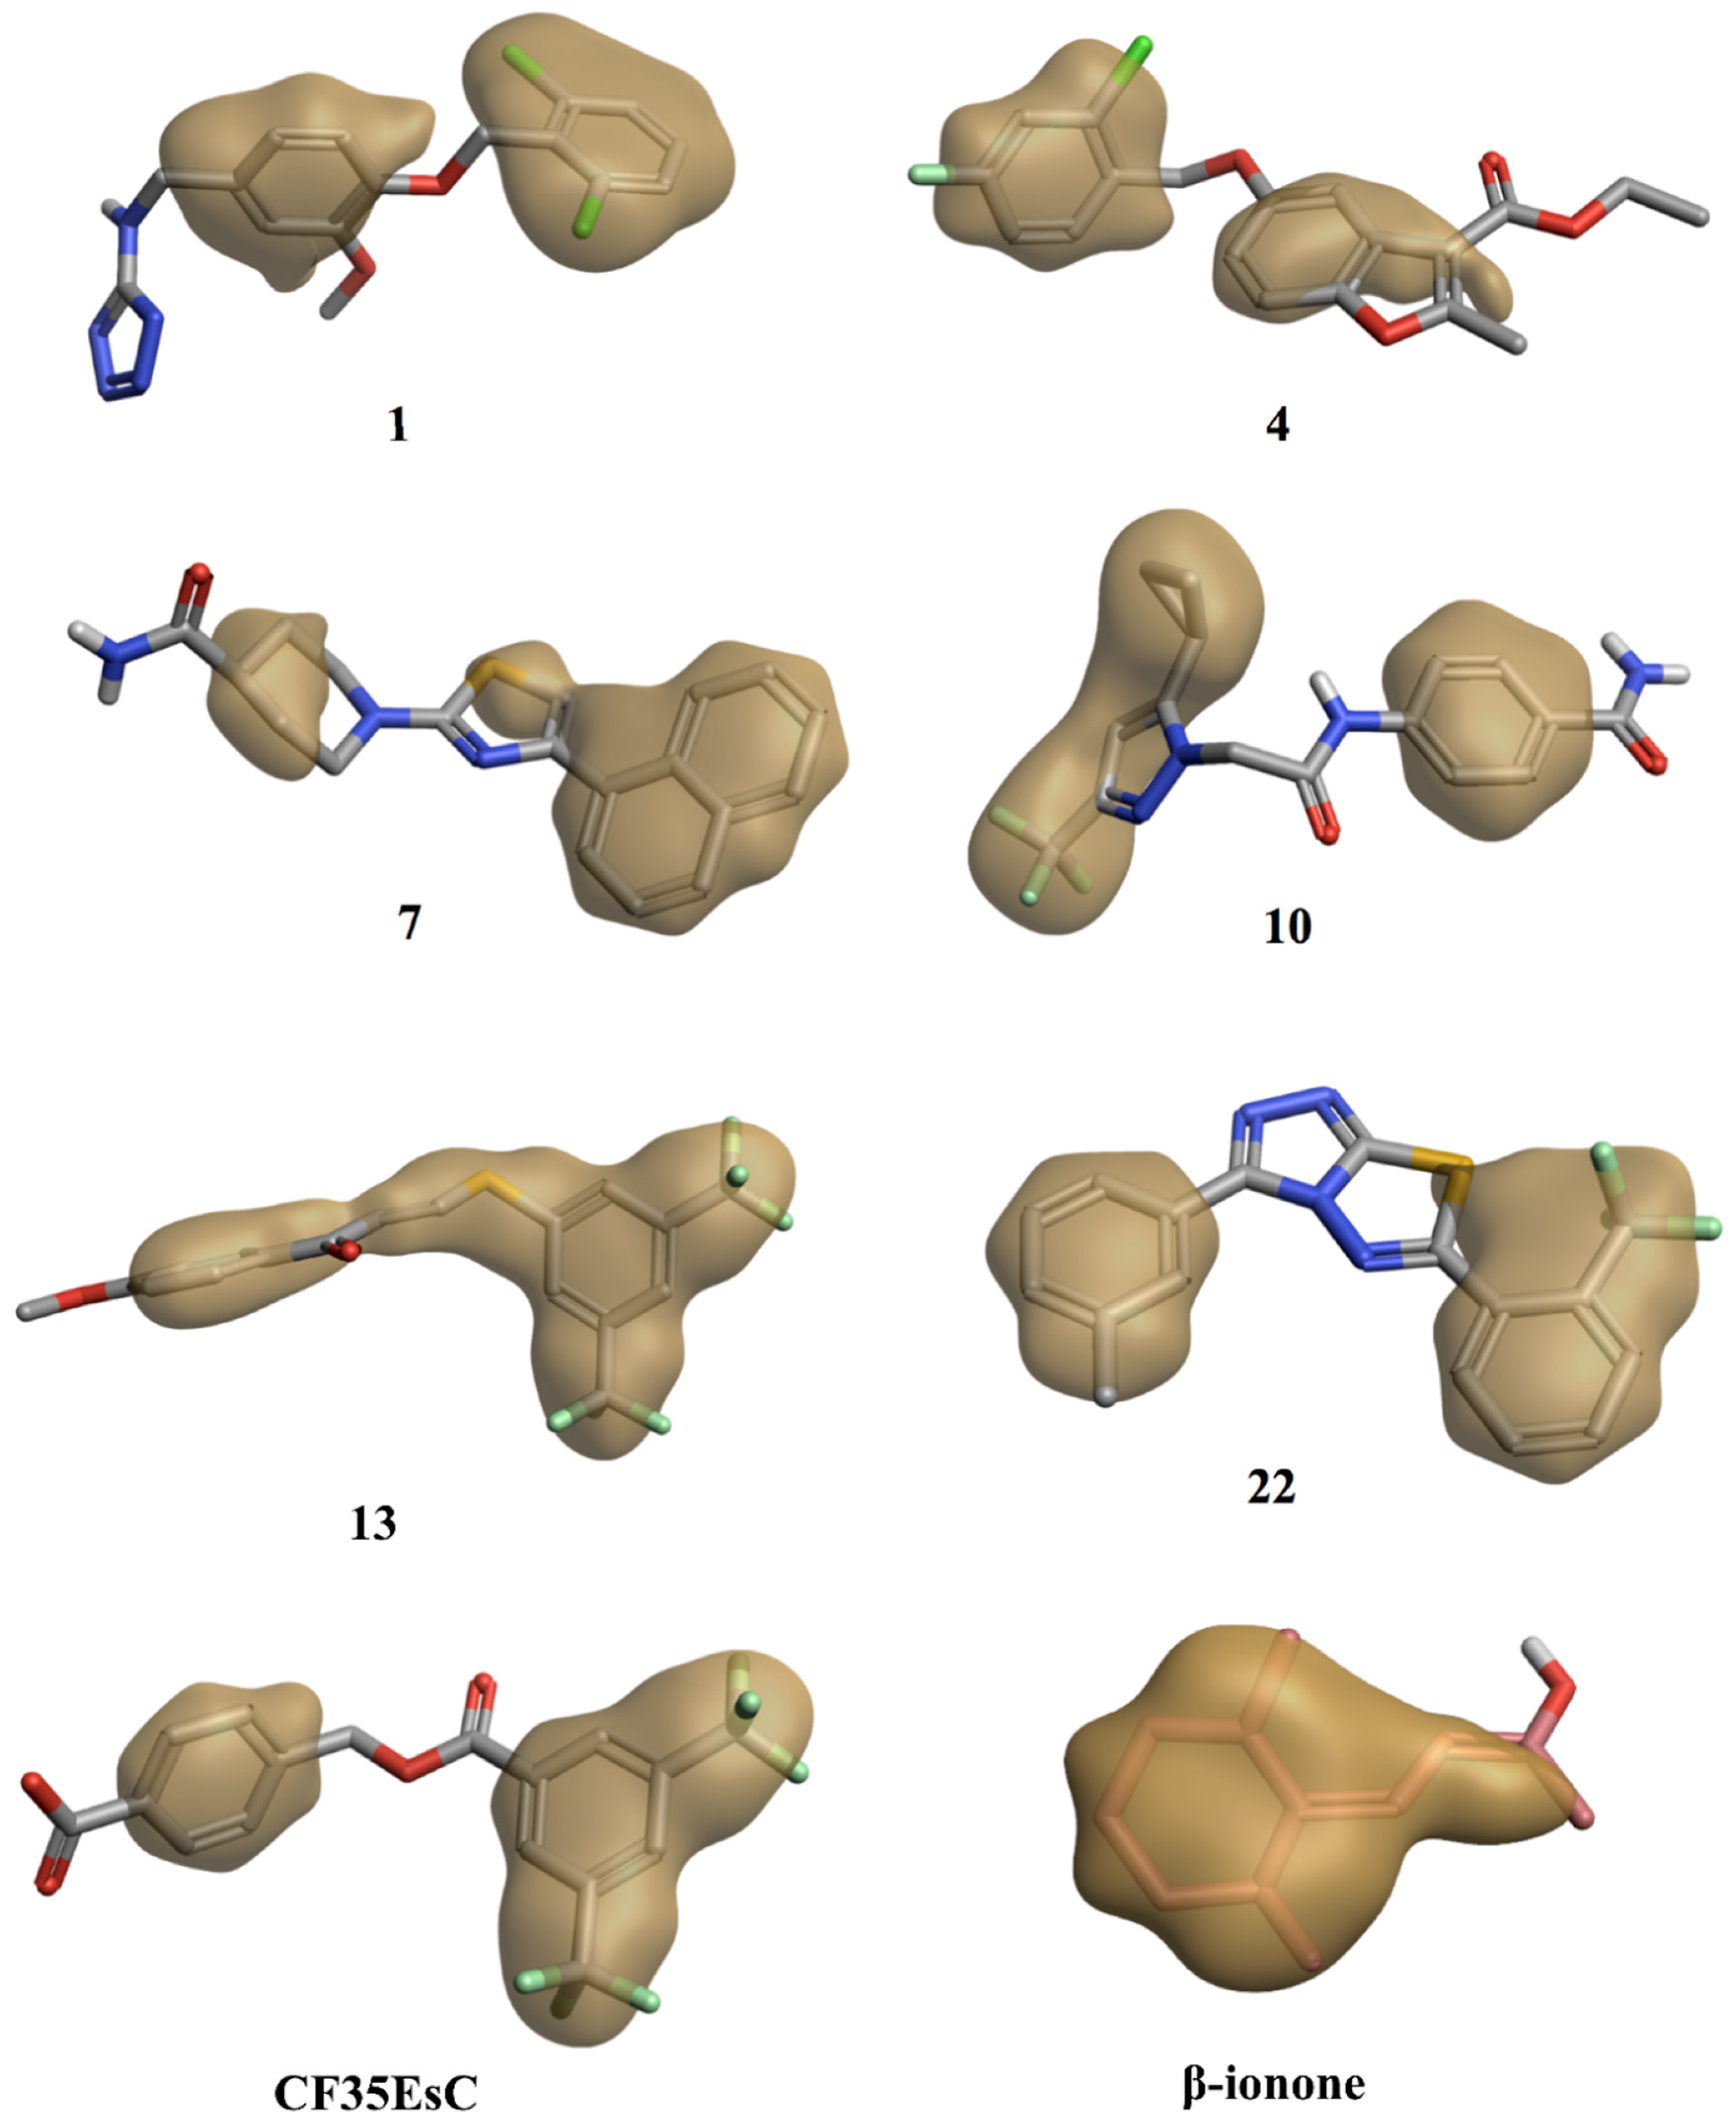
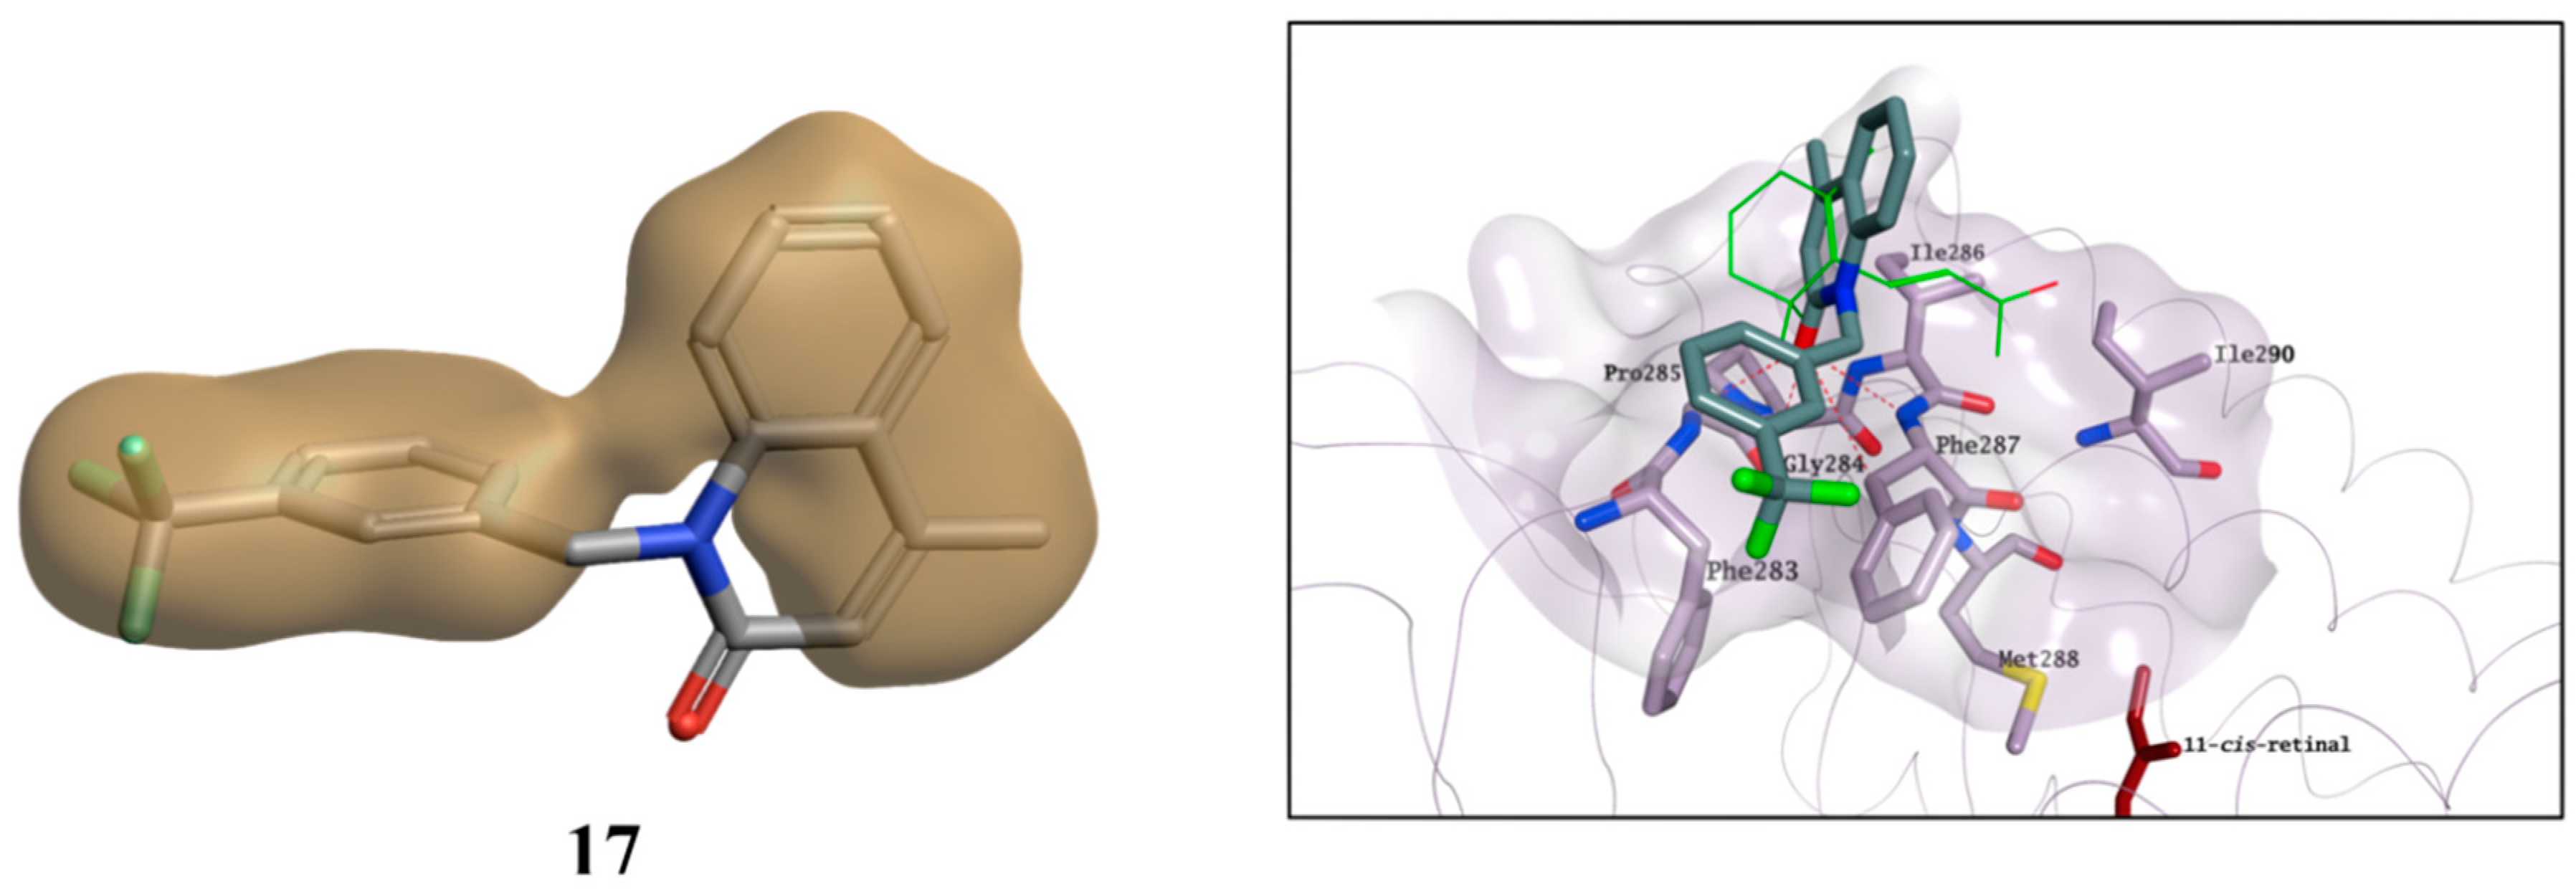
2.3. Molecular Modelling Studies on the Chromophore Binding Pocket
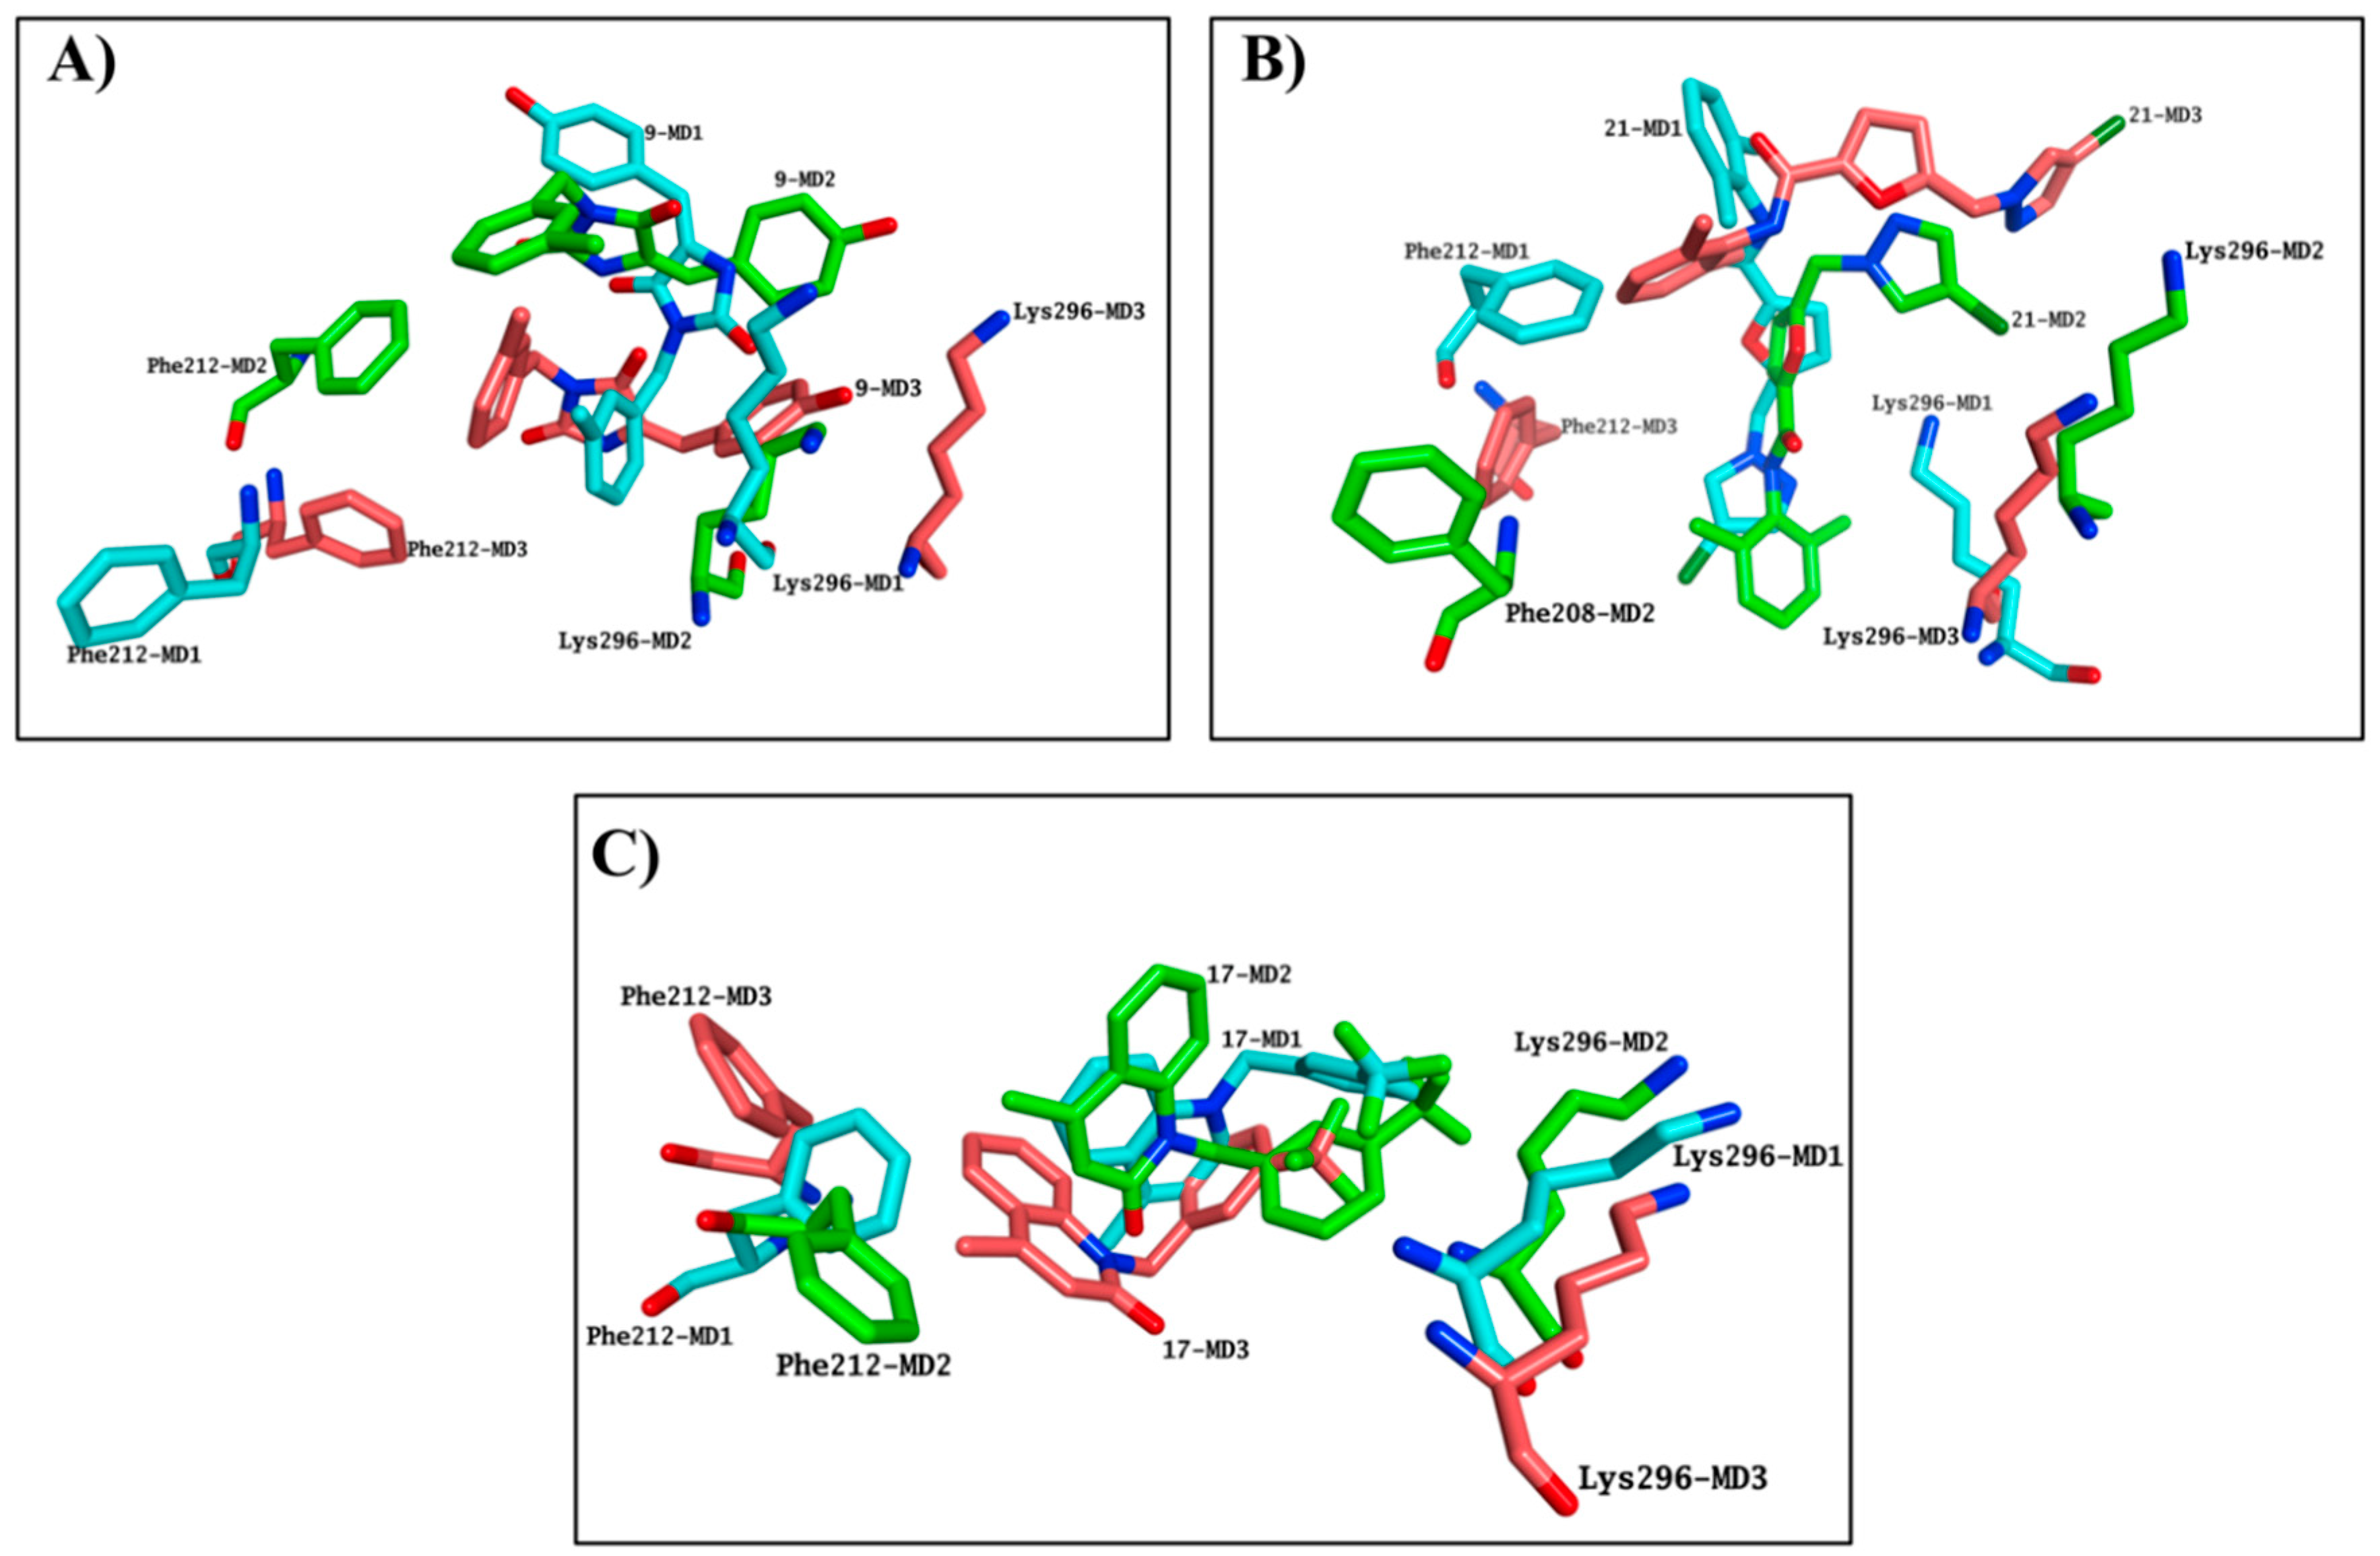
2.4. Molecular Modelling Studies to Investigate the Observed Stabilisation Effect of the Rhodopsin-9-cis-Retinal Complex
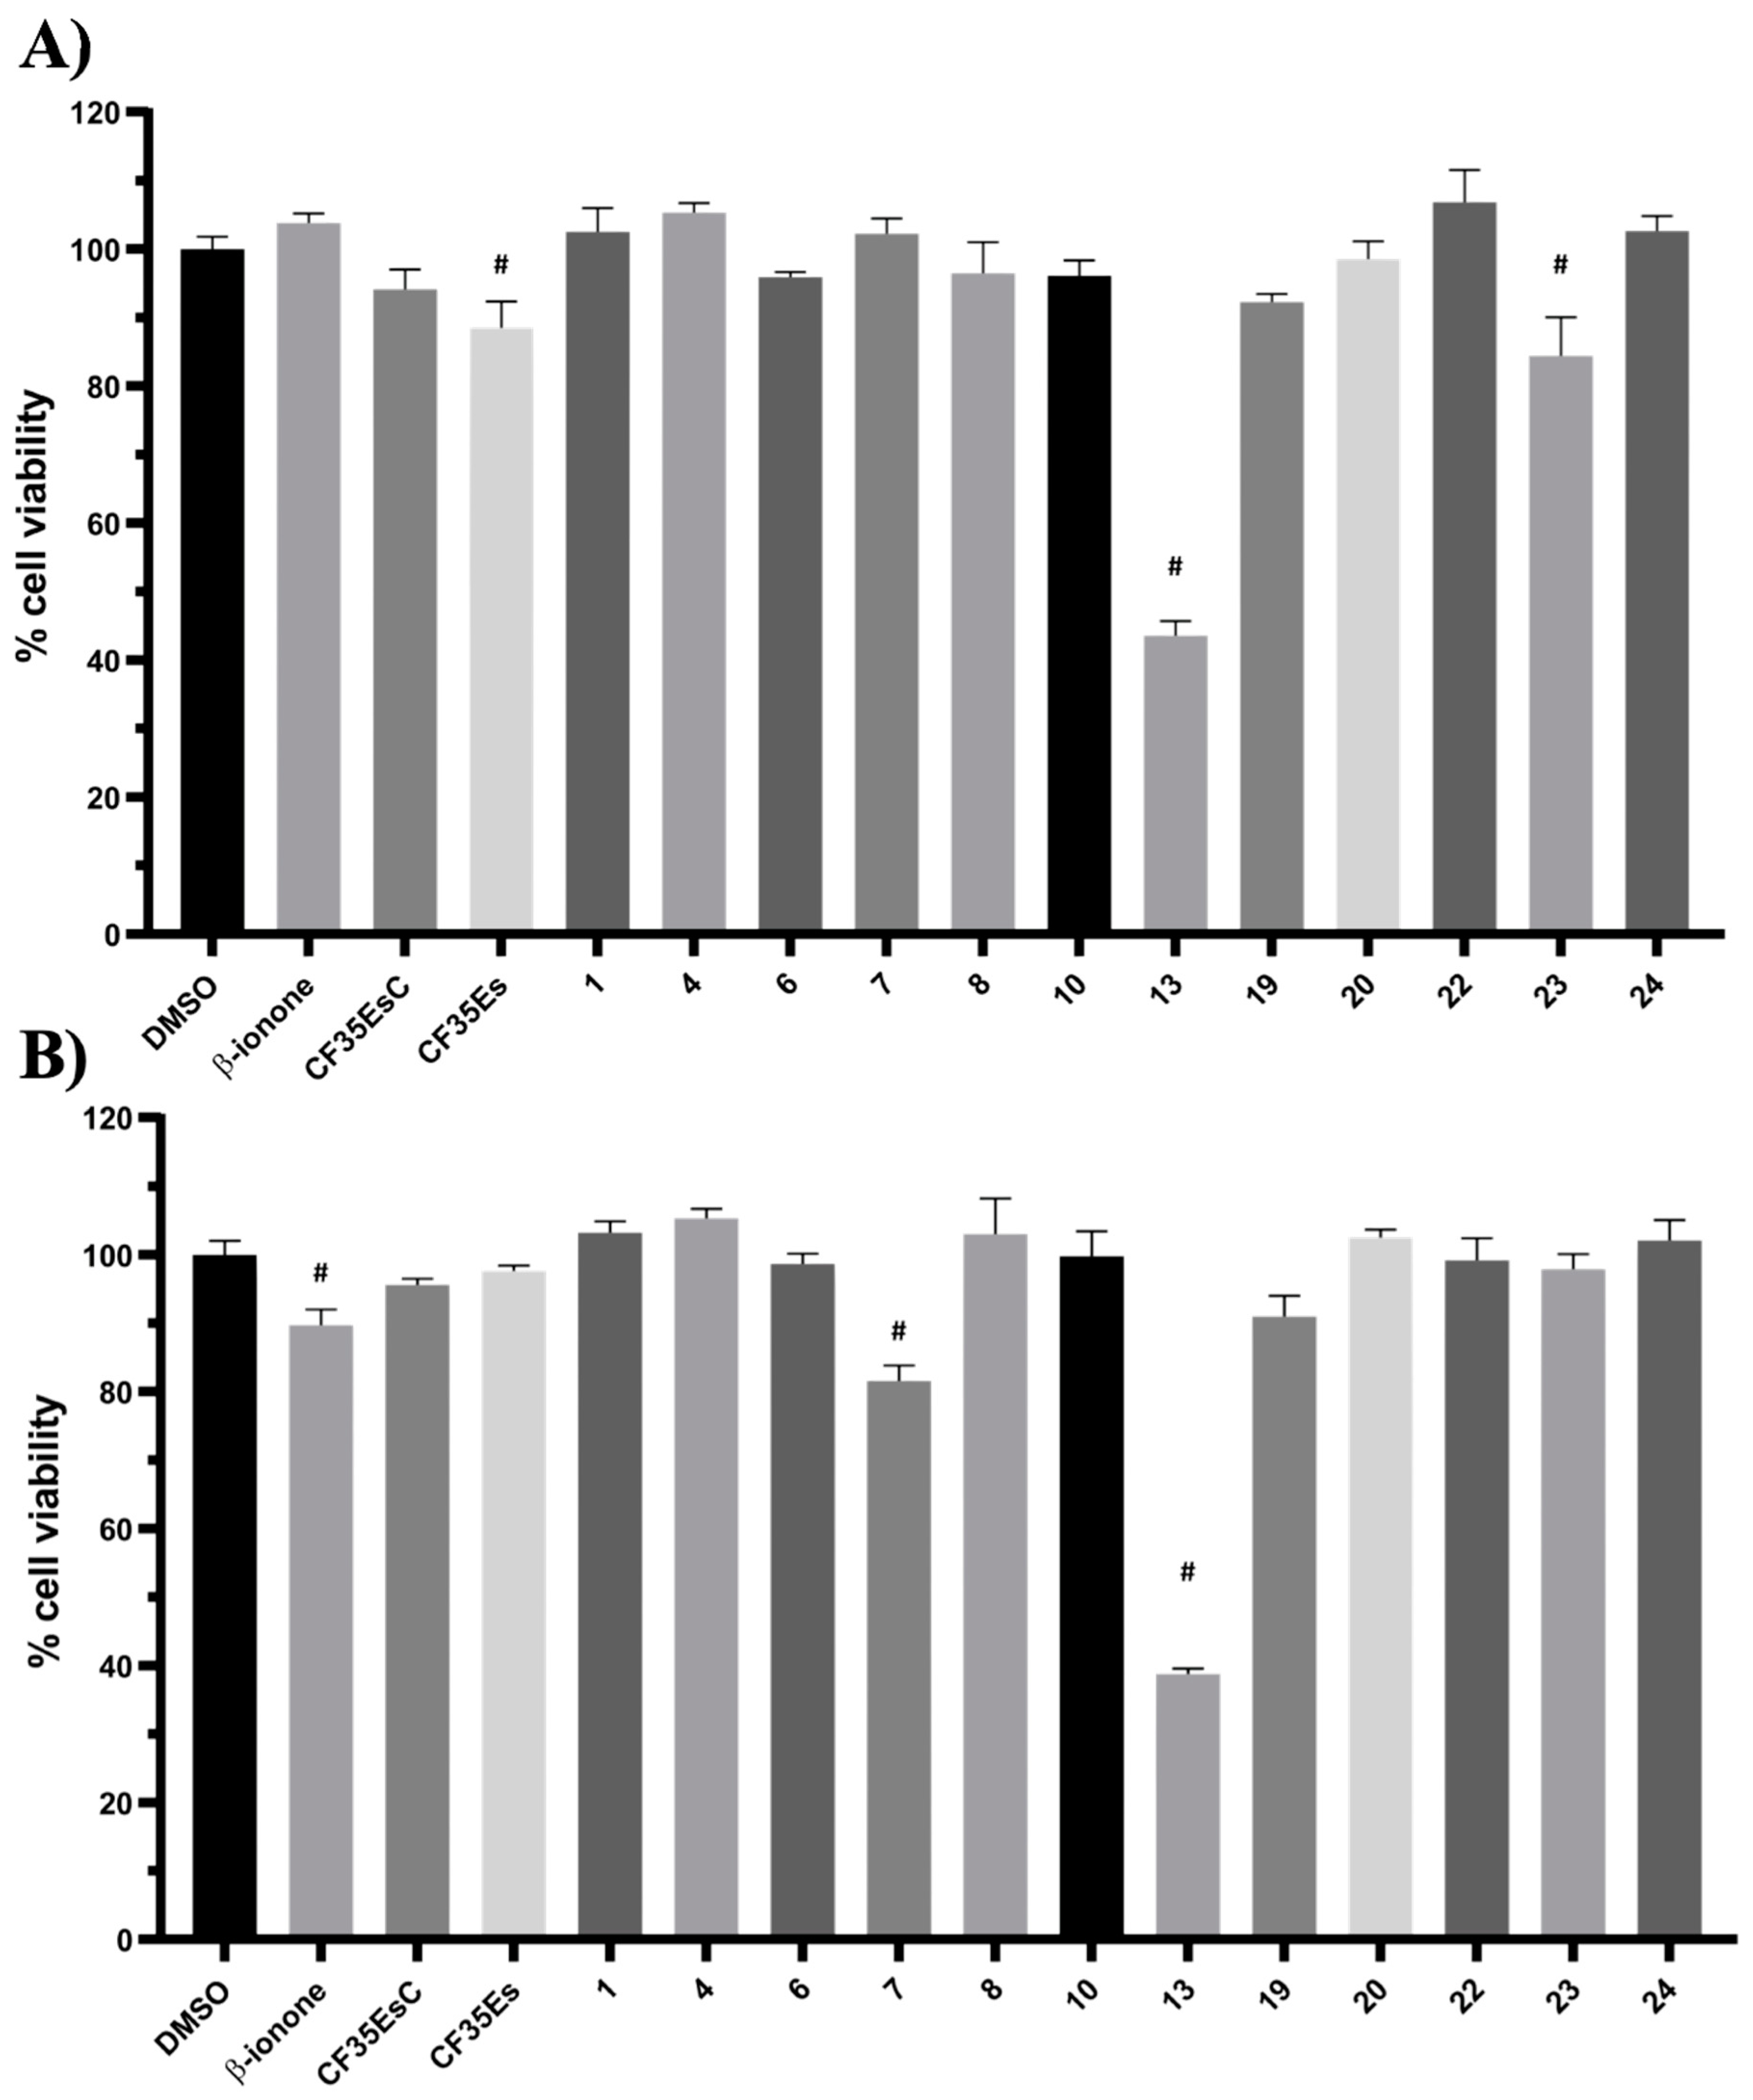
2.5. Evaluation of Cytotoxic Effects for Selected Hit Compounds
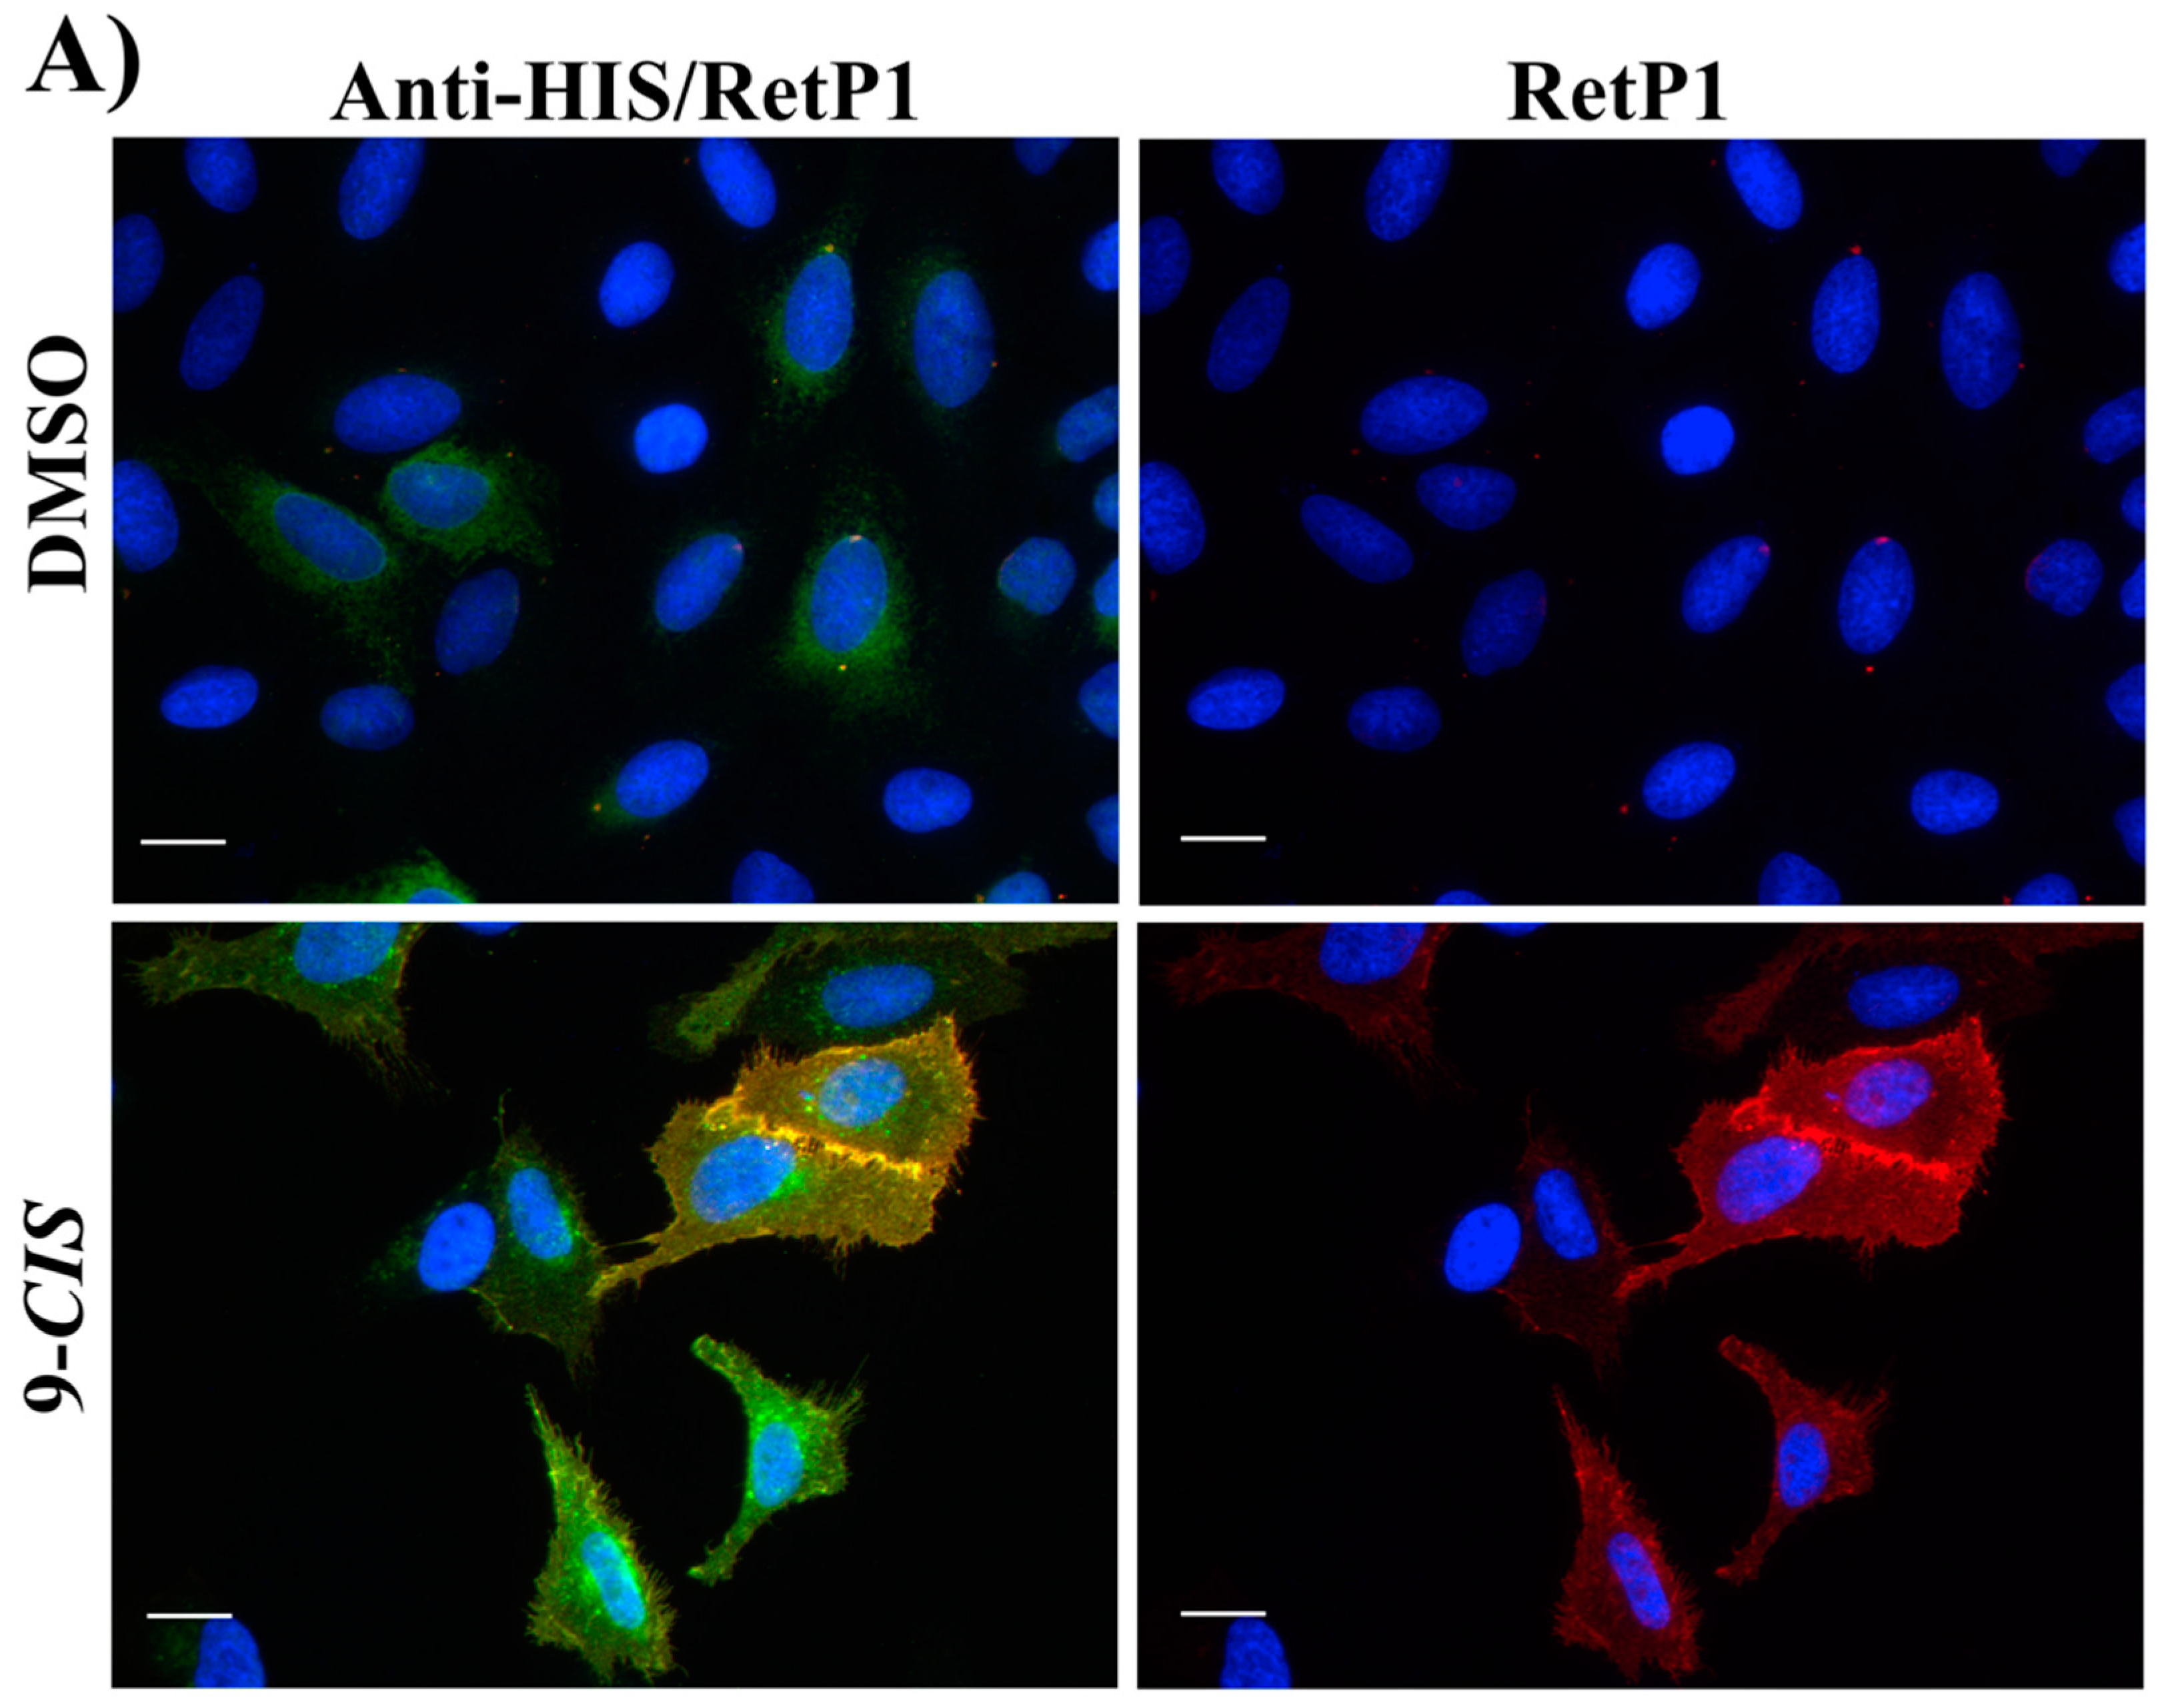
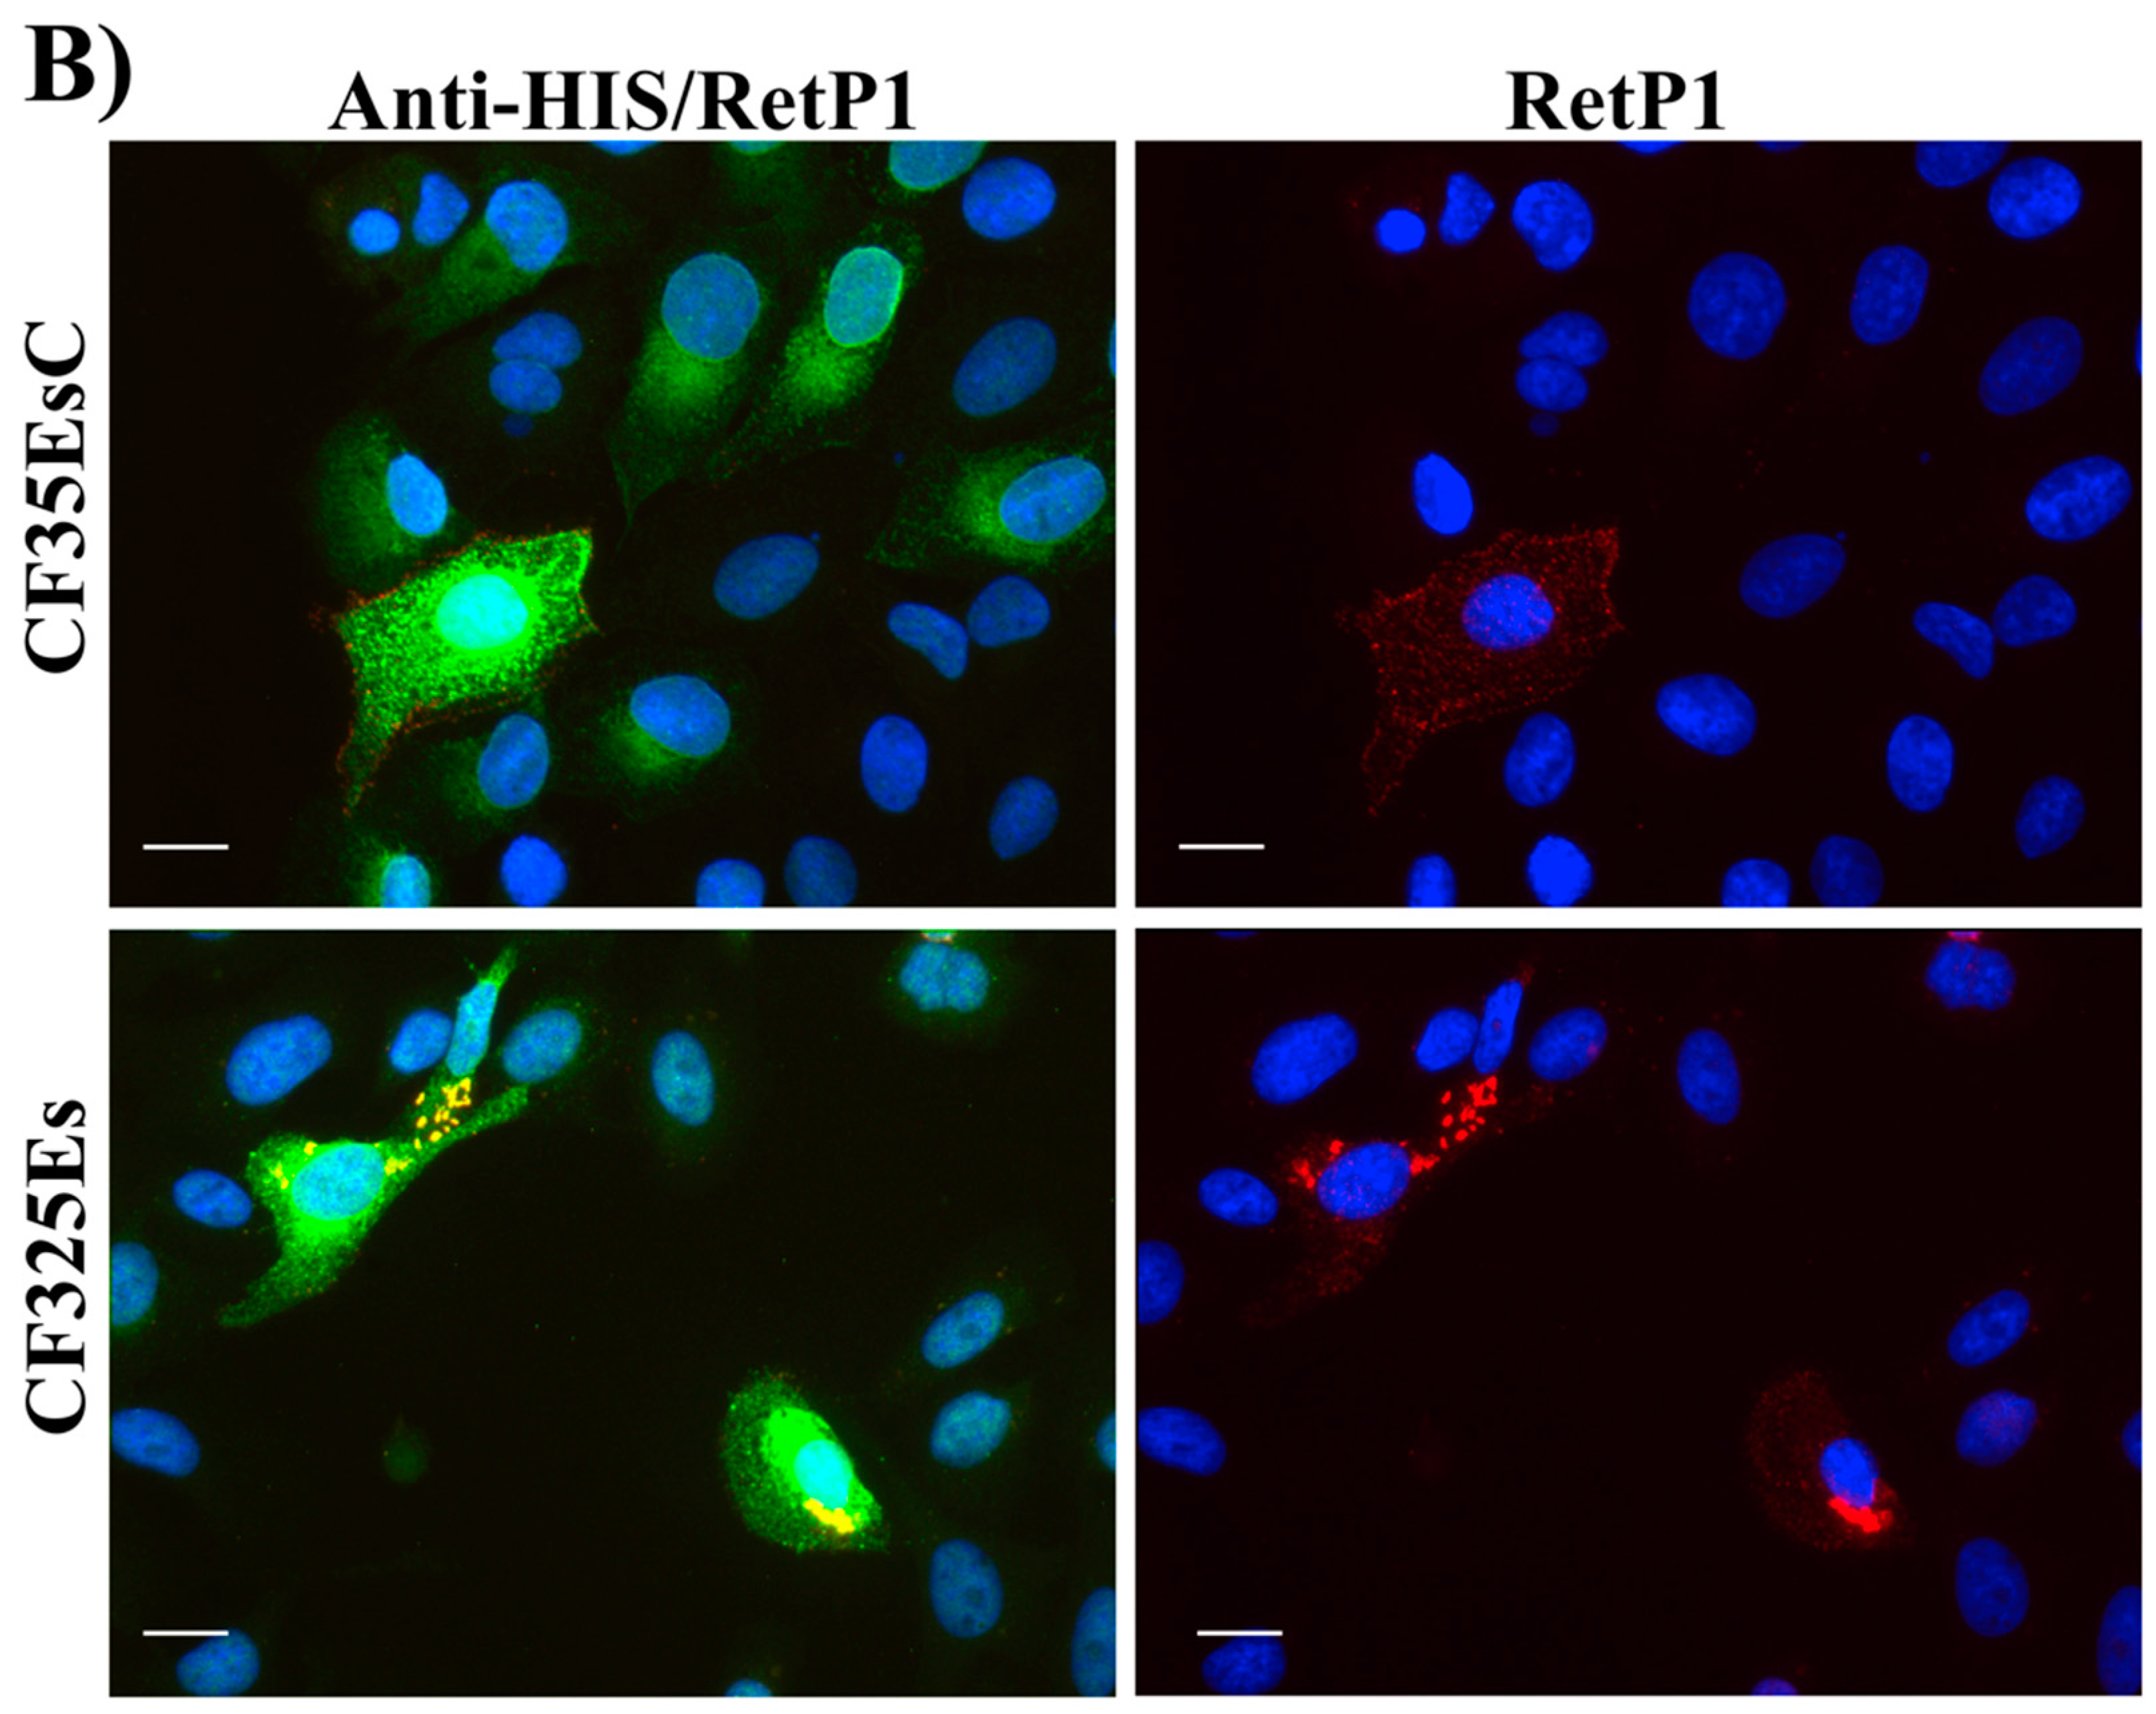
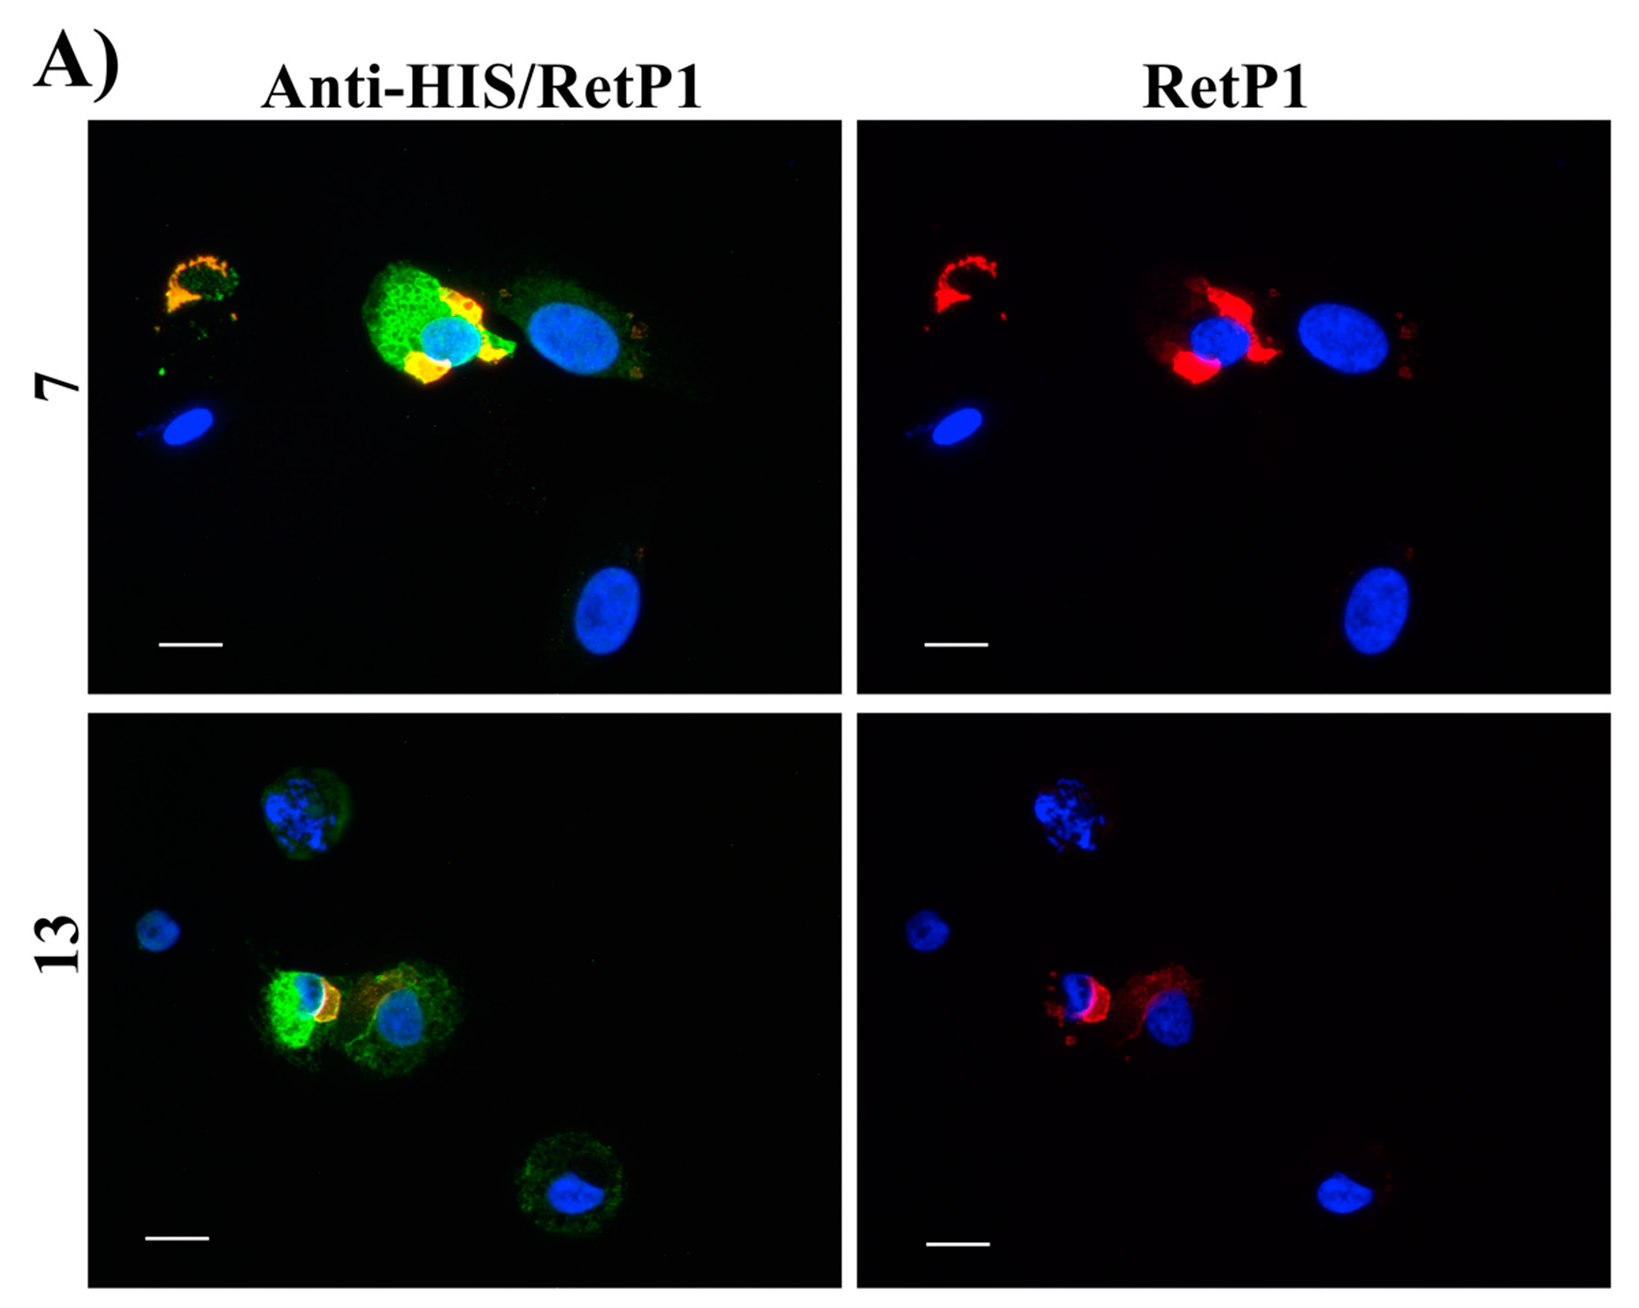
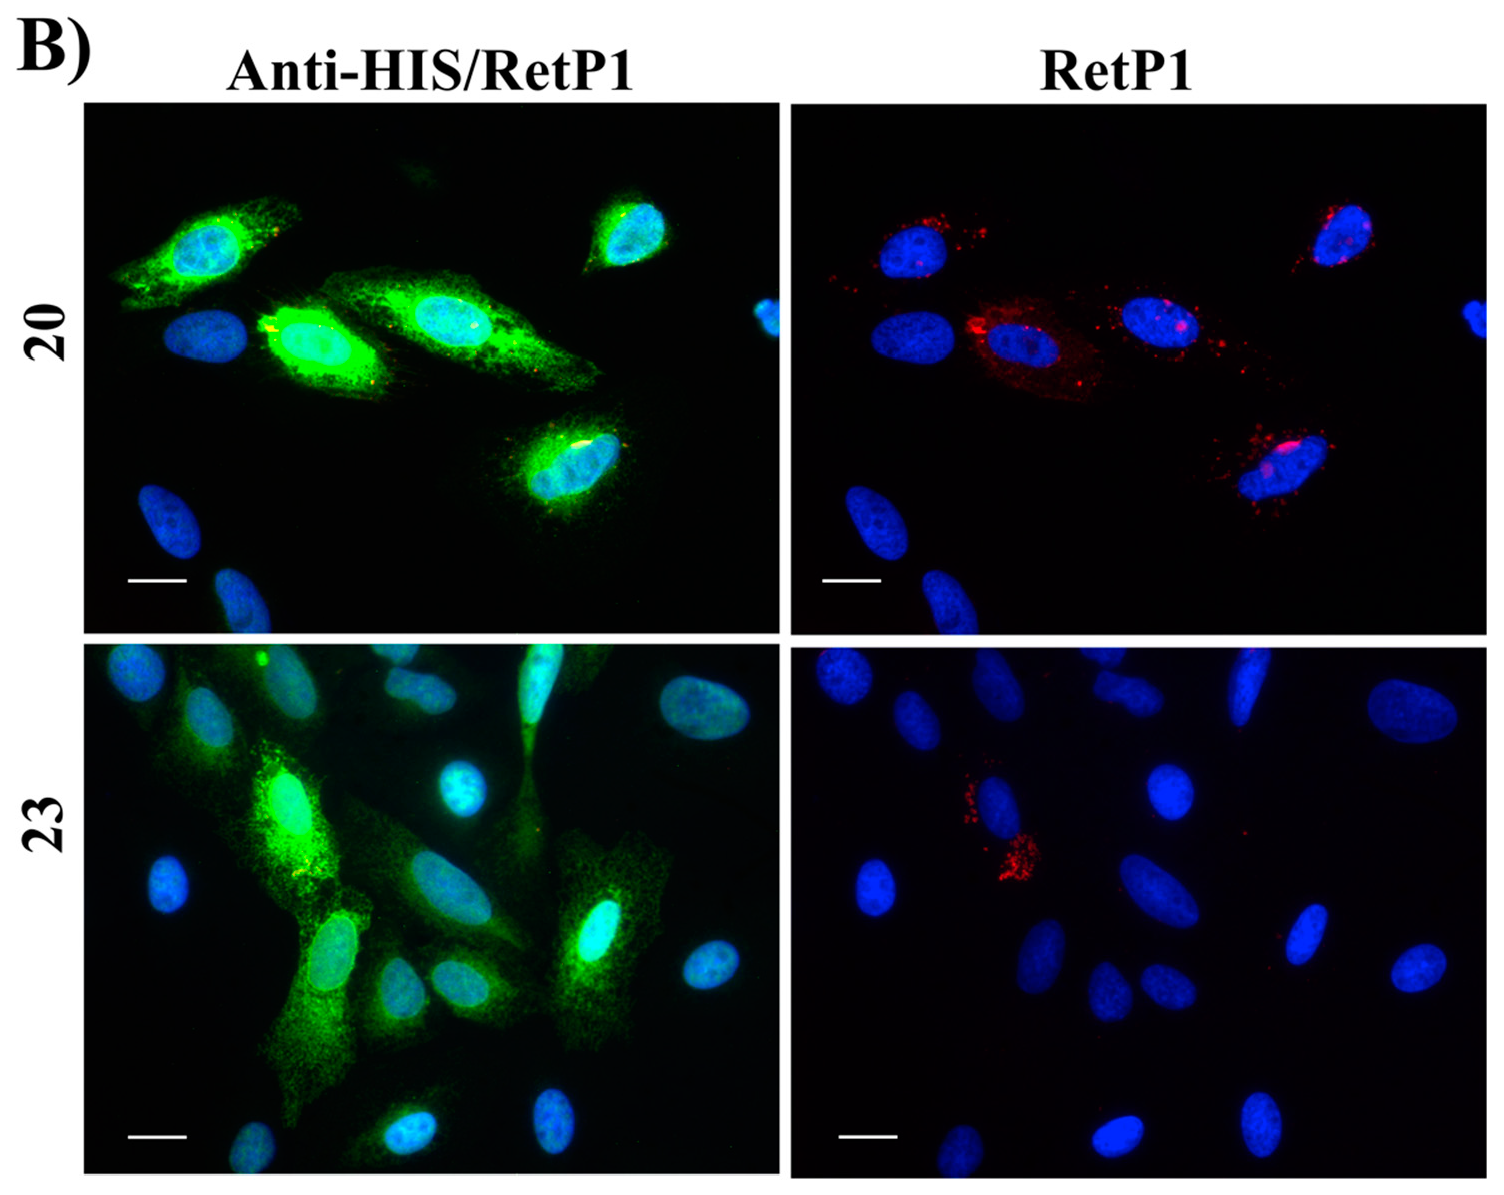
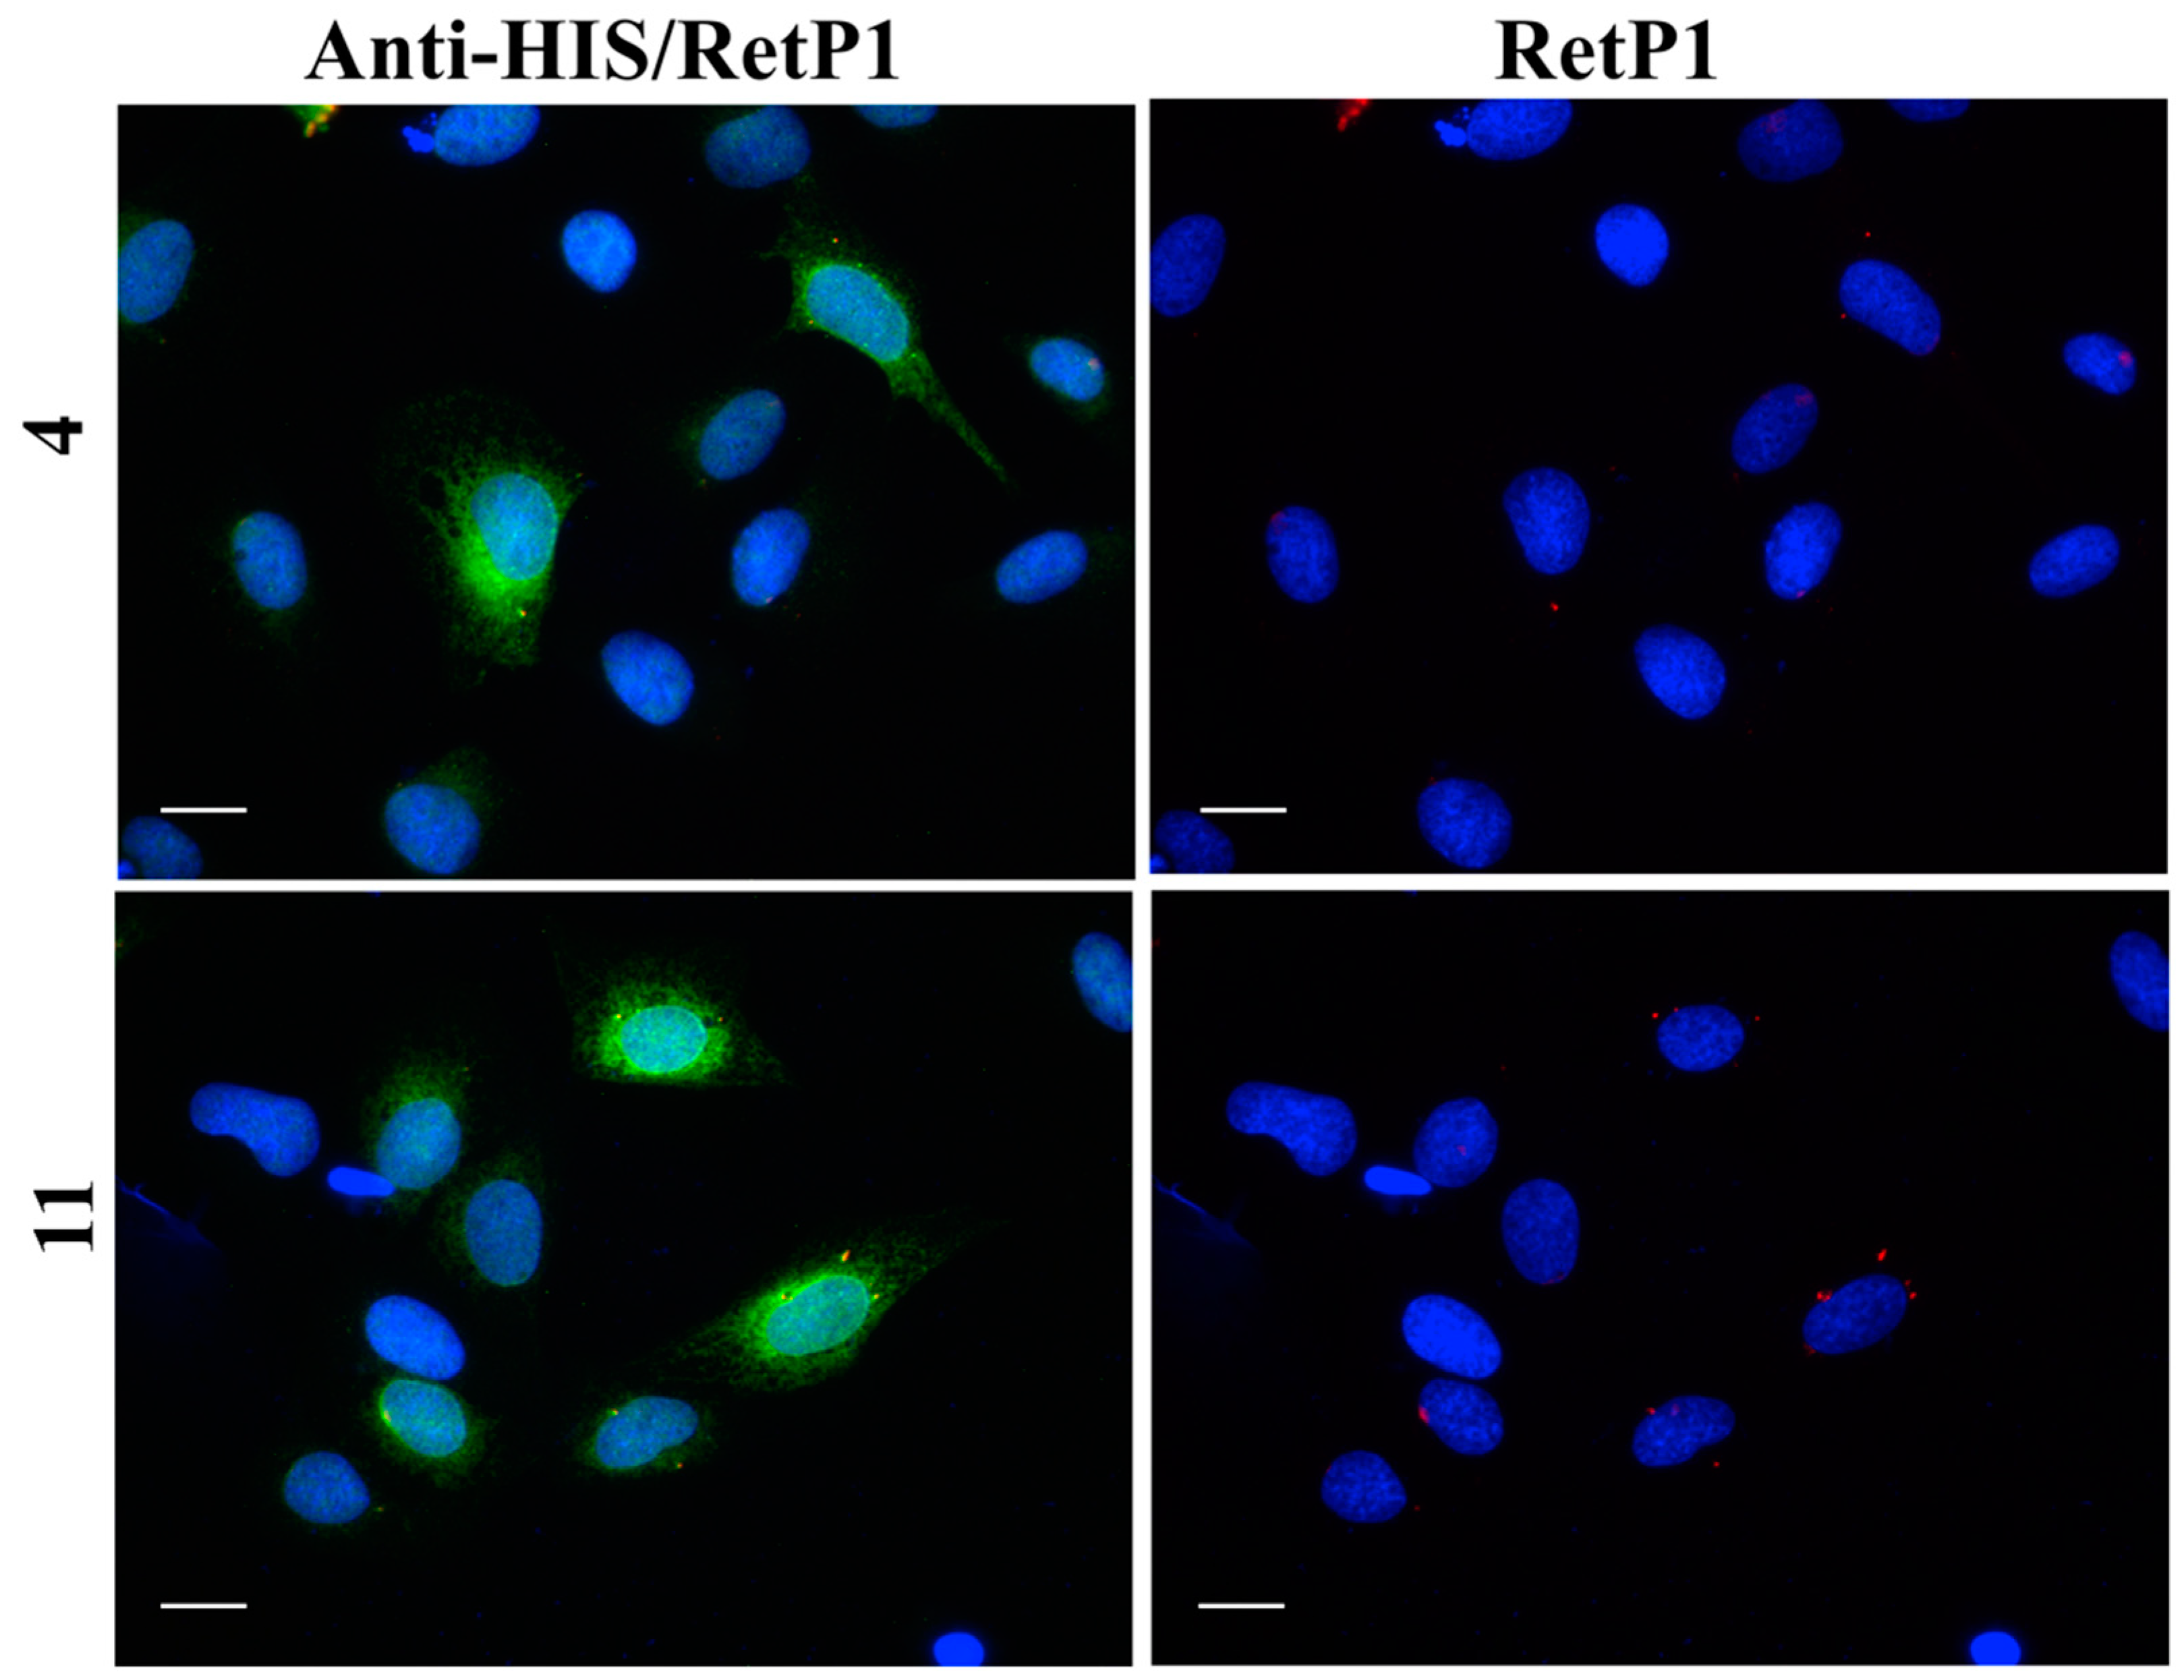
2.6. Immunofluorescence Microscopy
3. Conclusions and Future Works
4. Materials and Methods
4.1. Molecular Modelling
4.1.1. Molecular Docking
- Ability of a compound to overall occupy the binding site;
- Number of interactions formed between the compound and the target protein (H-bonds, pi–pi interactions, etc.);
- Coverage of different chemical scaffolds, discarding similar chemical entities.
4.1.2. Molecular Dynamics
4.1.3. Molecular Field-Based Similarity and Electrostatic Complementarity Studies
4.2. Biological Assays
4.2.1. Retina Outer Segments (ROSs) Isolation from Bovine Eyes
4.2.2. Competitive Binding Assay
4.2.3. Cell Culture
4.2.4. Determination of Cell Viability Assessed by CellTiter-Blue
4.2.5. Plasmids and Generation of the Stable Cell Lines
4.2.6. Immunofluorescence Microscopy
Supplementary Materials
Author Contributions
Funding
Acknowledgments
Conflicts of Interest
References
- Kiser, P.D.; Golczak, M.; Palczewski, K. Chemistry of the retinoid (visual) cycle. Chem. Rev. 2014, 114, 194–232. [Google Scholar] [CrossRef] [PubMed]
- Orban, T.; Jastrzebska, B.; Palczewski, K. Structural approaches to understanding retinal proteins needed for vision. Curr. Opin. Cell Biol. 2014, 27, 32–43. [Google Scholar] [CrossRef] [PubMed]
- Dias, M.F.; Joo, K.; Kemp, J.A.; Fialho, S.L.; da Silva Cunha, A., Jr.; Woo, S.J.; Kwon, Y.J. Molecular genetics and emerging therapies for retinitis pigmentosa: Basic research and clinical perspectives. Prog. Retin. Eye Res. 2018, 63, 107–131. [Google Scholar] [CrossRef] [PubMed]
- Den Hollander, A.I.; Roepman, R.; Koenekoop, R.K.; Cremers, F.P. Leber congenital amaurosis: Genes, proteins and disease mechanisms. Prog. Retin. Eye Res. 2008, 27, 391–419. [Google Scholar] [CrossRef] [PubMed]
- Zhang, S.X.; Sanders, E.; Fliesler, S.J.; Wang, J.J. Endoplasmic reticulum stress and the unfolded protein responses in retinal degeneration. Exp. Eye Res. 2014, 125, 30–40. [Google Scholar] [CrossRef]
- Noorwez, S.M.; Ostrov, D.A.; McDowell, J.H.; Krebs, M.P.; Kaushal, S. A high-throughput screening method for small-molecule pharmacologic chaperones of misfolded rhodopsin. Investig. Ophthalmol. Vis. Sci. 2008, 49, 3224–3230. [Google Scholar] [CrossRef]
- Chen, Y.; Chen, Y.; Jastrzebska, B.; Golczak, M.; Gulati, S.; Tang, H.; Gao, S. A novel small molecule chaperone of rod opsin and its potential therapy for retinal degeneration. Nat. Comm. 2018, 9, 1976. [Google Scholar] [CrossRef]
- Ohgane, K.; Dodo, K.; Hashimoto, Y. Retinobenzaldehydes as proper-trafficking inducers of folding-defective P23H rhodopsin mutant responsible for retinitis pigmentosa. Bioorg. Med. Chem. 2010, 18, 7022–7028. [Google Scholar] [CrossRef]
- Okada, T.; Sugihara, M.; Bondar, A.N.; Elstner, M.; Entel, P.; Buss, V. The retinal conformation and its environment in rhodopsin in light of a new 2.2 Å crystal structure. J. Mol. Biol. 2004, 342, 571–583. [Google Scholar] [CrossRef]
- Specs. Available online: https://www.specs.net/index.php#aboutspecs (accessed on 26 July 2020).
- Matsumoto, H.; Yoshizawa, T. Existence of a β-ionone ring-binding site in the rhodopsin molecule. Nature 1975, 258, 523–526. [Google Scholar] [CrossRef]
- Daemen, F.J.M. The chromophore binding space of opsin. Nature 1978, 276, 847–848. [Google Scholar] [CrossRef] [PubMed]
- Makino, C.L.; Riley, C.K.; Looney, J.; Crouch, R.K.; Okada, T. Binding of more than one retinoid to visual opsins. Biophys.J. 2010, 99, 2366–2373. [Google Scholar] [CrossRef] [PubMed]
- Schrödinger Release 2020-2; Glide Schrödinger LLC: New York, NY, USA, 2020; Available online: https://www.schrodinger.com/maestro (accessed on 26 July 2020).
- Korb, O.; Stutzle, T.; Exner, T.E. Empirical scoring functions for advanced protein-ligand docking with PLANTS. J. Chem. Inf. Model. 2009, 49, 84–96. [Google Scholar] [CrossRef]
- SeeSAR, version 9.2; BioSolveIT GmbH: Sankt Augustin, Germany, 2020; Available online: www.biosolveit.de/SeeSAR (accessed on 26 July 2020).
- Palczewski, K. Retinoids for treatment of retinal diseases. Trends Pharm. Sci. 2010, 31, 284–295. [Google Scholar] [CrossRef]
- Isayama, T.; England, S.M.; Crouch, R.K.; Zimmerman, A.L.; Makino, C.L. β-ionone activates and bleaches visual pigment in salamander photoreceptors. Vis. Neurosci. 2009, 26, 67–274. [Google Scholar] [CrossRef]
- Ortega, J.T.; Parmar, T.; Jastrzebska, B. Flavonoids enhance rod opsin stability, folding, and self-association by directly binding to ligand-free opsin and modulating its conformation. J. Biol. Chem. 2019, 294, 8101–8122. [Google Scholar] [CrossRef]
- SmartsFilter, Web App from UNM (University of New Mexico) Translational Informatic. Available online: http://pasilla.health.unm.edu/tomcat/biocomp/smartsfilter (accessed on 26 July 2020).
- Steling, T.; Irwin, J.J. ZINC 15-Ligand Discovery for Everyone. Chem. Inf. Model. 2015, 55, 2324–2337. [Google Scholar] [CrossRef] [PubMed]
- D. E. Shaw Research (Ed.) Schrödinger Release 2020-2; Shaw Research: New York, NY, USA, 2020; Available online: https://www.schrodinger.com/maestro (accessed on 26 July 2020).
- Maestro-Desmond Interoperability Tools, version 3.1.; Schrödinger: New York, NY, USA, 2020; Available online: https://www.schrodinger.com/maestro (accessed on 26 July 2020).
- Schrödinger Release 2020-2: Prime; Schrödinger, LLC: New York, NY, USA, 2020; Available online: https://www.schrodinger.com/maestro (accessed on 26 July 2020).
- Forge, version 3.0.; Cresset: Peterborough, UK, 2020; Available online: http://www.cresset-group.com/forge/ (accessed on 26 July 2020).
- Cheeseright, T.; Mackey, M.; Rose, S.; Vinter, A. Molecular field extrema as descriptors of biological activity: Definition and validation. J. Chem. Inf. Model. 2006, 46, 665–676. [Google Scholar] [CrossRef]
- FieldTemplater; in Forge, version 3.0.; Cresset: Litlington, UK, 2020; Available online: http://www.cresset-group.com/forge/ (accessed on 26 July 2020).
- Flare, version 4.0.; Cresset: Peterborough, UK, 2020; Available online: http://www.cresset-group.com/flare/ (accessed on 26 July 2020).
- Bauer, M.R.; Mackey, M.D. Electrostatic complementarity as fast and effective tool to optimize binding and selectivity of protein-ligand complexes. J. Med. Chem. 2019, 62, 3036–3050. [Google Scholar] [CrossRef]
- Schadel, S.A.; Heck, M.; Maretzki, D.; Filipek, S.; Teller, D.C.; Palczewski, K.; Hofmann, K.P. Ligand channeling within a G-protein-coupled receptor. J. Biol. Chem. 2003, 278, 24896–24903. [Google Scholar] [CrossRef] [PubMed]
- Park, H.J.; Heck, M.; Maretzki, D.; Filipek, S.; Teller, D.C.; Palczewski, K.; Hofmann, K.P. Crystal structure of the ligand-free G-protein-coupled receptor opsin. Nature 2008, 454, 183–187. [Google Scholar] [CrossRef] [PubMed]
- Behnen, P.; Felline, A.; Comitato, A.; Di Salvo, M.T.; Raimondi, F.; Gulati, S.; Fanelli, F. A small chaperone improves folding and routing of rhodopsin mutants linked to inherited blindness. iScience 2018, 4, 1–19. [Google Scholar] [CrossRef] [PubMed]
- Ramirez, T.; Felline, A.; Comitato, A.; Di Salvo, M.T.; Raimondi, F.; Gulati, S.; Fanelli, F. Prediction of liver toxicity and mode of action using metabolomics in vitro in HepG2 cells. Arch. Toxicol. 2018, 92, 893–906. [Google Scholar] [CrossRef] [PubMed]
- Saliba, R.S.; Munro, P.M.; Luthert, P.J.; Cheetham, M.E. The cellular fate of mutant rhodopsin: Quality control, degradation and aggresome formation. J. Cell Sci. 2002, 115, 2907–2918. [Google Scholar] [PubMed]
- Molecular Operating Environment (MOE 2019.10); Chemical Computing Group, Inc.: Montreal, QC, Canada; Available online: http://www.chemcomp.com (accessed on 26 July 2020).
- Papermaster, D.S. [8] Preparation of retinal rod outer segments. Methods Enzymol. 1982, 81, 48–52. [Google Scholar]


| Compound | ∆Gbinding (kJ/mol) a ± SD |
|---|---|
| 6 | −67.08 ± 9.93 |
| 8 | −73.18 ± 6.43 |
| 9 | n.c. |
| 13 | −68.12 ± 5.76 |
| 17 | −63.93 ± 5.79 |
| 20 | −77.93 ± 5.71 |
| 21 | n.c. |
| 22 | n.c. |
| 23 | −74.30 ± 5.93 |
| CF35EsC | −60.53 ± 5.62 |
| CF35Es | −64.25 ± 4.51 |
Sample Availability: Samples of the compounds 7, 13, 20 and 23 are available from the authors. |
Publisher’s Note: MDPI stays neutral with regard to jurisdictional claims in published maps and institutional affiliations. |
© 2020 by the authors. Licensee MDPI, Basel, Switzerland. This article is an open access article distributed under the terms and conditions of the Creative Commons Attribution (CC BY) license (http://creativecommons.org/licenses/by/4.0/).
Share and Cite
Pasqualetto, G.; Schepelmann, M.; Varricchio, C.; Pileggi, E.; Khogali, C.; Morgan, S.R.; Boostrom, I.; Rozanowska, M.; Brancale, A.; Ferla, S.; et al. Computational Studies towards the Identification of Novel Rhodopsin-Binding Compounds as Chemical Chaperones for Misfolded Opsins. Molecules 2020, 25, 4904. https://doi.org/10.3390/molecules25214904
Pasqualetto G, Schepelmann M, Varricchio C, Pileggi E, Khogali C, Morgan SR, Boostrom I, Rozanowska M, Brancale A, Ferla S, et al. Computational Studies towards the Identification of Novel Rhodopsin-Binding Compounds as Chemical Chaperones for Misfolded Opsins. Molecules. 2020; 25(21):4904. https://doi.org/10.3390/molecules25214904
Chicago/Turabian StylePasqualetto, Gaia, Martin Schepelmann, Carmine Varricchio, Elisa Pileggi, Caroline Khogali, Siân R. Morgan, Ian Boostrom, Malgorzata Rozanowska, Andrea Brancale, Salvatore Ferla, and et al. 2020. "Computational Studies towards the Identification of Novel Rhodopsin-Binding Compounds as Chemical Chaperones for Misfolded Opsins" Molecules 25, no. 21: 4904. https://doi.org/10.3390/molecules25214904
APA StylePasqualetto, G., Schepelmann, M., Varricchio, C., Pileggi, E., Khogali, C., Morgan, S. R., Boostrom, I., Rozanowska, M., Brancale, A., Ferla, S., & Bassetto, M. (2020). Computational Studies towards the Identification of Novel Rhodopsin-Binding Compounds as Chemical Chaperones for Misfolded Opsins. Molecules, 25(21), 4904. https://doi.org/10.3390/molecules25214904