
ST09, A Novel Curcumin Derivative, Blocks Cell Migration by Inhibiting Matrix Metalloproteases in Breast Cancer Cells and Inhibits Tumor Progression in EAC Mouse Tumor Models

 ,
,  ,
,  , ,
, ,  and
and
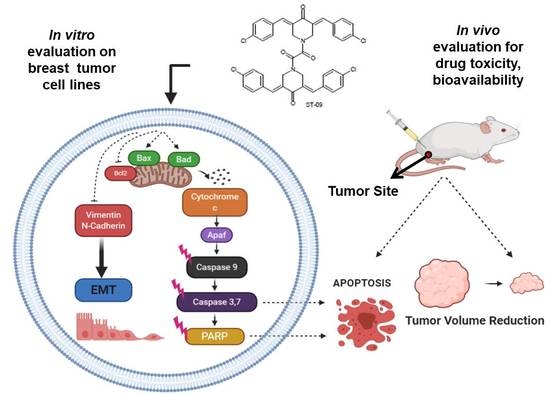
Abstract
1. Introduction
2. Materials and Methods
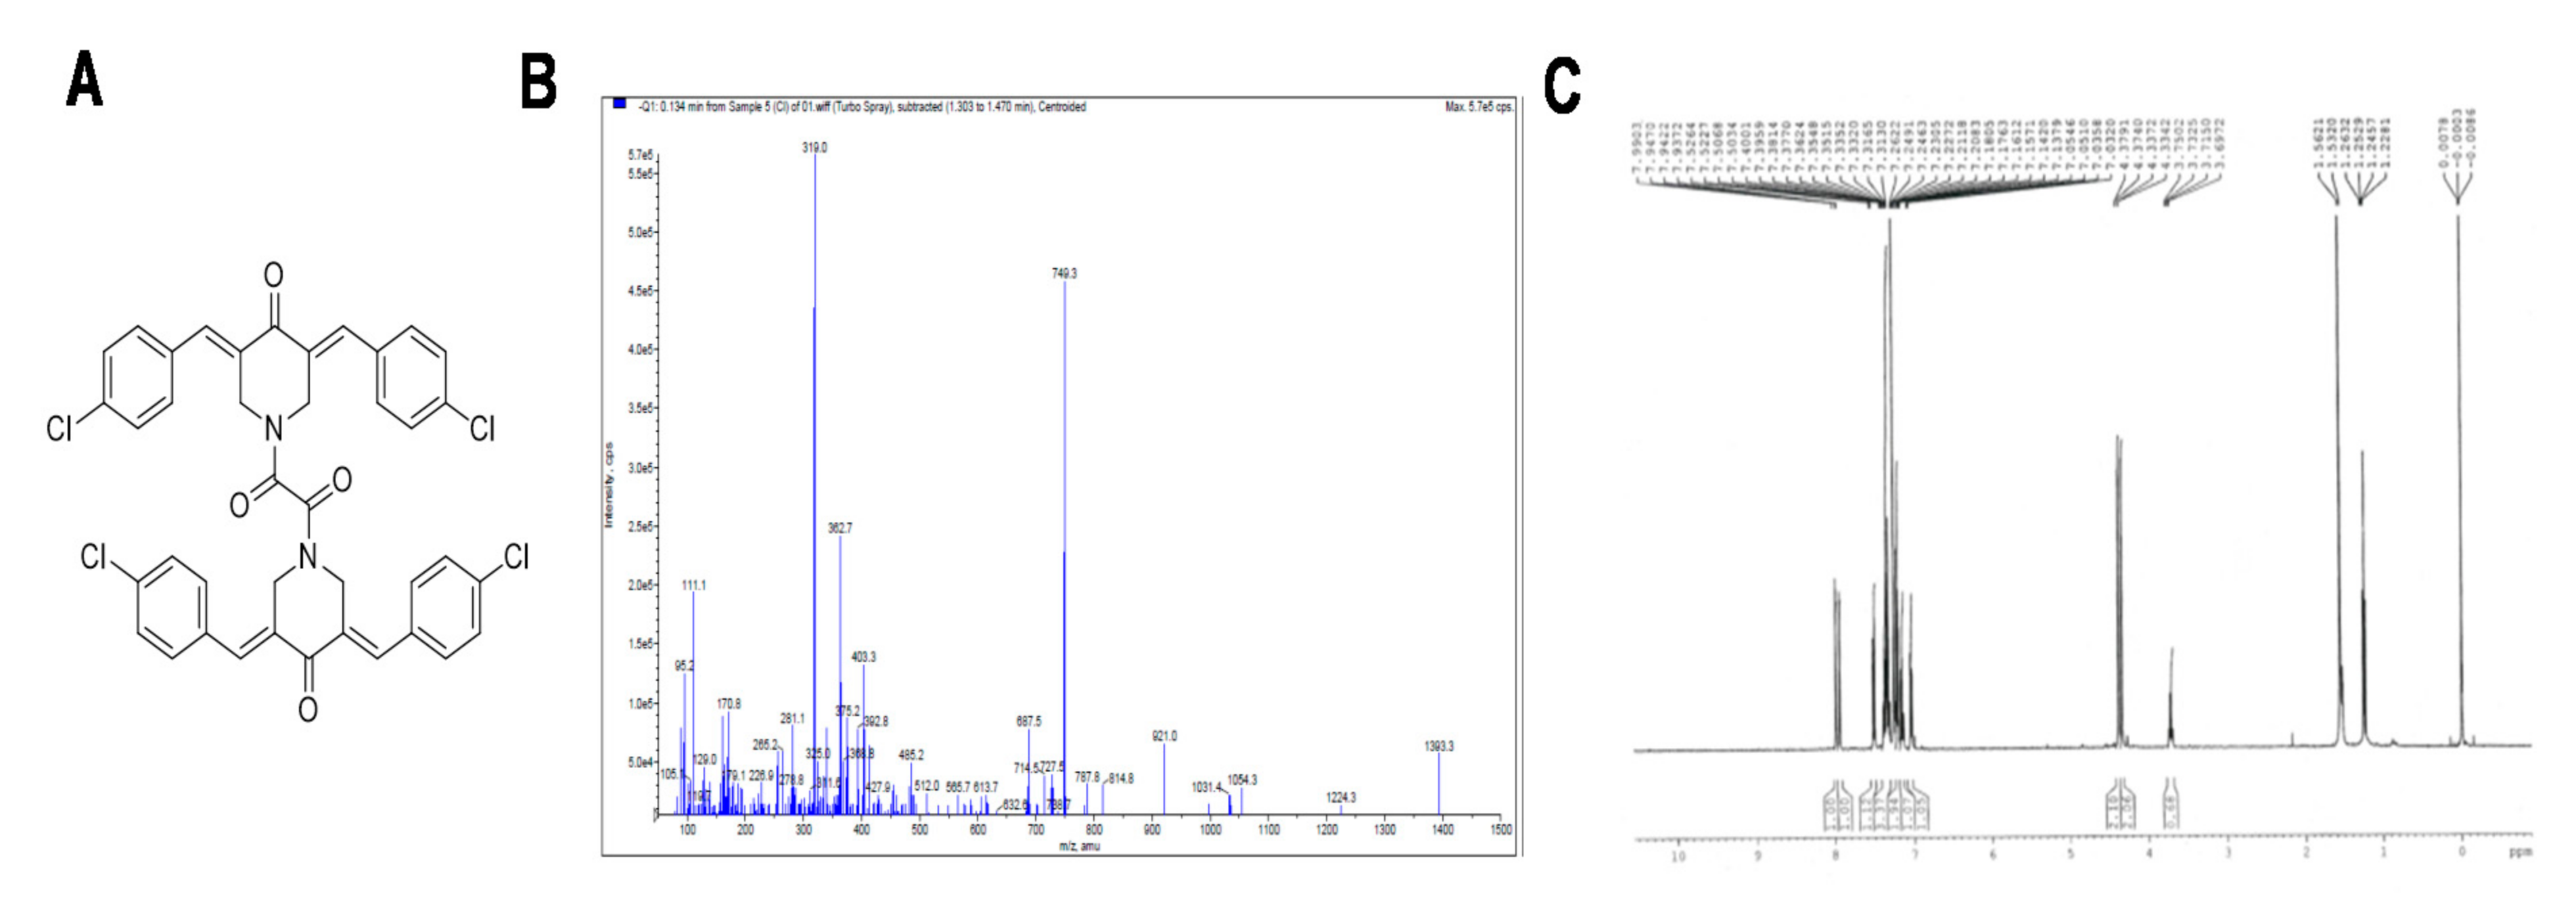
2.1. Chemistry
2.2. Procedure for the Synthesis of ST09
2.3. Chemicals and Reagents
2.4. Cell Culture
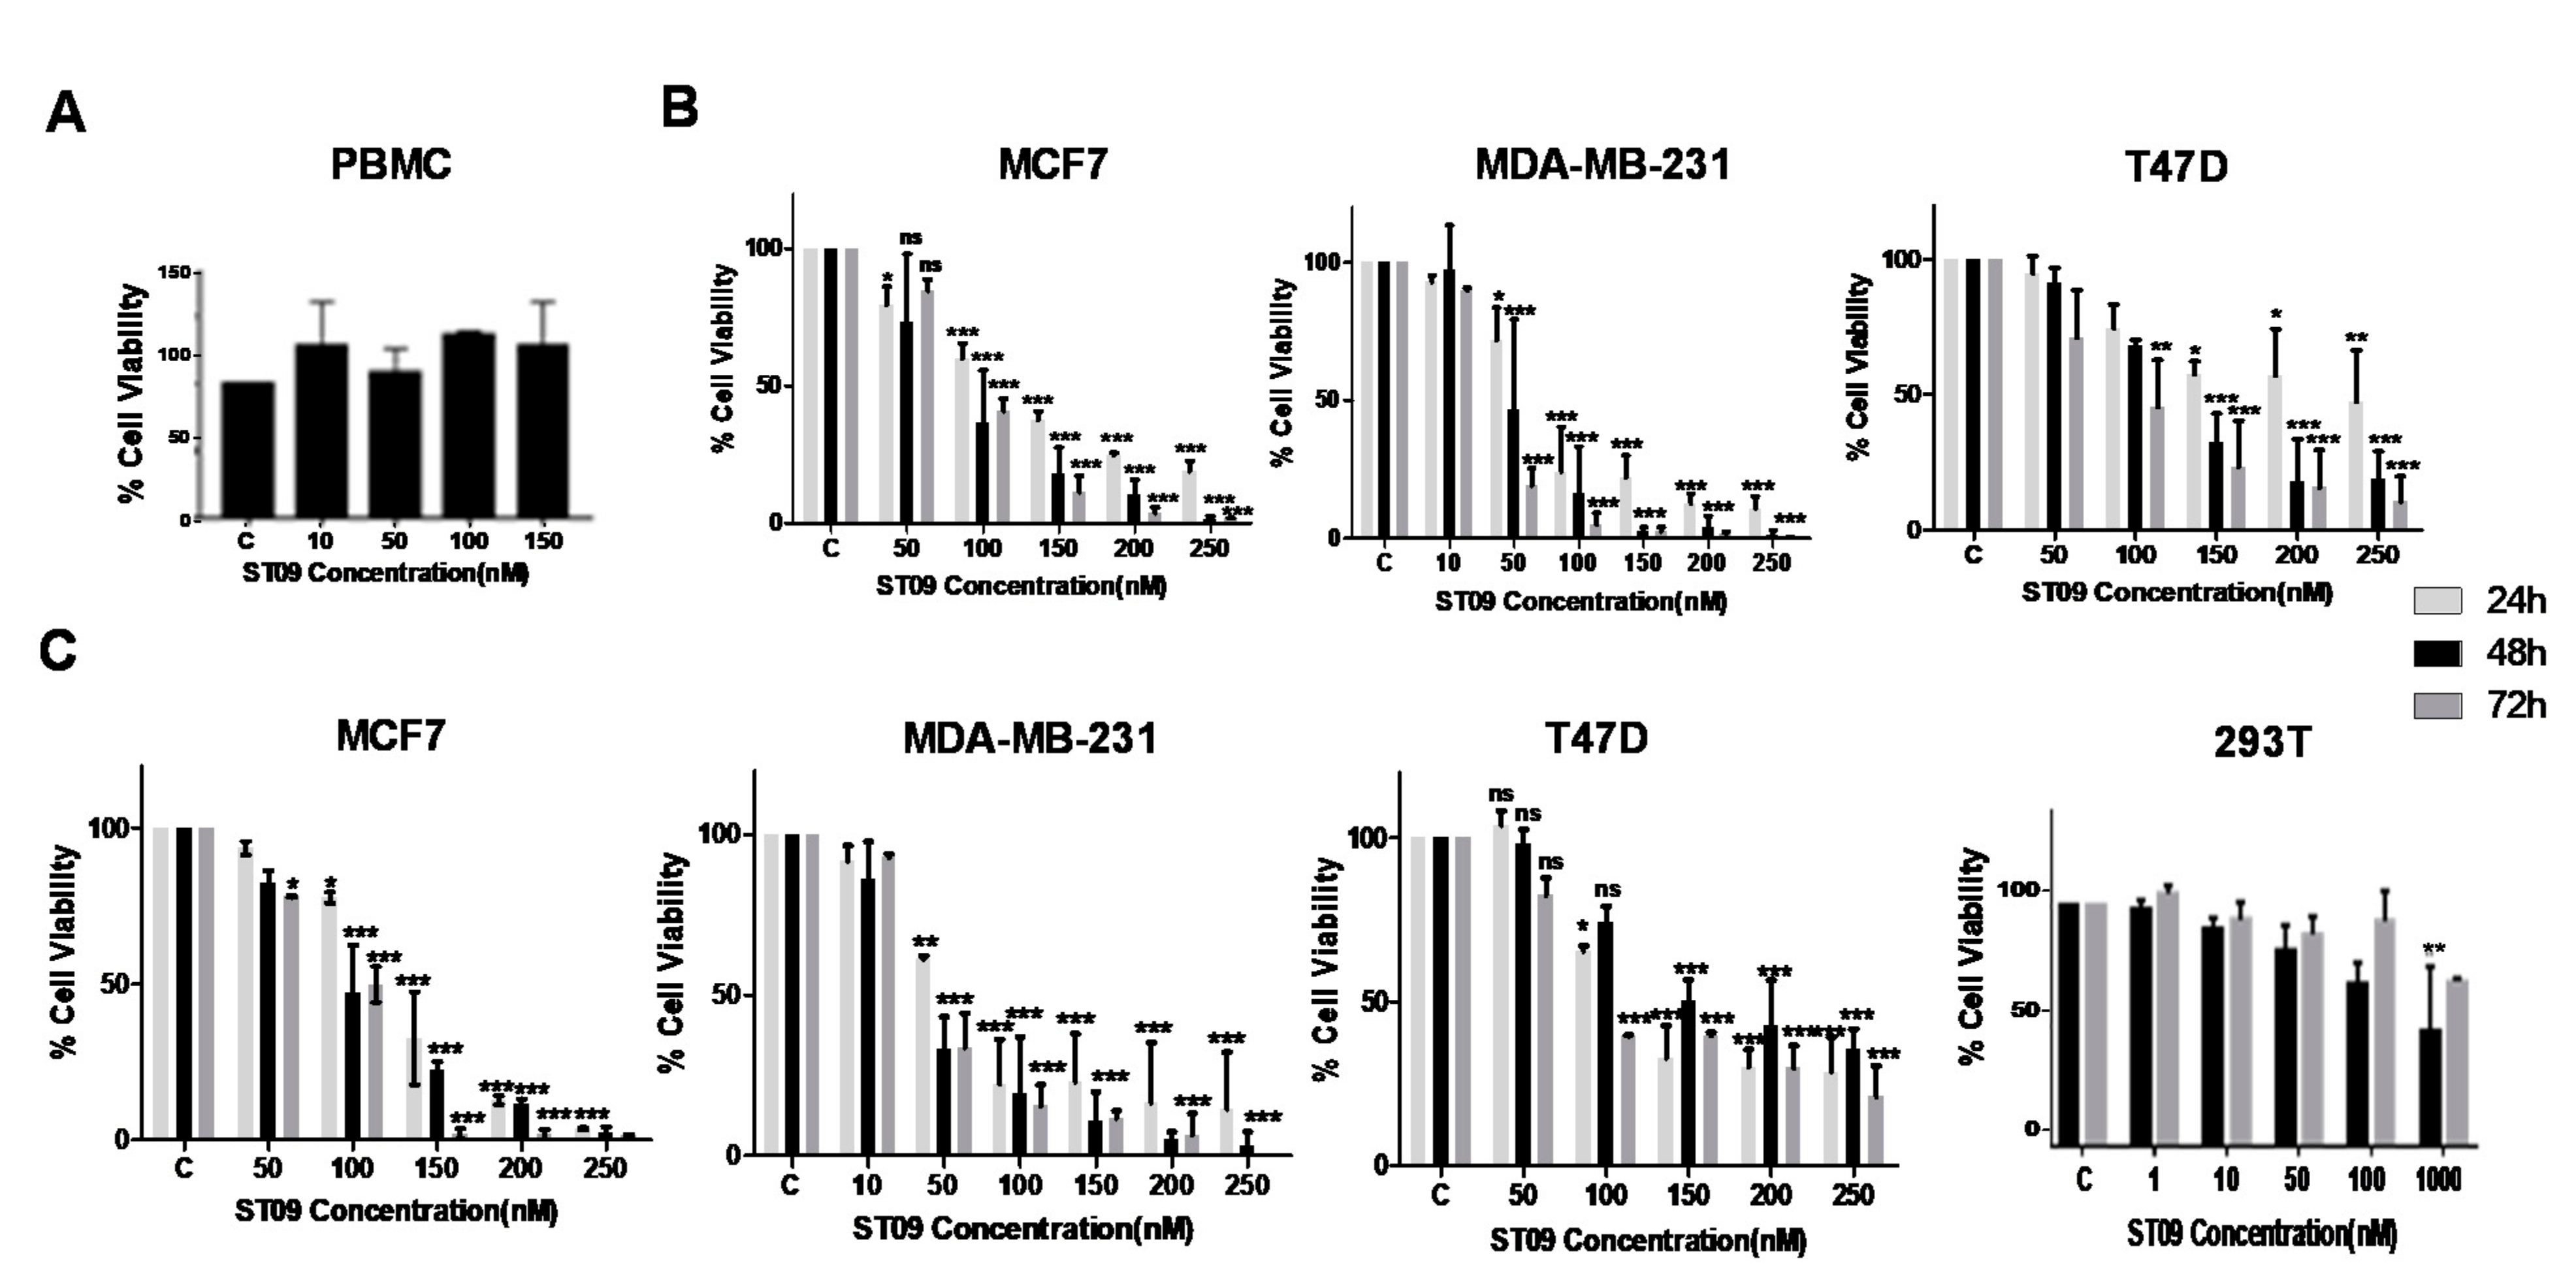
2.5. MTT Assay
2.6. LDH Assay
2.7. Trypan Blue Exclusion Assay
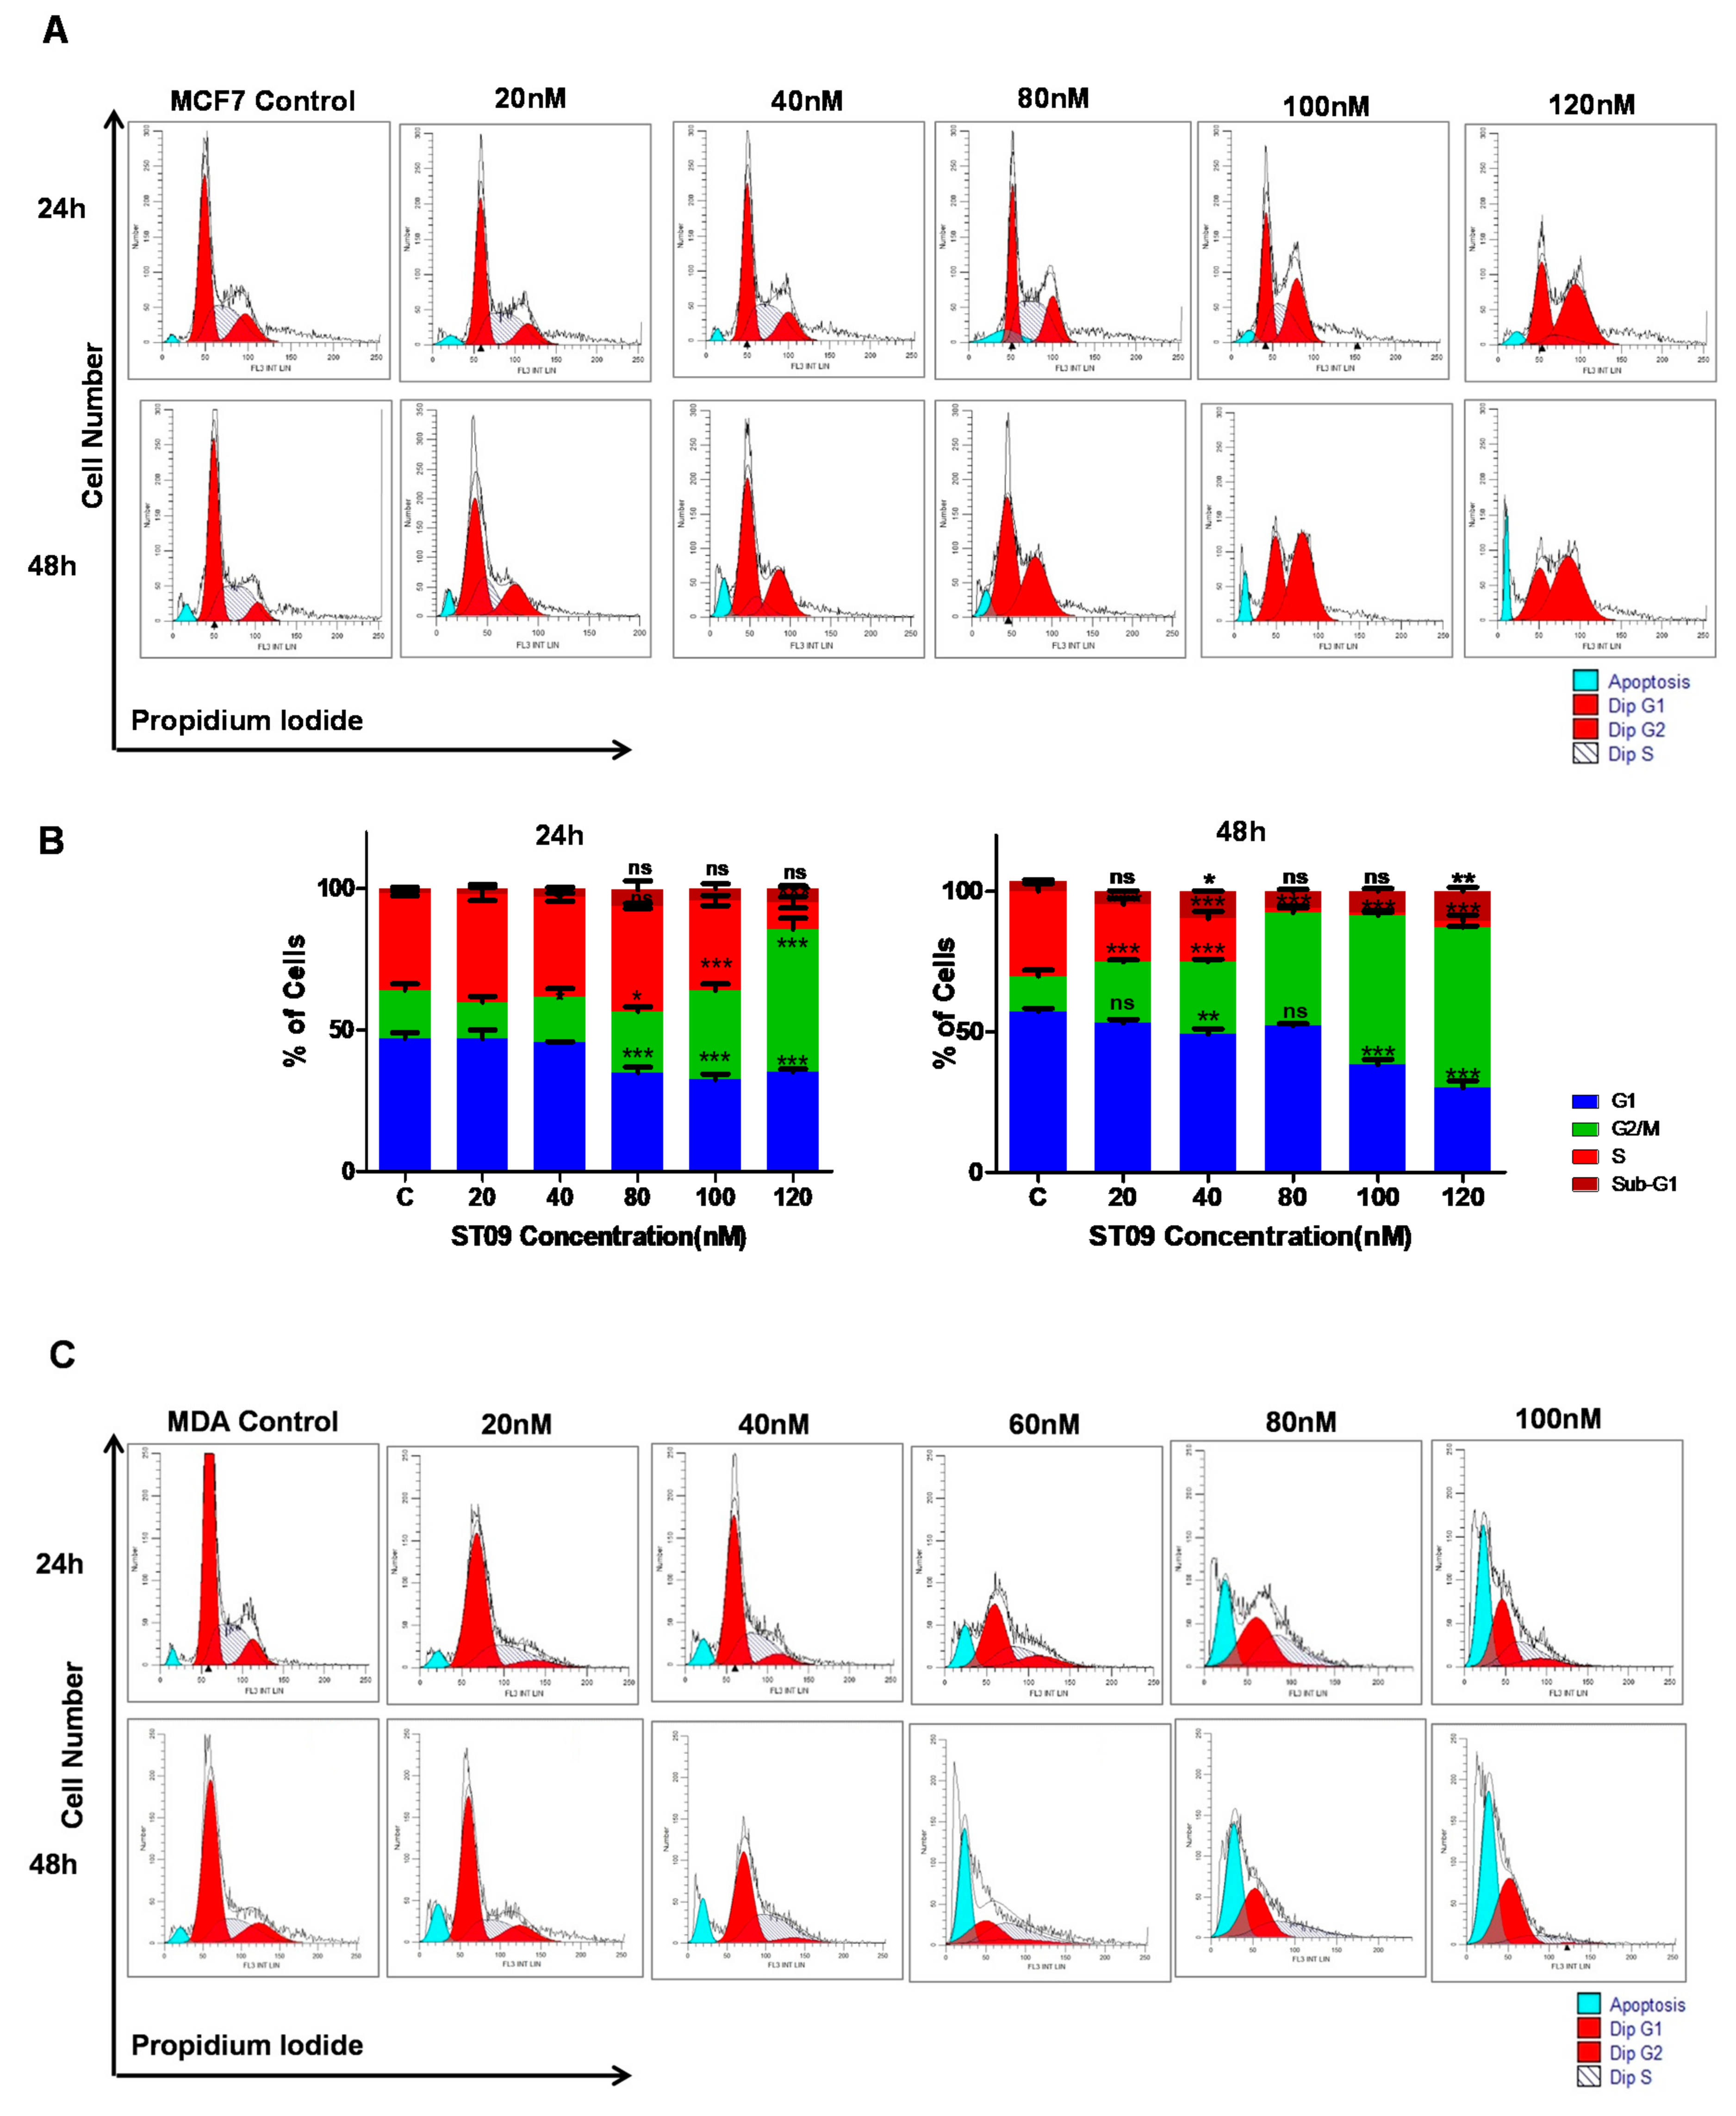
2.8. Cell Cycle Analysis
2.9. Apoptosis Assay
2.10. JC1 Staining
2.11. Transwell Migration and Invasion Assay
2.12. Breast Adenocarcinoma Tumor Model
2.13. Drug Toxicity and Side Effect Assessment on ST09 Treatment
2.14. Histological Analysis of Tumor Tissues
2.15. Immunoblotting
2.16. Flow Cytometry for Lymphocyte Analysis
2.17. Statistical Analysis
3. Results
3.1. Characterization of ST09
3.2. ST09 Exerts a Cytotoxic Effect on All Three Cell Lines with IC50 Values in the Nanomolar Range and Least Cytotoxicity on Normal Cells
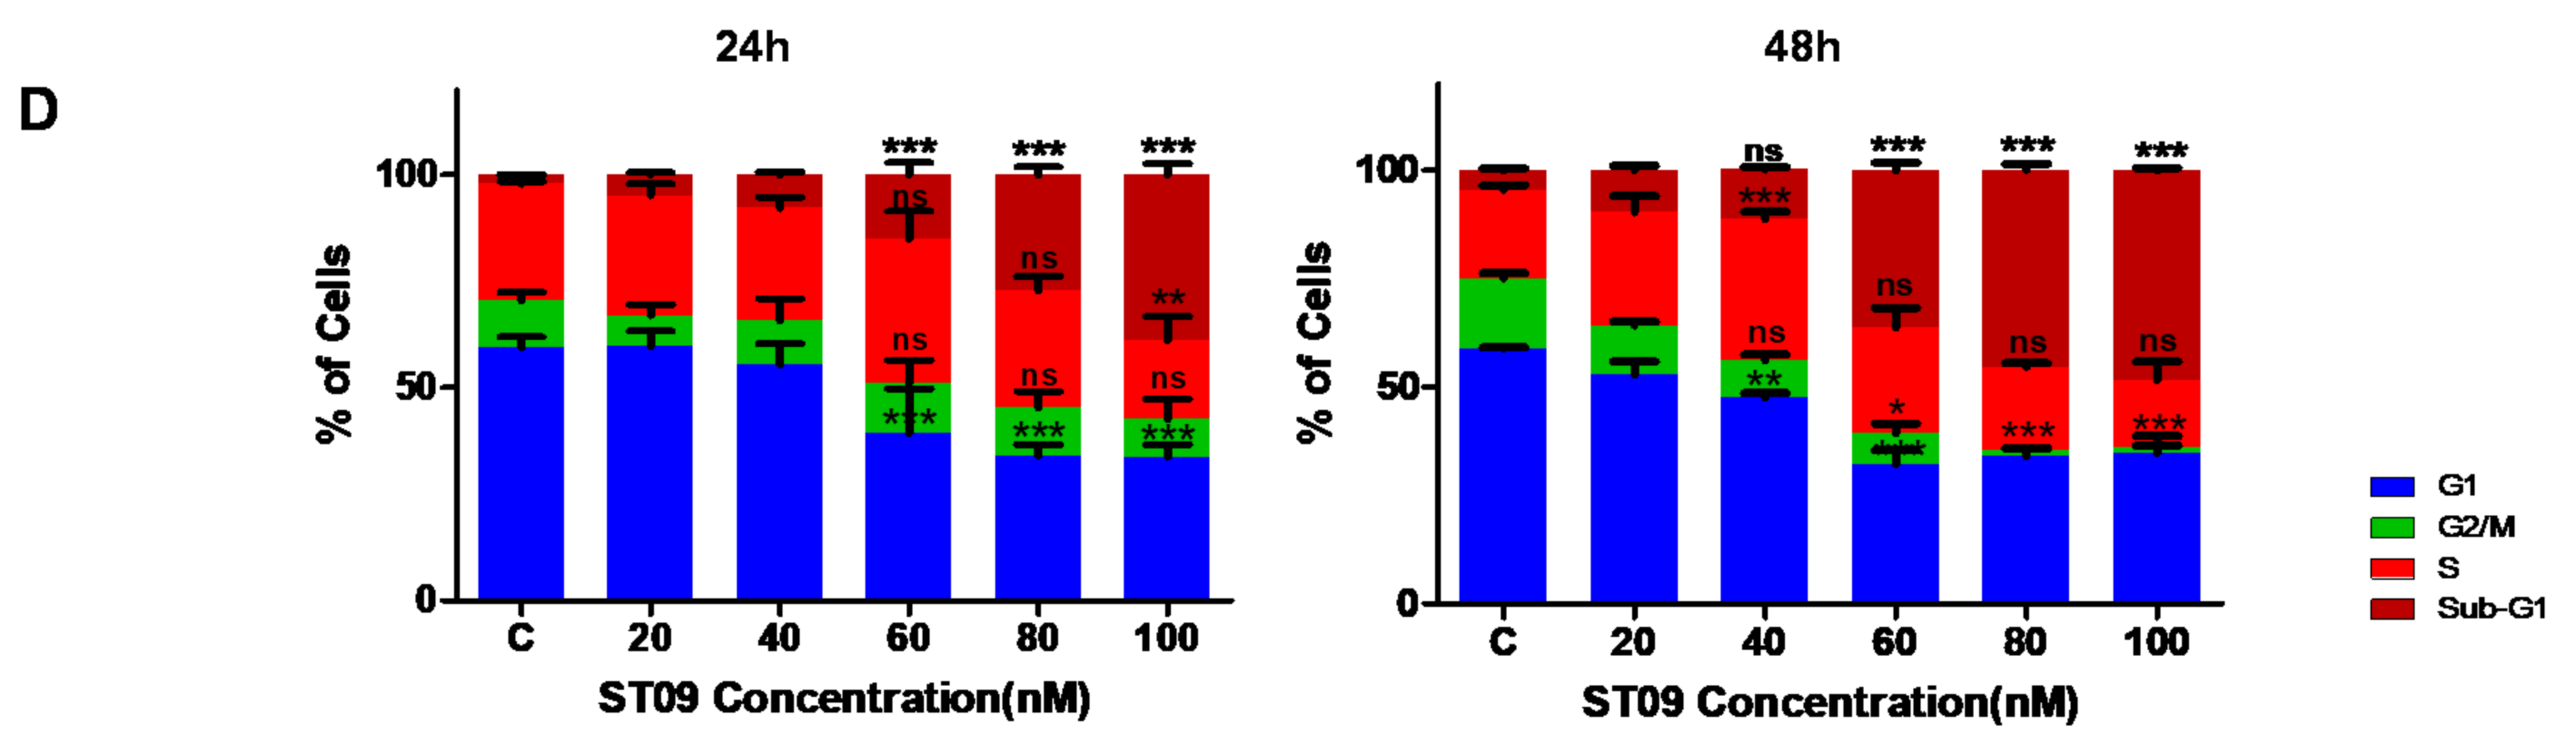
3.3. ST09 Arrests the Progression of Cell Cycle by G2/M Arrest in MCF7 and an Increase in the Sub-G1 Population in MDA-MB-231 Cells
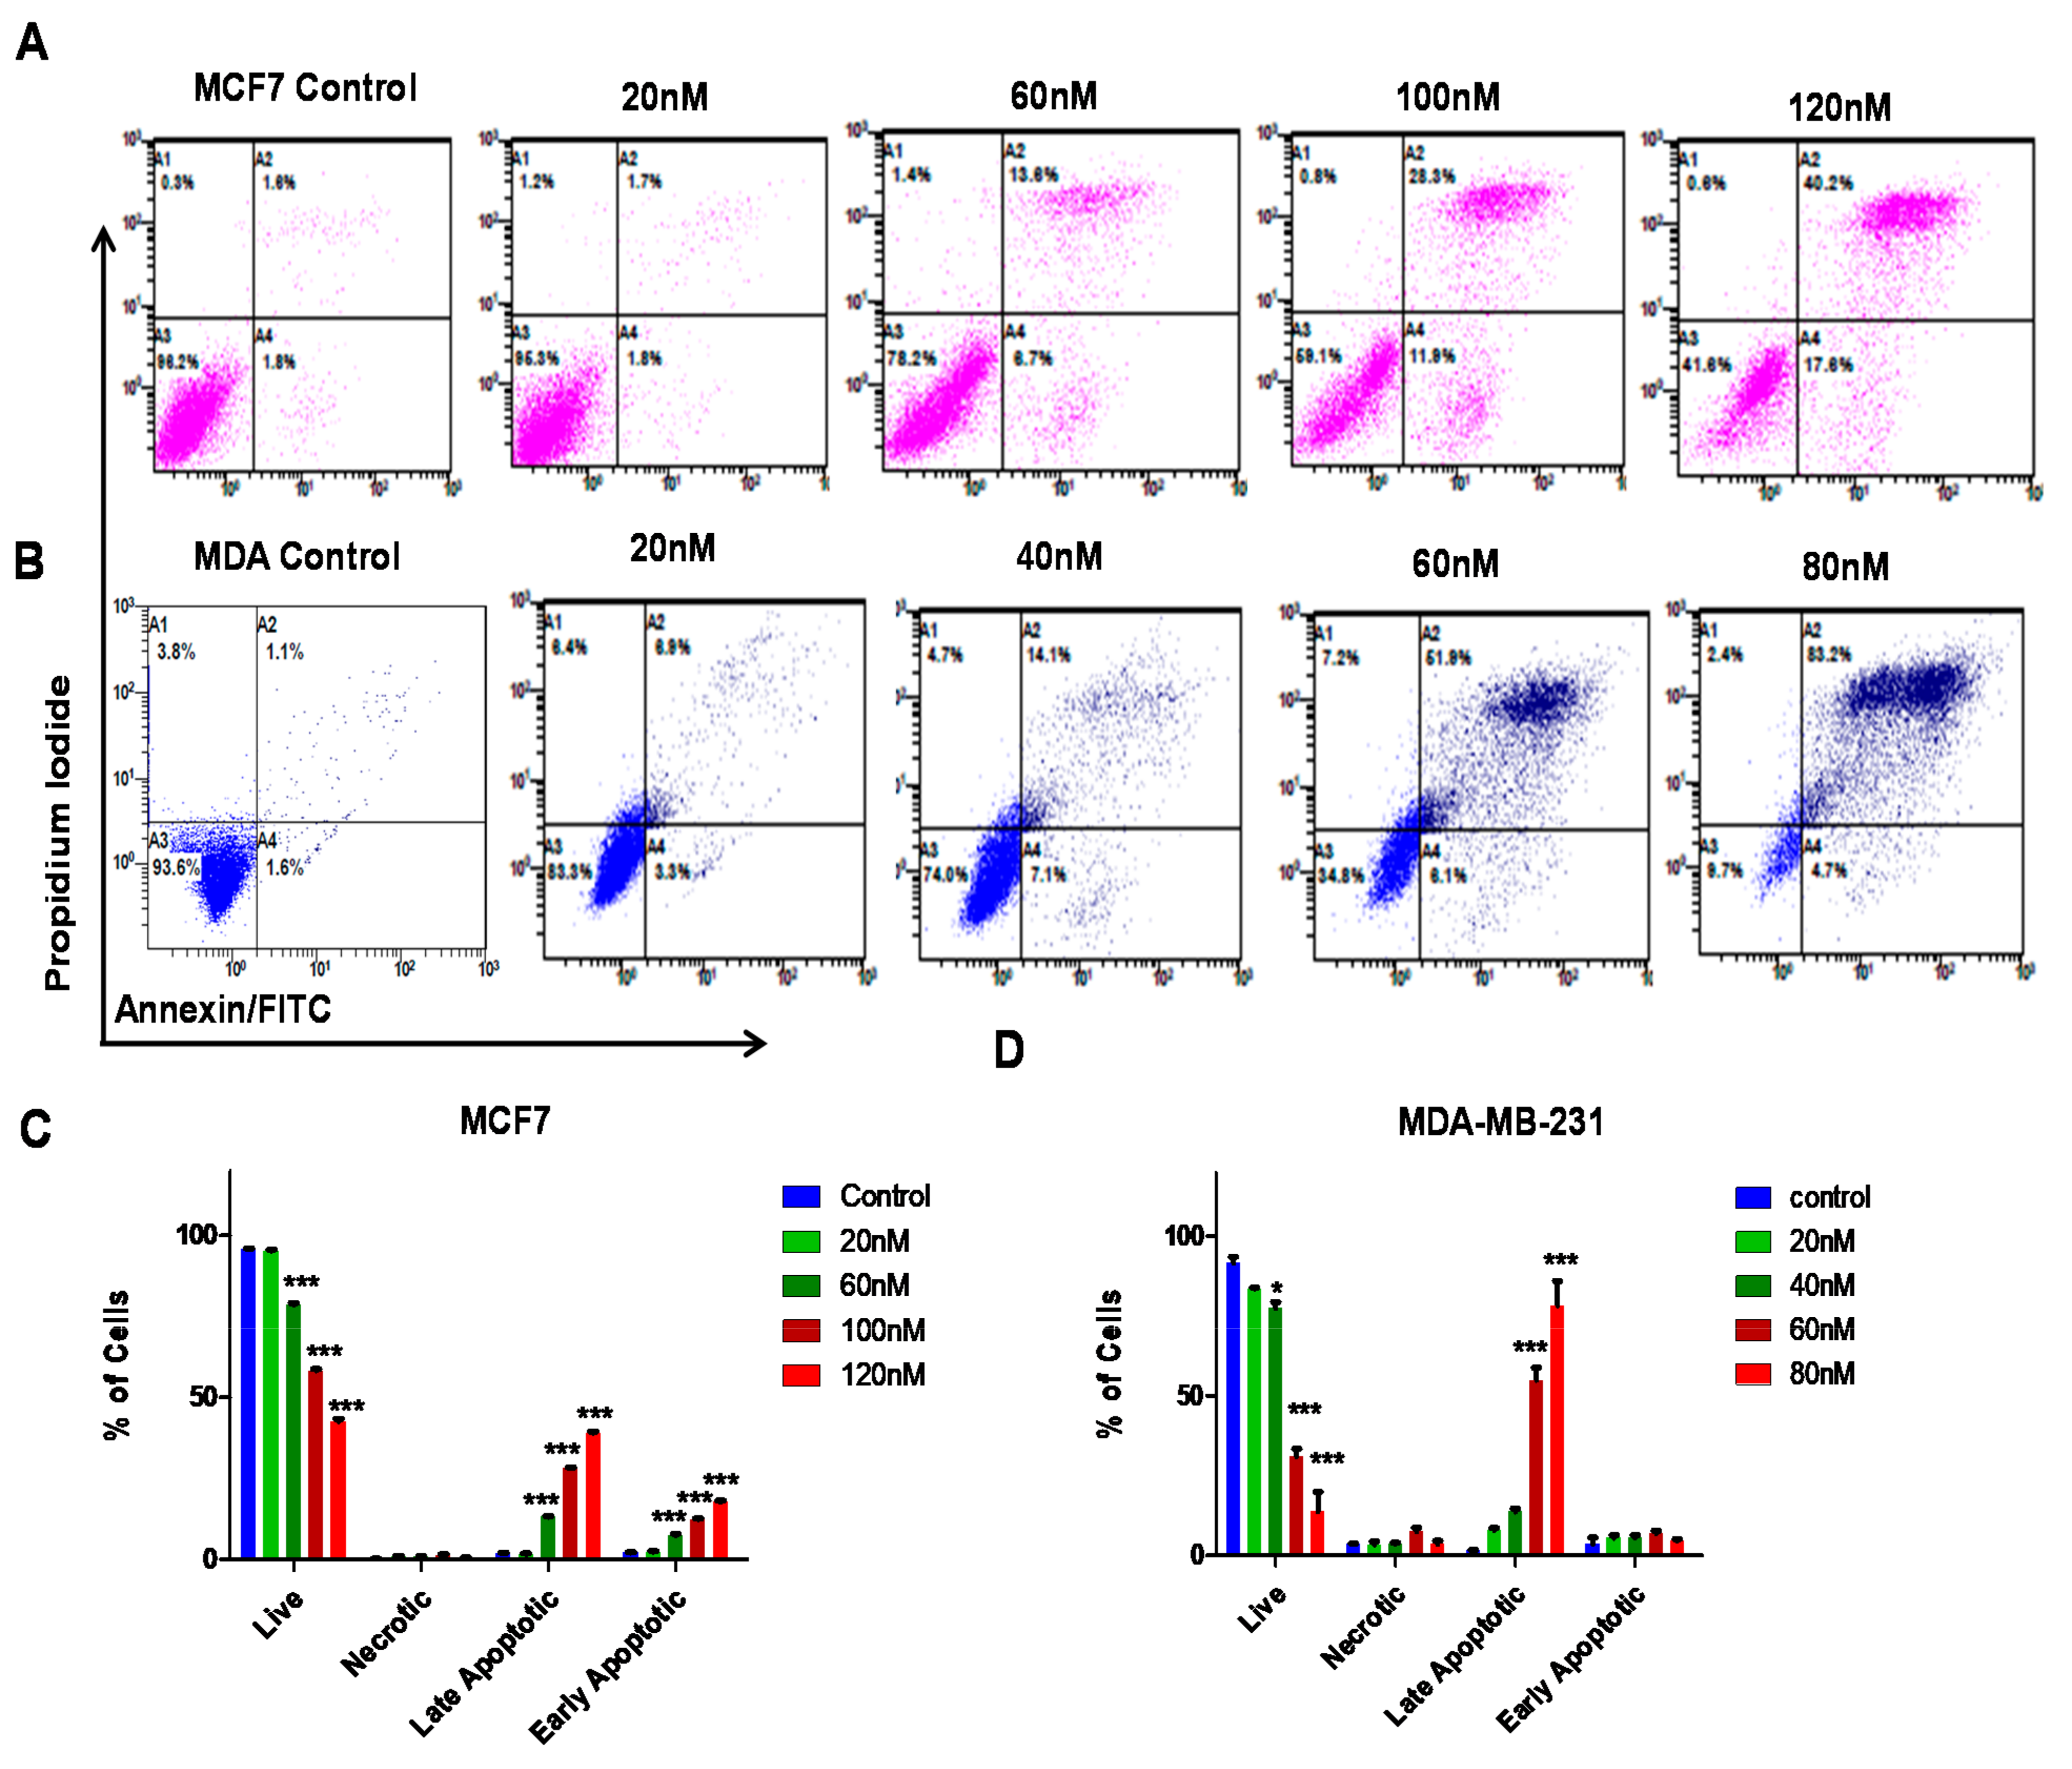
3.4. ST09 Induces Apoptosis in Human Breast Cancer Cells
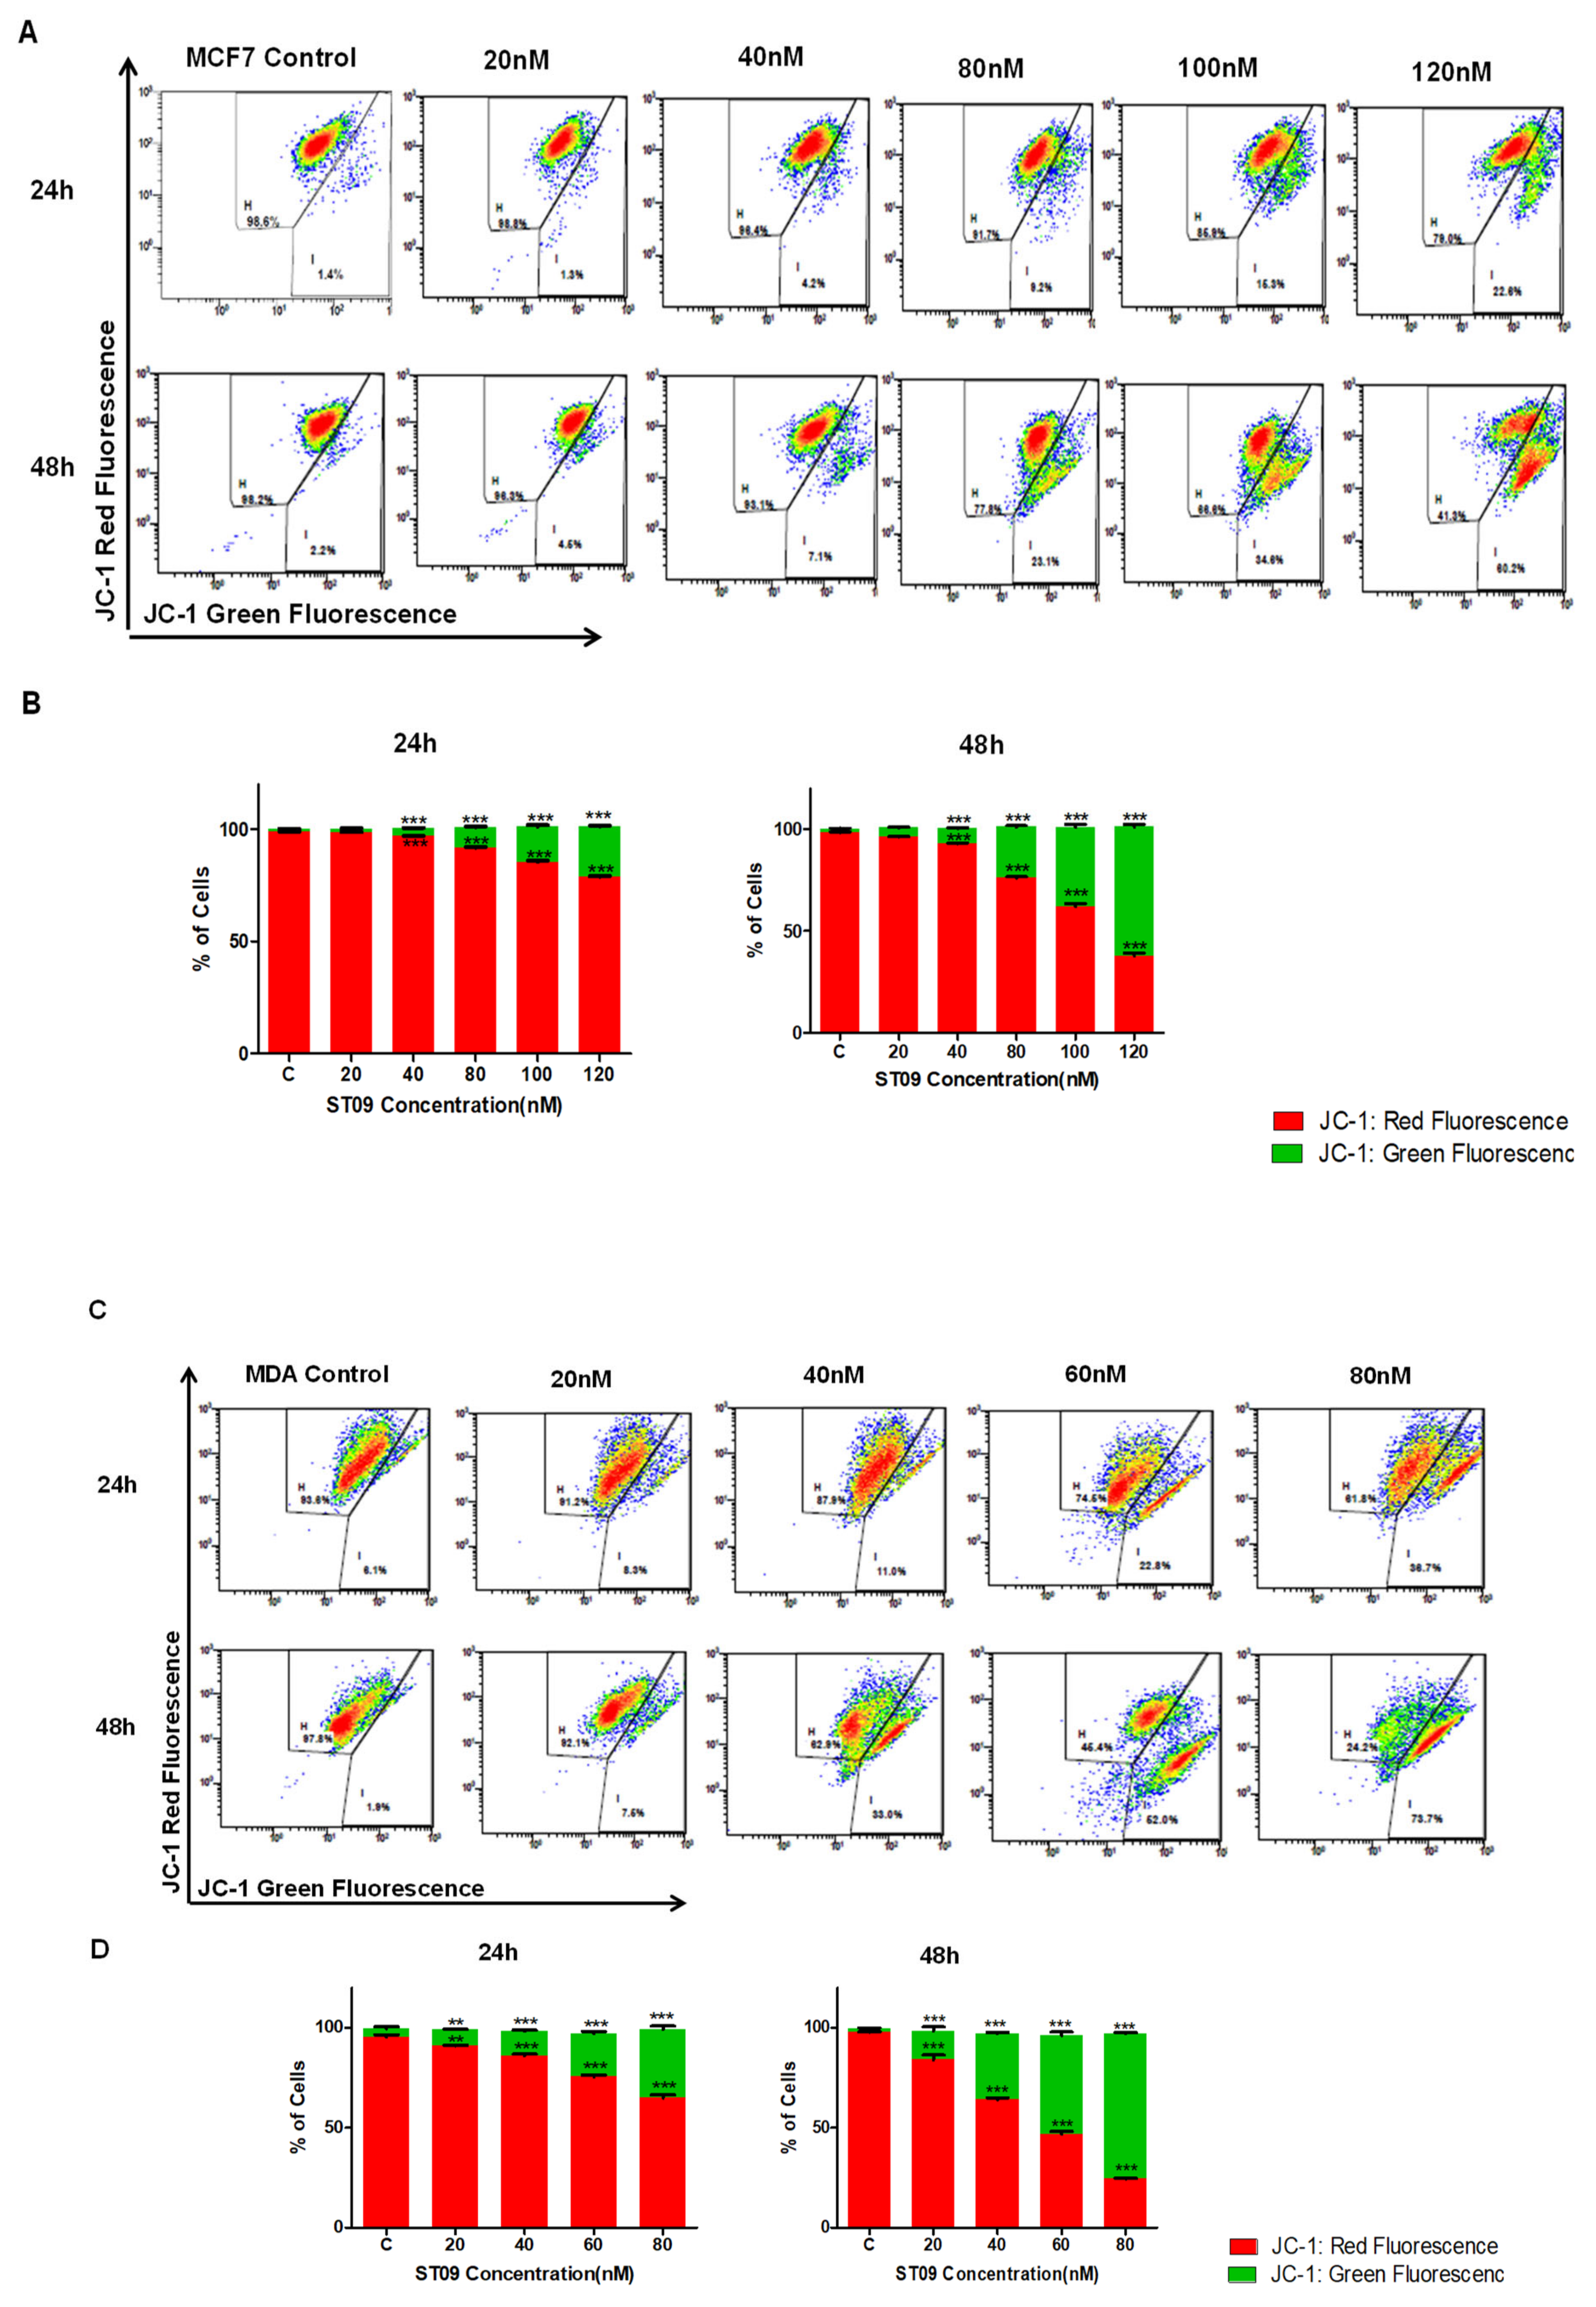
3.5. ST09 Induced Change in the Mitochondrial Membrane Potential of Human Breast Cancer Cells
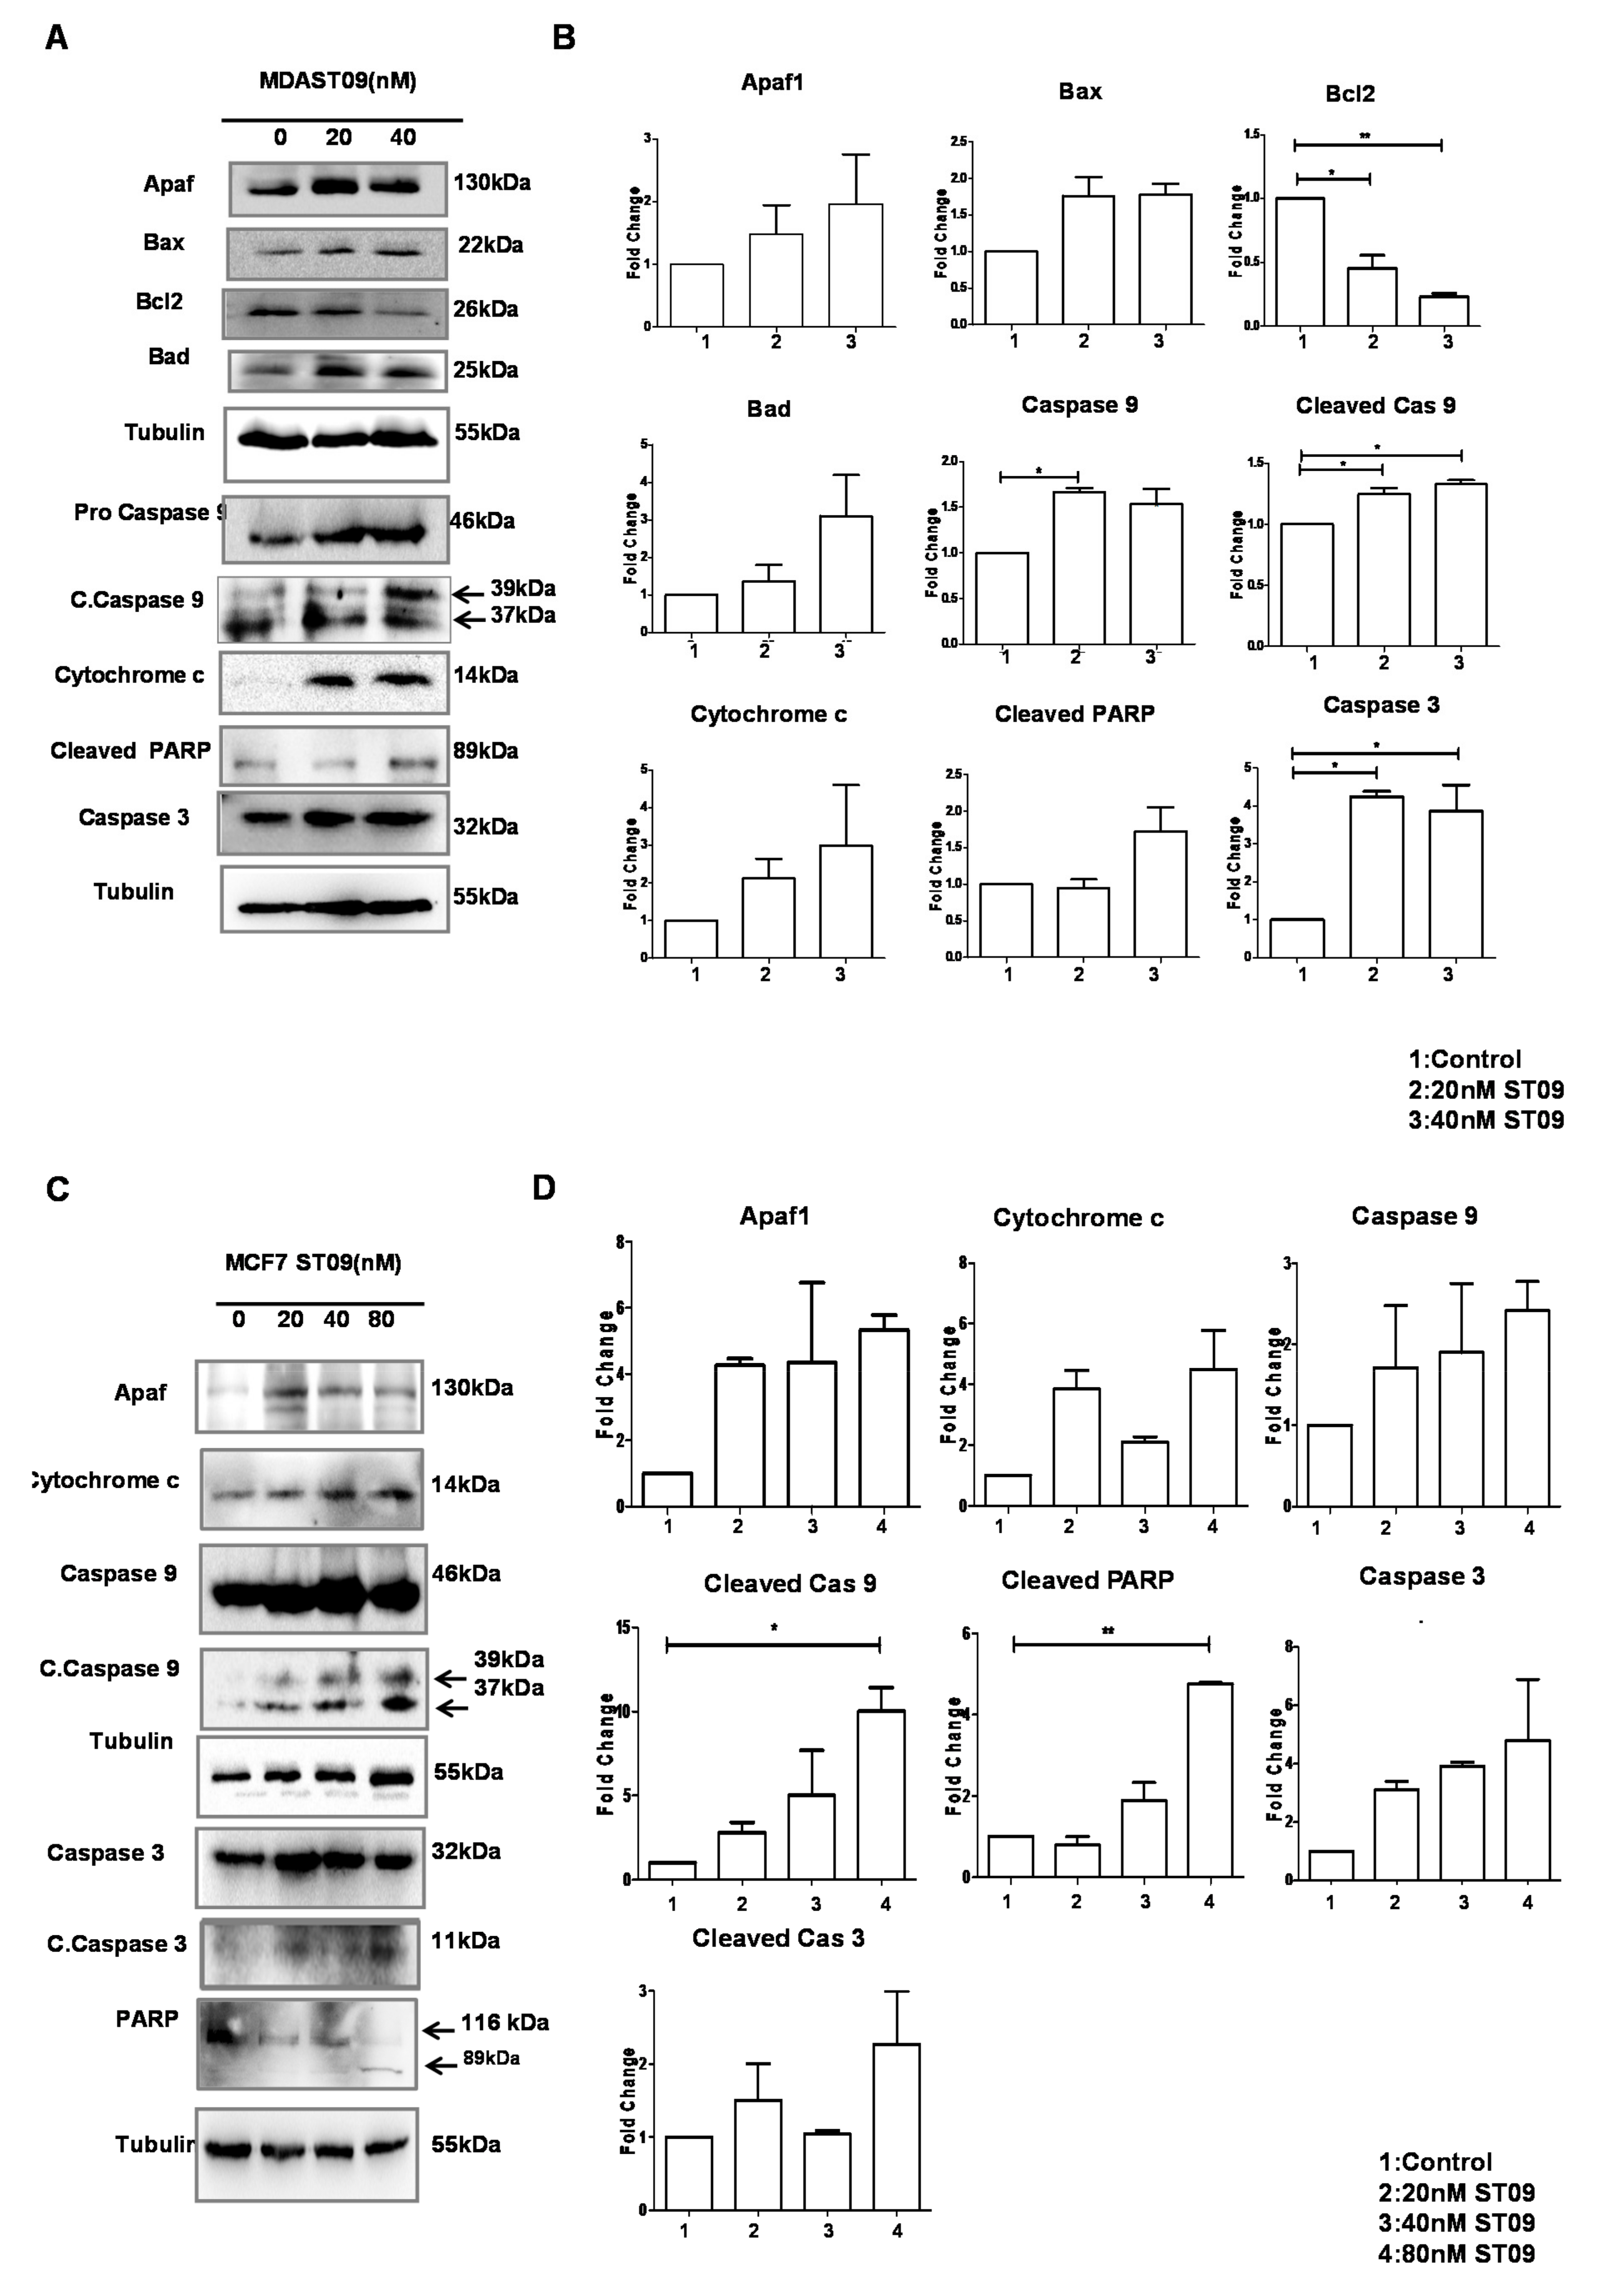
3.6. ST09 Induced Intrinsic Pathway of Apoptosis in Human Breast Cancer Cells
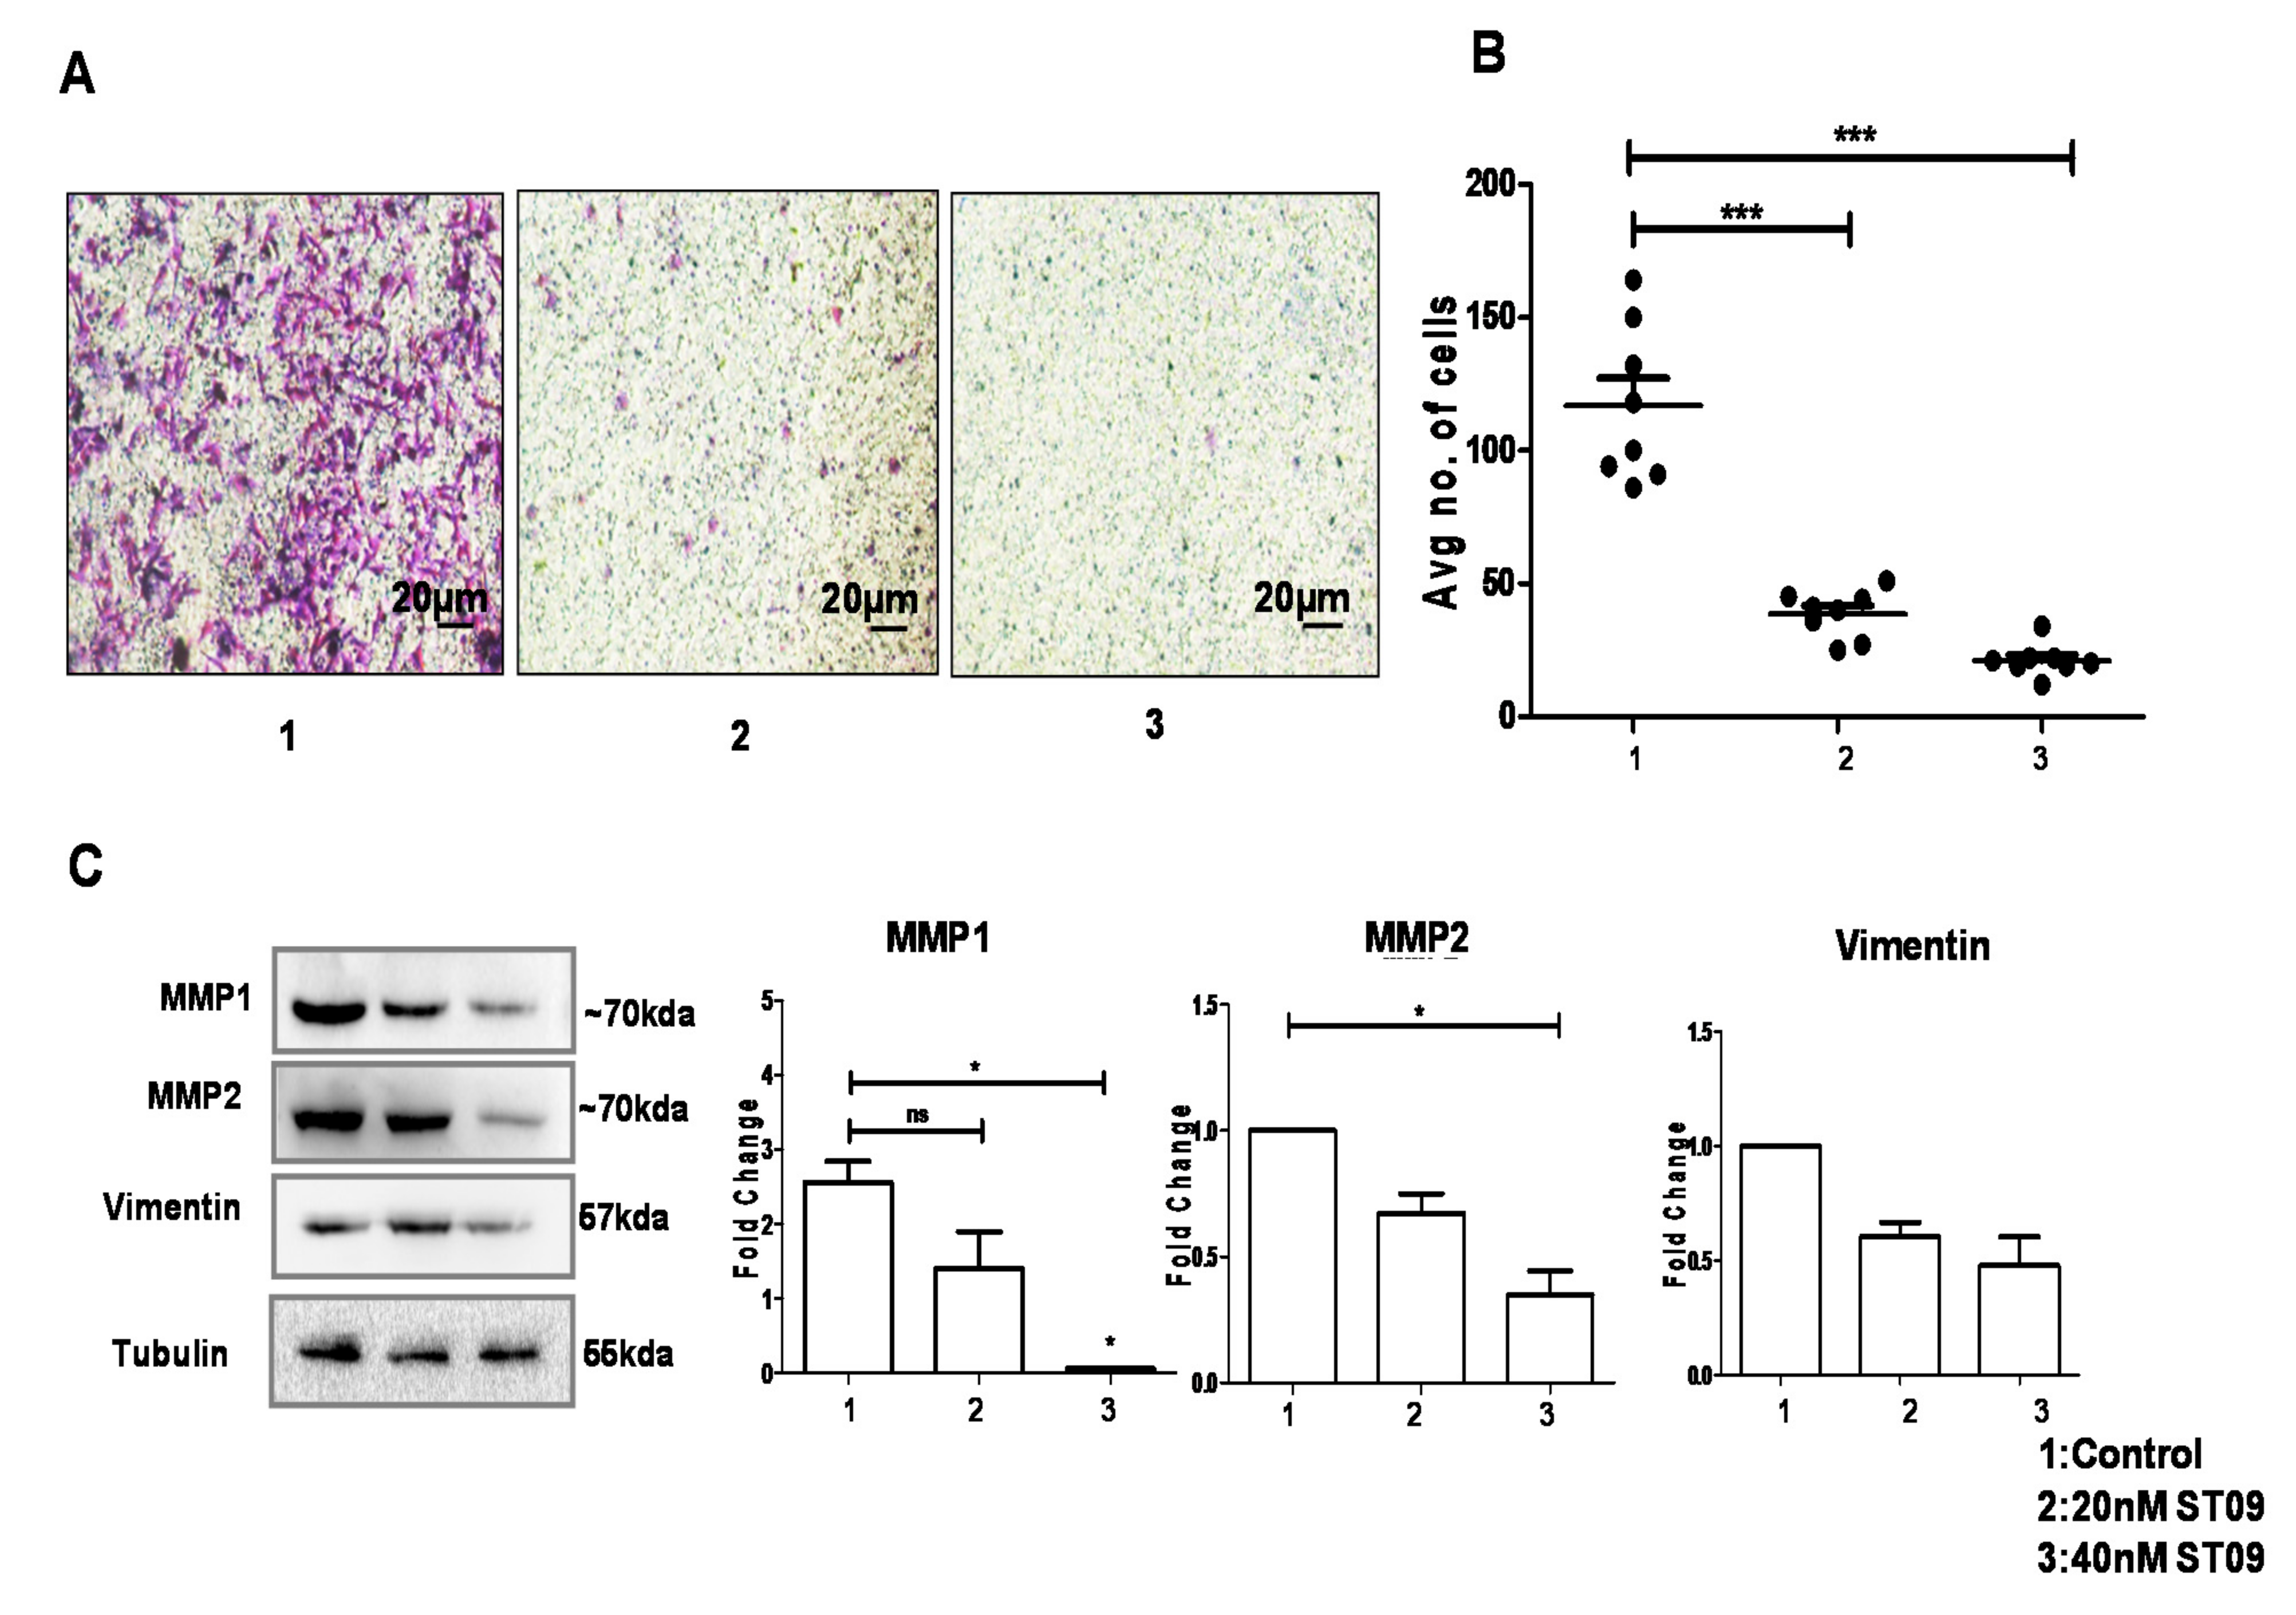
3.7. ST09 Inhibited Migration as Assayed by the Transwell Migration Assay
3.8. ST09 Induces Tumor Regression in an EAC Induced Allograft Tumor Mouse Model
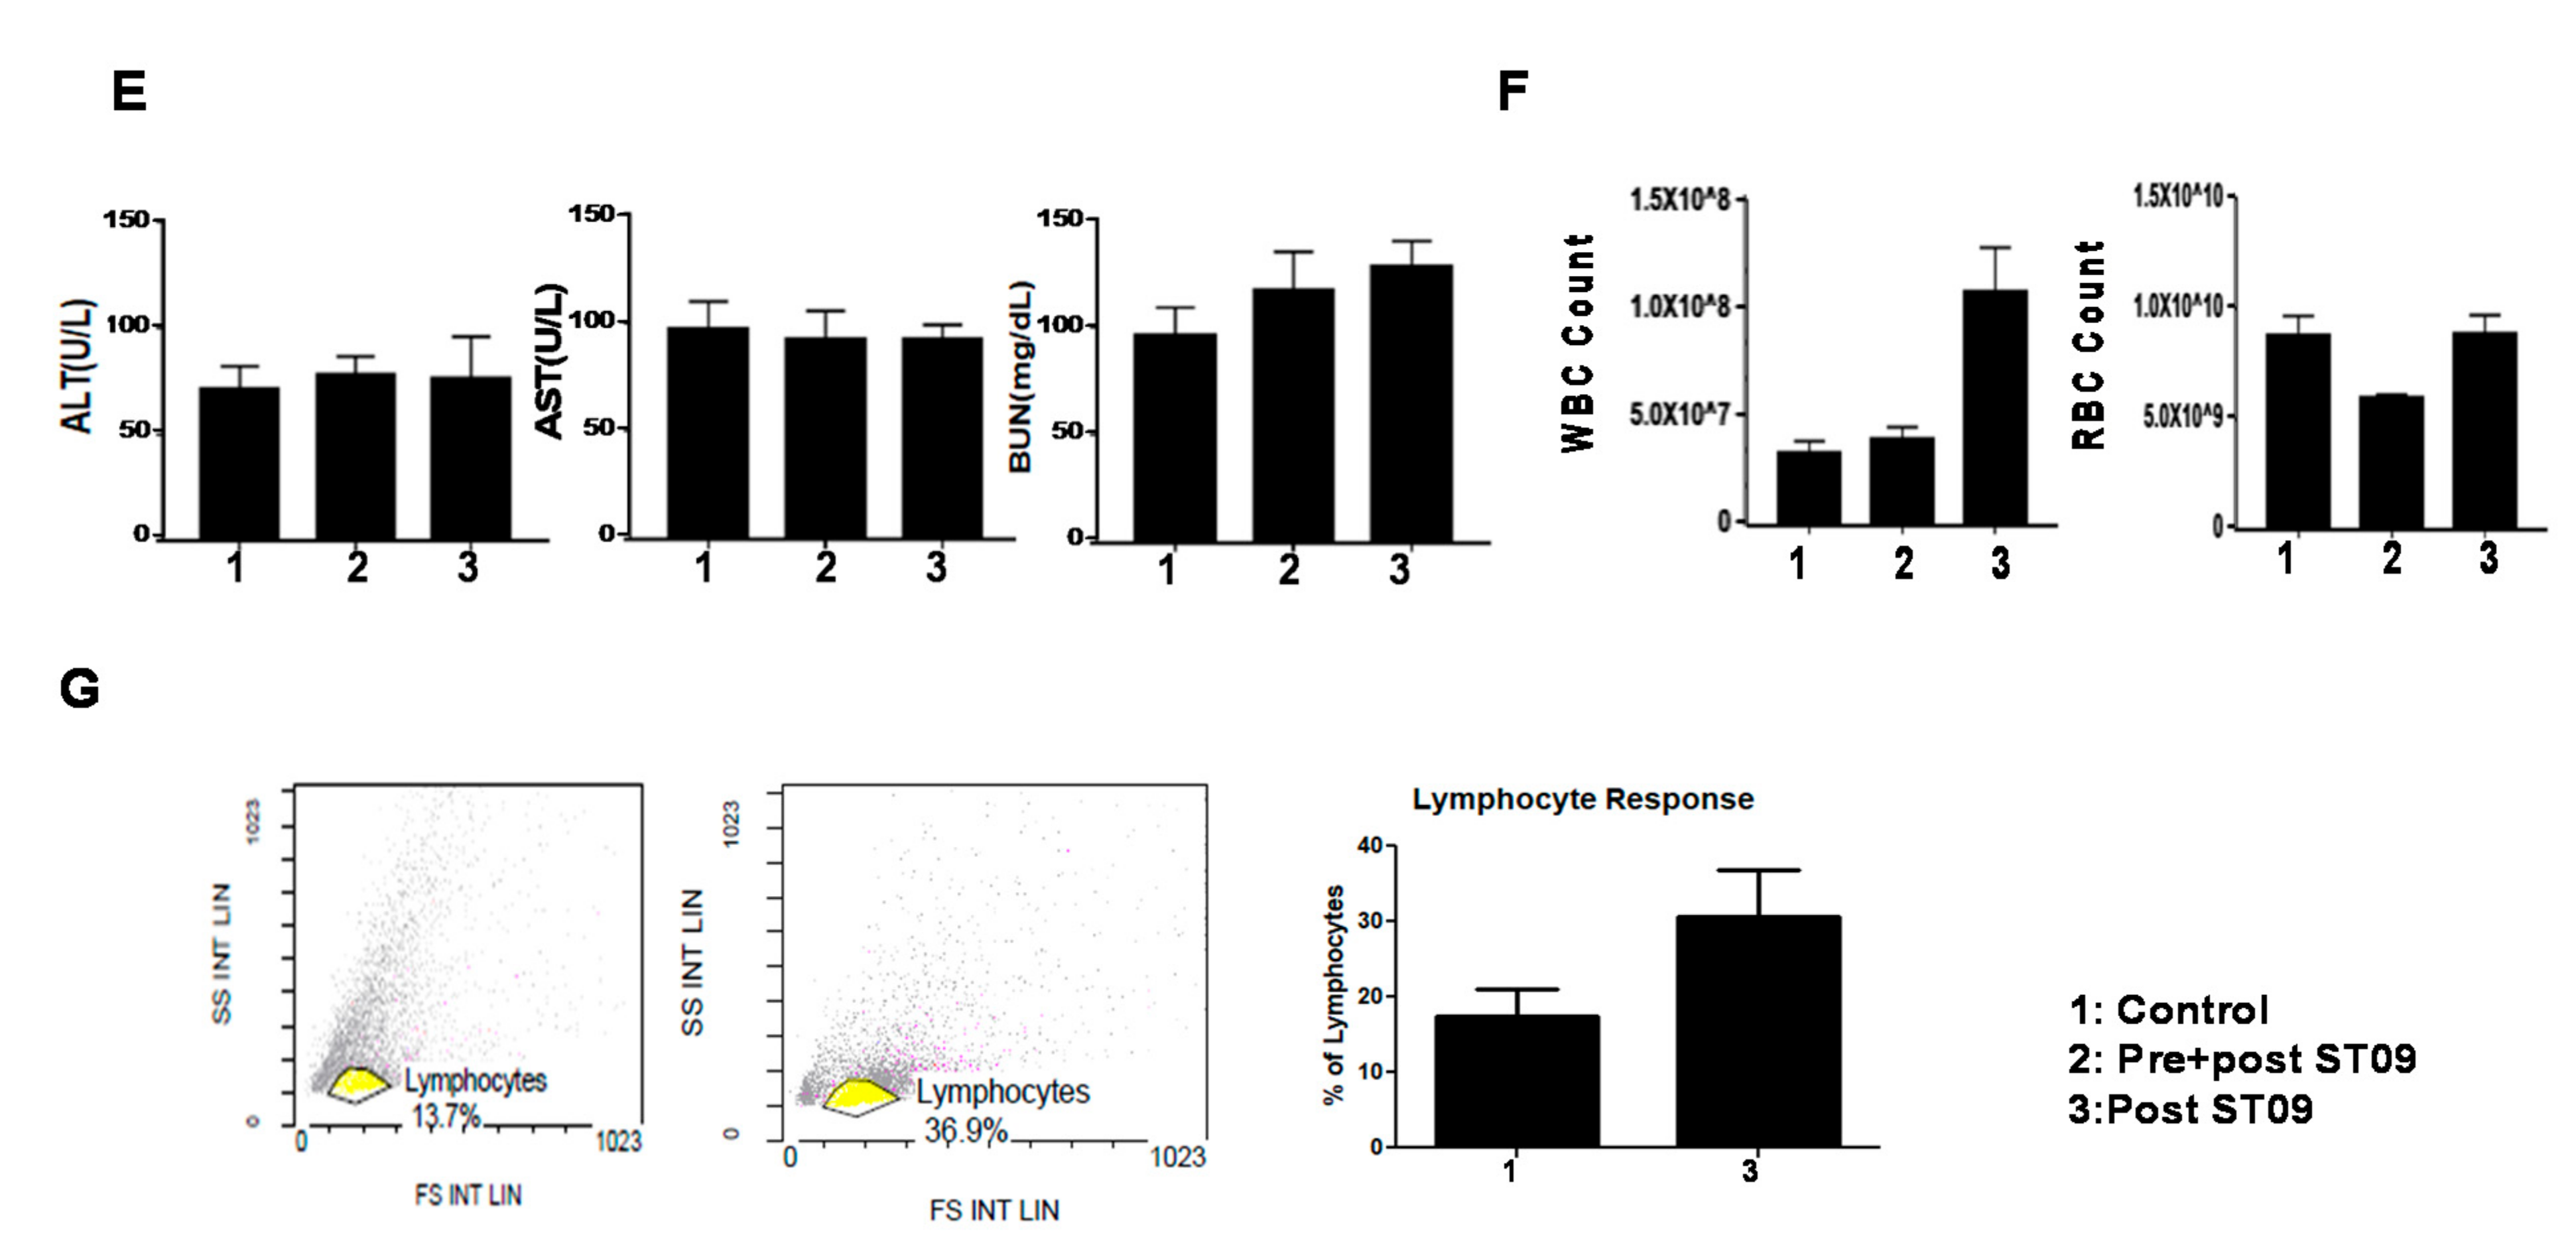
3.9. ST09 Did Not Induce Observable Histopathological Changes
3.10. ST09 Does Not Induce Any Toxicity and Does Not Have Any Side Effects
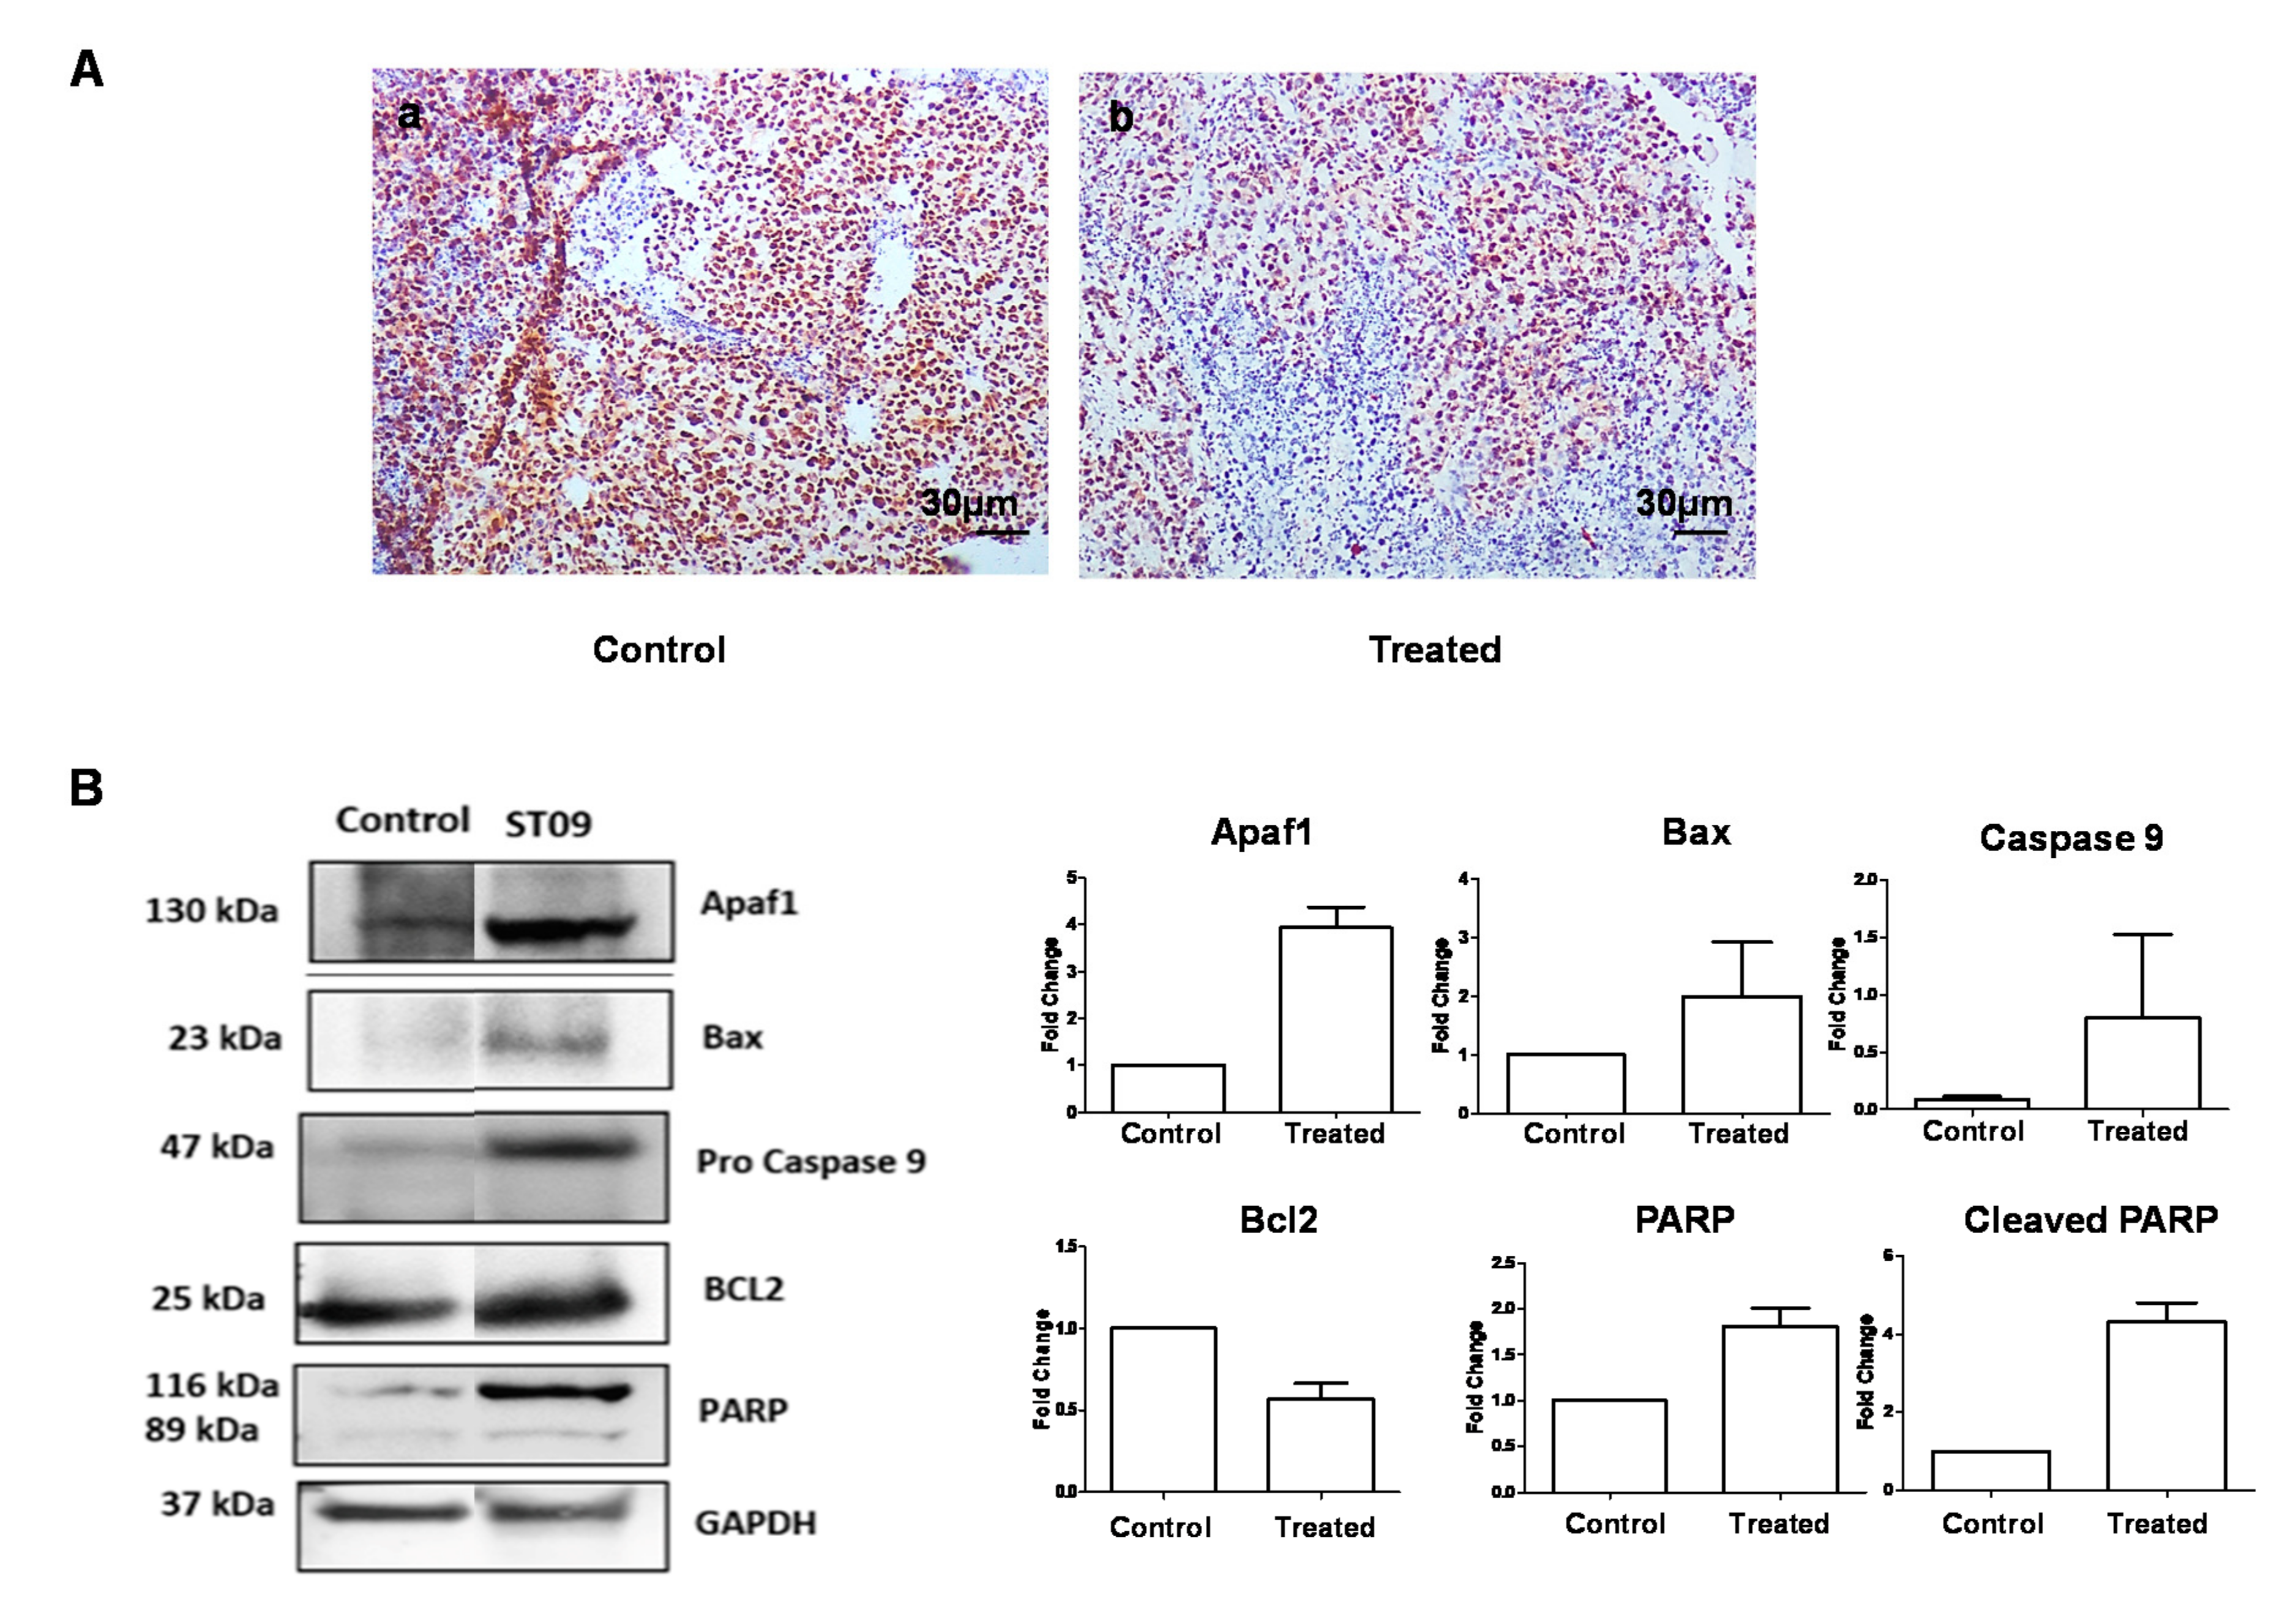
3.11. ST09 Induces an Intrinsic Apoptotic Pathway In Vivo
4. Discussion
5. Conclusions
Supplementary Materials
Author Contributions
Funding
Acknowledgments
Conflicts of Interest
References
- Holliday, L.D.; Speirs, V. Choosing the right cell line for breast cancer research. Breast Cancer Res. 2011, 13, 215. [Google Scholar] [CrossRef]
- Ossovskaya, V.; Wang, Y.; Budoff, A.; Xu, Q.; Lituev, A.; Potapova, O.; Vansant, G.; Monforte, J.; Daraselia, N. Exploring molecular pathways of triple-negative breast cancer. Genes Cancer 2011, 2, 870–879. [Google Scholar] [CrossRef]
- McGuire, A.; Brown, J.; Malone, C.; McLaughlin, R.; Kerin, M. Effects of Age on the Detection and Management of Breast Cancer. Cancers 2015, 7, 908–929. [Google Scholar] [CrossRef] [PubMed]
- Polyak, K. Heterogeneity in breast cancer. J. Clin. Investig. 2011, 121, 3786–3788. [Google Scholar] [CrossRef] [PubMed]
- Vargo-Gogola, T.; Rosen, J.M. Modelling breast cancer: One size does not fit all. Nat. Rev. Cancer 2007, 7, 659–672. [Google Scholar] [CrossRef] [PubMed]
- Ajay, G.; Ajaikumar, B.K.; Bharat, B.A. Curcumin as “‘Curecumin’”: From kitchen to clinic. Biochem. Pharmacol. 2008, 75, 787–809. [Google Scholar]
- Golan, M.; Hizi, A.; Keydar, I.; Tsarfaty, I. Characterization of a hormonally induced reverse transcriptase (RT) from the human breast cancer cell line T47D: A possible involvement in human breast cancer. Breast Cancer Res. 2001, 3, 1–22. [Google Scholar] [CrossRef][Green Version]
- Ryu, S.; McDonnell, K.; Choi, H.; Gao, D.; Hahn, M.; Joshi, N.; Park, S.M.; Catena, R.; Do, Y.; Brazin, J.; et al. Suppression of miRNA-708 by polycomb group promotes metastases by calcium-induced cell migration. Cancer Cell 2013, 23, 63–76. [Google Scholar] [CrossRef] [PubMed]
- Liu, D.; Chen, Z. The Effect of Curcumin on Breast Cancer Cells. J. Breast Cancer 2013, 2, 133. [Google Scholar] [CrossRef] [PubMed]
- Talib, W.H.; Al-Hadid, S.A.; Ali, M.B.W.; Al-Yasari, I.H.; Ali, M.R.A. Role of curcumin in regulating p53 in breast cancer: An overview of the mechanism of action. Breast Cancer 2018, 10, 207–217. [Google Scholar] [CrossRef]
- Lv, Z.-D.; Liu, X.-P.; Zhao, W.-J.; Dong, Q.; Li, F.-N.; Wang, H.-B.; Kong, B. Curcumin induces apoptosis in breast cancer cells and inhibits tumor growth in vitro and in vivo. Int. J. Clin. Exp. Pathol. 2014, 7, 2818–2824. [Google Scholar] [PubMed]
- Liu, Z.; Sun, Y.; Ren, L.; Huang, Y.; Cai, Y.; Weng, Q.; Shen, X.; Li, X.; Liang, G.; Wang, Y. Evaluation of a curcumin analog as an anti-cancer agent inducing ER stress-mediated apoptosis in non-small cell lung cancer cells. BMC Cancer 2013, 13, 494. [Google Scholar] [CrossRef] [PubMed]
- Koroth, J.; Nirgude, S.; Tiwari, S.; Gopalakrishnan, V.; Mahadeva, R.; Kumar, S.; Karki, S.; Choudhary, B. Investigation of anti-cancer and migrastatic properties of novel curcumin derivatives on breast and ovarian cancer cell lines. BMC Complement Altern. Med. 2019, 19, 273. [Google Scholar] [CrossRef] [PubMed]
- Kumar, M.; Martin, A.; Nirgude, S.; Chaudhary, B.; Mondal, S.; Sarkar, A. Quinacrine inhibits GSTA1 activity and induces apoptosis through G1/S arrest and generation of ROS in human non-small cell lung cancer cell lines. Oncotarget 2020, 11, 1603–1617. [Google Scholar] [CrossRef] [PubMed]
- Murugesan, K.; Koroth, J.; Srinivasan, P.P.; Singh, A.; Mukundan, S.; Karki, S.; Choudhary, B.; Gupta, C.M. Effects of green synthesised silver nanoparticles (ST06-AgNPs) using curcumin derivative (ST06) on human cervical cancer cells (HeLa) in vitro and EAC tumor bearing mice models. Int. J. Nanomed. 2019, 14, 6133. [Google Scholar] [CrossRef]
- Jia, T.; Zhang, L.; Duan, Y.; Zhang, M.; Wang, G.; Zhang, J.; Zhao, Z. The differential susceptibilities of MCF-7 and MDA-MB-231 cells to the cytotoxic effects of curcumin are associated with the PI3K/Akt-SKP2-Cip/Kips pathway. Cancer Cell Int. 2014, 14, 126. [Google Scholar] [CrossRef]
- Hu, S.; Xu, Y.; Meng, L.; Huang, L.; Sun, H. Curcumin inhibits proliferation and promotes apoptosis of breast cancer cells. Exp. Ther. Med. 2018, 16, 1266–1272. [Google Scholar] [CrossRef]
- Boon, K. The Mesenchymal-Like Phenotype of the MDA-MB-231 Cell Line [Internet]. Breast Cancer—Focusing Tumor Microenvironment. Stem Cells Metastasis 2011, 385–402. [Google Scholar] [CrossRef]
- Wang, Q.-M.; Lv, L.; Tang, Y.; Zhang, L.; Wang, L.-F. MMP-1 is overexpressed in triple-negative breast cancer tissues and the knockdown of MMP-1 expression inhibits tumor cell malignant behaviors. Oncol. Lett. 2019, 17, 1732–1740. [Google Scholar] [CrossRef]
- Xu, X.; Wang, Y.; Chen, Z.; Sternlicht, M.D.; Hidalgo, M.; Steffensen, B. Matrix metalloproteinase-2 contributes to cancer cell migration on collagen. Cancer Res. 2005, 65, 130–136. [Google Scholar]
- Wang, B.; Liu, M.; Song, Y.; Li, C.; Zhang, S.; Ma, L. KLF2 Inhibits the Migration and Invasion of Prostate Cancer Cells by Downregulating MMP2. Int. J. Men’s Health, 2019; 13, 1557988318816907. [Google Scholar] [CrossRef]
- Battaglia, R.A.; Delic, S.; Herrmann, H.; Snider, N.T. Vimentin on the move: New developments in cell migration. F1000Res. 2018, 7. [Google Scholar] [CrossRef] [PubMed]
- Messica, Y.; Laser-Azogui, A.; Volberg, T.; Elisha, Y.; Lysakovskaia, K.; Eils, R.; Gladilin, E.; Geiger, B.; Beck, R. The role of Vimentin in Regulating Cell Invasive Migration in Dense Cultures of Breast Carcinoma Cells. Nano Lett. 2017, 17, 6941–6948. [Google Scholar] [CrossRef] [PubMed]
- Arnedos, M.; Bihan, C.; Delaloge, S.; Andre, F. Triple-negative breast cancer: Are we making headway at least? Ther. Adv. Med. Oncol. 2012, 4, 195–210. [Google Scholar] [CrossRef] [PubMed]
- Kuttan, R.; Bhanumathy, P.; Nirmala, K.; George, M.C. Potential anticancer activity of turmeric (Curcuma longa). Cancer Lett. 1985, 2, 197–202. [Google Scholar] [CrossRef]
- Liu, H.-T.; Ho, Y.-S. Anticancer effect of curcumin on breast cancer and stem cells. Food Sci. Hum. Wellness 2018, 2, 134–137. [Google Scholar] [CrossRef]
- Zhou, Q.-M.; Wang, X.-F.; Liu, X.-J.; Zhang, H.; Lu, Y.-Y.; Su, S.-B. Curcumin enhanced antiproliferative effect of mitomycin C in human breast cancer MCF-7 cells in vitro and in vivo. Acta Pharmacol. Sin. 2011, 32, 1402–1410. [Google Scholar] [CrossRef]
- Tomeh, M.; Hadianamrei, R.; Zhao, X. A Review of Curcumin and Its Derivatives as Anticancer Agents. Int. J. Mol. Sci. 2019, 20, 1033. [Google Scholar] [CrossRef]
- Lee, W.H.; Loo, C.Y.; Bebawy, M.; Luk, F.; Mason, R.S.; Rohanizadeh, R. Curcumin and its derivatives: Their application in neuropharmacology and neuroscience in the 21st century. Cur. Neuropharmacol. 2013, 11, 338–378. [Google Scholar] [CrossRef]
- Rath, K.S.; McCann, G.A.; Cohn, D.E.; Rivera, B.K.; Kuppusamy, P.; Selvendiran, K. Safe and targeted anticancer therapy for ovarian cancer using a novel class of curcumin analogs. J. Ovarian Res. 2013, 6, 35. [Google Scholar] [CrossRef]
- Santiago-Vazquez, Y.; Das, S.; Das, U.; Robles-Escajeda, E.; Ortega, N.M.; Lema, C.; Varela-Ramírez, A.; Aguilera, R.J.; Balzarini, J.; de Clercq, E.; et al. Novel 3,5-bis(arylidene)-4-oxo-1-piperidinyl dimers: Structure-activity relationships and potent antileukemic and antilymphoma cytotoxicity. Eur. J. Med. Chem. 2014, 77, 315–322. [Google Scholar] [CrossRef]
- Lagisetty, P.; Vilekar, P.; Sahoo, K.; Anant, S.; Awasthi, V. CLEFMA-an anti-proliferative curcuminoid from structure-activity relationship studies on 3,5-bis(benzylidene)-4-piperidones. Bioorg. Med. Chem. 2010, 18, 6109–6120. [Google Scholar] [CrossRef] [PubMed]
- Cridge, B.J.; Larsen, L.; Rosengren, R.J. Curcumin and its derivatives in breast cancer: Current developments and potential for the treatment of drug-resistant cancers. Oncol. Discov. 2013, 6, S3067. [Google Scholar] [CrossRef]
- Keep, O.; Galluzzi, L.; Lipinski, M.; Yuan, J.; Kroemer, G. Cell death assays for drug discovery. Nat. Rev. Drug Discov. 2011, 3, 221–237. [Google Scholar] [CrossRef] [PubMed]
- Parrish, A.B.; Freel, C.D.; Kornbluth, S. Cellular Mechanisms Controlling Caspase Activation and Function. Cold Spring Harb. Perspect. Biol. 2013, 5, a008672. [Google Scholar] [CrossRef] [PubMed]
- Wong, R.S.Y. Apoptosis in cancer: From pathogenesis to treatment. J. Exp. Clin. Cancer Res. 2011, 30, 87. [Google Scholar] [CrossRef] [PubMed]
- Yadav, B.; Taurin, S.; Larsen, L.; Rosengren, R.J. RL71, a second-generation curcumin analog, induces apoptosis and downregulates Akt in ER-negative breast cancer cells. Int. J. Oncol. 2012, 41, 1119–1127. [Google Scholar] [CrossRef] [PubMed][Green Version]
- Adams, B.K.; Cai, J.; Armstrong, J.; Herold, M.; Lu, Y.J.; Sun, A.; Snyder, J.P.; Liotta, D.C.; Jones, D.P.; Shoji, M. EF24, a novel synthetic curcumin analog, induces apoptosis in cancer cells via a redox-dependent mechanism. Anticancer Drugs. 2005, 16, 263–275. [Google Scholar] [CrossRef] [PubMed]
- Lima, J.F.; Nofech-Mozes, S.; Bayani, J.; Bartlett, J. EMT in Breast Carcinoma—A Review. J. Clin. Med. 2016, 50, 65. [Google Scholar] [CrossRef] [PubMed]
- Gallardo, M.; Calaf, G.M. Curcumin inhibits invasive capabilities through epithelial mesenchymal transition in breast cancer cell lines. Int. J. Oncol. 2016, 49, 1019–1027. [Google Scholar] [CrossRef] [PubMed]
- Liu, Q.; Loo, W.T.Y.; Sze, S.C.W.; Tong, Y. Curcumin inhibits cell proliferation of MDA-MB-231 and BT-483 breast cancer cells mediated by down-regulation of NFκB, cyclinD and MMP-1 transcription. Phytomedicine 2009, 16, 916–922. [Google Scholar] [CrossRef] [PubMed]
- Shao, Z.-M.; Shen, Z.-Z.; Liu, C.-H.; Sartippour, M.R.; Go, V.L.; Heber, D.; Nguyen, M. Curcumin exerts multiple suppressive effects on human breast carcinoma cells. Int. J. Cancer 2002, 98, 234–240. [Google Scholar] [CrossRef] [PubMed]
- Chen, L.-Y.; Lin, Y.-L.; Chiang, B.-L. Levamisole enhances immune response by affecting the activation and maturation of human monocyte-derived dendritic cells. Clin. Exp. Immunol. 2008, 151, 174–181. [Google Scholar] [CrossRef] [PubMed]
- Razak, N.A.; Nadeem, A.M.; Abu, N.; Ho, W.Y.; Tan, S.W.; Zareen, S.; Nizam bin Taj-ud-din, S.; Long, K.; Alitheen, N.B.; Yeap, S.K. The in vivo anti-tumor effect of curcumin derivative (2E,6E)-2,6-bis(4-hydroxy-3-methoxybenzylidene)cyclohexanone (BHMC) on 4T1 breast cancer cells [Internet]. RSC Adv. 2017, 7, 36185–36192. [Google Scholar] [CrossRef]
- Farhangi, B.; Alizadeh, A.M.; Khodayari, H.; Khodayari, S.; Dehghan, M.J.; Khori, V.; Heidarzadeh, A.; Khaniki, M.; Sadeghiezadeh, M.; Najafi, F. Protective effects of dendrosomal curcumin on an animal metastatic breast tumor. Eur. J. Pharmacol. 2015, 758, 188–196. [Google Scholar] [CrossRef]
- Vartak, S.V.; Hegde, M.; Iyer, D.; Gaikwad, S.; Gopalakrishnan, V.; Srivastava, M.; Karki, S.S.; Choudhary, B.; Ray, P.; Santhoshkumar, T.R.; et al. A novel inhibitor of BCL2, Disarib abrogates tumor growth while sparing platelets, by activating intrinsic pathway of apoptosis. Biochem Pharmacol. 2016, 122, 10–22. [Google Scholar] [CrossRef]
Sample Availability: Samples of the compound are not available from the authors. |


| Cell Line | IC50 (µM) |
|---|---|
| MDA-MB-231 | 0.031 |
| MCF7 | 0.093 |
| T47D | 0.138 |
© 2020 by the authors. Licensee MDPI, Basel, Switzerland. This article is an open access article distributed under the terms and conditions of the Creative Commons Attribution (CC BY) license (http://creativecommons.org/licenses/by/4.0/).
Share and Cite
Nirgude, S.; Mahadeva, R.; Koroth, J.; Kumar, S.; Kumar, K.S.S.; Gopalakrishnan, V.; S Karki, S.; Choudhary, B. ST09, A Novel Curcumin Derivative, Blocks Cell Migration by Inhibiting Matrix Metalloproteases in Breast Cancer Cells and Inhibits Tumor Progression in EAC Mouse Tumor Models. Molecules 2020, 25, 4499. https://doi.org/10.3390/molecules25194499
Nirgude S, Mahadeva R, Koroth J, Kumar S, Kumar KSS, Gopalakrishnan V, S Karki S, Choudhary B. ST09, A Novel Curcumin Derivative, Blocks Cell Migration by Inhibiting Matrix Metalloproteases in Breast Cancer Cells and Inhibits Tumor Progression in EAC Mouse Tumor Models. Molecules. 2020; 25(19):4499. https://doi.org/10.3390/molecules25194499
Chicago/Turabian StyleNirgude, Snehal, Raghunandan Mahadeva, Jinsha Koroth, Sujeet Kumar, Kothanahally S. Sharath Kumar, Vidya Gopalakrishnan, Subhas S Karki, and Bibha Choudhary. 2020. "ST09, A Novel Curcumin Derivative, Blocks Cell Migration by Inhibiting Matrix Metalloproteases in Breast Cancer Cells and Inhibits Tumor Progression in EAC Mouse Tumor Models" Molecules 25, no. 19: 4499. https://doi.org/10.3390/molecules25194499
APA StyleNirgude, S., Mahadeva, R., Koroth, J., Kumar, S., Kumar, K. S. S., Gopalakrishnan, V., S Karki, S., & Choudhary, B. (2020). ST09, A Novel Curcumin Derivative, Blocks Cell Migration by Inhibiting Matrix Metalloproteases in Breast Cancer Cells and Inhibits Tumor Progression in EAC Mouse Tumor Models. Molecules, 25(19), 4499. https://doi.org/10.3390/molecules25194499