
Development of an Optimized MALDI-TOF-MS Method for High-Throughput Identification of High-Molecular-Weight Glutenin Subunits in Wheat

 ,
,
Abstract
1. Introduction
2. Results and Discussion
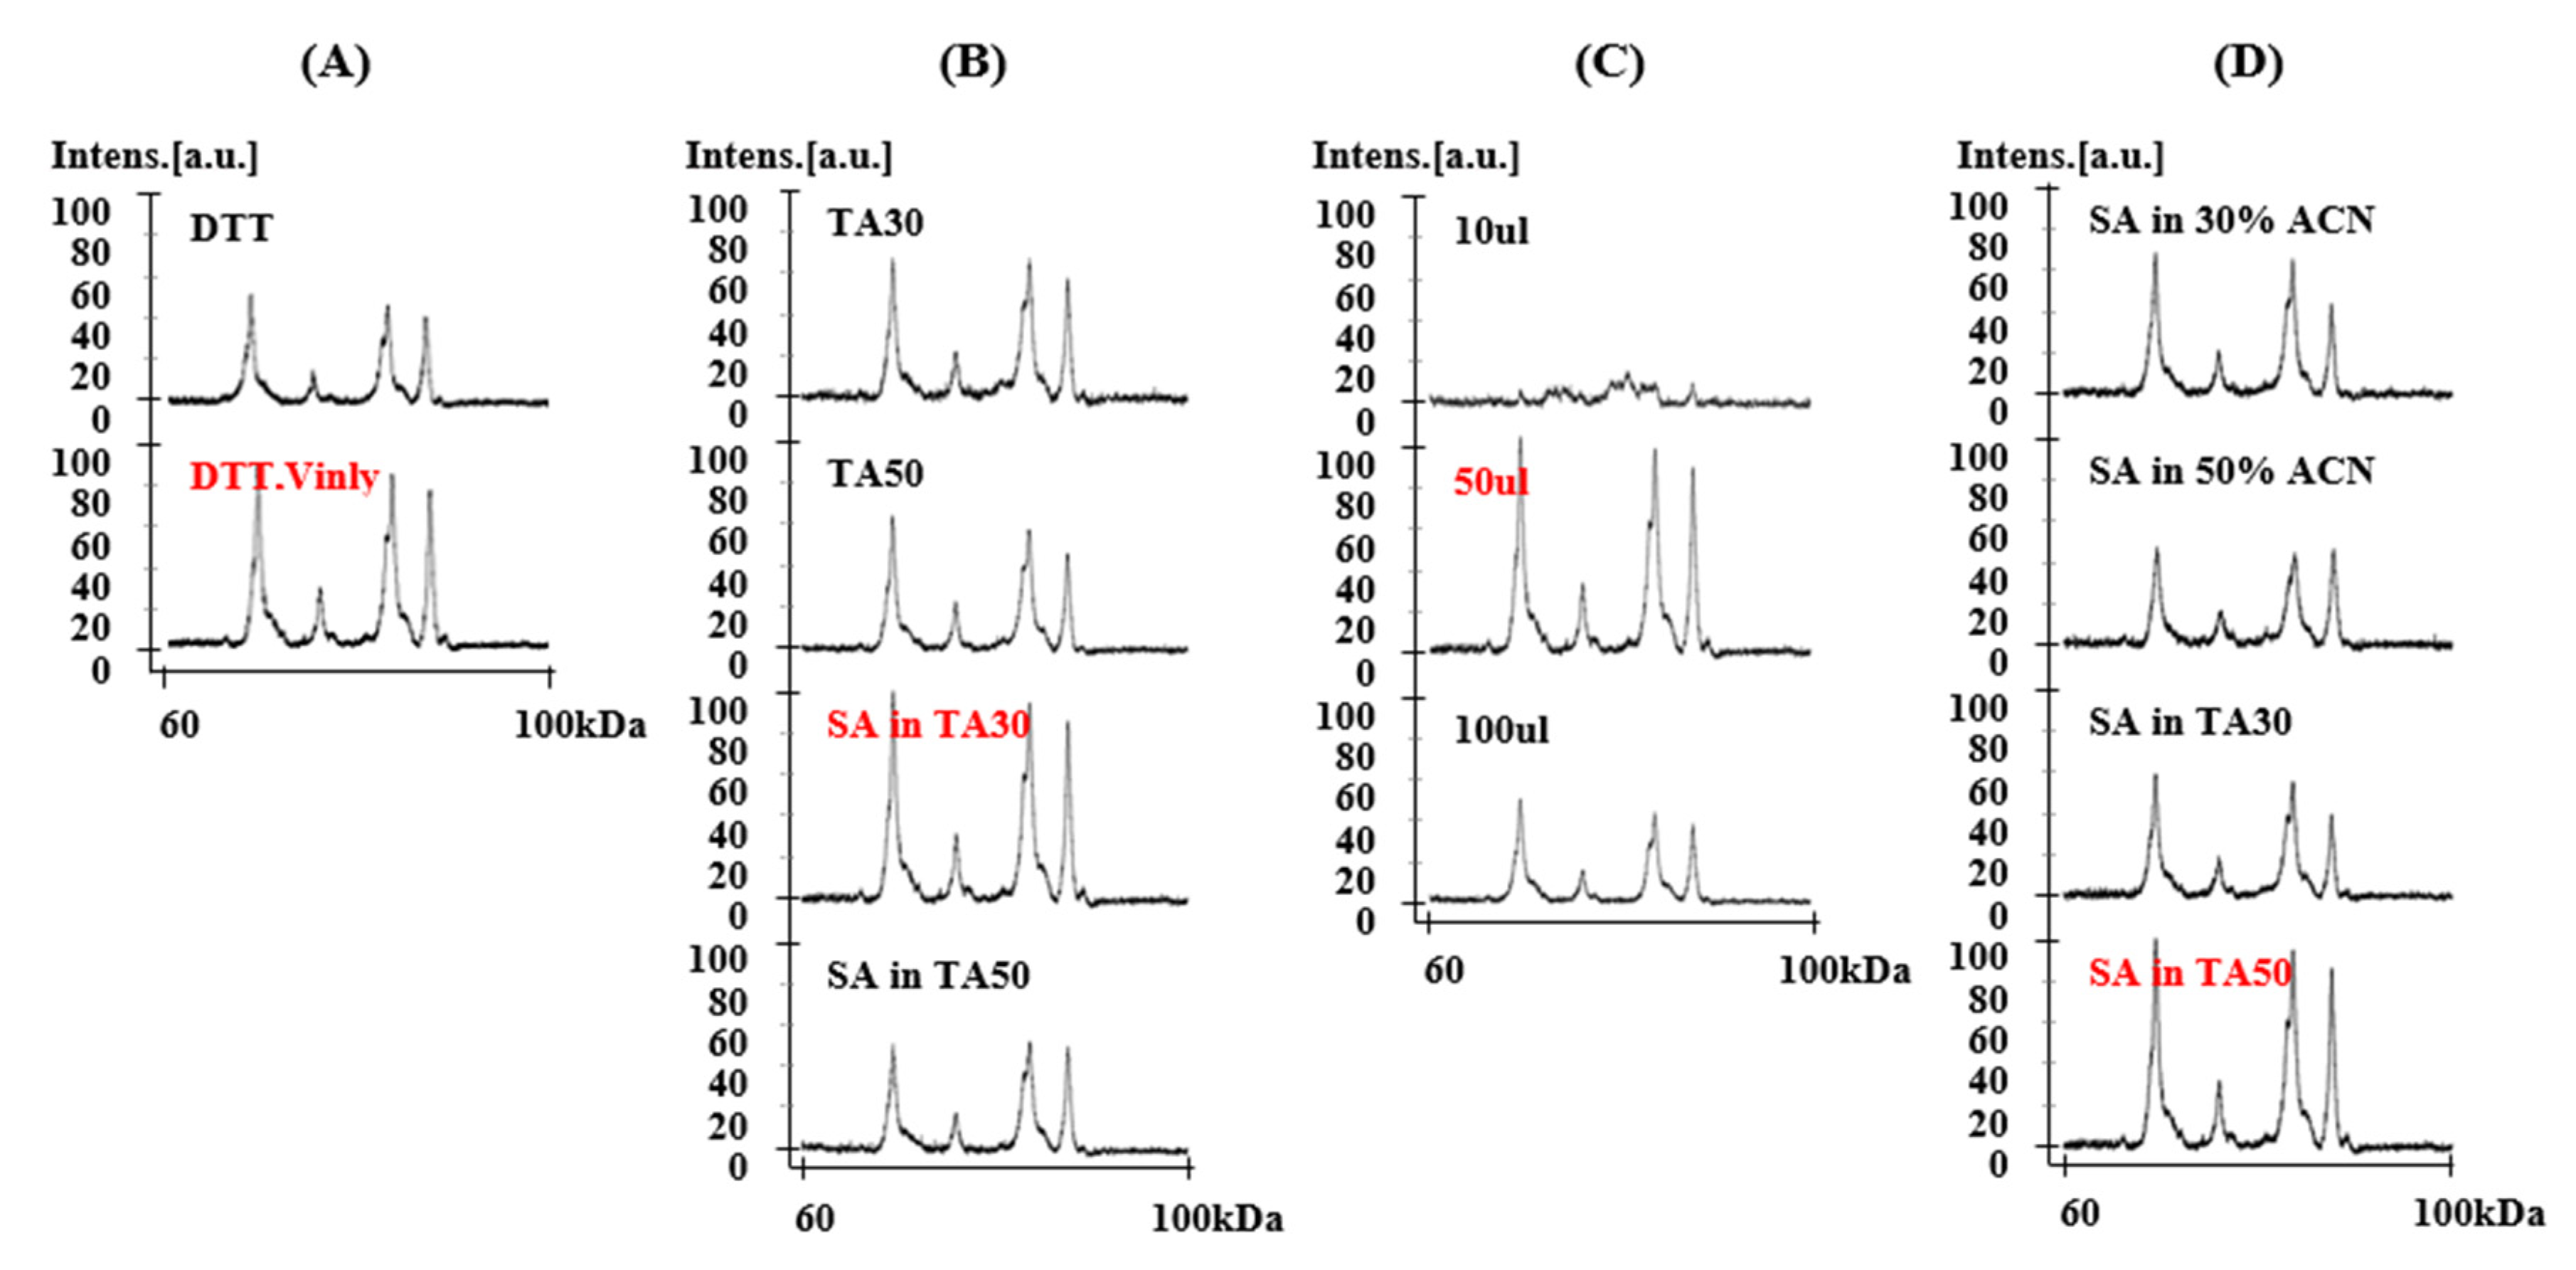
2.1. Sample Optimization for MALDI-TOF-MS Analysis
2.1.1. Treatment of 4-Vinylpyridine as Alkylating Reagent in Protein Extraction
2.1.2. Solvent Components
2.1.3. Dissolving Volume
2.1.4. Matrix II Components
2.2. Identification of HMW-GS Compositions in Standard Wheat Varieties
2.3. Identification of HMW-GS in 38 Korean Wheat Cultivars by MALDI-TOF-MS
3. Materials and Methods
3.1. Plant Materials
3.2. Glutenin Extraction
3.3. Sample Optimization
3.4. MALDI-TOF-MS
3.5. RP-HPLC
3.6. Wheat DNA Extraction and PCR Analysis
4. Conclusions
Supplementary Materials
Author Contributions
Funding
Conflicts of Interest
References
- Payne, P.I. Genetics of wheat storage proteins and the effect of allelic variation on breadmaking quality. Annu. Rev. Plant. Physiol. 1987, 38, 141–153. [Google Scholar] [CrossRef]
- Payne, P.I.; Holt, L.M.; Law, C.N. Structural and genetical studies on the high-molecular-weight subunits of wheat glutenin. Theor. Appl. Genet. 1981, 60, 229–236. [Google Scholar] [CrossRef]
- Shewry, P.R.; Halford, N.G.; Tatham, A.S. High molecular weight subunits of wheat glutenin. J. Cereal. Sci. 1992, 15, 105–120. [Google Scholar] [CrossRef]
- Payne, P.I.; Lawrence, G.J. Catalogue of alleles for the complex gene loci Glu-A1, Glu-B1 and Glu-D1 which code for high-molecular weight subunits of glutenin in hexaploid wheat. Cereal. Res. Commun. 1983, 11, 29–35. [Google Scholar]
- Barro, F.; Rooke, L.; Bekes, F.; Gras, P.; Tatham, A.S.; Fido, R.; Lazzeri, P.A.; Shewry, P.R.; Barcelo, P. Transformation of wheat with HMW subunit genes results in improved functional properties. Nat. Biotechnol. 1997, 15, 1295–1299. [Google Scholar] [CrossRef]
- Gianibelli, M.C.; Larroque, O.R.; MacRitchie, F.; Wrigley, C.W. Biochemical, genetic, and molecular characterization of wheat glutenin and its component subunits. Cereal. Chem. 2001, 78, 635–646. [Google Scholar] [CrossRef]
- Vawser, M.J.; Cornish, G.B. Over-expression of HMW glutenin subunit Glu-B1 7x in hexaploid wheat varieties (Triticum aestivum). Crop Pasture Sci. 2004, 55, 577–588. [Google Scholar] [CrossRef]
- Branlard, G.; Dardevet, M. Diversity of grain protein and bread wheat quality. II. Correlation between high molecular weight subunits of glutenin and flour quality characteristics. J. Cereal. Sci. 1985, 3, 345–354. [Google Scholar] [CrossRef]
- Liu, W.; Zhang, Y.; Gao, X.; Wang, K.; Wang, S.; Zhang, Y.; He, Z.; Ma, W.; Yan, Y. Comparative proteome analysis of glutenin synthesis and accumulation in developing grains between superior and poor quality bread wheat cultivars. J. Sci. Food Agric. 2012, 92, 106–115. [Google Scholar] [CrossRef]
- Butow, B.J.; Ma, W.; Gale, K.R.; Cornish, G.B.; Rampling, L.; Larroque, O.; Morell, M.K.; Bekes, F. Molecular discrimination of Bx7 alleles demonstrates that a highly expressed high molecular weight glutenin allele has a major impact on wheat flour dough strength. Theor. Appl. Genet. 2003, 107, 1524–1532. [Google Scholar] [CrossRef]
- D’Ovidio, R.; Masci, S.; Porceddu, E.; Kasarda, D. Duplication of the high molecular weight glutenin subunit gene in bread wheat (Triticum aestivum L.) cultivar ‘Red River 68′. Plant Breed 1997, 116, 525–531. [Google Scholar] [CrossRef]
- Lukow, O.M.; Forsyth, S.A.; Payne, P.I. Over-production of HMW glutenin subunits coded on chromosome 1B in common wheat, Triticum aestivum. J. Genet. Breed. 1992, 46, 187–192. [Google Scholar]
- Radovanovic, N.; Cloutier, S.; Brown, D.; Humphreys, D.G.; Lukow, O.M. Genetic variance for gluten strength contributed by high molecular weight glutenin proteins. Cereal Chem. 2002, 79, 843–849. [Google Scholar] [CrossRef]
- Wieser, H. Chemistry of gluten proteins. Food Microbiol. 2007, 24, 115–119. [Google Scholar] [CrossRef]
- An, X.; Zhang, Q.; Yan, Y.; Li, Q.; Zhang, Y.; Wang, A.; Pei, Y.; Tian, J.; Wang, H.; Hsam, S.L.K.; et al. Cloning and molecular characterization of three novel LMW-i glutenin subunit genes from cultivated einkorn (Triticum monococcum L.). Theor. Appl. Genet. 2006, 113, 383–395. [Google Scholar] [CrossRef]
- Bietz, J.A. Separation of cereal proteins by reversed-phase high-performance liquid chromatography. J. Chromatogr. A 1983, 255, 219–238. [Google Scholar] [CrossRef]
- Courcoux, P.; Serot, T.; Larre, C.; Popineau, Y. Characterization and identification of wheat cultivars by multi-dimensional analysis of reversed-phase high-performance liquid chromatograms. J. Chromatogr. A 1992, 596, 225–232. [Google Scholar] [CrossRef]
- Cozzolino, R.; Giorgi, S.D.; Fisichella, S.; Garozzo, D.; Lafiandra, D.; Palermo, A. Matrix-assisted laser desorption/ionization mass spectrometric peptide mapping of high molecular weight glutenin subunits 1Bx7 and 1Dy10 in Cheyenne cultivar. Rapid Commun. Mass Spectrom. 2001, 15, 778–787. [Google Scholar] [CrossRef]
- Dong, K.; Hao, C.; Wang, A.; Cai, M.; Yan, Y. Characterization of HMW glutenin subunits in bread and tetraploid wheats by reversed-phase high-performance liquid chromatography. Cereal Res. Commun. 2009, 37, 65–73. [Google Scholar] [CrossRef]
- Gao, L.; Ma, W.; Chen, J.; Wang, K.; Li, J.; Wang, S.; Bekes, F.; Appels, R.; Yan, Y. Characterization and comparative analysis of wheat high molecular weight glutenin subunits by SDS-PAGE, RP-HPLC, HPCE, and MALDI-TOF-MS. J. Agric. Food Chem. 2010, 58, 2777–2786. [Google Scholar] [CrossRef]
- Naeem, H.A.; Sapirstein, H.D. Ultra-fast separation of wheat glutenin subunits by reversed-phase HPLC using a superficially porous silica-based column. J. Cereal Sci. 2007, 46, 157–168. [Google Scholar] [CrossRef]
- Yan, X.; Liu, W.; Yu, Z.; Han, C.; Zeller, F.J.; Hsam, S.L.K.; Yan, Y. Rapid separation and identification of wheat HMW glutenin subunits by UPLC and comparative analysis with HPLC. Aust. J. Crop Sci. 2014, 8, 140–147. [Google Scholar]
- Zhang, Q.; Dong, Y.; An, X.; Wang, A.; Zhang, Y.; Li, X.; Gao, L.; Xia, X.; He, Z.; Yan, Y. Characterization of HMW glutenin subunits in common wheat and related species by matrix-assisted laser desorption/ionization time-of-flight mass spectrometry (MALDI-TOF-MS). J. Cereal. Sci. 2008, 47, 252–261. [Google Scholar] [CrossRef]
- Yan, Y.; Hsam, S.L.K.; Yu, J.; Zeller, F.J. Allelic variation of HMW glutenin subunits in Ae. tauschii accessions detected by SDS-PAGE, A-PAGE and capillary electrophoresis. Euphytica 2003, 130, 377–385. [Google Scholar] [CrossRef]
- Wang, L.; Zhao, X.L.; He, Z.H.; Ma, W.; Appels, R.; Peña, R.J.; Xia, X.C. Characterization of low-molecular-weight glutenin subunit Glu-B3 genes and development of STS markers in common wheat (Triticum aestivum L.). Theor. Appl. Genet. 2009, 118, 525–539. [Google Scholar] [CrossRef]
- Wang, L.H.; Li, G.Y.; Peña, R.J.; Xia, X.C.; He, Z.H. Development of STS markers and establishment of multiplex PCR for Glu-A3 alleles in common wheat (Triticum aestivum L.). J. Cereal Sci. 2010, 51, 305–312. [Google Scholar] [CrossRef]
- Zhang, W.; Gianibelli, M.C.; Rampling, L.R.; Gale, K.R. Characterisation and marker development for low molecular weight glutenin genes from Glu-A3 alleles of bread wheat (Triticum aestivum L). Theor. Appl. Genet. 2004, 108, 1409–1419. [Google Scholar] [CrossRef]
- Zhang, X.; Jin, H.; Zhang, Y.; Liu, D.; Li, G.; Xia, X.; He, Z.; Zhang, A. Composition and functional analysis of low-molecular-weight glutenin alleles with Aroona near-isogenic lines of bread wheat. BMC Plant Biol. 2012, 12, 243. [Google Scholar] [CrossRef]
- Zhao, X.L.; Xia, X.C.; He, Z.H.; Gale, K.R.; Lei, Z.S.; Appels, R.; Ma, W. Characterization of three low-molecular-weight Glu-D3 subunit genes in common wheat. Theor. Appl. Genet. 2006, 113, 1247–1259. [Google Scholar] [CrossRef]
- Bean, S.R.; Lookhart, G.L. Ultrafast capillary electrophoresis analysis of cereal storage proteins and its application to protein characterization and cultivar differentiation. J. Agric. Food Chem. 2000, 48, 344–353. [Google Scholar] [CrossRef]
- Bietz, J.A.; Schmalzried, E. Capillary electrophoresis of wheat gliadin: Initial studies and application to varietal identification. LWT-Food Sci. Technol. 1995, 28, 174–184. [Google Scholar] [CrossRef]
- Yan, Y.; Surlan-Momirovic, G.; Prodanovic, S.; Zoric, D.; Liu, G. Capillary zone electrophoresis analysis of gliadin proteins from Chinese and Yugoslav winter wheat cultivars. Euphytica 1999, 105, 197–204. [Google Scholar] [CrossRef]
- Jang, Y.R.; Beom, H.R.; Altenbach, S.B.; Lee, M.K.; Lim, S.H.; Lee, J.Y. Improved method for reliable HMW-GS identification by RP-HPLC and SDS-PAGE in common wheat cultivars. Molecules 2017, 22, 1055. [Google Scholar] [CrossRef] [PubMed]
- Burnouf, T.; Bietz, J.A. Reversed-phase high-performance liquid chromatography of durum wheat gliadins: Relationships to durum wheat quality. J. Cereal Sci. 1984, 2, 3–14. [Google Scholar] [CrossRef]
- Alberghina, G.; Cozzolino, R.; Fisichella, S.; Garozzo, D.; Savarino, A. Proteomics of gluten: Mapping of the 1Bx7 glutenin subunit in Chinese Spring cultivar by matrix-assisted laser desorption/ionization. Rapid Commun. Mass Sp. 2005, 19, 2069–2074. [Google Scholar] [CrossRef]
- Cunsolo, V.; Foti, S.; Saletti, R.; Gilbert, S.; Tatham, A.S.; Shewry, P.R. Structural studies of the allelic wheat glutenin subunits 1Bx7 and 1Bx20 by matrix-assisted laser desorption/ionization mass spectrometry and high-performance liquid chromatography/electrospray ionization mass spectrometry. J. Mass Spectrom. 2004, 39, 66–78. [Google Scholar] [CrossRef]
- Dworschak, R.G.; Ens, W.; Standing, K.G.; Preston, K.R.; Marchylo, B.A.; Nightingale, M.J.; Stevenson, S.G.; Hatcher, D.W. Analysis of wheat gluten proteins by matrix-assisted laser desorption/ionization mass spectrometry. J. Mass Spectrom. 1998, 33, 429–435. [Google Scholar] [CrossRef]
- Foti, S.; Maccarrone, G.; Saletti, R.; Roepstorff, P.; Gilbert, S.; Tatham, A.S.; Shewry, P.R. Verification of the cDNA deduced sequence of glutenin subunit 1Dx5 and an Mr 58000 repetitive peptide by matrix-assisted laser desorption/ionization mass spectrometry (MALDI-MS). J. Cereal Sci. 2000, 31, 173–183. [Google Scholar] [CrossRef]
- Garozzo, D.; Cozzolino, R.; Giorgi, S.D.; Fisichella, S.; Lafiandra, D. Use of hydroxyacetophenones as matrices for the analysis of high molecular weight glutenin mixtures by matrix-assisted laser desorption/ionization mass spectrometry. Rapid Commun. Mass Sp. 1999, 13, 2084–2089. [Google Scholar] [CrossRef]
- Muccilli, V.; Cunsolo, V.; Saletti, R.; Foti, S.; Masci, S.; Lafiandra, D. Characterization of B- and C-type low molecular weight glutenin subunits by electrospray ionization mass spectrometry and matrix-assisted laser desorption/ionization mass spectrometry. Proteomics 2005, 5, 719–728. [Google Scholar] [CrossRef]
- Singh, N.K.; Sheperd, K.W.; Cornish, G.B. A simplified SDS-PAGE procedure for separating LMW subunits of glutenin. J. Cereal Sci. 1991, 14, 203–208. [Google Scholar] [CrossRef]
- Wang, K.; Ma, J.; Islam, S.; Yan, Y.; Appels, R.; Yan, G.; Ma, W. Detection of cysteine residue numbers in wheat gluten proteins by MALDI-TOF. Int. J. Mass Spectrom. 2015, 392, 91–95. [Google Scholar] [CrossRef]
- Williams, T.L.; Andrzejewski, D.; Lay, J.O.; Jr, L.; Musser, S.M. Experimental factors affecting the quality and reproducibility of MALDI TOF mass spectra obtained from whole bacteria cells. J. Am. Soc. Mass Spectrom. 2003, 14, 342–351. [Google Scholar] [CrossRef]
- Branlard, G.; Dardevet, M.; Amiour, N.; Igrejas, G. Allelic diversity of HMW and LMW glutenin subunits and omega-gliadins in French bread wheat (Triticum aestivum L.). Genet. Resour. Crop Evol. 2003, 50, 669–679. [Google Scholar] [CrossRef]
- Cho, S.W.; Roy, S.K.; Chun, J.B.; Cho, K.; Park, C.S. Overexpression of the Bx7 high molecular weight glutenin subunit on the Glu-B1 locus in a Korean wheat landrace. Plant. Biotechnol. Rep. 2017, 11, 97–105. [Google Scholar] [CrossRef]
- Dupont, F.M.; Chan, R.; Lopez, R. Molar fractions of high-molecular-weight glutenin subunits are stable when wheat is grown under various mineral nutrition and temperature regimens. J. Cereal Sci. 2007, 45, 134–139. [Google Scholar] [CrossRef]
- Kazman, M.E.; Lein, V. Cytological and SDS-PAGE characterization of 1994-95-grown European wheat cultivars. Annu. Wheat New. 1996, 42, 86–92. [Google Scholar]
- Liu, L.; Ikeda, T.M.; Branlard, G.; Pena, R.J.; Rogers, W.F.; Lerner, S.E.; Kolman, M.A.; Xia, X.; Wang, L.; Ma, W. Comparison of low molecular weight glutenin subunits identified by SDS-PAGE, 2-DE, MALDI-TOF-MS and PCR in common wheat. BMC Plant Biol. 2010, 10, 124–148. [Google Scholar] [CrossRef]
- Park, C.S.; Kang, C.S.; Jeung, J.U.; Woo, S.H. Influence of allelic variations in glutenin on the quality of pan bread and white salted noodles made from Korean wheat cultivars. Euphytica 2011, 180, 235–250. [Google Scholar] [CrossRef]
- Liu, L.; Wang, A.; Appels, R.; Ma, J.; Xia, X.; Lan, P.; He, Z.; Bekes, F.; Yan, Y.; Ma, W. A MALDI-TOF based analysis of high molecular weight glutenin subunits for wheat breeding. J. Cereal Sci. 2009, 50, 295–301. [Google Scholar] [CrossRef]
- Hua, C.; Takata, K.; Yang-Fen, Z.; Ikeda, T.M.; Yanaka, M.; Nagamine, T.; Fujimaki, H. Novel high molecular weight glutenin subunits at the Glu-D1 locus in wheat landraces from the Xinjiang district of China and relationship with winter habit. Breed. Sci. 2005, 55, 459–463. [Google Scholar] [CrossRef]
- Shewry, P.R.; Field, J.M.; Faulks, A.J.; Parmar, S.; Miflin, B.J.; Dietler, M.D.; Lew, E.J.-L.; Kasarda, D.D. The purification and N-terminal amino acid sequence analysis of the high molecular weight gluten polypeptides of wheat. Biochim. Biophys. Acta 1984, 788, 23–34. [Google Scholar] [CrossRef]
- Ma, W.; Zhang, W.; Gale, K.R. Multiplex-PCR typing of high molecular weight glutenin alleles in wheat. Euphytica 2003, 134, 51–60. [Google Scholar] [CrossRef]
- Ragupathy, R.; Naeem, H.A.; Reimer, E.; Lukow, O.M.; Sapirstein, H.D.; Cloutier, S. Evolutionary origin of the segmental duplication encompassing the wheat Glu-B1 locus encoding the overexpressed Bx7 (Bx7OE) high molecular weight glutenin subunit. Theor. Appl. Genet. 2008, 116, 283–296. [Google Scholar] [CrossRef] [PubMed]


| Factors | Parameters |
|---|---|
| Alkylating reagent | DTT |
| DTT, 4-vinylpyridine | |
| Solvent components | 0.1% TFA in 30% ACN |
| 0.1% TFA in 50% ACN | |
| SA dissolved in 0.1% TFA in 30% ACN | |
| SA dissolved in 0.1% TFA in 50% ACN | |
| Dilution volume | 10 μL |
| 50 μL | |
| 100 μL | |
| Matrix II | SA dissolved in 30% ACN |
| SA dissolved in 50% ACN | |
| SA dissolved in 0.1% TFA in 30% ACN | |
| SA dissolved in 0.1% TFA in 50% ACN |
| HMW-GS | MW (Da) 1 | RSD (%) 2 | ||||||||||||
|---|---|---|---|---|---|---|---|---|---|---|---|---|---|---|
| Glu-A1 | Glu-B1 | Glu-D1 | Reference | Glu-A1 | Glu-B1 | Glu-D1 | Glu-A1 | Glu-B1 | Glu-D1 | |||||
| Cultivar Name | x | x + y | x + y | x | x | y | x | y | x | x | y | x | y | |
| APEXAL | N | 7 + 9 | 5 + 10 | Branlard et al. [44] | 82,831 | 74,264 | 88,458 | 68,388 | 0.036 | 0.054 | 0.050 | 0.032 | ||
| BRIMSTONE | N | 6 + 8* | 2 + 12 | Liu et al. [50] | 86,840 | 75,993 | 87,431 | 69,404 | 0.076 | 0.083 | 0.014 | 0.071 | ||
| CAPPELLE-DESPREZ | N | 7 | 2 + 12 | Liu et al. [50] | 83,416 | 87,364 | 69,390 | 0.072 | 0.050 | 0.054 | ||||
| CHEYENNE | 2* | 7 + 9 | 5 + 10 | Dupont et al. [46] | 86,556 | 82,824 | 74,295 | 88,450 | 68,400 | 0.036 | 0.076 | 0.059 | 0.078 | 0.073 |
| CHINESE SPRING | N | 7 + 8 | 2 + 12 | Liu et al. [50] | 83,488 | 75,886 | 87,493 | 69,410 | 0.013 | 0.025 | 0.020 | 0.009 | ||
| CLEMENT | N | 6 + 8* | 2 + 12 | Liu et al. [50] | 86,828 | 75,981 | 87,379 | 69,414 | 0.091 | 0.066 | 0.037 | 0.069 | ||
| GLENLEA | 2* | 7oe + 8* | 5 + 10 | Naeem and Sapirstein [21] | 86,591 | 83,402 | 75,878 | 88,477 | 68,353 | 0.025 | 0.068 | 0.050 | 0.031 | 0.034 |
| HANNO | 1 | 14 + 15 | 5 + 10 | Gao et al. [20] | 87,986 | 82,786 | 75,526 | 88,459 | 68,346 | 0.030 | 0.039 | 0.035 | 0.068 | 0.021 |
| IMBROS | 1 | 14 + 15 | 2 + 12 | Kazman et al. [47] | 87,902 | 82,767 | 75,552 | 87,423 | 69,404 | 0.039 | 0.035 | 0.033 | 0.025 | 0.037 |
| INSIGNIA | 1 | 20 + 20 | 5 + 10 | Branlard et al. [44] | 87,982 | 84,014 | 75,859 | 88,446 | 68,383 | 0.015 | 0.078 | 0.057 | 0.063 | 0.068 |
| MAGNIF27 | 2* | 13 + 16 | 2 + 12 | Branlard et al. [44] | 86,661 | 83,475 | 77,790 | 87,413 | 69,409 | 0.071 | 0.061 | 0.084 | 0.081 | 0.070 |
| NANBU-KOMUGI | 1 | 7 + 8 | 4 + 12 | Liu et al. [50] | 87,893 | 83,437 | 75,876 | 85,873 | 69,393 | 0.060 | 0.022 | 0.030 | 0.062 | 0.043 |
| NEEPAWA | 2* | 7 + 9 | 5 + 10 | Liu et al. [50] | 86,608 | 82,881 | 74,274 | 88,506 | 68,388 | 0.068 | 0.028 | 0.044 | 0.055 | 0.072 |
| NORIN 61 | 2* | 7 + 8 | 2.2 + 12 | Hua et al. [51] | 86,572 | 82,842 | 75,869 | 100,811 | 69,362 | 0.042 | 0.067 | 0.077 | 0.044 | 0.065 |
| OPATA | 2* | 13 + 16 | 2 + 12 | Liu et al. [50] | 86,555 | 83,466 | 77,824 | 87,371 | 69,425 | 0.036 | 0.055 | 0.072 | 0.076 | 0.025 |
| ORCA | N | 7 | 2 + 12 | Liu et al. [50] | 82,823 | 87,331 | 69,393 | 0.055 | 0.068 | 0.030 | ||||
| OREPI | 1 | 7 | 4 + 12 | Branlard et al. [44] | 87,949 | 83,483 | 86,380 | 69,433 | 0.044 | 0.031 | 0.066 | 0.045 | ||
| PETREL | N | 7 | 5 + 10 | Liu et al. [50] | 83,405 | 88,432 | 68,339 | 0.052 | 0.020 | 0.078 | ||||
| SOISSONS | 2* | 7 + 8 | 5 + 10 | Liu et al. [50] | 86,601 | 82,803 | 75,865 | 88,457 | 68,337 | 0.048 | 0.069 | 0.059 | 0.032 | 0.074 |
| THESEE | N | 6 + 8* | 2 + 12 | Liu et al. [50] | 86,861 | 76,017 | 87,381 | 69,439 | 0.048 | 0.046 | 0.046 | 0.036 | ||
| SUKANG | 2* | 13 + 16 | 2 + 12 | Park et al. [49] | 86,623 | 83,448 | 77,794 | 87,370 | 69,422 | 0.092 | 0.058 | 0.044 | 0.053 | 0.088 |
| MANITAL | 2* | 17 + 18 | 2 + 12 | Liu et al. [50] | 86,598 | 79,027 | 75,960 | 87,349 | 69,381 | 0.058 | 0.036 | 0.050 | 0.046 | 0.070 |
| BAEKJOONG | 2* | 13 + 16 | 2.2 + 12 | Park et al. [49] | 86,571 | 83,480 | 77,791 | 100,809 | 69,444 | 0.079 | 0.057 | 0.052 | 0.063 | 0.056 |
| IT166460 | 1 | 7oe + 8* | 2 + 12 | Cho et al. [45] | 87,909 | 83,534 | 75,961 | 87,450 | 69,453 | 0.037 | 0.018 | 0.039 | 0.030 | 0.019 |
| Locus | HMW-GS (Accesion Number) | MW of Mature Protein (Da) 1 | MW by MALDI-TOF-MS (Da) 2 | Cultivars | Difference (Da) | Error (%) | |
|---|---|---|---|---|---|---|---|
| Glu-A1 | x | 1 | 87,679 | 87,565 | Hanno | −114 | −0.13 |
| (X61009) | 87,481 | Imbros | −198 | −0.23 | |||
| 87,561 | Insignia | −118 | −0.13 | ||||
| 87,472 | Nanbu-Komugi | −207 | −0.24 | ||||
| 87,528 | Orepi | −151 | −0.17 | ||||
| 87,488 | IT166460 | −191 | −0.22 | ||||
| 2* | 86,335 | 86,135 | Cheyenne | −200 | −0.23 | ||
| (M22208) | 86,170 | Glenlea | −165 | −0.19 | |||
| 86,240 | Magnif 27 | −95 | −0.11 | ||||
| 86,187 | Neepawa | −148 | −0.17 | ||||
| 86,151 | Norin 61 | −184 | −0.21 | ||||
| 86,134 | Opata | −201 | −0.23 | ||||
| 86,180 | Soissons | −155 | −0.18 | ||||
| 86,202 | Sukang | −133 | −0.15 | ||||
| 86,177 | Manital | −158 | −0.18 | ||||
| 86,150 | Baekjoong | −185 | −0.21 | ||||
| Glu-B1 | x | 6 | 86,523 | 86,419 | Brimstone | −104 | −0.12 |
| (KX454509) | 86,407 | Clement | −116 | −0.13 | |||
| 86,440 | Thesee | −83 | −0.10 | ||||
| 7 (group 1) | 82,527 | 82,410 | Apexal | −117 | −0.14 | ||
| (X13927) | 82,403 | Cheyenne | −124 | −0.15 | |||
| 82,460 | Neepawa | −67 | −0.08 | ||||
| 82,421 | Norin 61 | −106 | −0.13 | ||||
| 82,402 | Orca | −125 | −0.15 | ||||
| 82,382 | Soissons | −145 | −0.18 | ||||
| 7 (group 2) | 82,527 | 82,995 | Cappelle-Desprez | 468 | 0.57 | ||
| (X13927) | 83,067 | Chinese Spring | 540 | 0.65 | |||
| 83,016 | Nanbu-Komugi | 489 | 0.59 | ||||
| 83,062 | Orepi | 535 | 0.65 | ||||
| 82,984 | Petrel | 457 | 0.55 | ||||
| 7OE | 83,122 | 82,981 | Glenlea | −141 | −0.17 | ||
| (EU157184) | 83,113 | IT166460 | −9 | −0.01 | |||
| 13 | 83,209 | 83,054 | Magnif 27 | −155 | −0.19 | ||
| (EF540764) | 83,045 | Opata | −164 | −0.20 | |||
| 83,027 | Sukang | −182 | −0.22 | ||||
| 83,059 | Baekjoong | −150 | −0.18 | ||||
| 14 | 82,343 | 82,365 | Hanno | 22 | 0.03 | ||
| (KF733216) | 82,346 | Imbros | 3 | 0.00 | |||
| 17 | 77,960 | 78,606 | Manital | 646 | 0.83 | ||
| (AB263219) | |||||||
| 20 | 83,895 | 83,803 | Insignia | −92 | −0.11 | ||
| (AJ437000) | |||||||
| y | 8 | 75,159 | 75,150 | Chinese Spring | −9 | −0.01 | |
| (AY245797) | 75,140 | Nanbu-Komugi | −19 | −0.03 | |||
| 75,133 | Norin 61 | −26 | −0.03 | ||||
| 75,133 | Soissons | −26 | −0.03 | ||||
| 8* | N/A | 75,257 | Brimstone | ||||
| 75,245 | Clement | ||||||
| 75,142 | Glenlea | ||||||
| 75,281 | Thesee | ||||||
| 75,225 | IT166460 | ||||||
| 9 | 73,517 | 73,528 | Apexal | 11 | 0.01 | ||
| (X61026) | 73,559 | Cheyenne | 42 | 0.06 | |||
| 73,538 | Neepawa | 21 | 0.03 | ||||
| 15 | 74,738 | 74,790 | Hanno | 52 | 0.07 | ||
| (KF733215) | 74,816 | Imbros | 78 | 0.10 | |||
| 16 | 77,283 | 77,054 | Magnif 27 | −229 | −0.30 | ||
| (EF540765) | 77,088 | Opata | −195 | −0.25 | |||
| 77,058 | Sukang | −225 | −0.29 | ||||
| 77,055 | Baekjoong | −228 | −0.29 | ||||
| 18 | 75,187 | 75,224 | Manital | 37 | 0.05 | ||
| (KF430649) | |||||||
| 20 (LN828972) | 75,148 | 75,123 | Insignia | −25 | −0.03 | ||
| Glu-D1 | x | 2 | 87,007 | 87,010 | Brimstone | 3 | 0.00 |
| (X03346) | 86,943 | Cappelle-Desprez | −64 | −0.07 | |||
| 87,072 | Chinese Spring | 65 | 0.07 | ||||
| 86,958 | Clement | −49 | −0.06 | ||||
| 87,002 | Imbros | −5 | −0.01 | ||||
| 86,992 | Magnif 27 | −15 | −0.02 | ||||
| 86,950 | Opata | −57 | −0.07 | ||||
| 86,910 | Orca | −97 | −0.11 | ||||
| 86,960 | Thesee | −47 | −0.05 | ||||
| 86,949 | Suknag | −58 | −0.07 | ||||
| 86,928 | Manital | −79 | −0.09 | ||||
| 87,029 | IT166460 | 22 | 0.03 | ||||
| 2.2 | 10,0886 | 10,0390 | Norin 61 | −496 | −0.49 | ||
| (AY159367) | 10,0388 | Baekjoong | −498 | −0.49 | |||
| 4 | N/A | 85,452 | Nanbu-Komugi | ||||
| 85,959 | Orepi | ||||||
| 5 | 88,126 | 87,932 | Apexal | −194 | −0.22 | ||
| (X12928) | 87,924 | Cheyenne | −202 | −0.23 | |||
| 87,951 | Glenlea | −175 | −0.20 | ||||
| 87,933 | Hanno | −193 | −0.22 | ||||
| 87,920 | Insignia | −206 | −0.23 | ||||
| 87,980 | Neepawa | −146 | −0.17 | ||||
| 87,906 | Petrel | −220 | −0.25 | ||||
| 87,931 | Soissons | −195 | −0.22 | ||||
| y | 10 | 67,475 | 67,652 | Apexal | 177 | 0.26 | |
| (X12929) | 67,664 | Cheyenne | 189 | 0.28 | |||
| 67,617 | Glenlea | 142 | 0.21 | ||||
| 67,610 | Hanno | 135 | 0.20 | ||||
| 67,647 | Insignia | 172 | 0.25 | ||||
| 67,652 | Neepawa | 177 | 0.26 | ||||
| 67,603 | Petrel | 128 | 0.19 | ||||
| 67,601 | Soissons | 126 | 0.19 | ||||
| 12 | 68,713 | 68,668 | Brimstone | −45 | −0.07 | ||
| (X03041) | 68,654 | Cappelle-Desprez | −59 | −0.09 | |||
| 68,674 | Chinese Spring | −39 | −0.06 | ||||
| 68,678 | Clement | −35 | −0.05 | ||||
| 68,668 | Imbros | −45 | −0.07 | ||||
| 68,673 | Magnif 27 | −40 | −0.06 | ||||
| 68,637 | Nanbu-Komugi | −76 | −0.11 | ||||
| 68,626 | Norin 61 | −87 | −0.13 | ||||
| 68,689 | Opata | −24 | −0.03 | ||||
| 68,657 | Orca | −56 | −0.08 | ||||
| 68,697 | Orepi | −16 | −0.02 | ||||
| 68,703 | Thesee | −10 | −0.01 | ||||
| 68,686 | Sukang | −27 | −0.04 | ||||
| 68,645 | Manital | −68 | −0.10 | ||||
| 68,708 | Baekjoong | −5 | −0.01 | ||||
| 68,717 | IT166460 | 4 | 0.01 | ||||
| HMW-GS | MW (Da) 1 | RSD(%) 2 | |||||||||||
|---|---|---|---|---|---|---|---|---|---|---|---|---|---|
| Glu-A1 | Glu-B1 | Glu-D1 | Glu-A1 | Glu-B1 | Glu-D1 | Glu-A1 | Glu-B1 | Glu-D1 | |||||
| Specific Name | x | x + y | x + y | x | x | y | x | y | x | x | y | x | y |
| Alchan | 2* | 7 + 8 | 5 + 10 | 86,618 | 83,457 | 75,924 | 88,493 | 68,402 | 0.018 | 0.036 | 0.039 | 0.028 | 0.040 |
| Anbaek | N | 7 + 9 | 2 + 12 | 82,885 | 74,323 | 87,424 | 69,452 | 0.037 | 0.032 | 0.024 | 0.035 | ||
| Baekchal | 2* | 7 + 8* | 5 + 10 | 86,606 | 82,859 | 75,874 | 88,475 | 68,416 | 0.021 | 0.027 | 0.048 | 0.023 | 0.053 |
| Baekjoong | 2* | 13 + 16 | 2.2 + 12 | 86,595 | 83,478 | 77,808 | 100,834 | 69,443 | 0.026 | 0.060 | 0.096 | 0.026 | 0.093 |
| Chungkye | N | 7 + 8 | 2.2 + 12 | 82,905 | 75,907 | 100,854 | 69,427 | 0.034 | 0.016 | 0.013 | 0.053 | ||
| Dabun | 2* | 7 + 8 | 2.2 + 12 | 86,582 | 83,437 | 75,889 | 100,834 | 69,402 | 0.031 | 0.034 | 0.019 | 0.019 | 0.039 |
| Dahong | N | 7 + 8 | 2.2 + 12 | 83,444 | 75,907 | 100,821 | 69,415 | 0.033 | 0.031 | 0.017 | 0.080 | ||
| Dajoong | 2* | 13 + 16 | 2.2 + 12 | 86,634 | 83,505 | 77,858 | 100,834 | 69,456 | 0.025 | 0.040 | 0.054 | 0.015 | 0.046 |
| Eunpa | N | 7 + 9 | 2.2 + 12 | 82,851 | 74,312 | 100,855 | 69,415 | 0.039 | 0.077 | 0.032 | 0.047 | ||
| Geuru | N | 7 + 8 | 2.2 + 12 | 83,445 | 75,884 | 100,828 | 69,417 | 0.032 | 0.037 | 0.031 | 0.039 | ||
| Gobun | N | 7 + 9 | 2 + 12 | 82,903 | 74,353 | 87,427 | 69,427 | 0.042 | 0.021 | 0.022 | 0.054 | ||
| Goso | 2* | 7 + 8 | 2.2 + 12 | 86,601 | 83,429 | 75,922 | 100,838 | 69,467 | 0.017 | 0.035 | 0.045 | 0.033 | 0.025 |
| Hanbaek | 2* | 7 + 8 | 5 + 10 | 86,661 | 83,492 | 75,922 | 88,491 | 68,408 | 0.047 | 0.030 | 0.038 | 0.048 | 0.052 |
| Hojoong | 2* | 7 + 8 | 2.2 + 12 | 86,631 | 82,886 | 75,926 | 100,830 | 69,445 | 0.054 | 0.046 | 0.011 | 0.015 | 0.045 |
| Jeokjoong | 2* | 13 + 16 | 2.2 + 12 | 86,659 | 83,488 | 77,826 | 100,826 | 69,447 | 0.056 | 0.055 | 0.073 | 0.033 | 0.081 |
| Jinpoom | N | 7 + 8 | 2.2 + 12 | 82,907 | 75,926 | 100,842 | 69,449 | 0.035 | 0.031 | 0.024 | 0.029 | ||
| Joa | 2* | 7 + 8 | 2.2 + 12 | 86,617 | 82,913 | 75,932 | 100,852 | 69,462 | 0.032 | 0.053 | 0.036 | 0.020 | 0.046 |
| Joeun | N | 13 + 16 | 2.2 + 12 | 83,505 | 77,876 | 100,835 | 69,447 | 0.032 | 0.045 | 0.028 | 0.043 | ||
| Jojoong | N | 13 + 16 | 2.2 + 12 | 83,504 | 77,858 | 100,836 | 69,446 | 0.033 | 0.038 | 0.018 | 0.039 | ||
| Jokyung | 1 | 7 + 8 | 5 + 10 | 87,970 | 83,433 | 75,902 | 88,473 | 68,361 | 0.027 | 0.037 | 0.048 | 0.012 | 0.033 |
| Jonong | N | 7 + 9 | 2 + 12 | 82,874 | 74,308 | 87,421 | 69,437 | 0.050 | 0.035 | 0.028 | 0.017 | ||
| Joonmo2008 | N | 17 + 18 | 5 + 10 | 79,062 | 75,969 | 88,480 | 68,374 | 0.030 | 0.047 | 0.035 | 0.039 | ||
| Joongmo2012 | 2* | 7 + 8 | 5 + 10 | 86,632 | 83,442 | 75,896 | 88,484 | 68,411 | 0.044 | 0.041 | 0.046 | 0.022 | 0.050 |
| Jopoom | N | 13 + 16 | 2.2 + 12 | 83,490 | 77,858 | 100,865 | 69,440 | 0.044 | 0.064 | 0.024 | 0.038 | ||
| Keumkang | 2* | 7 + 8 | 5 + 10 | 86,580 | 83,448 | 75,907 | 88,500 | 68,395 | 0.033 | 0.052 | 0.046 | 0.030 | 0.064 |
| Milsung | N | 7 + 8 | 2.2 + 12 | 83,448 | 75,911 | 100,857 | 69,455 | 0.025 | 0.051 | 0.035 | 0.031 | ||
| Namhae | N | 7 + 8 | 2.2 + 12 | 82,909 | 75,911 | 100,848 | 69,463 | 0.028 | 0.040 | 0.016 | 0.029 | ||
| Ol | N | 7 + 8 | 2.2 + 12 | 82,868 | 75,883 | 100,846 | 69,426 | 0.028 | 0.021 | 0.037 | 0.037 | ||
| Olgeuru | 2* | 7 + 8 | 2.2 + 12 | 86,672 | 83,461 | 75,927 | 100,848 | 69,458 | 0.031 | 0.031 | 0.060 | 0.022 | 0.040 |
| Saeol | N | 7 + 8 | 2.2 + 12 | 83,434 | 75,924 | 100,846 | 69,441 | 0.042 | 0.069 | 0.029 | 0.043 | ||
| Seodun | N | 7 + 8 | 2.2 + 12 | 82,898 | 75,936 | 100,851 | 69,451 | 0.056 | 0.018 | 0.023 | 0.045 | ||
| Sinmichal | 2* | 7 + 8* | 2.2 + 12 | 86,640 | 82,877 | 75,908 | 100,852 | 69,425 | 0.054 | 0.028 | 0.034 | 0.017 | 0.038 |
| Sinmichal1 | N | 7 + 9 | 2 + 12 | 82,863 | 74,328 | 87,389 | 69,424 | 0.042 | 0.031 | 0.042 | 0.053 | ||
| Suan | 2* | 7 + 8 | 2.2 + 12 | 86,616 | 82,858 | 75,918 | 100,853 | 69,418 | 0.017 | 0.028 | 0.034 | 0.017 | 0.020 |
| Sukang | 2* | 13 + 16 | 2 + 12 | 86,660 | 83,522 | 77,831 | 87,410 | 69,420 | 0.020 | 0.033 | 0.033 | 0.034 | 0.015 |
| Tapdong | 2* | 7 + 8 | 5 + 10 | 86,628 | 82,884 | 75,942 | 88,503 | 68,384 | 0.022 | 0.019 | 0.036 | 0.032 | 0.038 |
| Uri | N | 7 + 8 | 2.2 + 12 | 83,461 | 75,923 | 100,819 | 69,438 | 0.035 | 0.036 | 0.025 | 0.053 | ||
| Younbaek | 2* | 13 + 16 | 2.2 + 12 | 86,644 | 83,476 | 77,861 | 100,838 | 69,433 | 0.024 | 0.026 | 0.046 | 0.023 | 0.055 |
© 2020 by the authors. Licensee MDPI, Basel, Switzerland. This article is an open access article distributed under the terms and conditions of the Creative Commons Attribution (CC BY) license (http://creativecommons.org/licenses/by/4.0/).
Share and Cite
Jang, Y.-R.; Cho, K.; Kim, S.W.; Altenbach, S.B.; Lim, S.-H.; Sim, J.-R.; Lee, J.-Y. Development of an Optimized MALDI-TOF-MS Method for High-Throughput Identification of High-Molecular-Weight Glutenin Subunits in Wheat. Molecules 2020, 25, 4347. https://doi.org/10.3390/molecules25184347
Jang Y-R, Cho K, Kim SW, Altenbach SB, Lim S-H, Sim J-R, Lee J-Y. Development of an Optimized MALDI-TOF-MS Method for High-Throughput Identification of High-Molecular-Weight Glutenin Subunits in Wheat. Molecules. 2020; 25(18):4347. https://doi.org/10.3390/molecules25184347
Chicago/Turabian StyleJang, You-Ran, Kyoungwon Cho, Se Won Kim, Susan B. Altenbach, Sun-Hyung Lim, Jae-Ryeong Sim, and Jong-Yeol Lee. 2020. "Development of an Optimized MALDI-TOF-MS Method for High-Throughput Identification of High-Molecular-Weight Glutenin Subunits in Wheat" Molecules 25, no. 18: 4347. https://doi.org/10.3390/molecules25184347
APA StyleJang, Y.-R., Cho, K., Kim, S. W., Altenbach, S. B., Lim, S.-H., Sim, J.-R., & Lee, J.-Y. (2020). Development of an Optimized MALDI-TOF-MS Method for High-Throughput Identification of High-Molecular-Weight Glutenin Subunits in Wheat. Molecules, 25(18), 4347. https://doi.org/10.3390/molecules25184347