Diarylphosphate as a New Route for Design of Highly Luminescent Ln Complexes

 , ,
, , 
Abstract
1. Introduction
2. Results and Discussion
2.1. Bis-((2,6-Diisopropyl)Phenyl)Phosphate Lanthanide Complexes, Synthesis, and Photophysical Properties
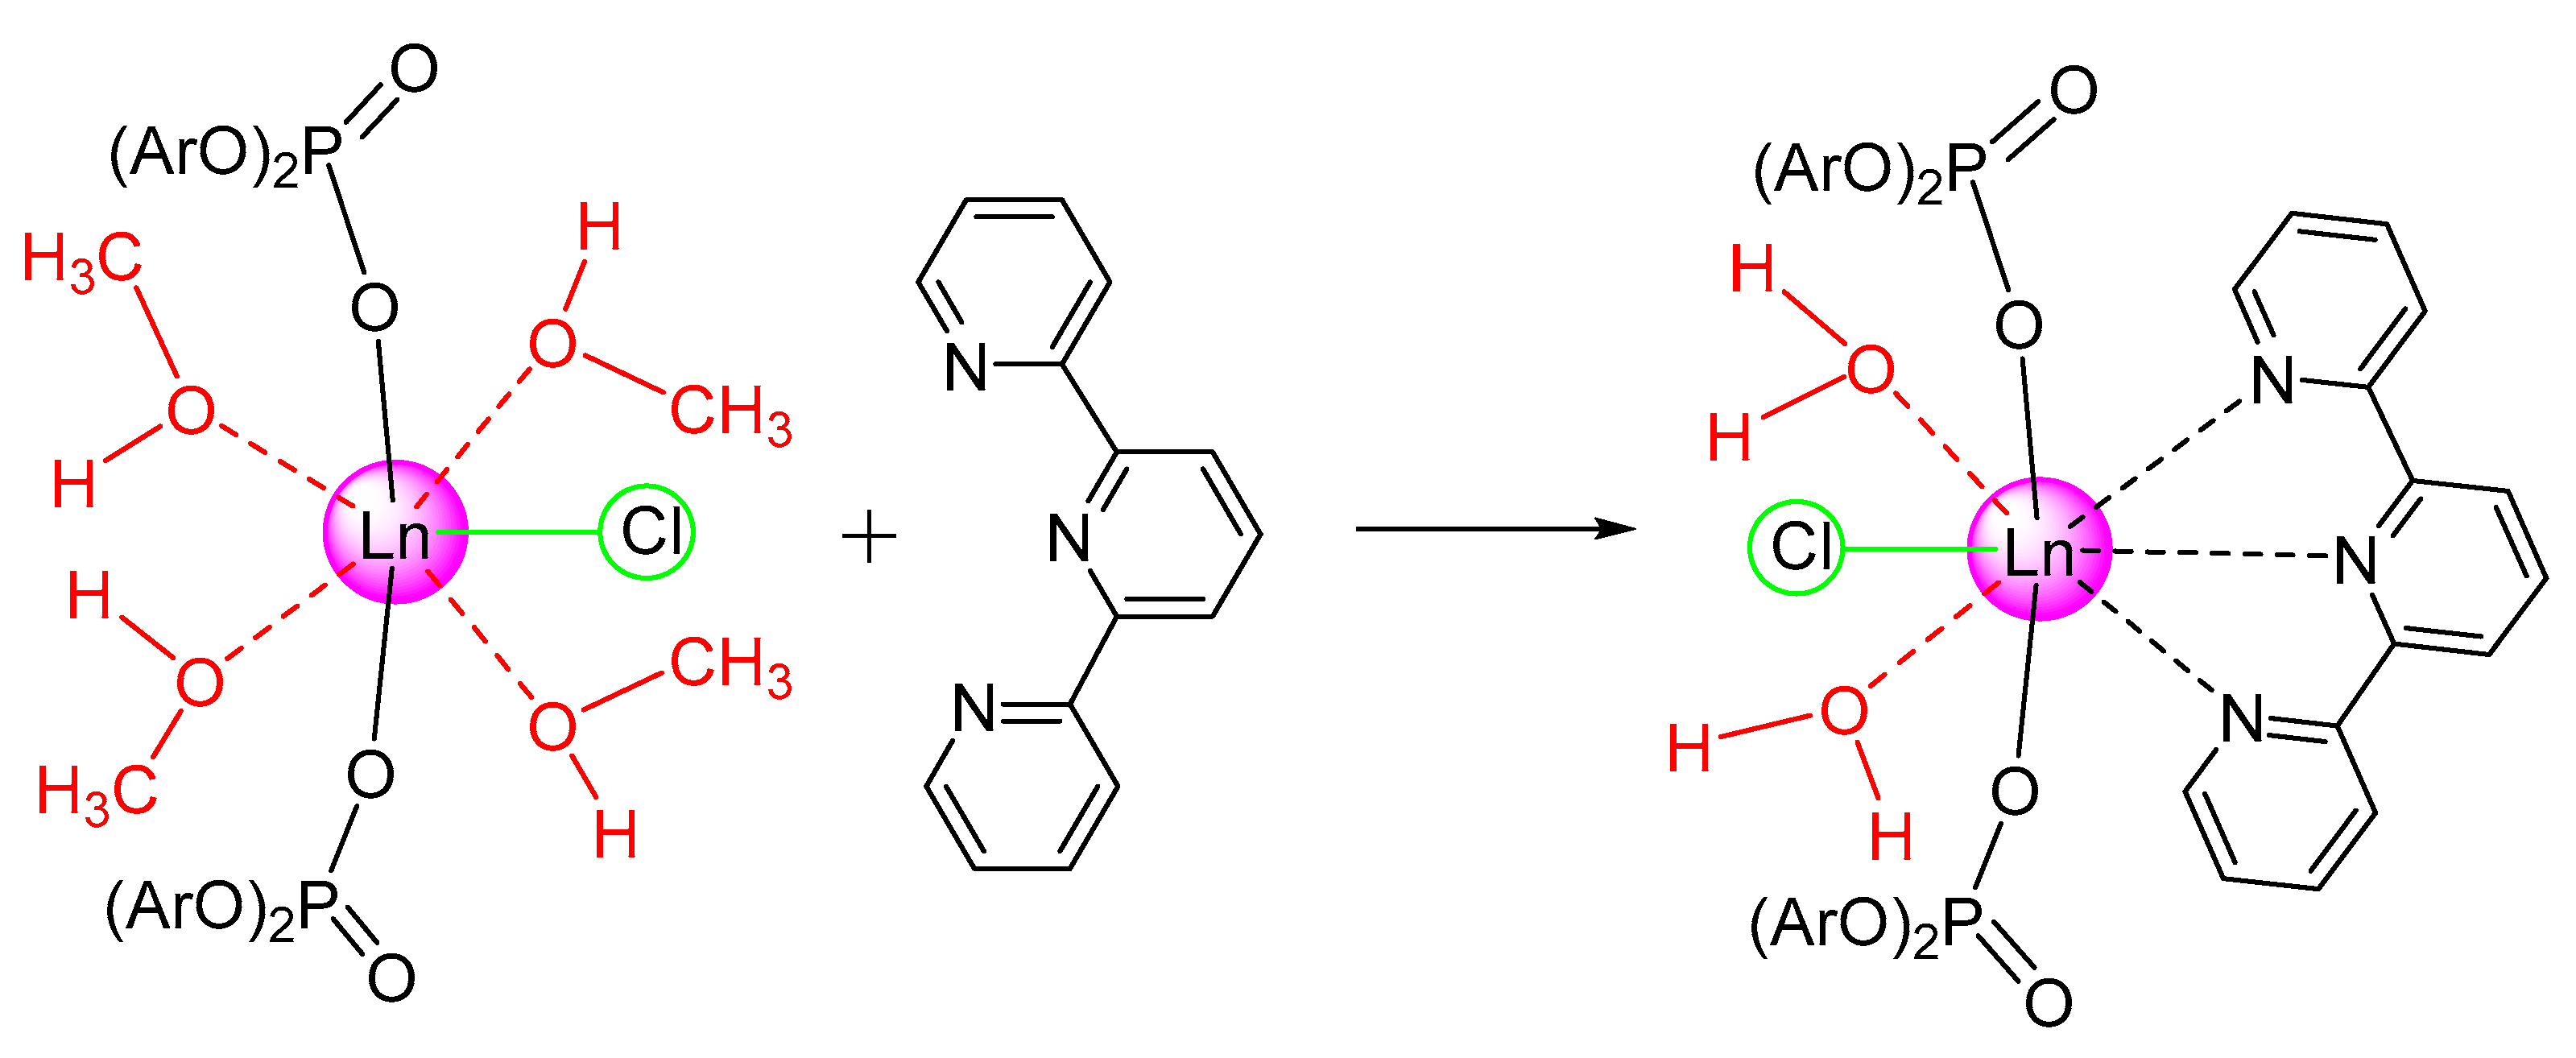
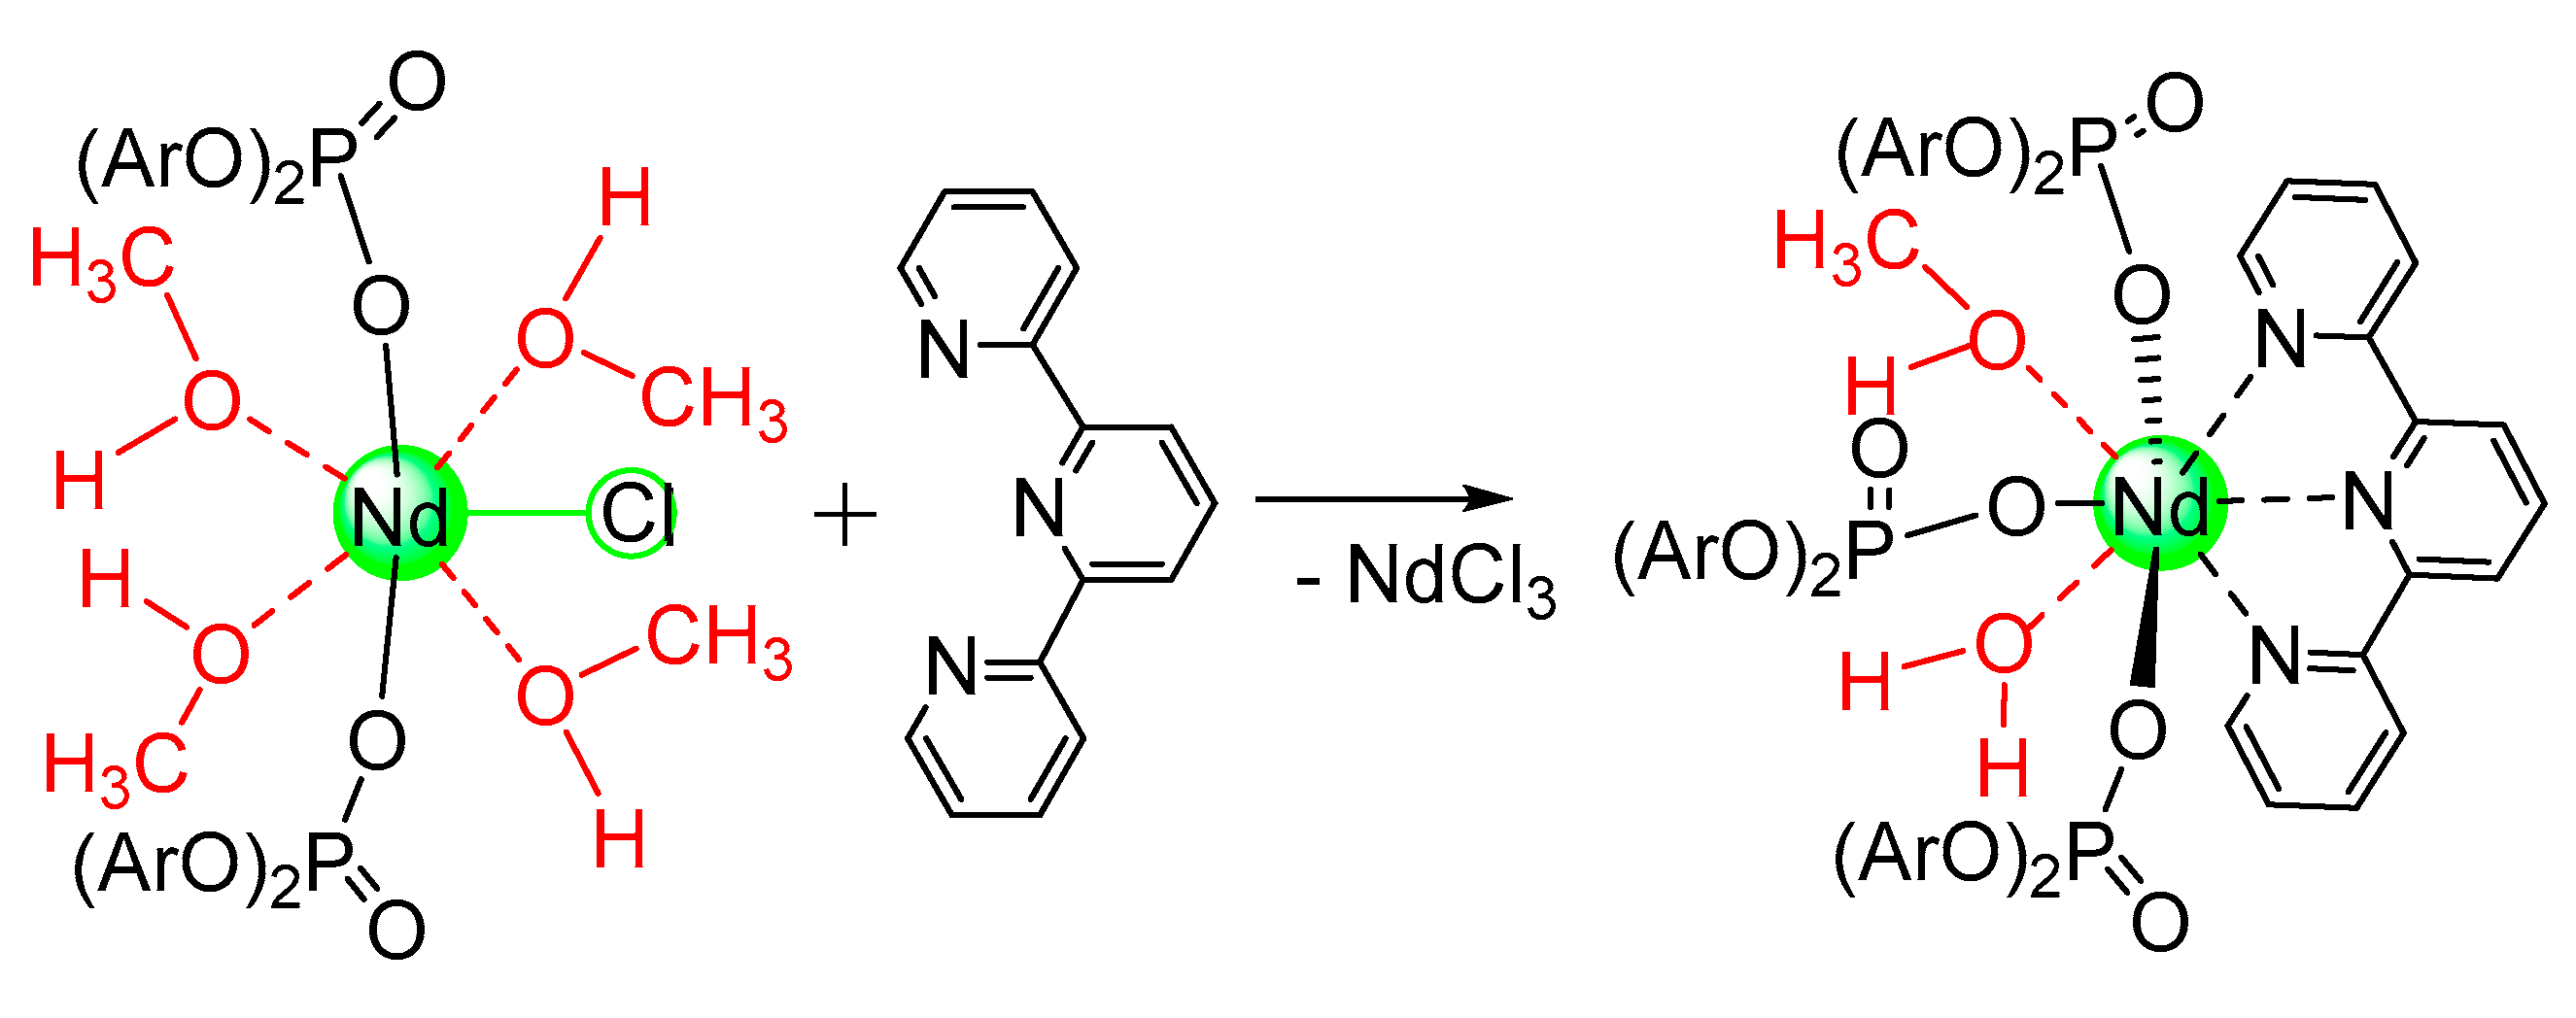
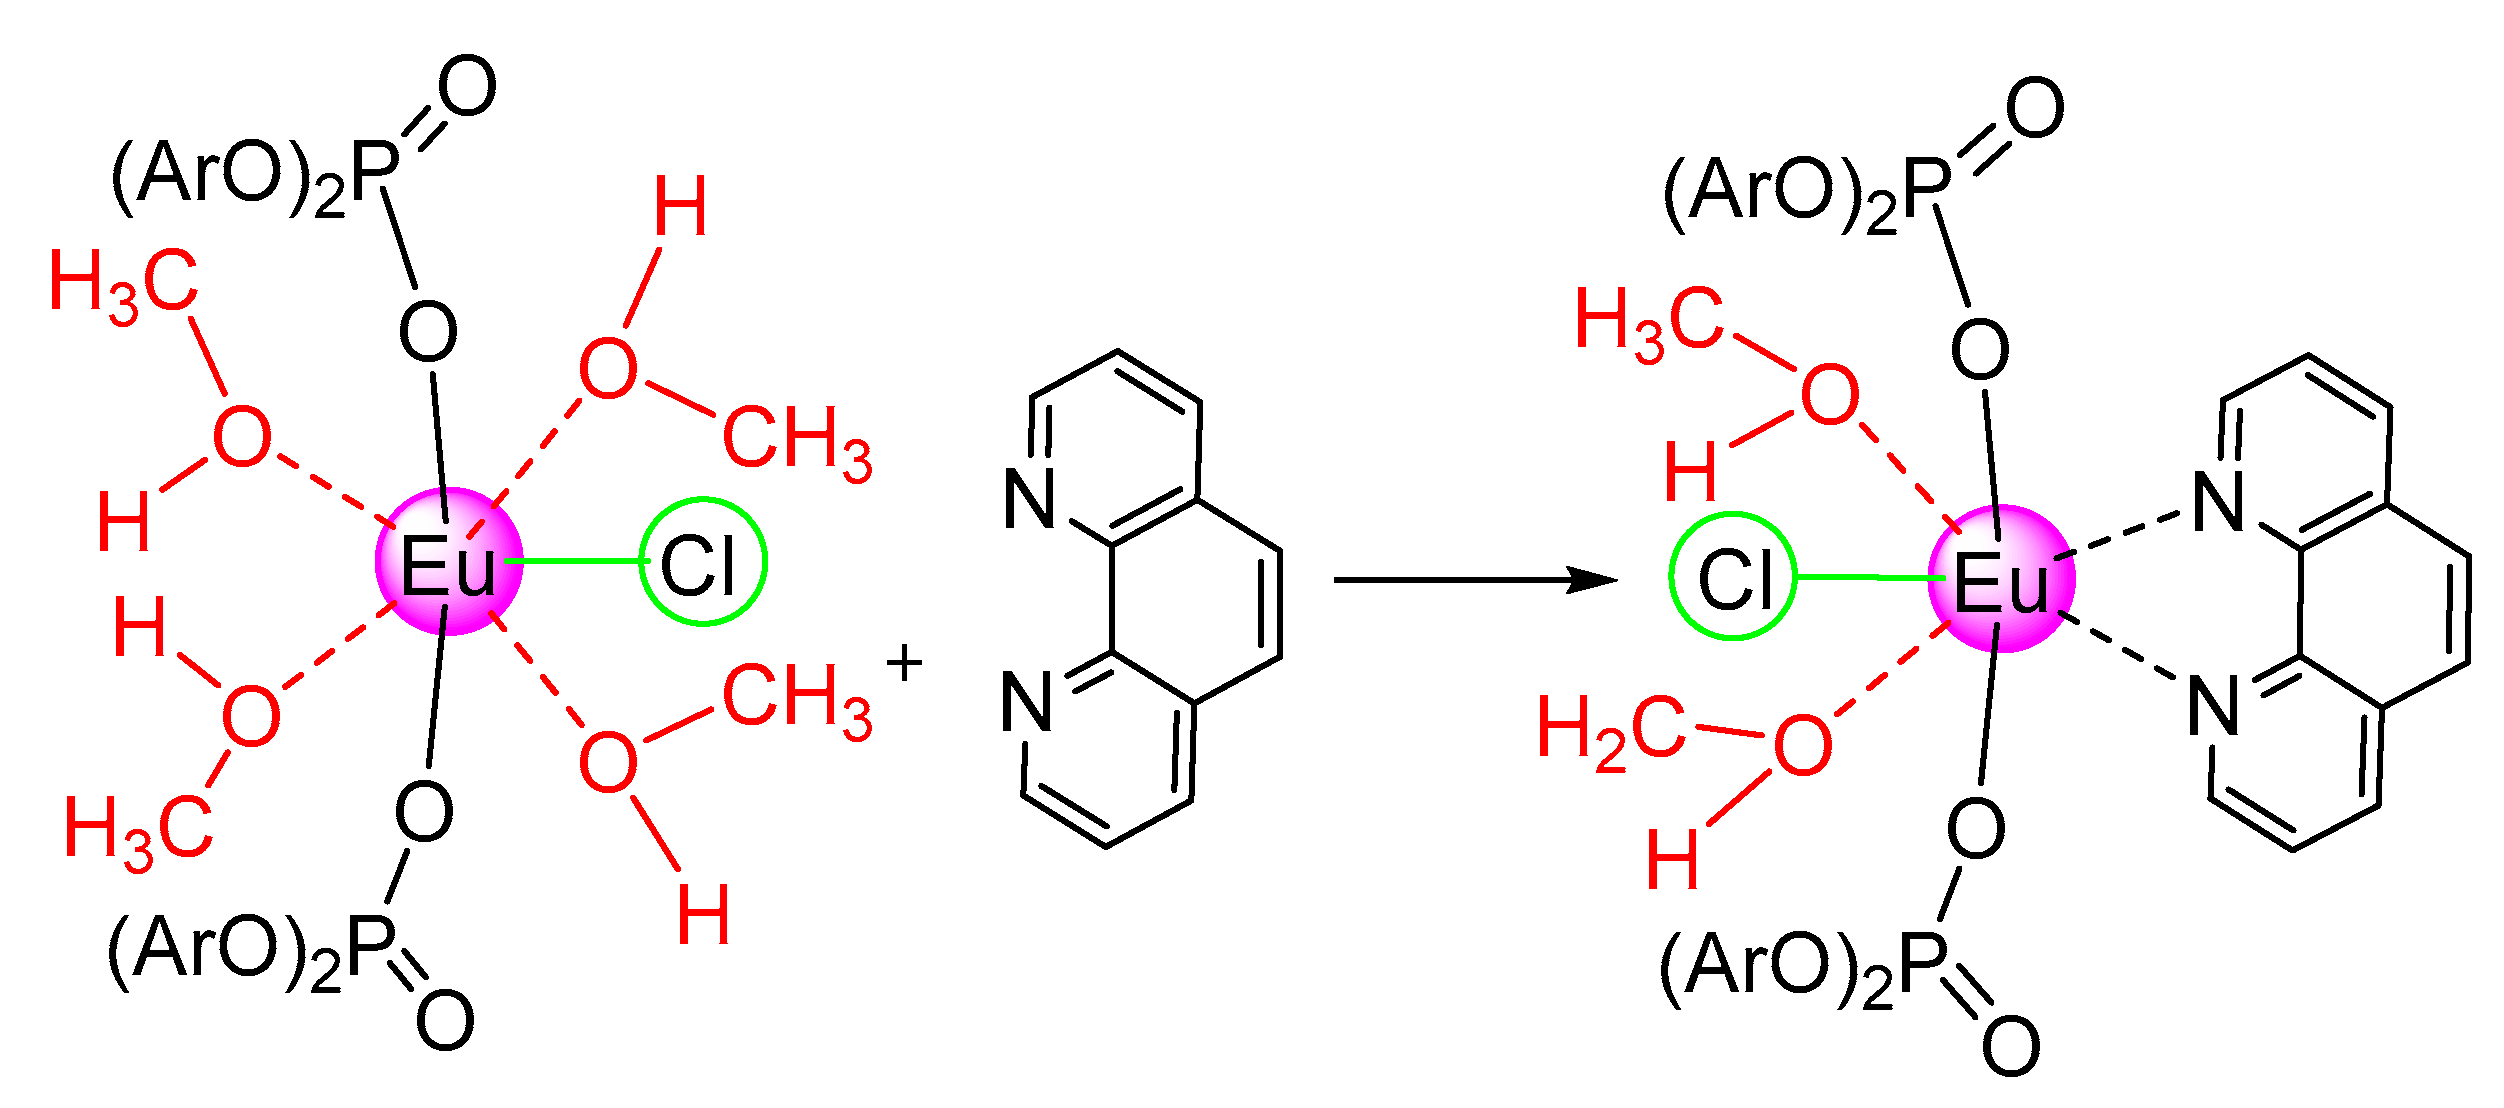
2.2. Adducts of Bis- and Trisdiisopropylphenylphosphate Complexes with Terpyridine
2.3. Photophysical Properties
3. Materials and Methods
3.1. General Remarks
3.2. X-ray Crystallography
3.3. Synthesis and Characterization
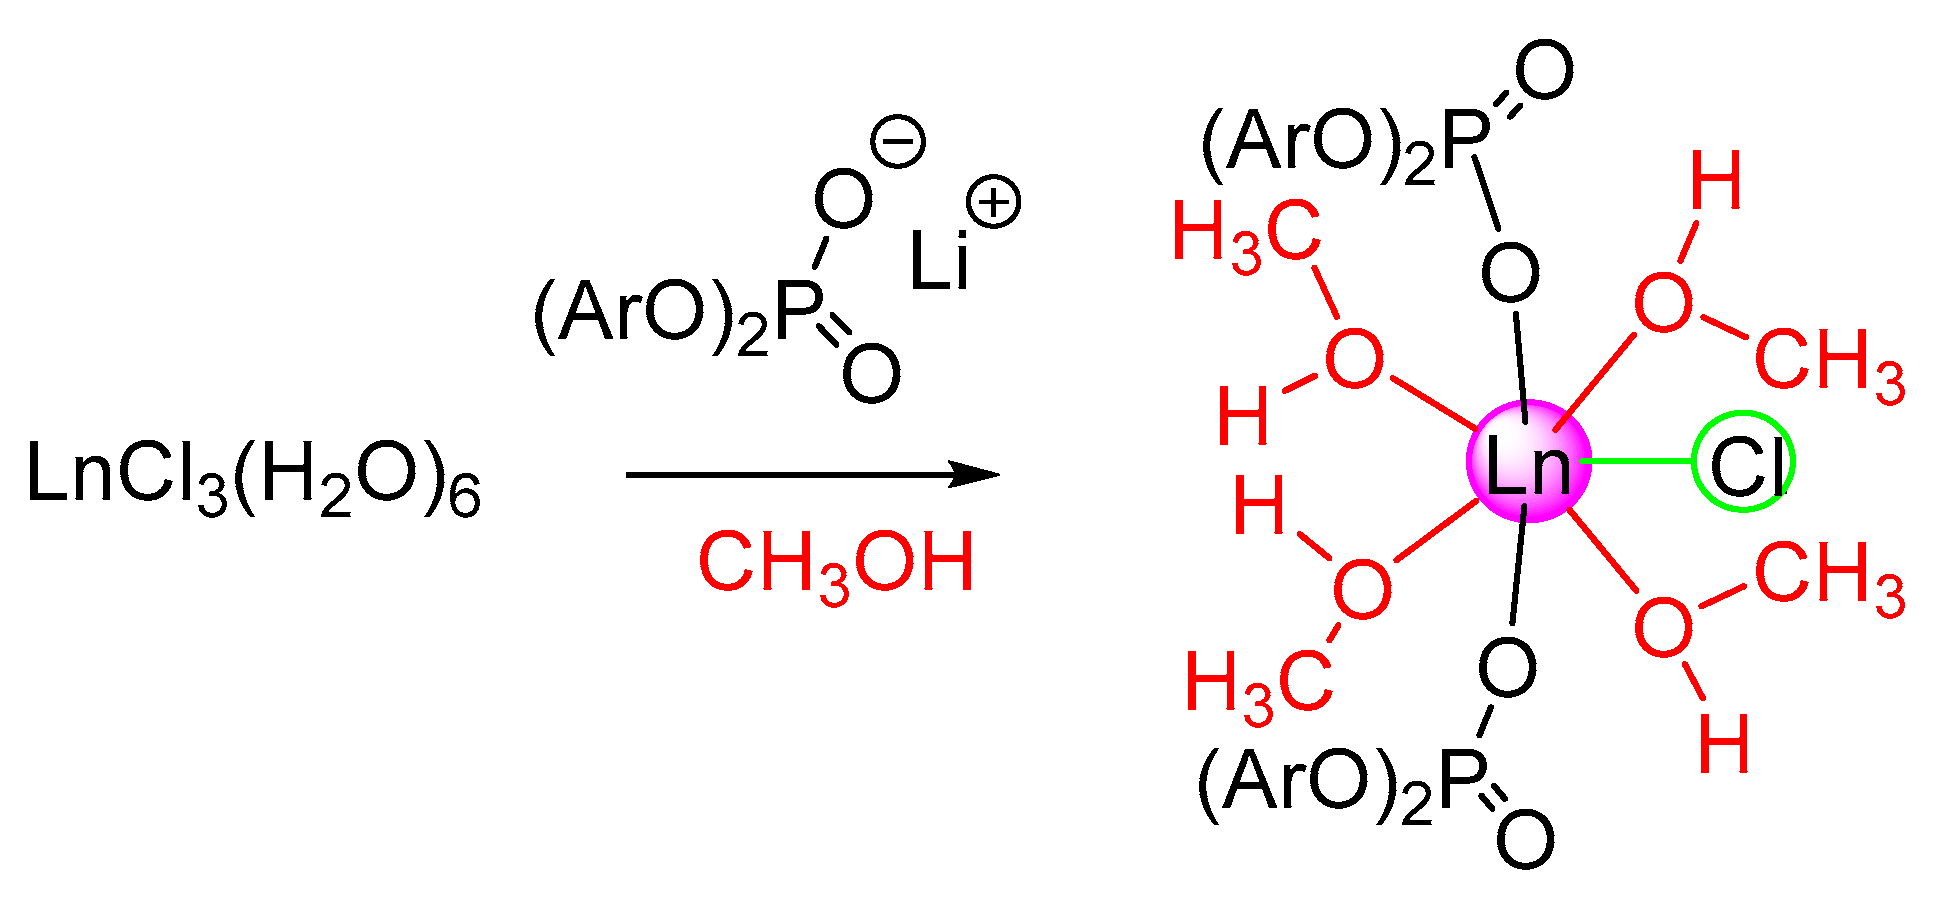
3.3.1. Synthesis of [{(2,6-iPr2C6H3-O)2POO}2EuCl(CH3OH)4]·2CH3OH (2)
3.3.2. Synthesis of [{(2,6-iPr2C6H3-O)2POO}2GdCl(CH3OH)4]·2CH3OH (3)
3.3.3. Synthesis of [{(2,6-iPr2C6H3-O)2POO}2TbCl(CH3OH)4]·2CH3OH (4)
3.3.4. Synthesis of [{(2,6-iPr2C6H3-O)2POO}2EuCl(terpy)(H2O)2(CH3OH)] (5)
3.3.5. Synthesis of [{(2,6-iPr2C6H3-O)2POO}2GdCl(terpy)(H2O)2(CH3OH)] (6)
3.3.6. Synthesis of [{(2,6-iPr2C6H3-O)2POO}2TbCl(terpy)(H2O)2(CH3OH)] (7)
3.3.7. Synthesis of [[{(2,6-iPr2C6H3-O)2POO}3Nd)(terpy)(H2O)(CH3OH)] (8)
3.3.8. Synthesis of [{(2,6-iPr2C6H3-O)2POO}2EuCl(phen)(CH3OH)2] (9)
3.4. Optical Measurements
3.5. Calculation Based on Luminescence Data
4. Conclusions
Supplementary Materials
Author Contributions
Funding
Acknowledgments
Conflicts of Interest
References
- Bünzli, J.-C.G. Rising Stars in Science and Technology: Luminescent Lanthanide Materials. Eur. J. Inorg. Chem. 2017, 2017, 5058–5063. [Google Scholar] [CrossRef]
- Bünzli, J.-C.G. Lanthanide Photonics: Shaping the Nanoworld. Trends Chem. 2019, 1, 751–762. [Google Scholar] [CrossRef]
- Janicki, R.; Mondry, A.; Starynowicz, P. Carboxylates of rare earth elements. Coord. Chem. Rev. 2017, 340, 98–133. [Google Scholar] [CrossRef]
- Écija, D.; Urgel, J.I.; Seitsonen, A.P.; Auwarter, W.; Barth, J.V. Lanthanide-Directed Assembly of Interfacial Coordination Architectures–From Complex Networks to Functional Nanosystems. Acc. Chem. Res. 2018, 51, 365–375. [Google Scholar] [CrossRef]
- Minyaev, M.E.; Korchagina, S.A.; Tavtorkin, A.N.; Kostitsyna, N.N.; Churakov, A.V.; Nifant’ev, I.E. Crystal structures of mono- and binuclear neodymium diarylphosphate complexes and their catalytic activity in 1,3-diene polymerization. J. Struct. Chem. 2018, 29, 1475–1487. [Google Scholar] [CrossRef]
- Nifant’ev, I.E.; Tavtorkin, A.N.; Korchagina, S.A.; Gavrilenko, I.F.; Glebova, N.N.; Kostitsyna, N.N.; Yakovlev, V.A.; Bondarenko, G.N.; Filatova, M.P. Neodymium tris-diarylphosphates: Systematic study of the structure–reactivity relationship in butadiene and isoprene polymerization. Appl. Catal. A Gen. 2014, 478, 219–227. [Google Scholar] [CrossRef]
- Zhang, Z.; Cui, D.; Wang, B.; Liu, B.; Yang, Y. Polymerization of 1,3-Conjugated Dienes with Rare-Earth Metal Precursors. Struct. Bond 2010, 137, 49–108. [Google Scholar]
- Nifant’ev, I.E.; Tavtorkin, A.N.; Shlyahtin, A.V.; Korchagina, S.A.; Gavrilenko, I.F.; Glebova, N.N.; Churakov, A.V. Easily accessible, hydrocarbon-soluble, crystalline, anhydrous lanthanide (Nd, La, and Y) phosphates. Dalton Trans. 2013, 42, 1223–1230. [Google Scholar] [CrossRef]
- Minyaev, M.E.; Tavtorkin, A.N.; Korchagina, S.A.; Bondarenko, G.N.; Churakov, A.V.; Nifant’ev, I.E. Isomorphous rare-earth tris-[bis-(2,6-diisopropylphenyl) phosphate] complexes and their catalytic properties in 1,3-diene polymerization and in the inhibited oxidation of polydimethylsiloxane. Acta Cryst. 2018, 74, 590–598. [Google Scholar]
- Weissman, S.I. Intramolecular Energy Transfer The Fluorescence of Complexes of Europium. J. Chem. Phys. 1942, 10, 214–217. [Google Scholar] [CrossRef]
- Bünzli, J.-C.G.; Piguet, C. Taking advantage of luminescent lanthanide ions. Chem. Soc. Rev. 2005, 34, 1048–1077. [Google Scholar] [CrossRef]
- Kitagawa, Y.; Suzue, F.; Nakanishi, T.; Fushimi, K.; Hasegawa, Y. A highly luminescent Eu(III) complex based on an electronically isolated aromatic ring system with ultralong lifetime. Dalton Trans. 2018, 47, 7327–7332. [Google Scholar] [CrossRef]
- Haas, Y.; Stein, G.; Tomkiewicz, M. Fluorescence and photochemistry of the charge-transfer band in aqueous europium(III) solutions. J. Phys. Chem. 1970, 74, 2558–2562. [Google Scholar] [CrossRef]
- Silva, A.I.S.; Lima, N.B.D.; Simas, A.M.; Gonçalves, S.M.C. Europium Complexes: Luminescence Boost by a Single Efficient Antenna Ligand. ACS Omega 2017, 2, 6786–6794. [Google Scholar] [CrossRef] [PubMed]
- Minyaev, M.E.; Nifant’ev, I.E.; Tavtorkin, A.N.; Korchagina, S.A.; Zeynalova, S.S. Crystal structure of [bis-(2,6-diisopropylphenyl) phosphato-κO]tris-(methanol-κO)lithium methanol monosolvate. Acta Cryst. Sect. E Crystallogr. Commun. 2015, 71, 443–446. [Google Scholar] [CrossRef] [PubMed]
- Binnemans, K. Interpretation of europium(III) spectra. Coord. Chem. Rev. 2015, 295, 1–45. [Google Scholar] [CrossRef]
- Bünzli, J.-C.G. On the design of highly luminescent lanthanide complexes. Coord. Chem. Rev. 2015, 293–294, 19–47. [Google Scholar] [CrossRef]
- Carneiro Neto, A.; Teotonio, E.; de Sá, G.; Brito, H.; Legendziewicz, J.; Carlos, L.; Felinto, M.; Gawryszewska, P.; Moura, R.; Longo, R.; et al. Modeling intramolecular energy transfer in lanthanide chelates: A critical review and recent advances. In Handbook on the Physics and Chemistry of Rare Earths; Bünzli, J.-C., Pecharsky, V., Eds.; Elsevier: Amsterdam, The Netherlands, 2019; Volume 56, pp. 55–162. [Google Scholar]
- Fomina, I.G.; Dobrokhotova, Z.V.; Kazak, V.O.; Aleksandrov, G.G.; Lysenko, K.A.; Puntus, L.N.; Gerasimova, V.I.; Bogomyakov, A.S.; Novotortsev, V.M.; Eremenko, I.L. Synthesis, Structure, Thermal Stability, and Magnetic and Luminescence Properties of Dinuclear Lanthanide(III) Pivalates with Chelating N-Donor Ligands. Eur. J. Inorg. Chem. 2012, 22, 3595–3610. [Google Scholar] [CrossRef]
- Tsaryuk, V.I.; Legendziewicz, J.; Zolin, V.F.; Sokolnicki, J.; Szoctak, R.; Puntus, L.N. Spectra and details of the structure of europium acetates with derivatives of 1,10-phenanthroline. J. Alloys Compd. 2001, 323, 661–666. [Google Scholar] [CrossRef]
- Zolin, V.F.; Puntus, L.N.; Tsaryuk, V.I.; Kudryashova, V.A.; Legendziewicz, J.; Gawryszewska, P.; Szostak, R. Spectroscopy of europium and terbium pyridine-carboxylates. J. Alloys Compd. 2004, 380, 279–284. [Google Scholar] [CrossRef]
- Puntus, L.N.; Zolin, V.F.; Babushkina, T.A.; Kutuza, I.B. Luminescence properties of isomeric and tautomeric lanthanide pyridinedicarboxylates. J. Alloys Compd. 2004, 380, 310–314. [Google Scholar] [CrossRef]
- Puntus, L.N.; Zolin, V.F.; Kudryashova, V.A. Charge transfer bands in the Eu3+ luminescence excitation spectra of isomeric europium pyridine-dicarboxylates. Phys. Solid State. 2002, 44, 1440–1444. [Google Scholar] [CrossRef]
- Puntus, L.N.; Chauvin, A.-S.; Varbanov, S.; Bunzli, J.-C.G. Lanthanide Complexes with a Calix [8] arene Bearing Phosphinoyl Pendant Arms. Eur. J. Inorg. Chem. 2007, 2007, 2315–2326. [Google Scholar] [CrossRef]
- Puntus, L.N.; Lyssenko, K.A.; Pekareva, I.S.; Bunzli, J.-C.G. Intermolecular Interactions as Actors in Energy-Transfer Processes in Lanthanide Complexes with 2,2′-Bipyridine. J. Phys. Chem. B 2009, 113, 9265–9277. [Google Scholar] [CrossRef]
- Petrosyants, S.P.; Ilyukhin, A.B.; Gavrikov, A.V.; Mikhlina, Y.A.; Puntus, L.N.; Varaksina, E.A.; Efimov, N.N.; Novotortsev, V.M. Luminescent and magnetic properties of mononuclear lanthanide thiocyanates with terpyridine as auxiliary ligand. Inorg. Chim. Acta 2019, 486, 499–505. [Google Scholar] [CrossRef]
- Demirbilek, R.; Heber, J.; Nikitin, S.I. Charge transfer and 4fn-4fn−1 5d transitions of trivalent rare-earth ions in CsCdBr3. Proceedings of XI Feofilov Symposium on Spectroscopy of Crystals Activated by Rare-Earth and Transition Metal Ions, Kazan, Russian Federation, 2001. Proc. SPIE 2002, 4766, 47–50. [Google Scholar]
- Puntus, L.N.; Lyssenko, K.A.; Antipin, M.Y.; Bunzli, J.-C.G. Role of Inner- and Outer-Sphere Bonding in the Sensitization of EuIII-Luminescence Deciphered by Combined Analysis of Experimental Electron Density Distribution Function and Photophysical Data. Inorg. Chem. 2008, 47, 11095–11107. [Google Scholar] [CrossRef]
- Roitershtein, D.M.; Puntus, L.N.; Vinogradov, A.A.; Lyssenko, K.A.; Minyaev, M.E.; Dobrokhodov, M.D.; Taidakov, I.V.; Varaksina, E.A.; Churakov, A.V.; Nifant’ev, I.E. Polyphenylcyclopentadienyl Ligands as an Effective Light-Harvesting π-Bonded Antenna for Lanthanide +3 Ions. Inorg. Chem. 2018, 57, 10199–10213. [Google Scholar] [CrossRef]
- Horvath, B.; Möseler, R.; Horvath, E.G.; Krauss, H.L. Über Oberflächenverbindungen von Übergangsmetallen. XI. Darstellung und Eigenschaften von Koordinativ ungesättigten Mangan(II)-Oberflächenverbindungen. Z. Anorg. Allg. Chem. 1975, 418, 1–16. [Google Scholar] [CrossRef]
- Minyaev, M.E.; Nifant’ev, I.E.; Tavtorkin, A.N.; Korchagina, S.A.; Zeynalova, S.S.; Ananyev, I.V.; Churakov, A.V. Isomorphous rare-earth bis-[bis-(2,6-diisopropylphenyl)phosphate] complexes and their self-assembly into two-dimensional frameworks by intramolecular hydrogen bonds. Acta Cryst. Sect. C Struct. Chem. 2017, 73, 820–827. [Google Scholar] [CrossRef]
- Bruker. Available online: https://www.bruker.com/products/x-ray-diffraction-and-elemental-analysis/single-crystal-x-ray-diffraction/sc-xrd-software/apex3.html (accessed on 26 August 2020).
- Krause, L.; Herbst-Irmer, R.; Sheldrick, G.M.; Stalke, D. Comparison of silver and molybdenum microfocus X-ray sources for single-crystal structure determination. J. Appl. Cryst. 2015, 48, 3–10. [Google Scholar] [CrossRef] [PubMed]
- Sheldrick, G.M. A short history of SHELX. Acta Crystallogr. Sect. A Found. Crystallogr. 2008, 64, 112–122. [Google Scholar] [CrossRef] [PubMed]
- Sheldrick, G.M. Crystal structure refinement with SHELXL. Acta Cryst. Sect. C Struct. Chem. 2015, 71, 3–8. [Google Scholar] [CrossRef] [PubMed]
- Spek, A.L. PLATON SQUEEZE: A tool for the calculation of the disordered solvent contribution to the calculated structure factors. Acta Crystallogr. Sect. C Struct. Chem. 2015, 71, 9–18. [Google Scholar] [CrossRef]
- Wrighton, M.S.; Ginley, D.S.; Morse, D.L. Technique for the determination of absolute emission quantum yields of powdered samples. J. Phys. Chem. 1974, 78, 2229–2233. [Google Scholar] [CrossRef]
- de Mello, J.C.; Wittmann, H.F.; Friend, R.H. An improved experimental determination of external photoluminescence quantum efficiency. Adv. Mater. 1997, 9, 230–232. [Google Scholar] [CrossRef]
- Greenham, N.C.; Samuel, I.D.W.; Hayes, G.R.; Phillips, R.T.; Kessener, Y.A.R.R.; Moratti, S.C.; Holmes, A.B.; Friend, R.H. Measurement of absolute photoluminescence quantum efficiencies in conjugated polymers. Chem. Phys. Lett. 1995, 241, 89–96. [Google Scholar] [CrossRef]
- Bunzli, J.-C.G. Lanthanide Luminescence for Biomedical Analyses and Imaging. Chem. Rev. 2010, 110, 2729–2755. [Google Scholar]
- Werts, M.H.V.; Jukes, R.T.F.; Verhoeven, J.W. The emission spectrum and the radiative lifetime of Eu3+ in luminescent lanthanide complexes. Phys. Chem. Chem. Phys. 2002, 4, 1542–1548. [Google Scholar] [CrossRef]
Sample Availability: Samples of the compounds are not available from the authors. |


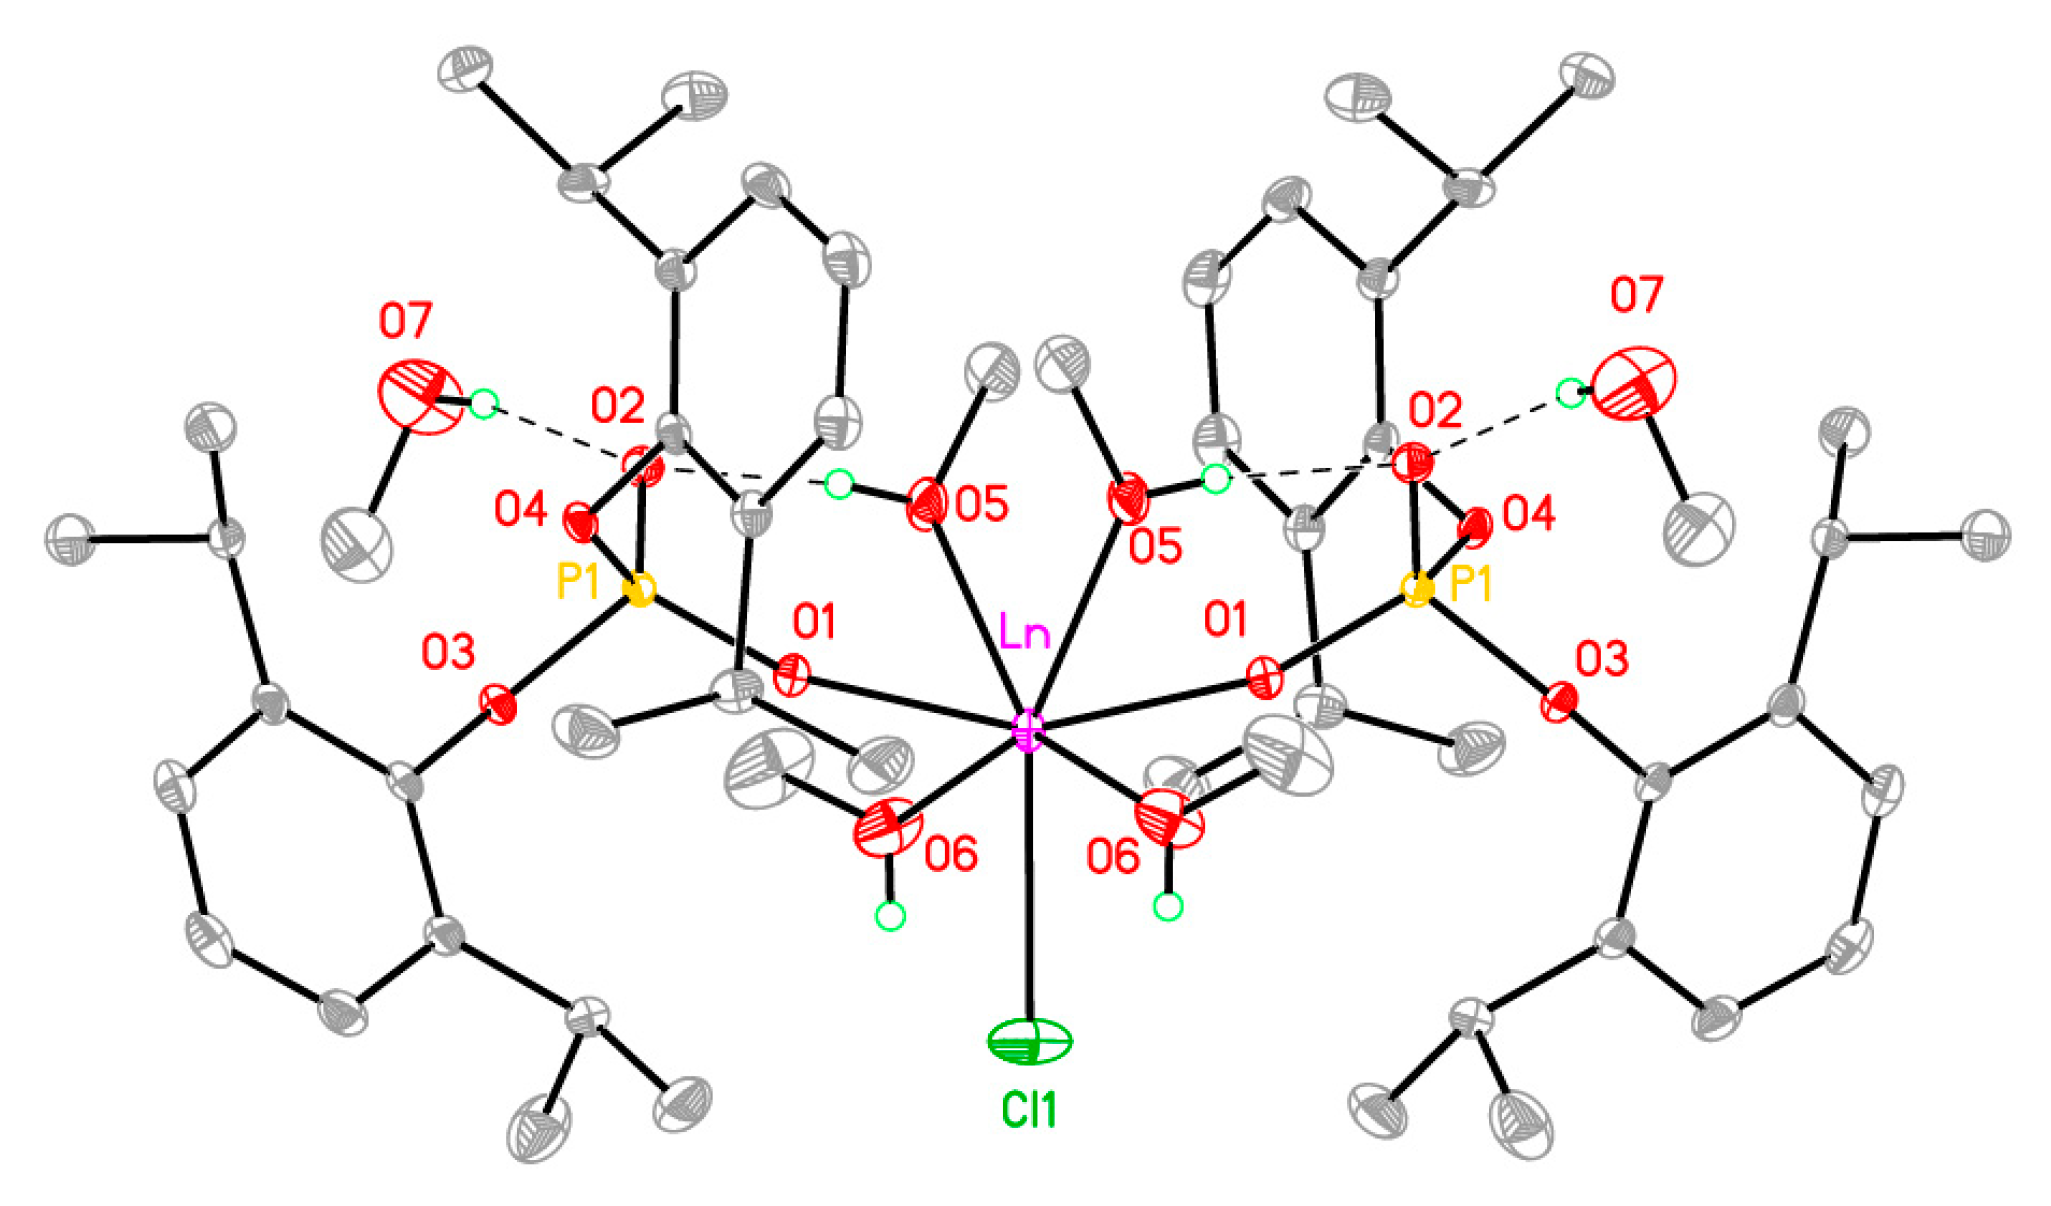
| 2 (Eu) | 3 (Gd) | 4 (Tb) | |
|---|---|---|---|
| Ln-O1 | 2.2947 (10) | 2.286 (2) | 2.2669 (10) |
| Ln-O5 | 2.4366 (11) | 2.422 (3) | 2.4068 (12) |
| Ln-O6 | 2.4360 (12) | 2.425 (3) | 2.4086 (13) |
| Ln-Cl | 2.6458 (6) | 2.6443 (15) | 2.6290 (6) |
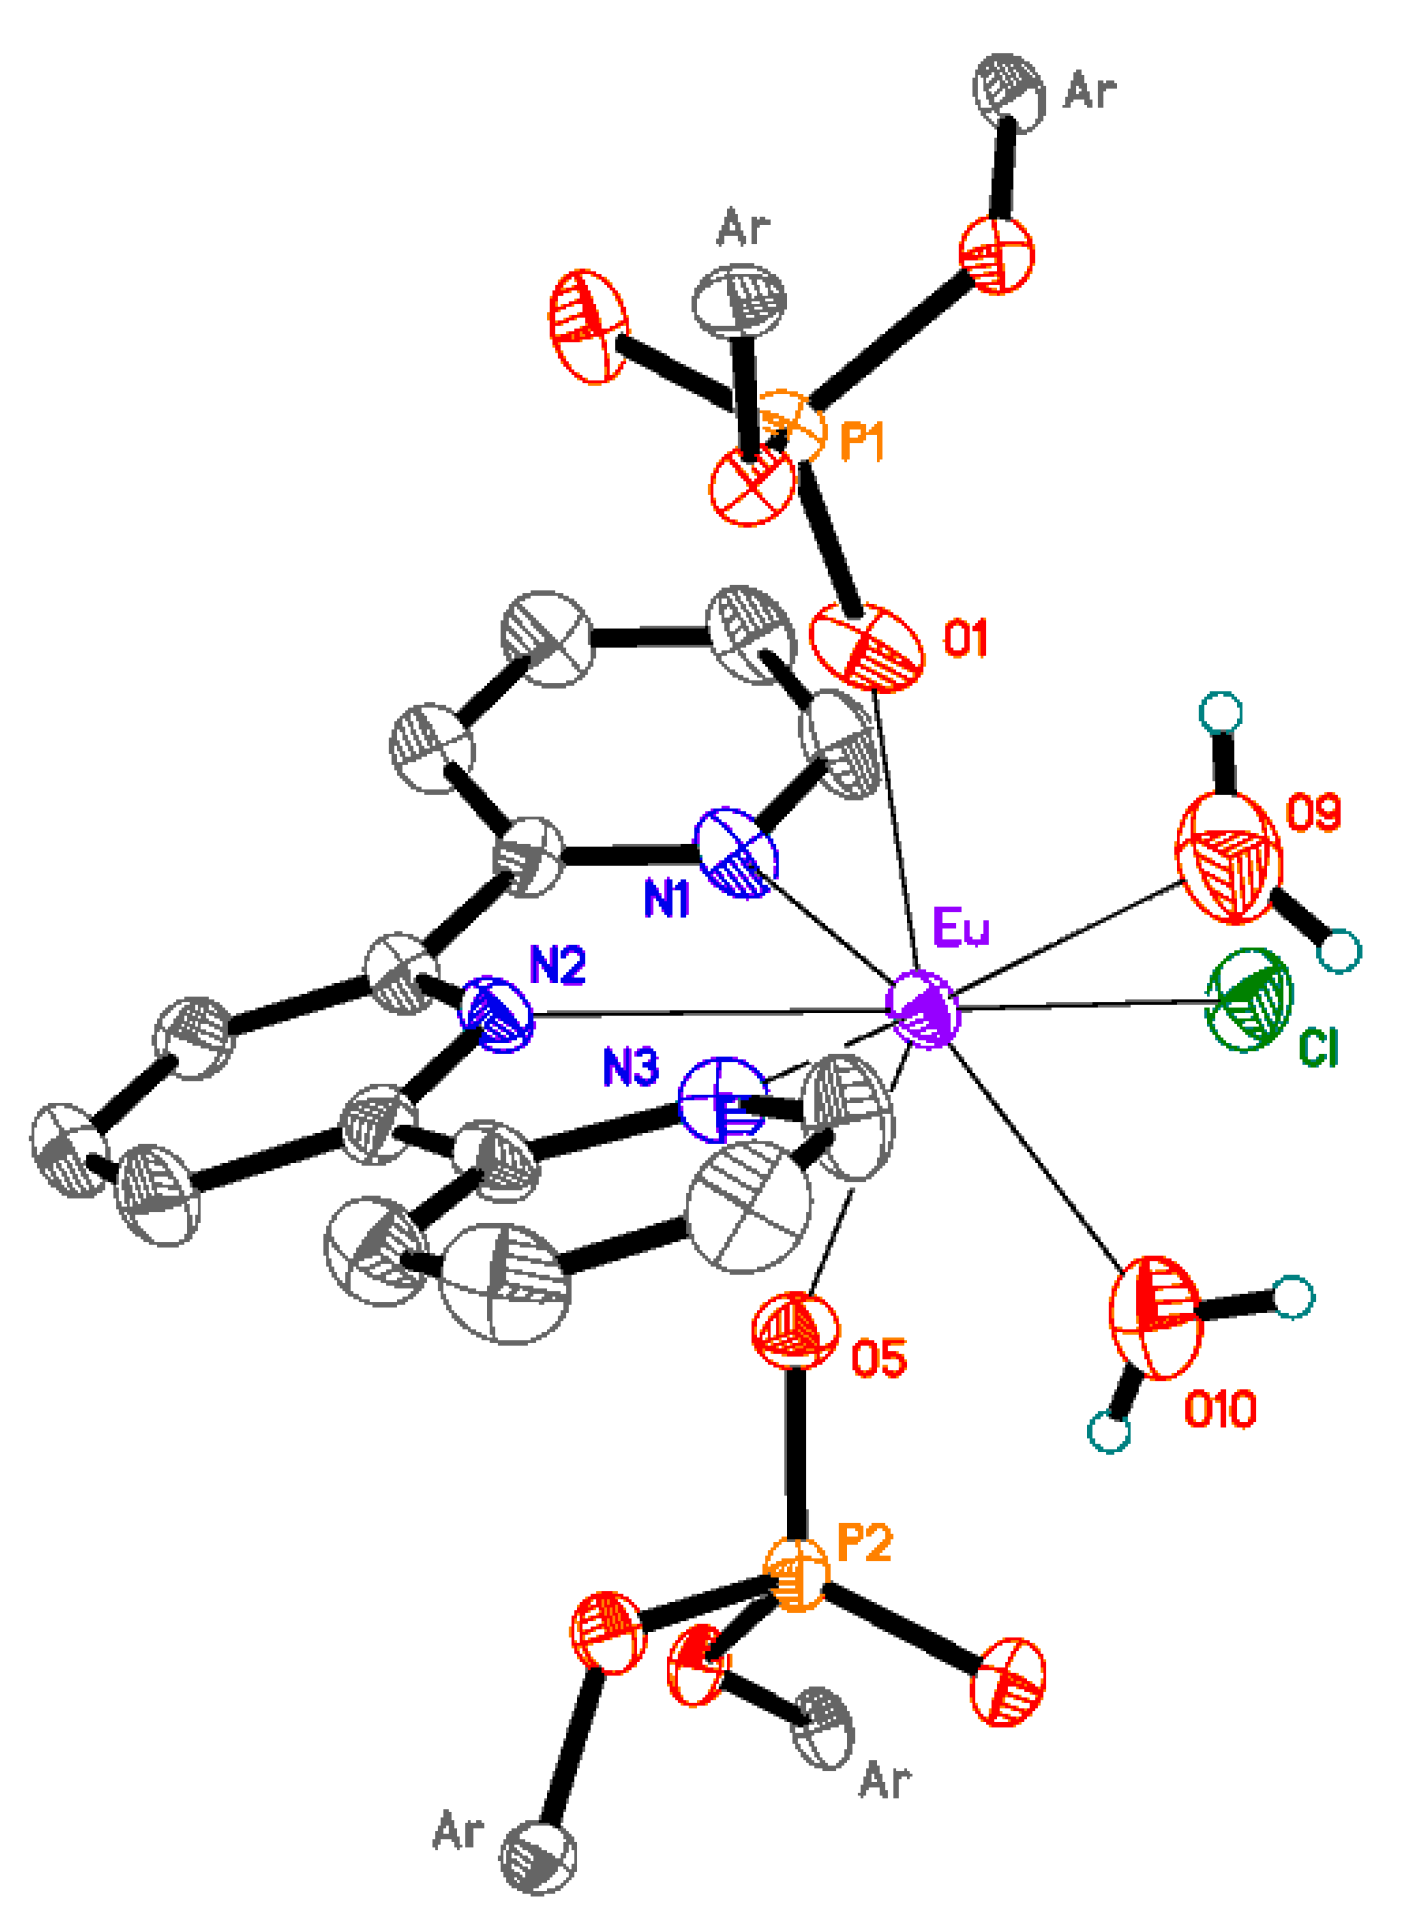
| Bond Length | Bond Length | ||
|---|---|---|---|
| Eu-O1 | 2.252 (5) | Eu-N1 | 2.558 (6) |
| Eu-O5 | 2.291 (5) | Eu-N3 | 2.565 (6) |
| Eu-O9 | 2.496 (6) | Eu-N2 | 2.601 (6) |
| Eu-O10 | 2.515 (6) | Eu-Cl | 2.6850 (19) |
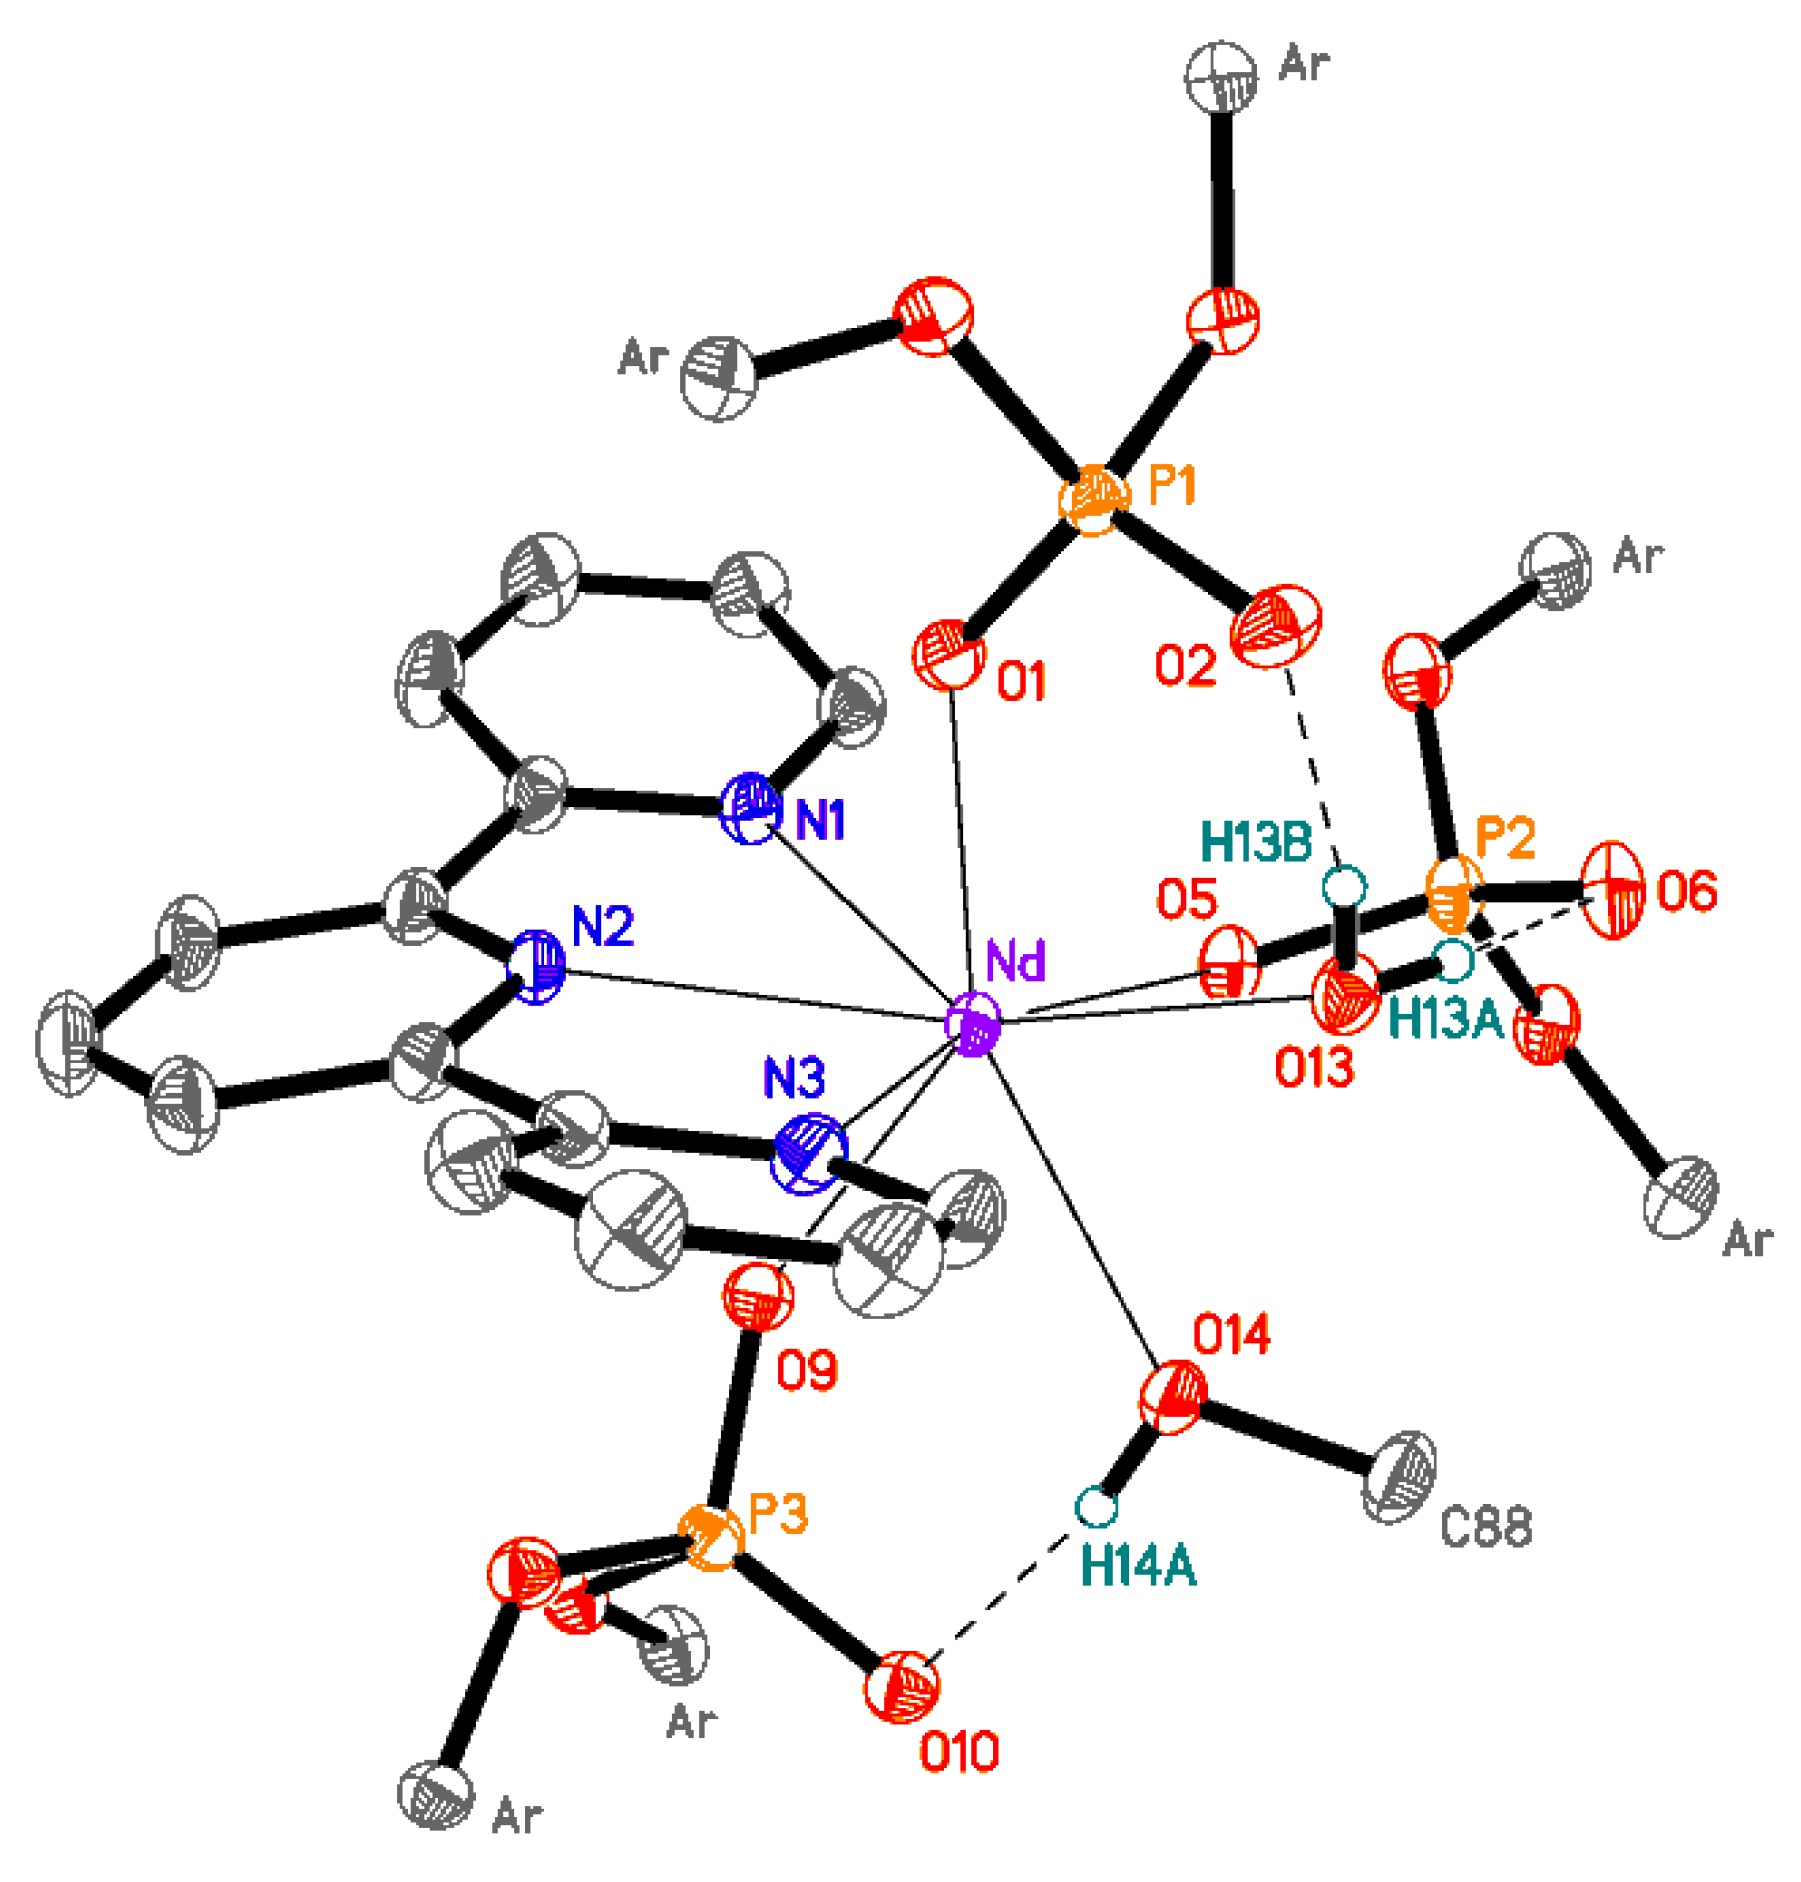
| Bond Length | Bond Length | ||
|---|---|---|---|
| Nd-O1 | 2.3993 (16) | Nd-O14 | 2.5208 (16) |
| Nd-O5 | 2.3512 (16) | Nd-N1 | 2.6339 (19) |
| Nd-O9 | 2.3638 (16) | Nd-N2 | 2.6477 (19) |
| Nd-O13 | 2.5124 (17) | Nd-N3 | 2.599 (2) |
| Complex | 5D0-7F0 | 5D0-7F2 | 5D0-7F4 | Total |
|---|---|---|---|---|
| 2 | 0.05 | 6.55 | 1.87 | 9.89 |
| 5 | 0.03 | 3.26 | 1.03 | 5.51 |
| 9 | 0.01 | 6.64 | 0.97 | 8.87 |
| τobs, ms | S1, nm/cm−1 | T, nm/cm−1 | E1, cm−1 | E2, cm−1 | |||
|---|---|---|---|---|---|---|---|
| 2 | 0.28 ± 0.01 | 275/36,350 | 395/25,300 | 11050 | 8100 | 0.13 | 0.01 |
| 5 | 0.61 ± 0.02 | 355/28,170 | 440/22,730 | 5440 | 5530 | 0.17 | 0.11 |
| 9 | 1.77 ± 0.02 | 350/28,570 | 450/22,200 | 6370 | 5000 | 0.92 | 0.39 |
© 2020 by the authors. Licensee MDPI, Basel, Switzerland. This article is an open access article distributed under the terms and conditions of the Creative Commons Attribution (CC BY) license (http://creativecommons.org/licenses/by/4.0/).
Share and Cite
Kalugin, A.E.; Minyaev, M.E.; Puntus, L.N.; Taydakov, I.V.; Varaksina, E.A.; Lyssenko, K.A.; Nifant'ev, I.E.; Roitershtein, D.M. Diarylphosphate as a New Route for Design of Highly Luminescent Ln Complexes. Molecules 2020, 25, 3934. https://doi.org/10.3390/molecules25173934
Kalugin AE, Minyaev ME, Puntus LN, Taydakov IV, Varaksina EA, Lyssenko KA, Nifant'ev IE, Roitershtein DM. Diarylphosphate as a New Route for Design of Highly Luminescent Ln Complexes. Molecules. 2020; 25(17):3934. https://doi.org/10.3390/molecules25173934
Chicago/Turabian StyleKalugin, Alexey E., Mikhail E. Minyaev, Lada N. Puntus, Ilya V. Taydakov, Evgenia A. Varaksina, Konstantin A. Lyssenko, Ilya E. Nifant'ev, and Dmitrii M. Roitershtein. 2020. "Diarylphosphate as a New Route for Design of Highly Luminescent Ln Complexes" Molecules 25, no. 17: 3934. https://doi.org/10.3390/molecules25173934
APA StyleKalugin, A. E., Minyaev, M. E., Puntus, L. N., Taydakov, I. V., Varaksina, E. A., Lyssenko, K. A., Nifant'ev, I. E., & Roitershtein, D. M. (2020). Diarylphosphate as a New Route for Design of Highly Luminescent Ln Complexes. Molecules, 25(17), 3934. https://doi.org/10.3390/molecules25173934