Article

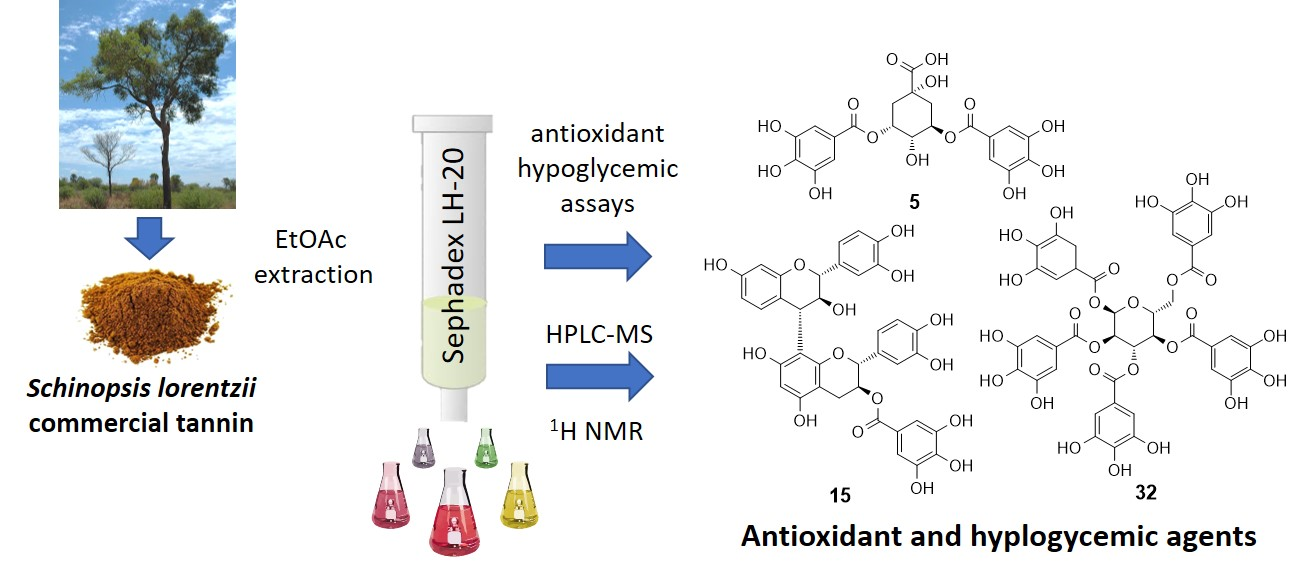
Mass Spectrometry and 1H-NMR Study of Schinopsis lorentzii (Quebracho) Tannins as a Source of Hypoglycemic and Antioxidant Principles

Department of Chemical Sciences, University of Catania, Viale A. Doria 6, 95125 Catania, Italy
*
Author to whom correspondence should be addressed.
Molecules 2020, 25(14), 3257; https://doi.org/10.3390/molecules25143257
Submission received: 15 June 2020 / Revised: 10 July 2020 / Accepted: 16 July 2020 / Published: 17 July 2020

Abstract

:
The ethyl acetate extract of the commercial tannin Tan’Activ QS-SOL (from Schinopsis lorentzii wood), employed for the production of red wine, was subjected to chromatography on Sephadex LH-20, providing nine fractions (A-1–A-9), which were estimated for total phenols content (GAE), antioxidant activity (DPPH, ORAC), and hypoglycemic activity (α-glucosidase and α-amylase inhibition). All the fractions were analyzed by means of HPLC/ESI-MS/MS and 1H-NMR to identify the principal active constituents. Fractions A-1 and A-3 showed the highest antioxidant activity and gallic acid (1), pyrogallol (3), eriodictyol (6), catechin (12), and taxifolin (30) were identified as the major constituents. The highest α-glucosidase and α-amylase inhibitory activity was observed in fractions A-7–A-9 containing condensed (9′, 15, 18, 19, 23, and 27) hydrolysable tannins (13 and 32) as well as esters of quinic acid with different units of gallic acid (5, 11, 11′, 14, and 22). This last class of gallic acid esters are here reported for the first time as α-glucosidase and α-amylase inhibitors.

Graphical Abstract

1. Introduction

Diabetes mellitus (DM) is a chronic metabolic disorder with an increasing global prevalence and incidence at an alarming rate. It is characterized by insulin hormone dysfunction and a resulting high blood glucose level (hyperglycemia). There are several different types of diabetes, the most common form in the general population being type 2 diabetes (non-insulin-dependent), mostly affecting adults and accounting for about 90% of all cases of diabetes. Obesity, aging, and familial history of diabetes have been identified as significant risk factors. Metabolic complications such as cardiovascular disease, angiopathy, neuropathy, nephropathy and others are frequently associated with Type 2 diabetes or can cause it to worsen [1]. Moreover, hyperglycemia increases reactive oxygen species’ production, causing oxidative tissue damage [2].
Several oral antidiabetic drugs such as biguanides, meglitinide, sulfonylureas, thiazolidinedione, as well as inhibitors of dipeptidyl peptidase 4, sodium-glucose cotransporter, and carbohydrate hydrolyzing enzymes have been employed to manage postprandial hyperglycemia [3]. Among all the commercial antidiabetic drugs, α-glucosidase (α-GLU) and α-amylase (α-AMY) inhibitors are the most effective in reducing postprandial hyperglycemia [4]. The commercial inhibitors—acarbose, voglibose, and miglitol—are pseudo-carbohydrates that competitively inhibit these metabolic enzymes, also causing delayed digestion; thus, the absorption of carbohydrates is reduced and this prevents postprandial hyperglycemia [4]. These inhibitors taken before meals rich in complex carbohydrates, reduce the glycated hemoglobin (HbA1c) levels but have a relatively high rate of discontinuation, owing to the occurrence of numerous gastrointestinal side effects [5].
For these reasons, several researchers are dedicated to the discovery of new α-glucosidase and/or α-amylase inhibitors with fewer or absent undesired effects. Nowadays, there is a renewed interest in plant-based medicines and functional foods for the prevention and cure of diabetes and obesity, given their slight or absent side effects [6]. The plant kingdom is a promising source of bioactive products with hypoglycemic activity [7,8]. Among natural products, some polyphenols occurring in edible plants showed interesting α-glucosidase and/or α-amylase inhibitory activity [8]. Moreover, the well-known antioxidant properties of polyphenols represent a further advantage in the search for potential dual-action antidiabetic agents, able to join hypoglycemic properties and reduction in oxidative damage associated with diabetes complications [2]. Consequently, several analogues of natural polyphenols have been evaluated as hypoglycemic agents, namely stilbenoid glycosides [9], bisphenol neolignans [10], rosmarinic acid amides [11], 3,4-dihydroxypyrrolidine-based compounds [12], and biscoumarins [13].
Among plant polyphenols, tannins raise considerable interest for several biological properties, including antidiabetic activity [14]. According to their chemical structures, tannins can be divided into (1) condensed tannins (proanthocyanidins, PACs), (2) hydrolyzable tannins (mainly ellagitannins and gallotannins), and (3) phlorotannins [15]. We have recently evaluated a selection of hydrolyzable tannins, such as C-glucosidic ellagitannins and galloylated glucoses, as α-GLU and α-AMY inhibitors [16]. Moreover, we have studied oenological commercial hydrolyzable tannins provided by Silvateam Spa (http://en.silvateam.com) and thanks to an extraction/fractionation procedure suitable for industrial applications, we succeeded in obtaining polyphenol-enriched fractions with higher antioxidant and hypoglycemic activity than those of the corresponding extracts [17,18].
In light of the obtained promising results, we extended the search of potential α-glucosidase and/or α-amylase inhibitors to the investigation of a commercial tannins extract from Schinopsis lorentzii (Griseb.) Engler (Schinopsis quebracho-colorado Schltdl.), a tree growing in Argentina, Paraguay, Brazil, and Bolivia. Dried quebracho extract contains about 95% proanthocyanidins, and the remaining 5% is mainly constituted of water-soluble sugars. Quebracho tannin extract is authorized by the European Union (EU Community Register of Feeds Additives) as an additive for feedstuffs [19]. Moreover, quebracho tannin extracts are used to produce all types of leather and especially, natural vegetable-processed leather.
Thus, in this work we present the results of an assay-guided fractionation of Tan’Activ QS-SOL, a commercial tannin extract from Schinopsis lorentzii wood, aimed to obtain polyphenol-enriched fractions with antioxidant and/or hypoglycemic activity, the latter obtained through inhibition of α-GLU and/or α-AMY. The main constituents of the fractions were identified by the combined use of HPLC/ESI-MS/MS and 1H-NMR.

2. Results and Discussion

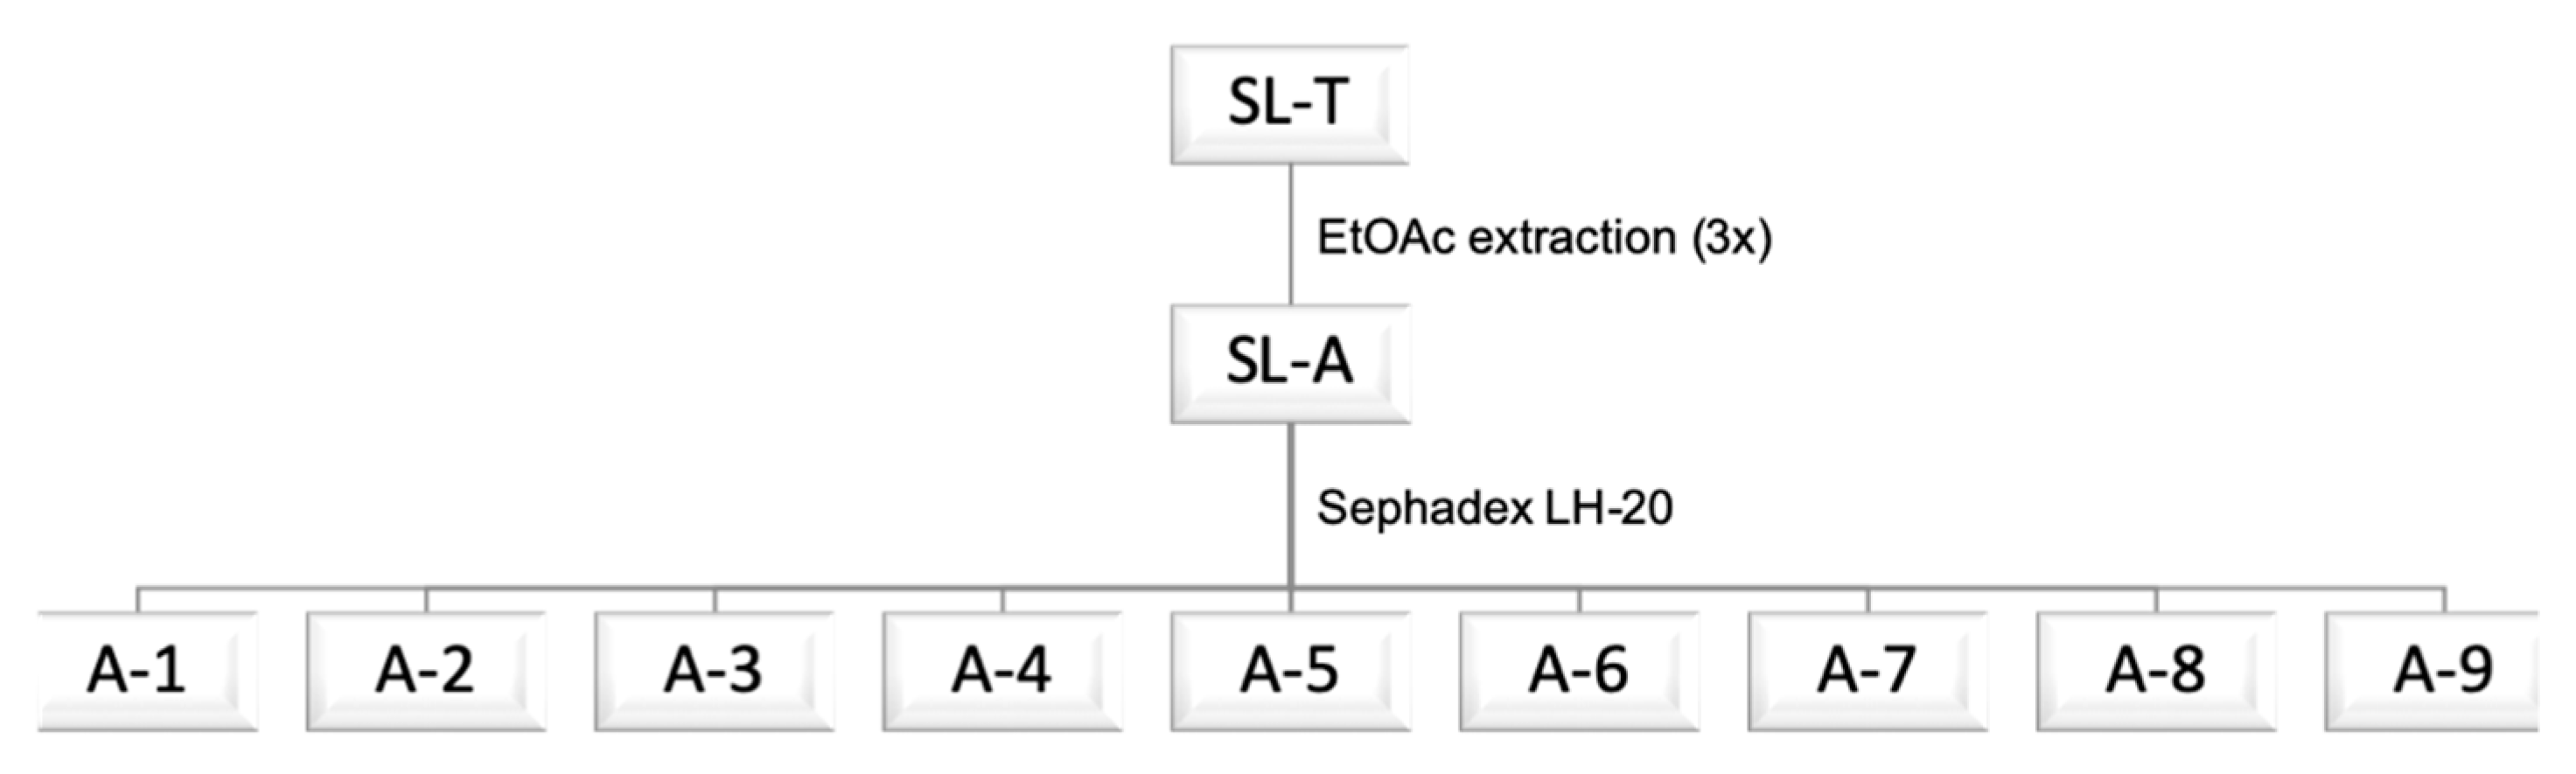
2.1. Extraction and Fractionation of Tan’Activ QS-SOL

As a continuation of our previous studies on tannins as potential functional food ingredients with antidiabetic and antioxidant properties [17,18], we report here a study on Schinopsis lorentzii (Quebracho) tannins as a source of hypoglycemic and antioxidant principles; in this work, we assessed the hypoglycemic activity of the extract and fractions by also evaluating the α-amylase inhibitory activity. A sample of Tan’Activ QS-SOL (Schinopsis lorentzii wood, SL-T) was extracted with ethyl acetate (EtOAc). The crude extract (SL-A) was subjected to chromatographic separation on a Sephadex-LH20 column and the eluate was pooled in nine subfractions, A-1–A-9, following a preliminary analysis performed via TLC (Figure 1, See Section 3.5 for details). A first elution was carried out with water to remove the possible presence of salts and low molecular weight sugars, or other more hydrophilic compounds contained in the SL-A extract. Subsequently, the elution was carried out with a gradient of MeOH in water and finally, with acetone in the attempt to separate the hydrolyzable tannins from condensed tannins, exploiting their different affinity with the stationary phase [20,21].
In Table 1, we report the percentage yield of SL-A (referred to SL-T powder) and of each fraction (with respect to the total eluate recovered from the Sephadex LH-20 column).

2.2. Antioxidant Activity and α-Glucosidase and α-Amylase Inhibition for SL-T, SL-A and A-1–A-9 Fractions

Aliquots of the commercial tannin sample (SL-T), the crude extract SL-A, and the fractions A-1–A-9 were evaluated for their antioxidant and hypoglycemic activity. Table 1 reports a) the total phenols content (measured as gallic acid equivalents (GAE), as mg/g); b) the antioxidant activities measured as scavenging of the DPPH• radical (expressed as SC50 in μg/mL) and Oxygen Radical Absorbance Capacity (ORAC, expressed as μmol TE/g); c) the hypoglycemic activity evaluated as α-GLU and α-AMY inhibition (expressed as IC50 in μg/mL). In this study, quercetin (Que) was employed as a positive control for antioxidant activity and α-GLU and α-AMY inhibition. The antidiabetic drug acarbose (Aca) was employed as the standard for α-GLU and α-AMY inhibition.
The SL-A extract shows an antioxidant activity (DPPH SC50 value of 5.5 μg/mL; ORAC = 1410.7 µmol TE/g) and phenols content (GAE = 316.3 mg/g) higher than those of the commercial sample SL-T (DPPH SC50 = 7.4 μg/mL, ORAC = 1075.4 µmol TE/g), indicating that EtOAc selectively extracts the antioxidant polyphenols present in SL-T. Moreover, SL-A proved to be an effective inhibitor of both α-GLU and α-AMY (IC50 = 6.3 μg/mL and 86.1 μg/mL, respectively), showing higher activity than the commercial sample SL-T (IC50 = 48.9 μg/mL and 129.3 μg/mL, respectively). Furthermore, the α-GLU inhibitory activity of SL-A is comparable to that of QUE (IC50 = 5.5 μg/mL) and by far superior to that of the antidiabetic drug acarbose (IC50 = 97.2 μg/mL). Thus, the EtOAc extraction allowed us to concentrate, in SL-A, the constituents of SL-T responsible for both antioxidant and hypoglycemic activity.
The fractions A-1–A-9 have DPPH SC50 values between 4.0 and 8.1 µg/mL, not far from that of QUE. Only two fractions, namely A-1 (DPPH SC50 = 4.0 µg/mL, ORAC = 3345.4 µmol TE/g) and A-3 (DPPH SC50 = 4.9 µg/mL, ORAC = 1895.1 µmol TE/g), show antioxidant activity higher than that of SL-A. Consistently with these data, the polyphenol content of fractions A-1 and A-3 is significantly higher than that of SL-A (A-1 GAE = 867.5 mg/g; A-3 GAE = 756.4 mg/g) resulting in the enrichment in phenols, respectively, of 174% (A-1) and 139% (A-3), with respect to the crude extract. It is also worth mentioning that these two fractions account for only 10.3% of the crude extract and may result useful as antioxidant additives for agro-food applications. Nevertheless, both fractions showed a poor inhibition against both α-GLU and α-AMY, and consequently, these are not the best candidates as potential dual-action antidiabetic agents.
Fraction A-2 shows antioxidant activity and α-GLU inhibition lower than those corresponding to the extract SL-A. Conversely, this fraction resulted in a moderate α-AMY inhibitory activity. Fractions A-4 and A-5, accounting for about 26% of the total eluate, exhibited lower antioxidant (DPPH and ORAC) and inhibitory activities (towards α-GLU and α-AMY) than those observed for SL-A. Fraction A-6 (15% of the total eluate) showed antioxidant activity comparable to that of SL-A and exerted some inhibition of α-GLU (IC50 = 8.9 µg/mL) and α-AMY (IC50 = 72.5 µg/mL), although the inhibitory activities were lower than those of SL-A.
The most promising results were observed for fractions A-7–A-9. These fractions showed fairly good antioxidant activity, a potent inhibitory activity towards α-GLU (IC50 in the range 2.1–3.6 µg/mL), and a moderate α-AMY inhibitory activity (IC50 in the range 64.2–93.6 µg/mL). In particular, fraction A-8, constituting only 5.6% of the total eluate of the column and 1.9% of the commercial tannin SL-T, exhibited the most potent inhibitory activity against α-GLU (IC50 = 2.1 µg/mL), much greater than that of the crude tannin SL-T (IC50 = 48.9 µg/mL), three times more active than that of SL-A (IC50 = 6.3 µg/mL), as well as 50 times higher than that of acarbose (IC50 = 64.2 µg/mL). The moderate inhibition of α-AMY observed for fractions A-8–A-9 may result in an advantage, because in the development of antidiabetic drugs, a higher incidence of undesirable effects has been associated with strong α-amylase inhibition [22]. Consequently, for therapeutic purposes, a potent α-GLU inhibitor with moderate inhibitory activity against α-AMY is usually preferred. In light of these results, fractions A-7 and A-8 might be employed as dual-action antidiabetic agents without further purification of their constituents.

2.3. Correlation Analysis

Pearson’s correlation analysis was carried out to evaluate direct correlation analysis among GAE and antioxidant activity (DPPH and ORAC) of SL-T, SL-A, and A-1–A-9 fractions. For DPPH, lower IC50 values mean higher activities. In this case, all IC50 values were converted into 1/IC50 values.
DPPH and ORAC scavenging activity were highly correlated with GAE (GAE vs. DPPH: R = 0.0886; GAE vs. ORAC: R = 0.857; DPPH vs. ORAC: R = 0.881; p < 0.001).

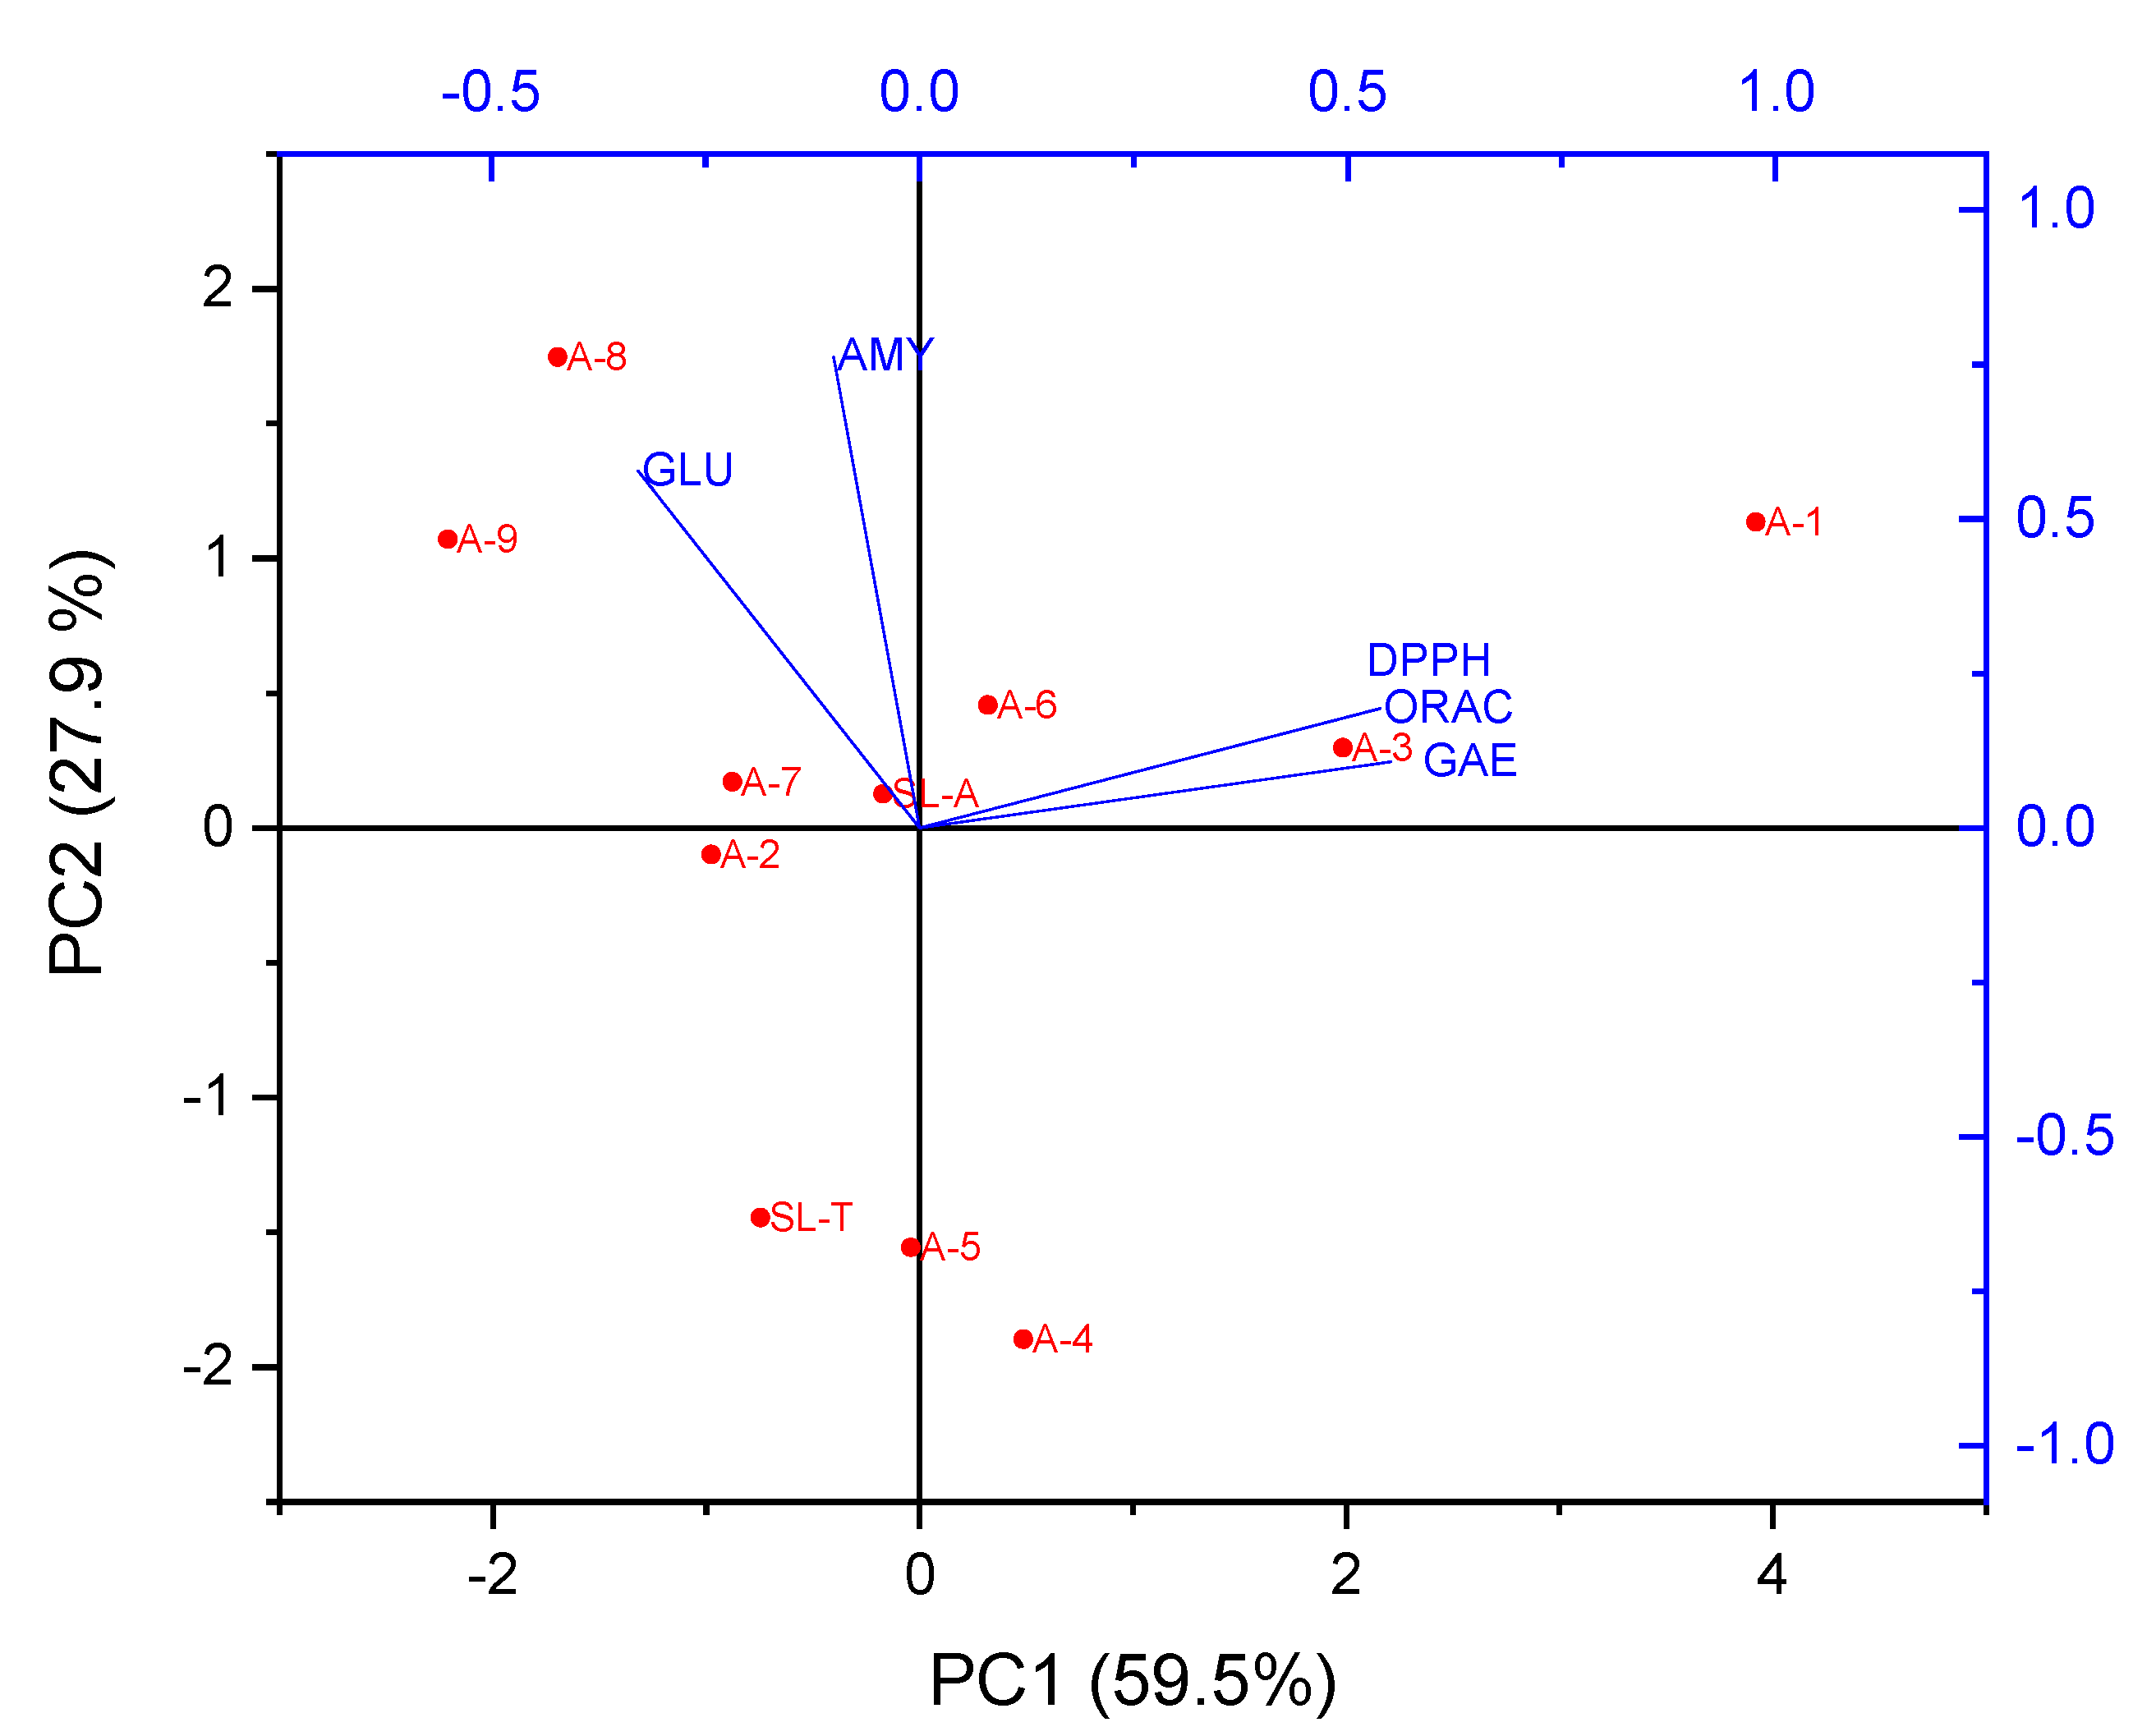
2.4. Principal Component Analysis (PCA)

Principal Component Analysis was conducted to get a general overview of the data distribution; thus, principal components (PCs) were generated. PCA based on the corresponding dataset of SL-T, SL-A, and fractions A-1–A-9, including GAE, antioxidant (DPPH and ORAC), and α-GLU and α-AMY inhibitory values, was carried out (Figure 2).
The first principal component (PC1) has the highest eigenvalue of 2.97 and accounted for 59.46% of the variability in the dataset. The second, third, and fourth PCs (PC2, PC3, and PC4) had eigenvalues of 1.39, 0.40, and 0.14 and explained 27.90%, 8.00%, and 2.79% of the variance in the data, respectively. Subsequently, by plotting the scores of the samples in the subspaces PC1 vs. PC2 (87.36% of the total variance of the data), a clear grouping of samples was observable. PCA confirms the previous observations, allowing the discrimination of different fractions around the PC1 and PC2 axes’ components and activities (Figure 2). These axes’ components correlate fractions A-1 and A-3 with antioxidant activity (DPPH and ORAC) and total phenolic content (GAE); fractions A-7–A-9 were correlated with α-GLU and α-AMY inhibitory activities. Extracted eigenvectors are reported in Table 2. The bigger the eigenvectors, the higher the correlations between variables and PCs. DPPH, ORAC, and GAE were positively associated with PC1, while α-GLU and α-AMY were positively associated with PC2.

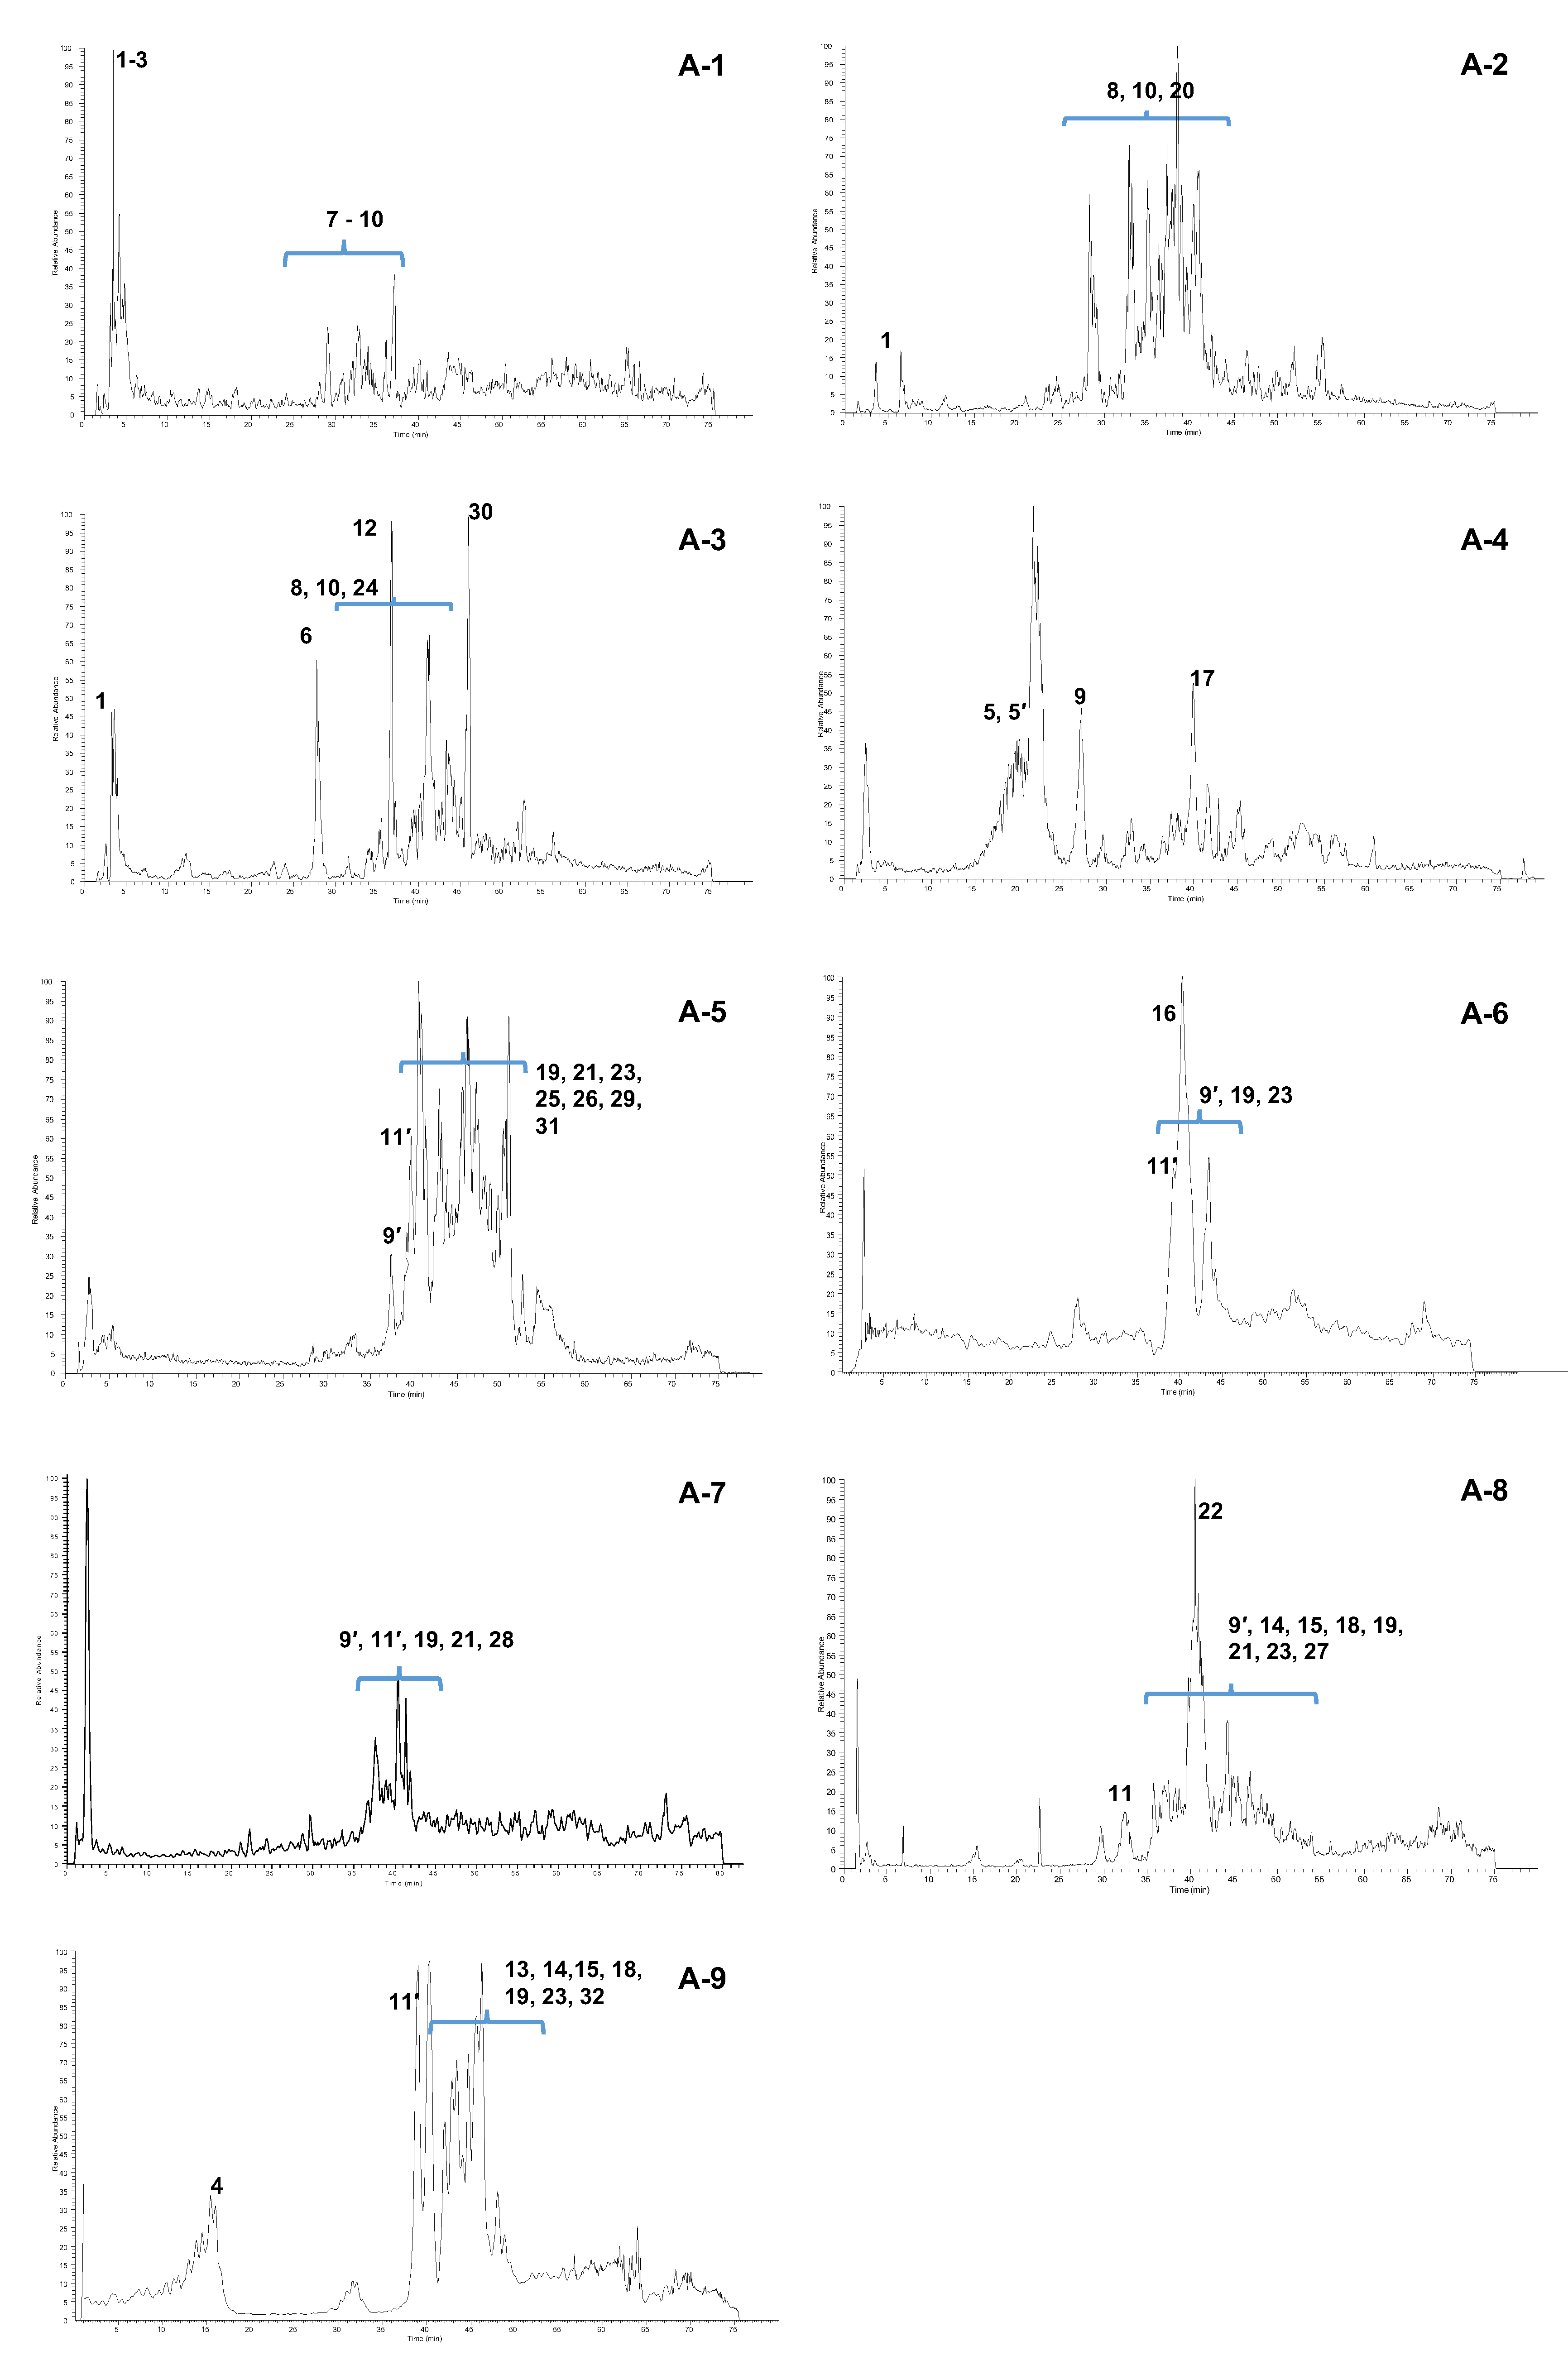
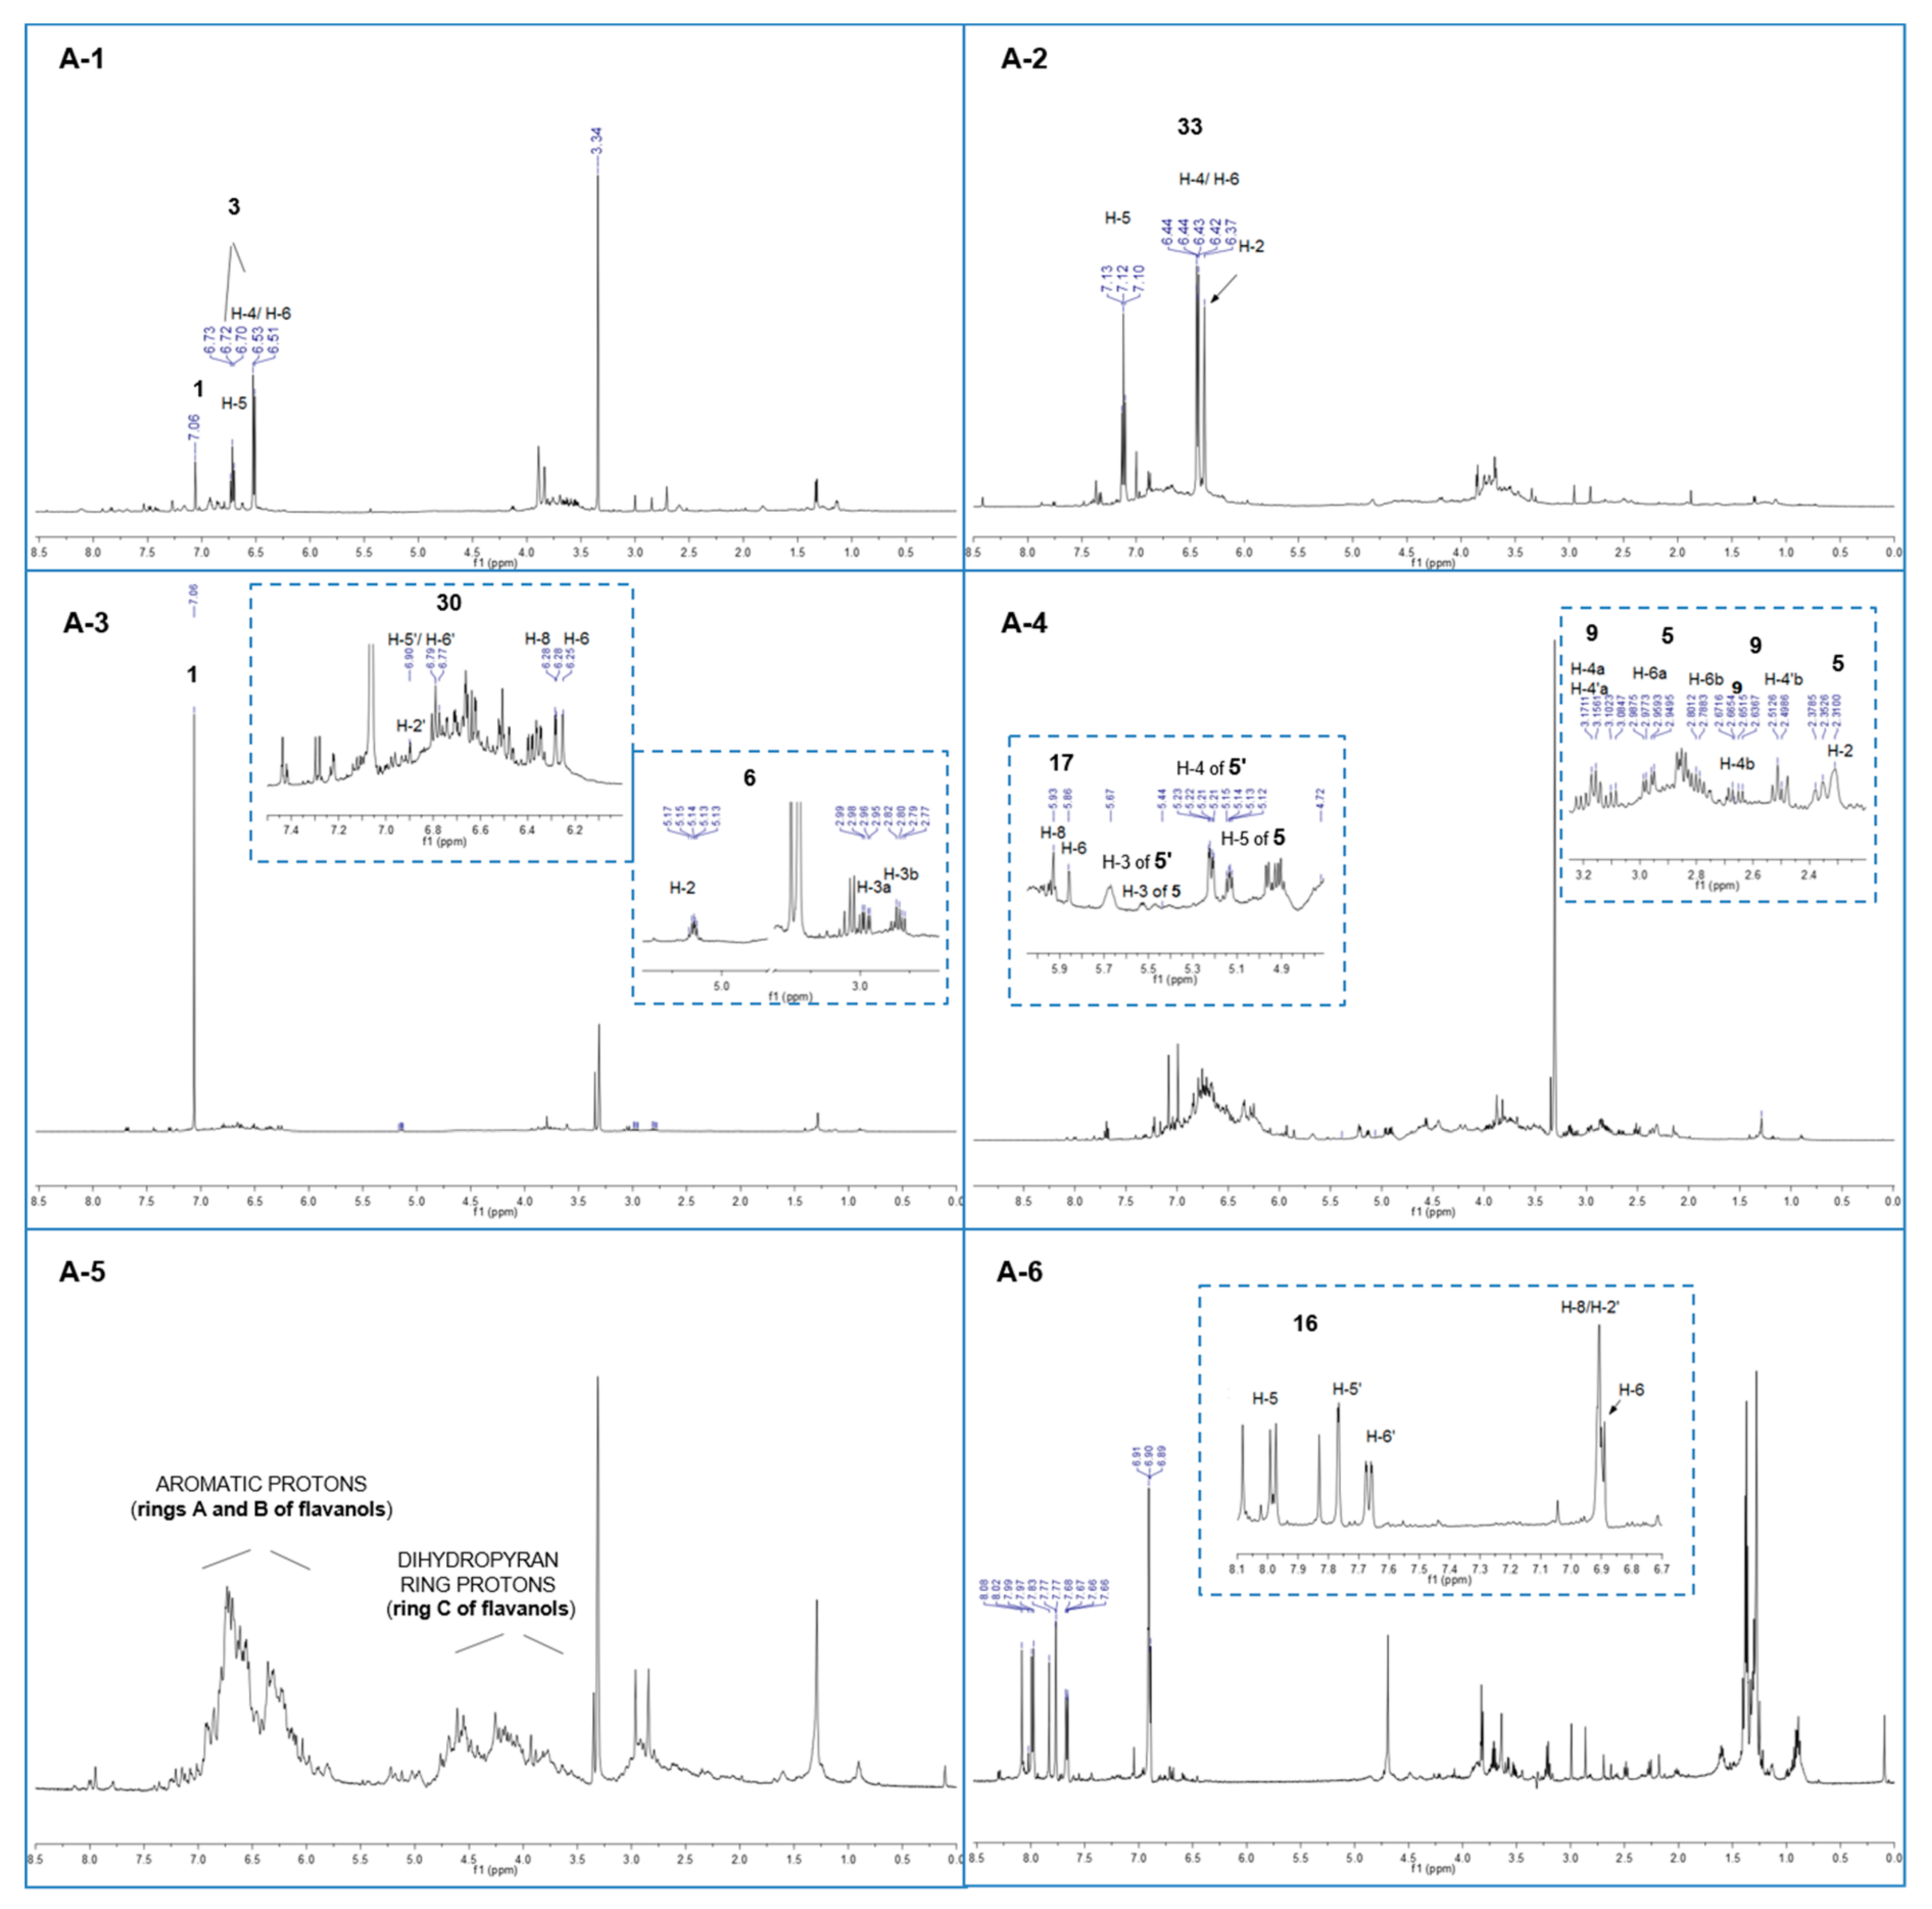
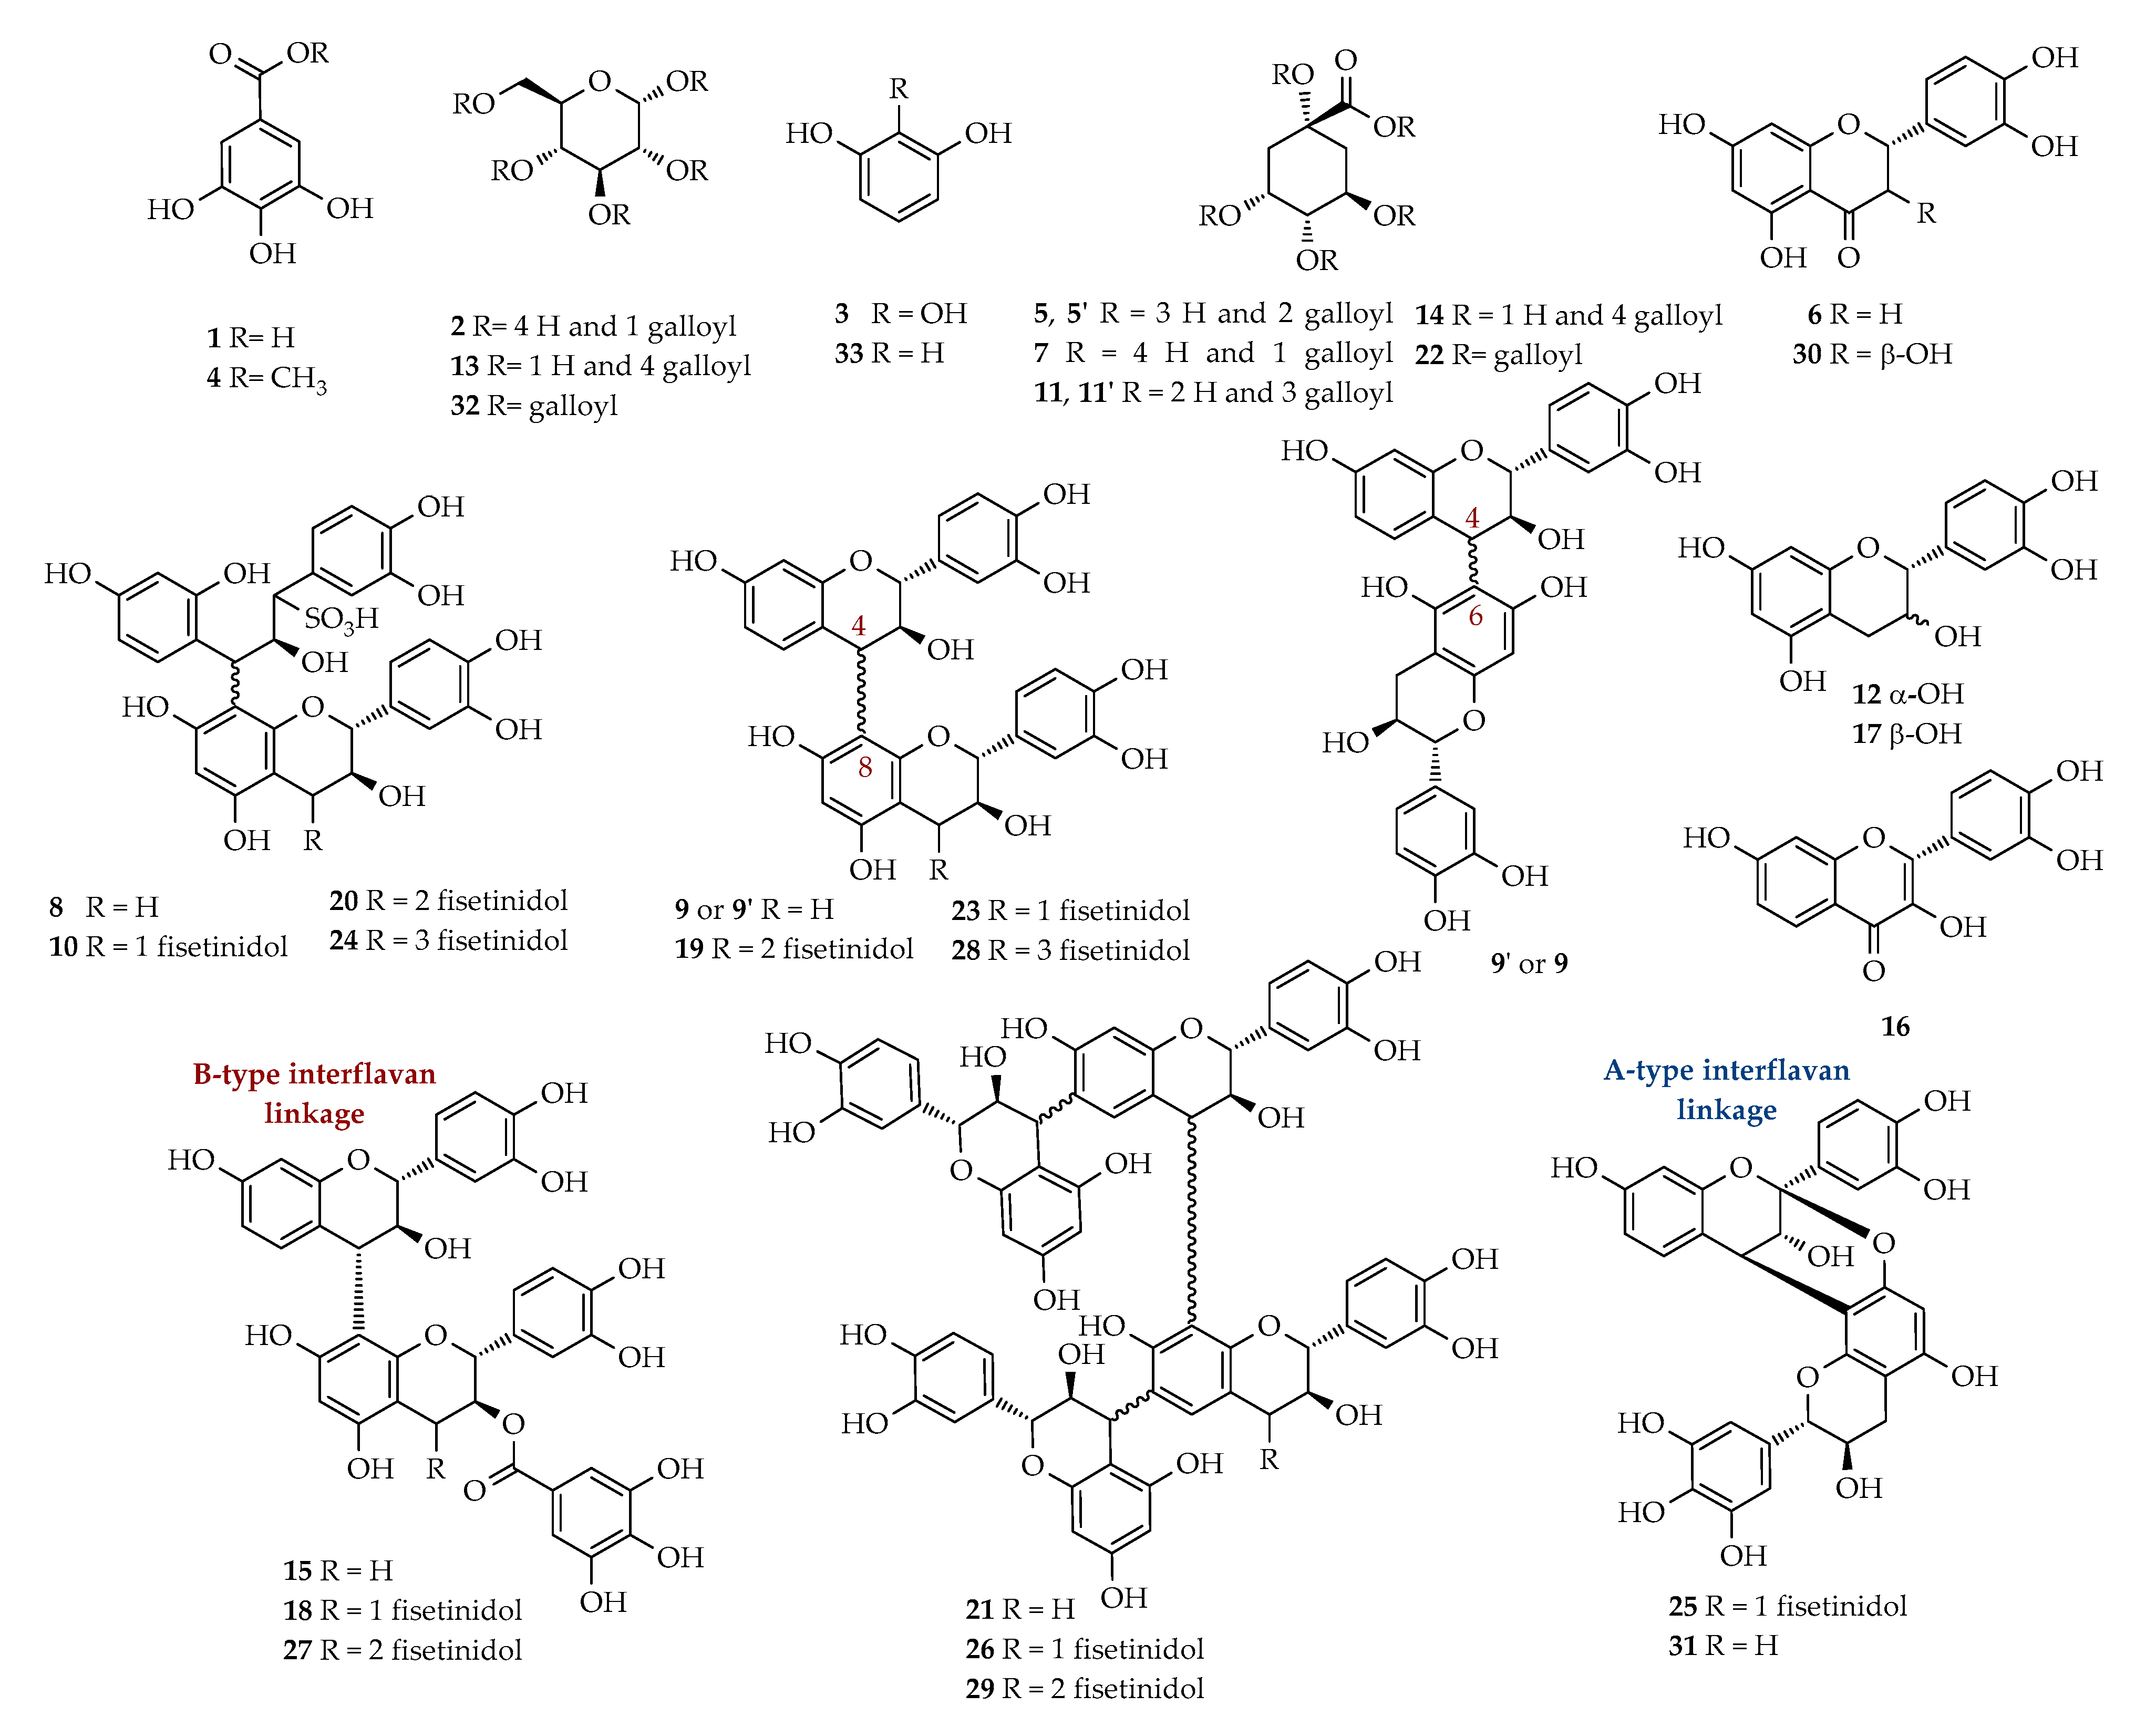
2.5. Mass Spectrometric and 1H-NMR Analysis of A-1–A-9 Fractions

HPLC/ESI-MS/MS analysis was performed on the fractions A-1–A-9 to obtain useful data for the identification of the main constituents of each fraction. Figure 3 reports the total ion current (TIC) chromatograms of these fractions. A first tentative identification of the main constituents was based on the comparison of the parent ions and fragmentation spectra with literature data [23,24]; when possible, these assumptions were corroborated by 1H-NMR spectra (Figure 4). The constituents are numbered according to their chromatographic elution times, as listed in Table 3. For each compound, the [M − H] m/z value, the main MS/MS fragments, and where available, the 1H-NMR assignments were reported. The structures of all the identified compounds are reported in Figure 5.
The TIC chromatogram of fraction A-1 shows the presence of an intense and polar peak eluting between 3 and 5 min and a group of low intensity peaks between 27 and 40 min. At tR = 3.1 min, a compound was detected with [M − H] at m/z 169, whose tandem mass spectrum showed a fragment at m/z 125 originating from the loss of CO2 (M-44). This was identified with gallic acid (1) and its identification was corroborated by the analysis of 1H-NMR spectrum of the A-1 fraction (Figure 4), showing an intense singlet at 7.06 ppm easily attributable to the aromatic protons of 1. Gallic acid, a typical constituent of gallotannins, is reported as an effective antioxidant but a weak inhibitor of α-glucosidase and this finding is in agreement with the results reported in Table 3 [25]. The identification of gallic acid was supported by the HPLC-UV profile of the fraction A-1 compared to a standard solution (Figure S1 of Supplementary Material). The peak at TR = 3.2 min gave a [M − H] at m/z 331 and it was identified as monogalloyl glucose isomer (2), according to its MS/MS spectrum, showing signals at m/z 271 (M-H-60) and m/z 241 (M-H-90), both arising from the fragmentation of the glucosidic ring [26] and the fragment at m/z 169 (M-H-162) ascribable to the loss of a glucose unit (Figure S2 of Supplementary Material).
The positional isomers of compound 2 cannot be discriminated by MS data; therefore, this compound and the other molecules with similar indistinguishable structures are indicated in Table 3 as ‘isomer’. The peak at tR = 3.5 min presented a [M − H] at m/z 125 and was attributed to pyrogallol (3), most likely deriving from the thermal decomposition of hydrolysable tannins [27]. This identification was corroborated by the 1H-NMR spectrum, showing two coupled signals—a triplet at 6.72 ppm (J = 8.1 Hz, H-5) and a doublet at 6.52 ppm (J = 8.1 Hz, H-4/H-6)—attributable to the A2X spin system of a 1,2,3-trisubstituted aromatic ring as for 3. The peak at tR = 28.0 min was due to the elution of a compound with [M − H] at m/z 343 corresponding to an isomer of monogalloyl quinic acid (7), whose fragmentation pattern (Figure S3 of Supplementary Material) is constituted by the signals at m/z 325 (M-H-18, H2O) and 191 (M-H-152, loss of galloyl). The peak at tR = 29.3 min gave a [M − H] at m/z 561; this was assigned to a dimer of the class of condensed tannins composed of catechin and fisetinidol (9); fragment ions at m/z 451, 409, 289 and 271 were observed in its MS/MS spectrum (Figure S4 of Supplementary Material). Quebracho proanthocyanidins consist of a homologous series of oligomers based on the flavan-3-ol structure, with catechin as a starter unit angularly bonded to fisetinidol extender units [28]. In these compounds, the above cited fragment ions are normally present and may be justified by three different mechanisms [29]. In the first mechanism, namely Heterocyclic Ring Fission (HRF), the opening of the heterocyclic ring C occurs with a loss of the A-ring and the release of a fragment ion at m/z 451 (M-H-110). The second mechanism, Quinone Methide (QM), occurs through the fission of the interflavanyl bond and leads to the formation of a methide quinone; this fragmentation mechanism produces diagnostic ions at m/z 271 and 289, respectively, due to the two monomers fisetinidol and catechin. The last fragment ion at m/z 409 (M-H-152) and the derived one at m/z 391 (M-H-152-18), generated by a consequent loss of water, are originated from the fission of the bonds of the B-ring from the base unit, with the release of a 152 Da unit through a retro-Diels–Alder (rDA). Although the analysis of the fragment ions allows the establishing of the building units and the type of interflavan linkage between these units, it is not possible to discriminate between C-4–C-8 and C-4–C-6 connections, thus, in the case of the catechin-fisetinidol dimer, both structures are reported (9 and 9′).
A poor chromatographic separation on a silica-bonded stationary phase is a common feature of proanthocyanidins, due to the similarity in their structures and to the large number of phenolic groups giving similar interactions with the stationary phase [30,31]. Thus, it is not surprising that largely overlapped peaks are observed between 28 and 36 min. The corresponding polyphenols generated [M − H] signals at m/z 643 and 915, which were tentatively assigned to two sulfited oligomers, namely a dimer (8) and a trimer (10). The presence of sulfited oligomers in commercial tannins is due to industrial treatment, with sodium hydrogen sulfite applied to reduce viscosity and increase tannins solubility in water; the sulfites are formed via cleavage of the pyran ring and the introduction of a C-2 sulfonic acid moiety [31]. The fragmentation patterns (Figure S5 of Supplementary Material) of 8 and 10 encompass signals at M-H-82 (m/z 561 and 833, respectively), corresponding to the loss of HSO3- occurring at C-2 position; signals at m/z 409 and 681 originated from rDA fragmentation of the m/z 561 and 833, respectively; signals at M-H-354 (m/z 289 and 561, respectively), corresponding to the loss of a unit of monosulfited fisetinidol. As proof of the obtained data, it has been ascertained that the company that supplied the commercial sample of Schinopsis lorentzii tannins has applied these treatments.
The MS data interpretation of fraction A-2 highlighted the presence of 1, whose identification was also supported by the HPLC-UV profile (Figure S1 of Supplementary Material). The chromatogram shows between 28 and 44 min a complex multitude of peaks, among which it was possible to identify, in addition to 8 and 10, a sulfited tetramer at m/z = 1187 (20), with a fragmentation pattern similar to that of the above cited sulfited oligomers. The 1H-NMR spectrum of fraction A-2 (Figure 4) shows the presence of three intense signals in the aromatic region at 7.12 (t, J = 8.2 Hz, H-5), 6.43 (dd, J = 8.2 and 2.1 Hz, H-4/H-6), and 6.37 ppm (bt, J = 2.1 Hz, H-2), which were assigned to the aromatic protons of resorcinol (33). These data are in agreement with those reported in the literature [32]. The presence of this phenolic compound is attributable to the degradation processes caused by sulfitation [33]. The phenol 33 was not detected in the HPLC-MS analysis, since its molecular weight (110 Da) is lower than the analyzed mass range.
Fraction A-3 shows a TIC profile with some intense peaks. In addition to gallic acid (1), whose identification was also supported by the HPLC-UV profile (Figure S1, Supplementary Material), the flavanone eriodictyol (6) (tR = 27.7 min, [M − H] at m/z 287) was tentatively identified on the basis of two fragment ions at m/z 269 and 163, ascribable to the loss of water and ring B, respectively. The presence of catechin (12) was indicated by the [M − H] at m/z 289 (eluted at tR = 37.3 min) and the fragment ions a m/z 271 (M-H-18, water loss), 245 (M-H-44, CH2=CH-OH loss), 179 (M-H-110, loss of dihydroxybenzene structure), 109 (M-H-179), and 167 (M-H-122), the latter originating from C ring-opening, removal of the B ring in the form of quinone methide (122 Da), and formation of a benzofuranic ring through a benzofuran-forming fission mechanism (BFF) [30]. Furthermore, the fragment at m/z 137 resulted from a retro-Diels-Alder (rDA) cleavage of ring C, confirmed by the presence of m/z 151 [34]. Between 36 and 45 min, it was possible to identify the presence of the above cited sulfited tannins 8, 10, together with a sulfited pentamer 24 at m/z 1459. A further peak eluting at tR = 46.2 min, with [M − H] at m/z 303, showed an MS/MS spectrum with signals at m/z 285 (M-H-18), 259 (M-H-44, loss of CO2), and 175 (M-H-128, loss of phloroglucinol with an HRF mechanism). These data indicated the presence in this peak of the flavanonol taxifolin (30) [35]. In the 1H-NMR spectrum of fraction A-3 (Figure 4), the very intense singlet at 7.06 ppm confirmed the presence of gallic acid (1). The region of aromatic protons is rich in numerous overlapped signals, which hampered the identification; however, an accurate analysis confirmed the identification of taxifolin (30) through some key signals attributable to the protons H-2′ (6.90 ppm, d, J = 1.9 Hz), H-5′, and H-6′ (6.79 ppm, m), as well as H-8 (6.28 ppm) and H-6 (6.25 ppm, d, J = 1.9 Hz) [34]. Further 1H-NMR signals were observed in the region between 5.5 and 2.0 ppm and were attributed to diagnostic signals of eriodictyol (6), namely those of protons H-2 (5.14 ppm, dd, J = 6.7 and 5.0 Hz), H-3a (2.97 ppm, dd, J = 13.9 and 6.7 Hz), and H-3b (2.80 ppm, dd, J = 13.9 and 5.0 Hz) of ring C. These attributions were confirmed by the analysis of the COSY spectrum (Figure S6 of Supplementary Material). Eriodictyol is also well known for its antioxidant properties [36]; therefore, the presence of 1 and 6 could justify the marked DPPH scavenging activity observed for this fraction.
The TIC chromatogram of fraction A-4 (Figure 1) shows an intense peak at tR = 21.1 min, which gave a [M − H] at m/z 495, tentatively attributed to an isomer of digalloyl quinic acid. This assumption was confirmed by the analysis of the MS/MS spectrum, where the peaks at m/z 343 (M-H-152) and 325 (M-H-170), respectively, indicate the loss of one galloyl unit and the loss of gallic acid. The peak at TR = 29.3 min was assigned to the catechin-fisetinidol dimer 9, according to the above-reported fragmentation pattern. A further peak at tR = 40.4 min, with [M − H] at m/z 289, was tentatively attributed to epicatechin (17) on the basis of its retention time, different from that of its epimer 12 [37]. An accurate analysis of 1H-NMR spectrum of fraction A-4 (Figure 4) confirmed and improved some of the identifications based on MS/MS data. Namely, two isomers of digalloyl quinic acid were identified; the signals at 5.53 (m, H-3), 5.14 (dd, J = 7.6, 5.0 Hz, H-5), 2.95 (dd, J = 14.0, 5.0 Hz, H-6a) and 2.79 ppm (dd, J = 14.0, 7.6 Hz, H-6b) were diagnostic for 3,5-digalloyl quinic acid (5), whose identification was corroborated by the analysis of its COSY spectrum (Figure S7 of Supplementary Material), also allowing for an unambiguous assignment of the signals. The signals at 5.68 (m, H-3), 5.22 (dd, J = 8.4, 2.8 Hz, H-4), 4.43 (m, H-5), and 2.32 (m, H-2) ppm instead were attributed to 3,4-digalloyl quinic acid (5′). Further signals at 5.93 (d, J = 1.9 Hz, H-8), 5.86 (d, J = 1.9 Hz, H-6), 4.67 (d, J = 5.6 Hz, H-2), and 3.97 (m, H-3) were consistent with the presence of epicatechin (17), whereas the signals at 4.57 (d, J = 5.7 Hz, H-2 fisetinidol), 4.45 (m, H-3 catechin), 4.00 (m, H-3 fisetinidol), 3.09 (dd, J = 15.2 and 8.7, H-4a catechin), and 2.66 ppm (dd, J = 15.2 and 6.5, H-4b catechin) confirmed the presence of a catechin-fisetinidol dimer.
The TIC profile of fraction A-5 (Figure 3) shows a series of non-polar peaks eluting between 35 and 60 min. The peak at tR = 37.0 min showed the same [M − H] and MS/MS fragmentation pattern of 9 found in previous fractions at 29.3 min. This peak was tentatively assigned to a catechin-fisetinidol isomer (9′). The peak at tR = 39.2 min showing a [M − H] at m/z 647 was attributed to a trigalloyl quinic acid isomer (11′), as confirmed by the fragment ions at m/z 495 (M-H- 152, loss of one unit of galloyl) and m/z 477 (M-H-170, loss of gallic acid). The complex envelope of overlapped peaks between 40 and 50 min showed several m/z signals attributable to fisetidinol-catechin oligomers, among which, we report here some identifications. A full characterization of proanthocyanidins was beyond the scope of this work, therefore, these identifications were based only on molecular ions because the adopted MS/MS parameters produced no daughter ions. A summary of these tentatively identified oligomers is reported in Table S1 of Supplementary Material. The ion [M − H] at m/z 833 was attributed to a trimer consisting of one unit of catechin and two units of fisetinidol (23), with MS/MS fragments at m/z 681 (M-H-152, loss of B ring by retro-Diels–Alder rearrangement) and m/z 561 (M-H-272, loss of one fisetinidol unit). Moreover, the peaks [M − H] at m/z 1105 (19) and m/z 1122 (21), were attributed to tetramers, constituted by one catechin and three fisetinidol units (19), and by two catechin and two fisetinidol units (21) [23]. The [M − H] at m/z 1394 was consistent with a pentamer formed by two catechin and three fisetinidol units (26); that at m/z 1667 was assigned to a hexamer with two catechin and four fisetinidol units (29). A trimer consisting of two units of fisetinidol and one of gallocatechin linked by an ether interflavan bond (typical of the A-type structure, Figure 3), was assigned to the [M − H] at m/z 847 (25). This identification was consistent with the presence of fragments at m/z 737 (M-H-110), 695 (M-H-152, loss of B ring by retro-Diels-Alder), and 575 (M-H-272, loss of one unit of fisetinidol). Furthermore, a gallocatechin-fisetinidol dimer 31 with an A-type linkage was identified by the presence of a [M − H] at m/z 575 and its corresponding MS/MS fragments. As expected, the 1H-NMR spectrum of fraction A-5 (Figure 4) shows a complex profile. Two prominent groups of signals in the aromatic region (7.3–5.8 ppm) and in the region typical of sp3 methine and methylene protons of dihydropyran moiety (4.7–2.8 ppm), may be attributed to A, B, and C rings of flavan-3-ol units of condensed tannins. Although it was not possible to achieve accurate information regarding these constituents, the large area of these groups of signals is consistent with the presence of proanthocyanidin oligomers as main constituents of this fraction.
Fraction A-6 shows a TIC chromatogram with a low intense peak at tR = 21 min, assigned to the above mentioned digalloyl quinic acid isomers (5 and/or 5′). An intense broad peak between 37 and 43 min is the main feature of this fraction; this includes a trigalloyl quinic acid isomer (11′) and the oligomers 9′, 19, and 23. The most intense peak gave a [M − H] at m/z 285, identified with the flavonoid fisetin (16) and confirmed by the fragment ions at m/z 163 (M-H-122, loss of B ring by a benzofuran-forming fission mechanism (BFF), m/z 241 (M-H-44, loss of CO2), and m/z 267 (M-H-18, loss of a molecule of water). The 1H-NMR spectrum of this fraction is rich in sharp, intense, and well-defined signals in the aromatic region. These signals, precisely at 7.98 (d, J = 9.4 Hz, H-5), 7.77 (d, J = 1.9 Hz, H-5′), 7.67 (dd, J = 8.5 and 1.9 Hz, H-6′), 6.90 (bs, H-2 ′and H-8), and 6.89 ppm (d, J = 9.4 Hz, H-6), were attributed to the protons of 16, which appears to be the most abundant compound of the fraction and is reasonably the main antioxidant constituent in this fraction [25,38]. The high intensity signals at the upper field (1.0–1.5 ppm) may be assigned to polyethylene presumably present as impurity due to the industrial production processes or to storage conditions of the stationary phase.
In fraction A-7, isomers of digalloyl quinic acid (5 and/or 5′) and a trigalloyl quinic acid isomer (11′) were identified. In the complex envelope of peaks observed between 36 and 42 min, the oligomers 9′, 19, 21 and 23 and a pentamer (28) made up of 1 catechin and 4 fisetinidol units with [M − H] at m/z 1377 were identified. The 1H-NMR spectrum of this fraction, as well as those of fractions A-8 and A-9, show a complex unresolved cluster of signals, especially in the aromatic region between 7.5 and 6.0 ppm, whose analysis could not provide any useful information (spectra not reported).
The TIC chromatogram of fraction A-8 (Figure 3), with the highest inhibitory potency towards α-GLU, shows an intense peak at tR = 42.0 min, whose MS analysis indicated the presence of a [M − H] of m/z 951 with corresponding fragment ions at m/z 799 (M-H-152, loss of one galloyl unit) and m/z 647 (M-H-304, loss of two galloyl units); this was assigned as pentagalloyl quinic acid (22). Less intense peaks in this fraction were attributed to a trigalloyl quinic acid (11, TR = 32.4 min, [M − H] at m/z 647) and a tetragalloyl quinic acid isomer (14, TR = 38.2 min, [M − H] at m/z 799). The analysis of the complex group of peaks between 36 and 49 min allowed for the identification of the above cited oligomers 9′, 19, 21, and 23 (the profisetinidine series), together with another series of condensed tannins constituted of catechin-3-O-gallate linked to variable units of profisetinidol (from 1 to 3) and weighting 152 Da more than the series containing catechin. Hence, the [M − H] at m/z 713, 985, and 1121 were attributed to dimer (15), trimer (18), and tetramer (27), respectively.
The TIC profile of fraction A-9 (Figure 3) is characterized by one minor peak between 10 and 18 min and an intense envelope of peaks around 37–52 min. The MS analysis of the former peak allowed the identification of gallic acid methyl ester (4) (tR = 15.4 min, [M − H] at m/z 183). The intense and only partially overlapped region between 37 and 52 min gave MS signals assigned to the above cited trigalloyl quinic acid isomer (11′), tetragalloyl quinic acid (14), and oligomers 15, 18, 19, and 23. The MS analysis of the peak at tR = 37.5 min indicated the presence of a [M − H] at m/z 787, identified as tetragalloylglucose (13), confirmed by fragment ions at m/z 617 (M-H-170) and m/z 635 (M-H-152). The peak at tR = 50.0 min showed a [M − H] at m/z = 939, whose fragment ions were at m/z 787 (M-H- 152, loss of galloyl) and m/z 769 (M-H-170, loss of gallic acid); according to these data, it was assigned as pentagalloylglucose isomer (32).
Overall, the HPLC-ESI/MS analysis of A-7–A-9, allowed the identification of hydrolysable tannins (13, 32), esters of quinic acid with different units of gallic acid (5 and/or 5′, 11′, 14, 22) and oligomeric condensed tannins (9′, 10, 15, 18, 19, 21, 23, 27, 28), suggesting that these compounds may be responsible for the higher hypoglycemic activity of these fractions. Indeed, α-glucosidase and α-amylase [39] inhibitory activity have been observed to increase, with the degree of polymerization being pentamers more active than monomers [40].

3. Materials and Methods

3.1. Chemicals

A sample of commercial tannin Tan’Activ QS SOL (lot n. 03041, SL-T) was provided by Silvateam (S. Michele Mondovì, CN, Italy). Methanol (MeOH), 96% ethanol (EtOH), fluorescein, and Folin–Ciocalteu reagent were purchased from Merck (Darmstadt, Germany); 2,2-diphenylpicrylhydrazyl radical (DPPH•) and formic acid (FA) were obtained from Fluka (Thermo Fischer Scientific, San Jose, CA, USA); quercetin, gallic acid, α-glucosidase from Saccharomyces cerevisiae (EC 3.2.1.20, Type I, lyophilized powder, ≥10 units/mg protein; α-GLU), porcine pancreas α-amylase (EC 3.2.1.1, Type VI-B, > 5 units/mg solid; α-AMY), p-nitrophenyl-α-d-glucopyranoside (p-NP-α-Glc), starch from potato, 3,5-dinitrosalicylic acid (DNS), sodium potassium tartrate tetrahydrate, acarbose, KH2PO4, Na2HPO4 12 H2O, fast red B dye, 6-hydroxy-2,5,7,8-tetramethylchromane-2-carboxyl acid (Trolox), CD3OD, D2O and Sephadex LH-20 were purchased from Sigma Aldrich (Milan, Italy). Cerium (IV) sulfate and ammonium molybdate were obtained from Carlo Erba (Milan, Italy). The 2,2′-Azobis(2-methylpropionamidine) dihydrochloride (AAPH) was purchased from Acros Organics (Thermo Fischer Scientific, San Jose, CA, USA). Thin layer chromatography (TLC) was carried out using pre-coated silica gel F254 plates (Merck, Darmstadt, Germany); spots were visualized under UV light at wavelengths of 254 and 366 nm, or by staining with a solution of cerium sulfate and phosphomolybdic acid followed by heating; or with DPPH or fast red B solutions. HPLC-grade water and acetonitrile (ACN) were purchased from Sigma Aldrich (Milan, Italy).

3.2. HPLC/ESI-MS/MS Analysis

Mass spectrometric analysis was performed on an ion trap mass spectrometer equipped with an electrospray ion source ESI (LCQ-DECA, Thermo Fischer Scientific, San Jose, CA, USA). The mass spectrometer was coupled online with a and autosampler (Thermo Fischer Scientific, San Jose, CA, USA) and a LC-pump (Surveyor MS Pump, Thermo Fischer Scientific, San Jose, CA, USA). Samples were dissolved in methanol ((25 µg/µL) and 5µL were loaded onto a Waters Symmetry RP-C18 column (150 mm × 1 mm i.d., 100 Å, 3.5 µm). Separation was achieved thermosetting the column at 25 °C with a linear gradient of H2O + 1% FA and ACN + 1% FA at 50 μL/min. Elution was performed, increasing solvent B from 5% to 15% in 25 min, 25% in 40 min, 30% in 45 min, and 55% in 55 min. Full scan mass spectra were acquired in negative ion mode in the m/z range 150–2000. ESI ion source operated with 220 °C capillary temperature, 30 a.u. sheath gas, −3.5 kV source voltage and −18 V capillary voltage. Mass spectrometric analysis was performed by the data-dependent method with normalized collision energy of 30 a.u. and activation Q set as 0.250. Mass calibration was achieved with a standard mixture of caffeine (Mr 194.1 Da), MRFA peptide (Mr 524.6 Da), and Ultramark (Mr 1621 Da). Data acquisition and data analyses were performed with the Xcalibur v. 1.3 Software.

3.3. NMR Analysis

1H and gCOSY NMR spectra were acquired on a Varian 500 VNMR-S spectrometer (Varian, Milan, Italy) operating at 499.86 MHz (1H) at 300 K and performed using software provided by the manufacturers. Samples were dissolved in CD3OD or D2O. Chemical shifts (δ) were indirectly referred to TMS using the residual solvent signal as a reference. The pre-sat technique was used, at the occurrence, to suppress the undesired signal of residual water.

3.4. Preparation of Tannin Extract (CSE)

Commercial tannin SL-T powder (10.7 g) was extracted three times with ethyl acetate (100 mL) at 25 °C under stirring for a total of 6 h. The filtrates were evaporated until dry, providing a residue (SL-A) of 3.7218 g (34.7%).

3.5. Sephadex LH-20 Fractionation

The SL-A extract (3.0282 g) was fractionated onto Sephadex LH-20 column (60 x 3 cm), eluted first with water (800 mL) and after with 20% (250 mL), 40% (100 mL), 80% (150 mL), and 100% MeOH (2000 mL) in water; next, the eluents were 25% (150 mL), 50% (150 mL), and 100% acetone (150 mL) in MeOH. Column eluates were pooled according to TLC analysis in nine fractions: A-1 (0.1101 g), A-2 (0.0876 g), A-3 (0.1821 g), A-4 (0.1326 g), A-5 (0.5968g), A-6 (0.4303 g), A-7 (0.8807 g), A-8 (0.1582 g), and A-9 (0.2503 g), with a total weight of 2.8287 g (93% of total extract recovered).

3.6. Determination of Total Phenols (GAE)

The total phenols in the SL-T, SL-A and A-1–A-9 fractions were determined with the Folin–Ciocalteu method [41]. Extracts and fractions were dissolved in MeOH solutions or mixture MeOH: H2O (50:50) (0.5 mg/mL) and mixed with Folin–Ciocalteu’s reagent (250 μL) and 1.9 M Na2CO3 solution (500 μL) in a 5 mL volumetric flask. Solutions were incubated at 25 °C for 2 h. The absorbance of each solution was measured at 750 nm with a Jasco V630 spectrometer. A gallic acid standard curve was obtained with different gallic acid concentrations prepared in triplicate (40, 60, 80, and 100 mg/L; r2 = 0.995). Results, obtained as mean ± SD, were reported as mg of gallic acid per g of extract/fraction (gallic acid equivalent, GAE).

3.7. DPPH Radical Scavenging Activity Assay

The radical scavenging activity was determined with a DPPH• stable radical, as previously reported [42]. The samples were examined at three different concentrations. Briefly, 10, 20, and 30 µL of solutions of extract or fractions (0.2–0.5 mg/mL) were added to 2 mL of a freshly prepared DPPH• solution (10−4 M). The mixtures were incubated for 2 h in the dark at 25 °C, and the absorbance was measured at 515 nm with a Jasco V630 spectrometer. The percentage of reacted DPPH• was calculated according to this equation:
q u e n c h e d   D P P H ( % ) = ( A 0 A s a m p l e ) A o × 100
where A0 is the absorbance measured for the DPPH solution; Asample is the absorbance measured for DPPH solution treated with tested compounds. SC50 (50% scavenging concentration) is the concentration (µg/mL) of the extract quenching 50% of the initial DPPH• radicals. SC50 was calculated from the linear regression between the % of DPPH• quenched and the sample concentration.

3.8. Determination of Oxygen Radical Absorbance Capacity (ORAC)

The ORAC of the SL-T and SL-A extracts and A-1–A-9 fractions were measured according to a previously described method [11]. Extracts and fractions were dissolved in water or methanol at 0.1 mg/mL and subsequently, diluted with phosphate buffer (50 mM, pH 7.4) to get final working solutions in the range 0.125–0.0125 mg/mL. Trolox, fluorescein, and AAPH were freshly dissolved in phosphate buffer. A set of four solutions of Trolox in phosphate buffer (6.25, 12.5, 25.0, and 33.3 µmol/L) were prepared to construct a calibration curve (r2 = 0.997). The mixtures were prepared into a 96-well microplate. In total, 25 µL of sample solutions, Trolox or phosphate buffer (blank) was added in each well followed by 150 µL of 1 × 10⁻⁷ M fluorescein solution. The mixtures were shaken at 37 °C for 10 min. The fluorescence of each well was measured immediately after the addition of 25 µL of AAPH (0.153 M) and monitored every 1 min for 46 cycles using a microplate reader (Synergy H1 microplate reader, BioTek, Bad Friedrichshall, Germany) set at λEx = 485 nm and λEm = 528 nm. ORAC values were derived from the linear regression between Trolox concentration and the area under the curve (AUC). The results were expressed as µmol of Trolox equivalents per gram of extract or fraction (µmol TE/g).

3.9. Measurements of α-Glucosidase Inhibition

The α-glucosidase inhibition assay [10] was performed in a 96-well microplate. Stock solutions of extracts and fractions were prepared in methanol ranging from 1.2 to 0.6 mM. The α-glucosidase solution (0.25 U/mL in 50 mM phosphate buffer, pH 6.8; 100 µL) was mixed with different aliquots (2, 4, 6, 8, 10, 15 µL) of stock solutions. In total, 100 µL of the substrate pNP-α-G (78 µM) was added and the microplate was incubated at 37 °C for 30 min under shaking. The absorbance of p-nitrophenol released was measured at 405 nm with the Synergy H1 microplate reader after stopping the reaction, by adding 1 M Na2CO3 solution (10 μL). Acarbose and quercetin were analyzed as reference standards. Each compound was tested at five different concentrations. The amount of methanol used in the experiment did not affect the glucosidase inhibitory activity. The inhibition percentage was calculated by the following equation:
i n h i b i t i o n   % = ( A c o n t r o l A s a m p l e ) A c o n t r o l × 100
where Acontrol is the absorbance measured for the mixture of enzyme/substrate (without tested compounds); Asample is the absorbance measured in the same conditions and in the presence of the tested compounds. The concentration required to inhibit the 50% activity of the enzyme (IC50) was calculated by regression analysis.

3.10. Measurements of α-Amylase Inhibition

The measurement of α-amylase inhibitory activity was performed as previously reported [16]. A stock solution of starch (0.5%) was prepared in 20 mM phosphate buffer (20 mM; pH 6.9) containing 6.7 mM NaCl; the mixture was stirred at 90 °C for 20 min before use. Stock solutions of tested compounds were prepared in water or methanol at concentrations ranging from 5 mg/mL to 0.5 mg/mL. In total, 300 µL of enzyme solution (6 U/mL in phosphate buffer) was added to different aliquots (10, 20, 40, 60, and 100 µL) of the extracts and fractions, and incubated at 37 °C for 10 min. The starch solution (300 µL) was added in the test tubes and the mixtures were incubated at 37 °C for 15 min. The reaction was stopped by adding of 600 µL of 96mM DNS solution (with 30% sodium potassium tartrate in 2N NaOH) and the mixtures were heated in a boiling water bath for 10 min. The test tubes were cooled and diluted with 2 mL of water. The absorbance was measured at 540 nm. Acarbose and quercetin were analyzed as positive references. The control, representing 100% enzyme activity, was carried out by replacing the aliquots of the tested compounds with buffer. The inhibition percentage was calculated by the following equation:
i n h i b i t i o n   % = ( A c o n t r o l A s a m p l e ) A c o n t r o l × 100
IC50 was calculated by regression analysis.

3.11. Statistical Analysis

All experiments were performed in triplicate or quadruplicate, and the results were expressed as mean value ± standard deviations. Principal component analysis (PCA) was performed with the Pareto scaling method and analysis of correlations was determined by the bivariate correlations test. All data were obtained by plotting the experimental measurements on Origin 8.0 software or on Excel 2016. All the obtained results were compared using Analysis of Variance (ANOVA) and differences were designated as statistically significant when p < 0.05.

4. Conclusions

Overall, in this work, polyphenol-enriched fractions with antioxidant and/or hypoglycemic activity superior to those of the extract SL-A and the commercial sample obtained from Schinopsis lorentzii wood (SL-T) were obtained. The HPLC-ESI/MS-MS and 1H-NMR analyses allowed the identification of the main polyphenols responsible for the antioxidant and/or hypoglycemic activity. In particular, fractions A-1 and A-3, with the highest antioxidant activity, include gallic acid (1), pyrogallol (3), and the flavonols eriodictyol (6), catechin (12), and taxifolin (30), well-known as antioxidant polyphenols. Fractions A-7–A-9, showing promising hypoglycemic activity and good antioxidant capacity, contain a number of condensed (9′, 15, 18, 19, 23, 27) and hydrolysable tannins (13, 32), as well as esters of quinic acid with different units of gallic acid (5, 11, 11′, 14, 22). In this regard, several literature data report studies of α-GLU and/or α-AMY inhibition by hydrolysable and condensed tannins [16,17,18,43,44], well-known for their antioxidant activity. Although these properties have been reported for esters of caffeic acid with quinic acid [45], this is the first time that gallic acid esters with quinic acid are reported as α-glucosidase and α-amylase inhibitors.

Supplementary Materials

The most significant MS/MS fragmentation patterns of identified compounds, a copy of COSY spectra of A-3 and A-4 fractions and a list of the identified condensed tannin oligomers are available online.

Author Contributions

Conceptualization, C.T., V.M.; methodology, N.C., V.M.; validation, V.M., N.C. and V.C.; investigation, N.C., V.M. and V.C.; resources, C.T., V.M.; data curation, N.C., V.M. and V.C.; writing—original draft preparation, N.C., V.M.; writing—review and editing, C.T., N.C. and V.M.; visualization, N.C. and V.M.; supervision, N.C. and V.M.; project administration, C.T. and V.M.; funding acquisition, V.M. and C.T. All authors have read and agreed to the published version of the manuscript.

Funding

This research was funded by ‘Piano della Ricerca di Ateneo 2016-2018, Linea d’intervento 2’ of Università degli Studi di Catania and by MIUR ITALY PRIN 2017 (Project No. 2017A95NCJ).

Acknowledgments

The authors thank S. Giovando of Silvateam SpA (S. Michele Mondovì, CN, Italy) for the generous gift of one batch of Tan’Activ QS SOL (N 03041). The authors acknowledge the Bio-nanotech Research and Innovation Tower (BRIT), financed by the Italian Ministry for Education, University and Research (MIUR) (Grant no. PONa3_00136), for making available the Synergy H1 microplate reader.

Conflicts of Interest

The authors declare no conflict of interest. The funders had no role in the design of the study; in the collection, analyses, or interpretation of data; in the writing of the manuscript, or in the decision to publish the results.

References

  1. Zheng, Y.; Ley, S.H.; Hu, F.B. Global aetiology and epidemiology of type 2 diabetes mellitus and its complications. Nat. Rev. Endocrinol. 2018, 14, 88–98. [Google Scholar] [CrossRef] [PubMed]
  2. Fiorentino, T.V.; Prioletta, A.; Zuo, P.; Folli, F. Hyperglycemia-induced Oxidative Stress and its Role in Diabetes Mellitus Related Cardiovascular Diseases. Curr. Pharm. Des. 2013, 19, 5695–5703. [Google Scholar] [CrossRef]
  3. Chaudhury, A.; Duvoor, C.; Dendi, V.S.R.; Kraleti, S.; Chada, A.; Ravilla, R.; Marco, A.; Shekhawat, N.S.; Montales, M.T.; Kuriakose, K.; et al. Clinical Review of Antidiabetic Drugs: Implications for Type 2 Diabetes Mellitus Management. Front. Endocrinol. 2017, 8, 6. [Google Scholar] [CrossRef] [Green Version]
  4. Derosa, G.; Maffioli, P. alpha-Glucosidase inhibitors and their use in clinical practice. Arch. Med. Sci. 2012, 8, 899–906. [Google Scholar] [CrossRef] [PubMed]
  5. Godbout, A.; Chiasson, J.L. Who should benefit from the use of alpha-glucosidase inhibitors? Curr. Diab. Rep. 2007, 7, 333–339. [Google Scholar] [CrossRef] [PubMed]
  6. Tundis, R.; Loizzo, M.R.; Menichini, F. Natural Products as alpha-Amylase and alpha-Glucosidase Inhibitors and their Hypoglycaemic Potential in the Treatment of Diabetes: An Update. Mini-Rev. Med. Chem. 2010, 10, 315–331. [Google Scholar] [CrossRef]
  7. Qi, L.W.; Liu, E.H.; Chu, C.; Peng, Y.B.; Cai, H.X.; Li, P. Anti-Diabetic Agents from Natural Products-An Update from 2004 to 2009. Curr. Top. Med. Chem. 2010, 10, 434–457. [Google Scholar] [CrossRef] [PubMed]
  8. Hung, H.Y.; Qian, K.D.; Morris-Natschke, S.L.; Hsu, C.S.; Lee, K.H. Recent discovery of plant-derived anti-diabetic natural products. Nat. Prod. Rep. 2012, 29, 580–606. [Google Scholar] [CrossRef]
  9. Cardullo, N.; Spatafora, C.; Musso, N.; Barresi, V.; Condorelli, D.; Tringali, C. Resveratrol-Related Polymethoxystilbene Glycosides: Synthesis, Antiproliferative Activity, and Glycosidase Inhibition. J. Nat. Prod. 2015, 78, 2675–2683. [Google Scholar] [CrossRef] [PubMed]
  10. Pulvirenti, L.; Muccilli, V.; Cardullo, N.; Spatafora, C.; Tringali, C. Chemoenzymatic Synthesis and alpha-Glucosidase Inhibitory Activity of Dimeric Neolignans Inspired by Magnolol. J. Nat. Prod. 2017, 80, 1648–1657. [Google Scholar] [CrossRef]
  11. Cardullo, N.; Catinella, G.; Floresta, G.; Muccilli, V.; Rosselli, S.; Rescifina, A.; Bruno, M.; Tringali, C. Synthesis of Rosmarinic Acid Amides as Antioxidative and Hypoglycemic Agents. J. Nat. Prod. 2019, 82, 573–582. [Google Scholar] [CrossRef] [PubMed]
  12. Kasturi, S.; Surarapu, S.; Uppalanchi, S.; Anireddy, J.S.; Dwivedi, S.; Anantaraju, H.S.; Perumal, Y.; Sigalapalli, D.K.; Babu, B.N.; Ethiraj, K.S. Synthesis and alpha-glucosidase inhibition activity of dihydroxy pyrrolidines. Bioorg. Med. Chem. Lett. 2017, 27, 2818–2823. [Google Scholar] [CrossRef] [PubMed]
  13. Khan, K.M.; Rahim, F.; Wadood, A.; Kosar, N.; Taha, M.; Lalani, S.; Khan, A.; Fakhri, M.I.; Junaid, M.; Rehman, W.; et al. Synthesis and molecular docking studies of potent alpha-glucosidase inhibitors based on biscoumarin skeleton. Eur. J. Med. Chem. 2014, 81, 245–252. [Google Scholar] [CrossRef] [PubMed]
  14. Ajebli, M.; Eddouks, M. The Promising Role of Plant Tannins as Bioactive Antidiabetie Agents. Curr. Med. Chem. 2019, 26, 4852–4884. [Google Scholar] [CrossRef]
  15. Quideau, S.; Deffieux, D.; Douat-Casassus, C.; Pouysegu, L. Plant Polyphenols: Chemical Properties, Biological Activities, and Synthesis. Angew. Chem. Int. Ed. 2011, 50, 586–621. [Google Scholar] [CrossRef] [PubMed]
  16. Cardullo, N.; Muccilli, V.; Pulvirenti, L.; Cornu, A.; Pouysegu, L.; Deffieux, D.; Quideau, S.; Tringali, C. C-glucosidic ellagitannins and galloylated glucoses as potential functional food ingredients with anti-diabetic properties: A study of alpha-glucosidase and alpha-amylase inhibition. Food Chem. 2020, 313. [Google Scholar] [CrossRef] [PubMed]
  17. Muccilli, V.; Cardullo, N.; Spatafora, C.; Cunsolo, V.; Tringali, C. alpha-Glucosidase inhibition and antioxidant activity of an oenological commercial tannin. Extraction, fractionation and analysis by HPLC/ESI-MS/MS and H-1 NMR. Food Chem. 2017, 215, 50–60. [Google Scholar] [CrossRef]
  18. Cardullo, N.; Muccilli, V.; Saletti, R.; Giovando, S.; Tringali, C. A mass spectrometry and H-1 NMR study of hypoglycemic and antioxidant principles from a Castanea sativa tannin employed in oenology. Food Chem. 2018, 268, 585–593. [Google Scholar] [CrossRef]
  19. European Union Law. Available online: https://ec.europa.eu/food/sites/food/files/safety/docs/animal-feed-eu-reg-comm_register_feed_additives_1831-03.pdf (accessed on 16 July 2020).
  20. Yanagida, A.; Shoji, T.; Shibusawa, Y. Separation of proanthocyanidins by degree of polymerization by means of size-exclusion chromatography and related techniques. J. Biochem. Biophys. Methods 2003, 56, 311–322. [Google Scholar] [CrossRef]
  21. Guyot, S.; Marnet, N.; Drilleau, J.F. Thiolysis-HPLC characterization of apple procyanidins covering a large range of polymerization states. J. Agric. Food Chem. 2001, 49, 14–20. [Google Scholar] [CrossRef]
  22. Costamagna, M.S.; Zampini, I.C.; Alberto, M.R.; Cuello, S.; Torres, S.; Perez, J.; Quispe, C.; Schmeda-Hirschmann, G.; Isla, M.I. Polyphenols rich fraction from Geoffroea decorticans fruits flour affects key enzymes involved in metabolic syndrome, oxidative stress and inflammatory process. Food Chem. 2016, 190, 392–402. [Google Scholar] [CrossRef] [Green Version]
  23. Venter, P.B.; Senekal, N.D.; Kemp, G.; Amra-Jordaan, M.; Khan, P.; Bonnet, S.L.; van der Westhuizen, J.H. Analysis of commercial proanthocyanidins. Part 3: The chemical composition of wattle (Acacia mearnsii) bark extract. Phytochemistry 2012, 83, 153–167. [Google Scholar] [CrossRef] [PubMed]
  24. Boulekbache-Makhlouf, L.; Meudec, E.; Chibane, M.; Mazauric, J.P.; Slimani, S.; Henry, M.; Cheynier, V.; Madani, K. Analysis by High-Performance Liquid Chromatography Diode Array Detection Mass Spectrometry of Phenolic Compounds in Fruit of Eucalyptus globulus Cultivated in Algeria. J. Agric. Food Chem. 2010, 58, 12615–12624. [Google Scholar] [CrossRef] [PubMed]
  25. Kim, J.S.; Kwon, Y.S.; Chun, W.J.; Kim, T.Y.; Sun, J.H.; Yu, C.Y.; Kim, M.J. Rhus verniciflua Stokes flavonoid extracts have anti-oxidant, anti-microbial and alpha-glucosidase inhibitory effect. Food Chem. 2010, 120, 539–543. [Google Scholar] [CrossRef]
  26. Meyers, K.J.; Swiecki, T.J.; Mitchell, A.E. Understanding the native Californian diet: Identification of condensed and hydrolyzable Tannins in tanoak acorns (Lithocarpus densiflorus). J. Agric. Food Chem. 2006, 54, 7686–7691. [Google Scholar] [CrossRef] [PubMed]
  27. Falcao, L.; Araujo, M.E.M. Vegetable Tannins Used in the Manufacture of Historic Leathers. Molecules 2018, 23, 1081. [Google Scholar] [CrossRef] [Green Version]
  28. Venter, P.B.; Sisa, M.; van der Merwe, M.J.; Bonnet, S.L.; van der Westhuizen, J.H. Analysis of commercial proanthocyanidins. Part 1: The chemical composition of quebracho (Schinopsis lorentzii and Schinopsis balansae) heartwood extract. Phytochemistry 2012, 73, 95–105. [Google Scholar] [CrossRef] [PubMed]
  29. Gu, L.W.; Kelm, M.A.; Hammerstone, J.F.; Zhang, Z.; Beecher, G.; Holden, J.; Haytowitz, D.; Prior, R.L. Liquid chromatographic/electrospray ionization mass spectrometric studies of proanthocyanidins in foods. J. Mass Spectrom. 2003, 38, 1272–1280. [Google Scholar] [CrossRef]
  30. Hamed, A.I.; Al-Ayed, A.S.; Moldoch, J.; Piacente, S.; Oleszek, W.; Stochmal, A. Profiles analysis of proanthocyanidins in the argun nut (Medemia argun-an ancient Egyptian palm) by LC-ESI-MS/MS. J. Mass Spectrom. 2014, 49, 306–315. [Google Scholar] [CrossRef]
  31. Venter, P.B.; Senekal, N.D.; Amra-Jordaan, M.; Bonnet, S.L.; Van der Westhuizen, J.H. Analysis of commercial proanthocyanidins. Part 2: An electrospray mass spectrometry investigation into the chemical composition of sulfited quebracho (Schinopsis lorentzii and Schinopsis balansae) heartwood extract. Phytochemistry 2012, 78, 156–169. [Google Scholar] [CrossRef]
  32. Abraham, R.J.; Mobli, M. Modelling 1H-NMR Spectra of Organic Compounds:Theory, Applications and NMR Prediction Software; Wiley: Chichester, UK, 2008. [Google Scholar]
  33. Pizzi, A.; Daling, G.M.E. Laminating Wood Adhesives by Generation of Resorcinol From Tannin Extracts. J. Appl. Polym. Sci. 1980, 25, 1039–1048. [Google Scholar] [CrossRef]
  34. Li, H.J.; Deinzer, M.L. Tandem mass spectrometry for sequencing proanthocyanidins. Anal. Chem. 2007, 79, 1739–1748. [Google Scholar] [CrossRef] [PubMed]
  35. Chen, G.L.; Li, X.; Saleri, F.; Guo, M.Q. Analysis of Flavonoids in Rhamnus davurica and Its Antiproliferative Activities. Molecules 2016, 21, 1275. [Google Scholar] [CrossRef] [PubMed]
  36. Rossato, M.F.; Trevisan, G.; Walker, C.I.B.; Klafke, J.Z.; de Oliveira, A.P.; Villarinho, J.G.; Zanon, R.B.; Royes, L.F.F.; Athayde, M.L.; Gomez, M.V.; et al. Eriodictyol: A flavonoid antagonist of the TRPV1 receptor with antioxidant activity. Biochem. Pharmacol. 2011, 81, 544–551. [Google Scholar] [CrossRef] [PubMed] [Green Version]
  37. Gottumukkala, R.V.; Nadimpalli, N.; Sukala, K.; Subbaraju, G.V. Determination of Catechin and Epicatechin Content in Chocolates by High-Performance Liquid Chromatography. Int. Sch. Res. Notices. 2014, 2014, 628196. [Google Scholar] [CrossRef] [Green Version]
  38. Naeimi, A.F.; Alizadeh, M. Antioxidant properties of the flavonoid fisetin: An updated review of in vivo and in vitro studies. Trends Food Sci. Tech. 2017, 70, 34–44. [Google Scholar] [CrossRef]
  39. Goncalves, R.; Mateus, N.; de Freitas, V. Inhibition of alpha-amylase activity by condensed tannins. Food Chem. 2011, 125, 665–672. [Google Scholar] [CrossRef]
  40. Ma, C.M.; Sato, N.; Li, X.Y.; Nakamura, N.; Hattori, M. Flavan-3-ol contents, anti-oxidative and alpha-glucosidase inhibitory activities of Cynomorium songaricum. Food Chem. 2010, 118, 116–119. [Google Scholar] [CrossRef]
  41. Spatafora, C.; Barbagallo, E.; Amico, V.; Tringali, C. Grape stems from Sicilian Vitis vinifera cultivars as a source of polyphenol-enriched fractions with enhanced antioxidant activity. Lwt-Food Sci. Technol. 2013, 54, 542–548. [Google Scholar] [CrossRef]
  42. Amico, V.; Chillemi, R.; Mangiafico, S.; Spatafora, C.; Tringali, C. Polyphenol-enriched fractions from Sicilian grape pomace: HPLC-DAD analysis and antioxidant activity. Bioresour. Technol. 2008, 99, 5960–5966. [Google Scholar] [CrossRef]
  43. Gao, H.; Huang, Y.N.; Gao, B.; Xu, P.Y.; Inagaki, C.; Kawabata, J. alpha-Glucosidase inhibitory effect by the flower buds of Tussilago farfara L. Food Chemistry 2008, 106, 1195–1201. [Google Scholar] [CrossRef]
  44. de Sales, P.M.; de Souza, P.M.; Simeoni, L.A.; Magalhaes, P.D.; Silveira, D. alpha-Amylase Inhibitors: A Review of Raw Material and Isolated Compounds from Plant Source. J. Pharm. Pharm. Sci. 2012, 15, 141–183. [Google Scholar] [CrossRef] [PubMed] [Green Version]
  45. Yang, Y.; Lian, G.Y.; Yu, B. Naturally Occurring Polyphenolic Glucosidase Inhibitors. Isr. J. Chem. 2015, 55, 268–284. [Google Scholar] [CrossRef]
Sample Availability: Samples of the fractions A-1–A-9 are available from the authors.
Figure 1. Extraction and fractionation flow chart.
Molecules 25 03257 g001
Figure 2. Biplot representation on the factor-plane (PC1 vs. PC2), showing vector distribution of GAE, DPPH, ORAC, α-GLU, and α-AMY within score plot of the SL-T, SL-A and fraction A-1–A-9.
Molecules 25 03257 g002
Figure 3. HPLC/ESI-MS/MS (TIC profiles) of A-1–A-9 fractions obtained from a Schinopsis lorentzii tannin.
Molecules 25 03257 g003
Figure 4. 1H-NMR spectra (500 MHz, CD3OD or D2O) of fractions A-1–A-6.
Molecules 25 03257 g004
Figure 5. Chemical structures of identified compounds.
Molecules 25 03257 g005
Table 1. Percentage weight, gallic acid equivalents (GAE), DPPH scavenging activity, Oxygen Radical Absorbance Capacity (ORAC), and α-glucosidase and α-amylase inhibition activity of the extracts and fractions from Schinopsis lorentzii tannins.
CodeWeight %GAE
(mg/g) 1
DPPH
(SC50 ± SD) 2
ORAC
(TE ± SD) 3
α-GLU
(IC50 ± SD) 4
α-AMY
(IC50 ± SD) 4
SL-T-303.5 ± 8.87.4 ± 0.81075.4 ± 71.648.9 ± 2.2129.3 ± 13.0
SL-A34.7 5316.3 ± 10.45.5 ± 0.61410.7 ± 60.8 6.3 ± 0.3 86.1 ± 11.3
A-13.9 6867.5 ± 12.94.0 ± 0.63345.4 ± 36.314.5 ± 1.2 79.5 ± 10.4
A-23.2 6357.3 ± 16.47.7 ± 0.7 896.5 ± 11.647.2 ± 0.166.5 ± 8.9
A-36.4 6756.4 ± 15.34.9 ± 0.41895.1 ± 23.224.9 ± 1.681.8 ± 9.3
A-44.7 6467.3 ± 7.26.1 ± 1.81440.2 ± 16.931.6 ± 1.9294.7 ± 15.9
A-521.1 6475.1 ± 8.56.0 ± 0.5 719.0 ± 36.722.4 ± 0.3172.8 ± 13.9
A-615.2 6483.1 ± 19.55.3 ± 0.61224.9 ± 32.9 8.9 ± 1.072.5 ± 6.6
A-731.1 6388.2 ± 5.56.1 ± 0.3 793.5 ± 13.7 3.6 ± 0.2 93.6 ± 11.3
A-85.6 6316.7 ± 3.76.6 ± 0.5 936.2 ± 28.2 2.1 ± 0.864.2 ± 8.4
A-98.8 6279.0 ± 9.18.1 ± 0.6 653.6 ± 19.8 2.6 ± 0.366.6 ± 7.4
Que--3.9 ± 0.5 4.8 ± 0.3 7 5.5 ± 0.747.6 ± 6.1
Aca----97.2 ± 4.836.8 ± 9.3
1 Results are reported in mg/g of extract or fraction as mean ± SD (n = 3). 2 Results are reported in μg/mL of a standard DPPH solution as mean ± SD (n = 3). 3 Results are reported in μmol TE/g of extract or fraction as mean ± SD (n = 4).4 Results are reported in µg/mL. 5 Data are expressed as g/100 g of dried SL-T powder. 6 Data are reported as g/100 g of total eluate. 7 This value is reported as TE (µM).
Table 2. Eigenvectors of the included variables in PCA of Figure 2 on PC1 and PC2.
Coefficients of PC1Coefficients of PC2
GAE0.550810.10679
DPPH0.538420.19330
ORAC0.537260.19248
α-GLU−0.328630.57787
α-AMY−0.100310.76174
Table 3. Identification by HPLC-ESI-MS/MS and 1H-NMR of the main constituents of A-1–A-9 fractions from Schinopsis lorentzii tannins.
tR (min)IdentificationCalcd mass[M − H]MS/MS Fragments m/z
(Relative intensity)
1H-NMR Signals δ
(multiplicity, J = Hz, assignment)
Fraction
3.1Gallic acid (1) 170169125 (100)7.06 (s, H-2/H-6)A-1–A-3
3.2Monogalloylglucose isomer (2)332331271 (100); 241 (30); 169 (10) A-1
3.5Pyrogallol (3) 1126125-6.72 (t, J = 8.1, H-5), 6.52 J = 8.1, H-4/H-6)A-1
20.0Gallic acid methyl ester (4)184183 A-9
21.13,5-digalloylquinic acid (5) 2496495343 (100); 325 (50)5.53 (m, H-3), 5.14 (bdd, J = 7.6, 5.0, H-5);
2.95 (dd, J = 14.0, 5.0, H- 6a),
2.79 (dd, J = 14.0, 7.6, H-6b)
A-4
21.13,4-digalloylquinic acid (5′) 2496495343 (100); 325 (50)5.68 (m, H-3), 5.22 (dd, J = 8.4, 2.8, H-4)
4.43 (m, H-5), 2.32 (m, H-2)
A-4
27.7Eriodictyol (6)288287269 (100). 163 (20)5.14 (dd, J = 6.7, 5.0, H-2),
2.97 (dd, J = 13.9, 6.7, H-3a),
2.80 (dd, J = 13.9, 5.0, H-3b)
A-3
28.0Monogalloylquinic acid isomer (7)344343325 (100). 191(40) A-1
28.3Dimer isomer (C-SF) (8) 3644643561 (100;) 409(20;) 289(10) A-1–A-3
29.3Dimer isomer (C-F) (9) 2,3562561543 (20); 541 (40); 409 (100); 289 (60); 271 (30)4.57 (d, 5.7 Hz, H-2 F), 4.45 (m, H-3 C),
4.00 (m, H-3 F), 3.09 (dd, J = 15.2, 8.7, H-4a C),
2.66 (dd, J = 15.2, 6.5, H-4b C)
A-1; A-4
29.7Trimer isomer (C-F-SF) (10) 3916915833 (100); 681 (20); 561 (20); 289 (20) A-1–A-3
32.4Trigalloylquinic acid isomer (11)648647495 (100); 477 (20) A-8
37.0Dimer isomer (C-F) (9′) 2,3562561543 (20); 541 (40); 409 (100); 289 (60) A-5–A-8
37.3Catechin (12)290289271(100); 245(10); 179 (30); 167 (90); 151 (5); 137 (5); 109 (5) A-3
37.5Tetragalloylglucose isomer (13)788787635 (20); 617 (100) A-9
38.2Tetragalloylquinic acid isomer (14)800799647 (100); 601 (10); 477 (5); 495 (5) A-8; A-9
39.2Trigalloylquinic acid isomer (11′) 2648647495 (100); 477 (20) A-5–A-7; A-9
39.3Dimer isomer (CG-F) (15) 3714713695 (10); 603 (10); 561 (100); 573 (40); 441 (100) A-8; A-9
40.3Fisetin (16)286285163 (100); 241 (20); 267 (30)7.98 (d, J = 9.4, H-5), 7.77 (d, J = 1.9, H-5′),
7.67 (dd, J = 8.5, 1.9, H-6′), 6.90 (bs, H-2′, H-8),
6.89 (d, J = 9.4, H-6)
A-6
40.4Epi-catechin (17)290289271(70); 245(100); 179 (30); 167 (60); 151 (5); 137 (5); 109 (5)5.93 (d, J = 1.9, H-8), 5.86 (d, J = 1.9, H-6),
4.67 (d, J = 5.6, H-2), 3.97 (m, H- 3)
A-4
40.5Trimer isomer (CG-F-F) (18) 3986985831 (20); 749 (40); 697 (80); 679 (80); 577 (90); 561 (70); 529 (100) A-8; A-9
41.1Tetramer isomer (C-F-F-F) (19) 3110611051086 (20); 995 (40); 953 (100); 935 (60); 833 (70); 561 (20) A-5–A-9
41.3Tetramer isomer (C-F-F-SF) (20) 3118811871185 (100); 953 (30); 833 (10) A-2
41.4Tetramer isomer (C-C-F-F) (21) 1,311231122- A-5; A-7; A-8
42.0Pentagalloylquinic acid isomer (22)952951799 (100); 647 (10) A-8
42.1Trimer isomer (C-F-F) (23) 3834833723 (10); 681 (95); 663 (50); 561 (100); 529 (75);289 (10) A-5–A-9
42.5Pentamer isomer (C-F-F-F-SF) (24) 2146014591377 (100); 1225 (30); 1105 (30) A-3
43.3A-type trimer isomer (GC-F-F) (25) 2848847737 (40); 695 (100); 575 (60) A-5
43.3Pentamer isomer (C-C-F-F-F) (26) 1,313951394- A-5
43.7Tetramer isomer (GC-F-F-F) (27) 1,311221121- A-8
45.0Pentamer isomer (C-F-F-F-F) (28) 3 137813771225 (100); 1207(50);1105 (50); 995 (30); 833 (20) A-7
45.1Hexamer isomer (C-C-F-F-F-F) (29) 1,316681667- A-5
46.2Taxifolin (30)304303285 (100); 259 (40);175 (70)6.90 (d, J = 1.9, H-2′), 6.79 (m, H-5′, H-6′),
6.28 (d, J = 1.9, H-8), 6.25 (d, J = 1.9, H-6)
A-3
48.1A-type bond dimer isomer (GC-F) (31) 3 576575533 (20); 467 (30); 437 (25); 425 (40); 409 (50); 289 (100) A-5
50.0Pentagalloylglucose isomer (32)940939787 (100); 769 (10) A-9
-Resorcinol (33) 4 7.12 (t, J = 8.2, H-5), 6.43 (dd, J = 8.2, 2.1, H-4/H-6), 6.37 (bt, J = 2.1, H-2)A-2
1 These MS identifications were based only on molecular ions because the adopted MS/MS parameters produced no daughter ions. 2 These couples of indistinguishable isomers with different retention times were numbered with or without superscript (N, N′). 3 Catechin (C); Fisetinidol (F); Gallocatechin (GC); Catechin-3-O-gallate (CG); Sulfited Fisetinidol (SF). 4 Identification was achieved only by 1HNMR data analysis.

