Verification of Chromatographic Profile of Primary Essential Oil of Pinus sylvestris L. Combined with Chemometric Analysis

 and
and
Abstract
1. Introduction
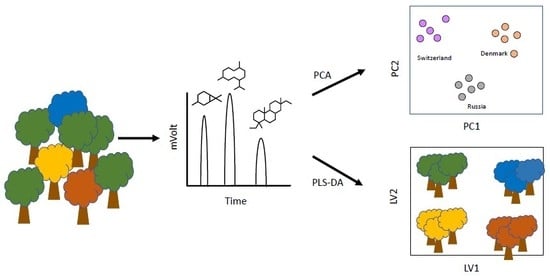
2. Results and Discussion
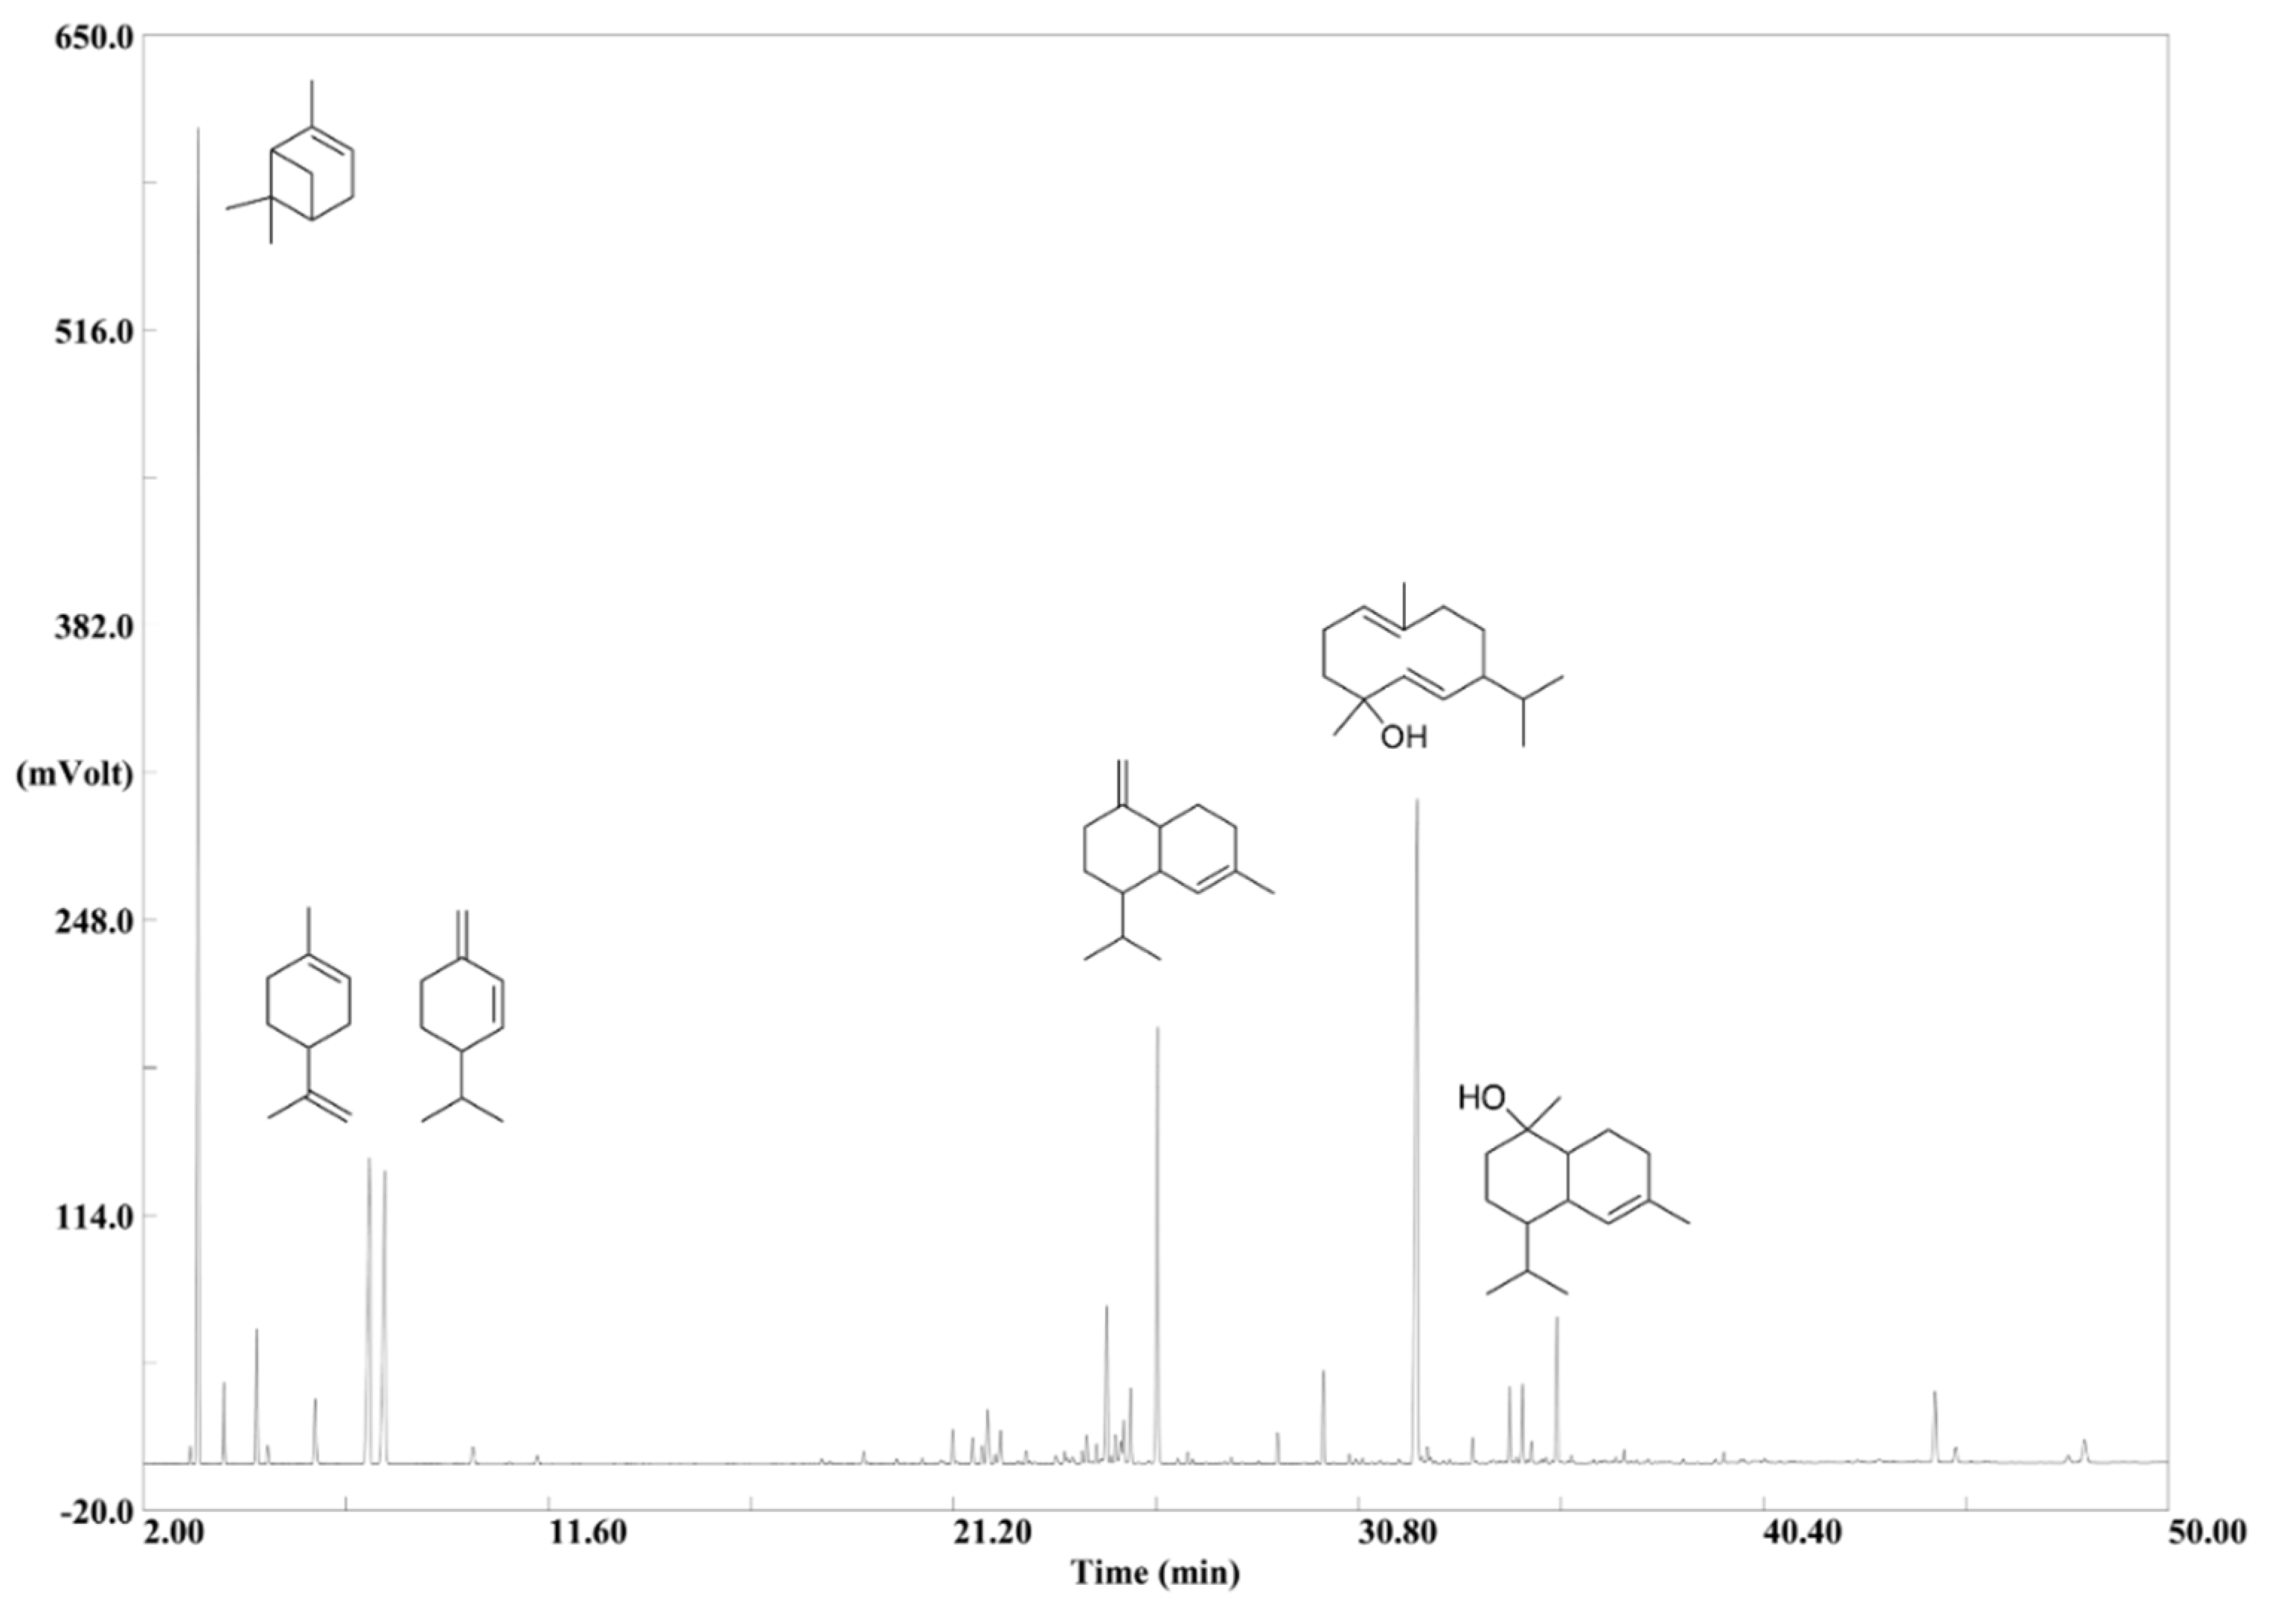
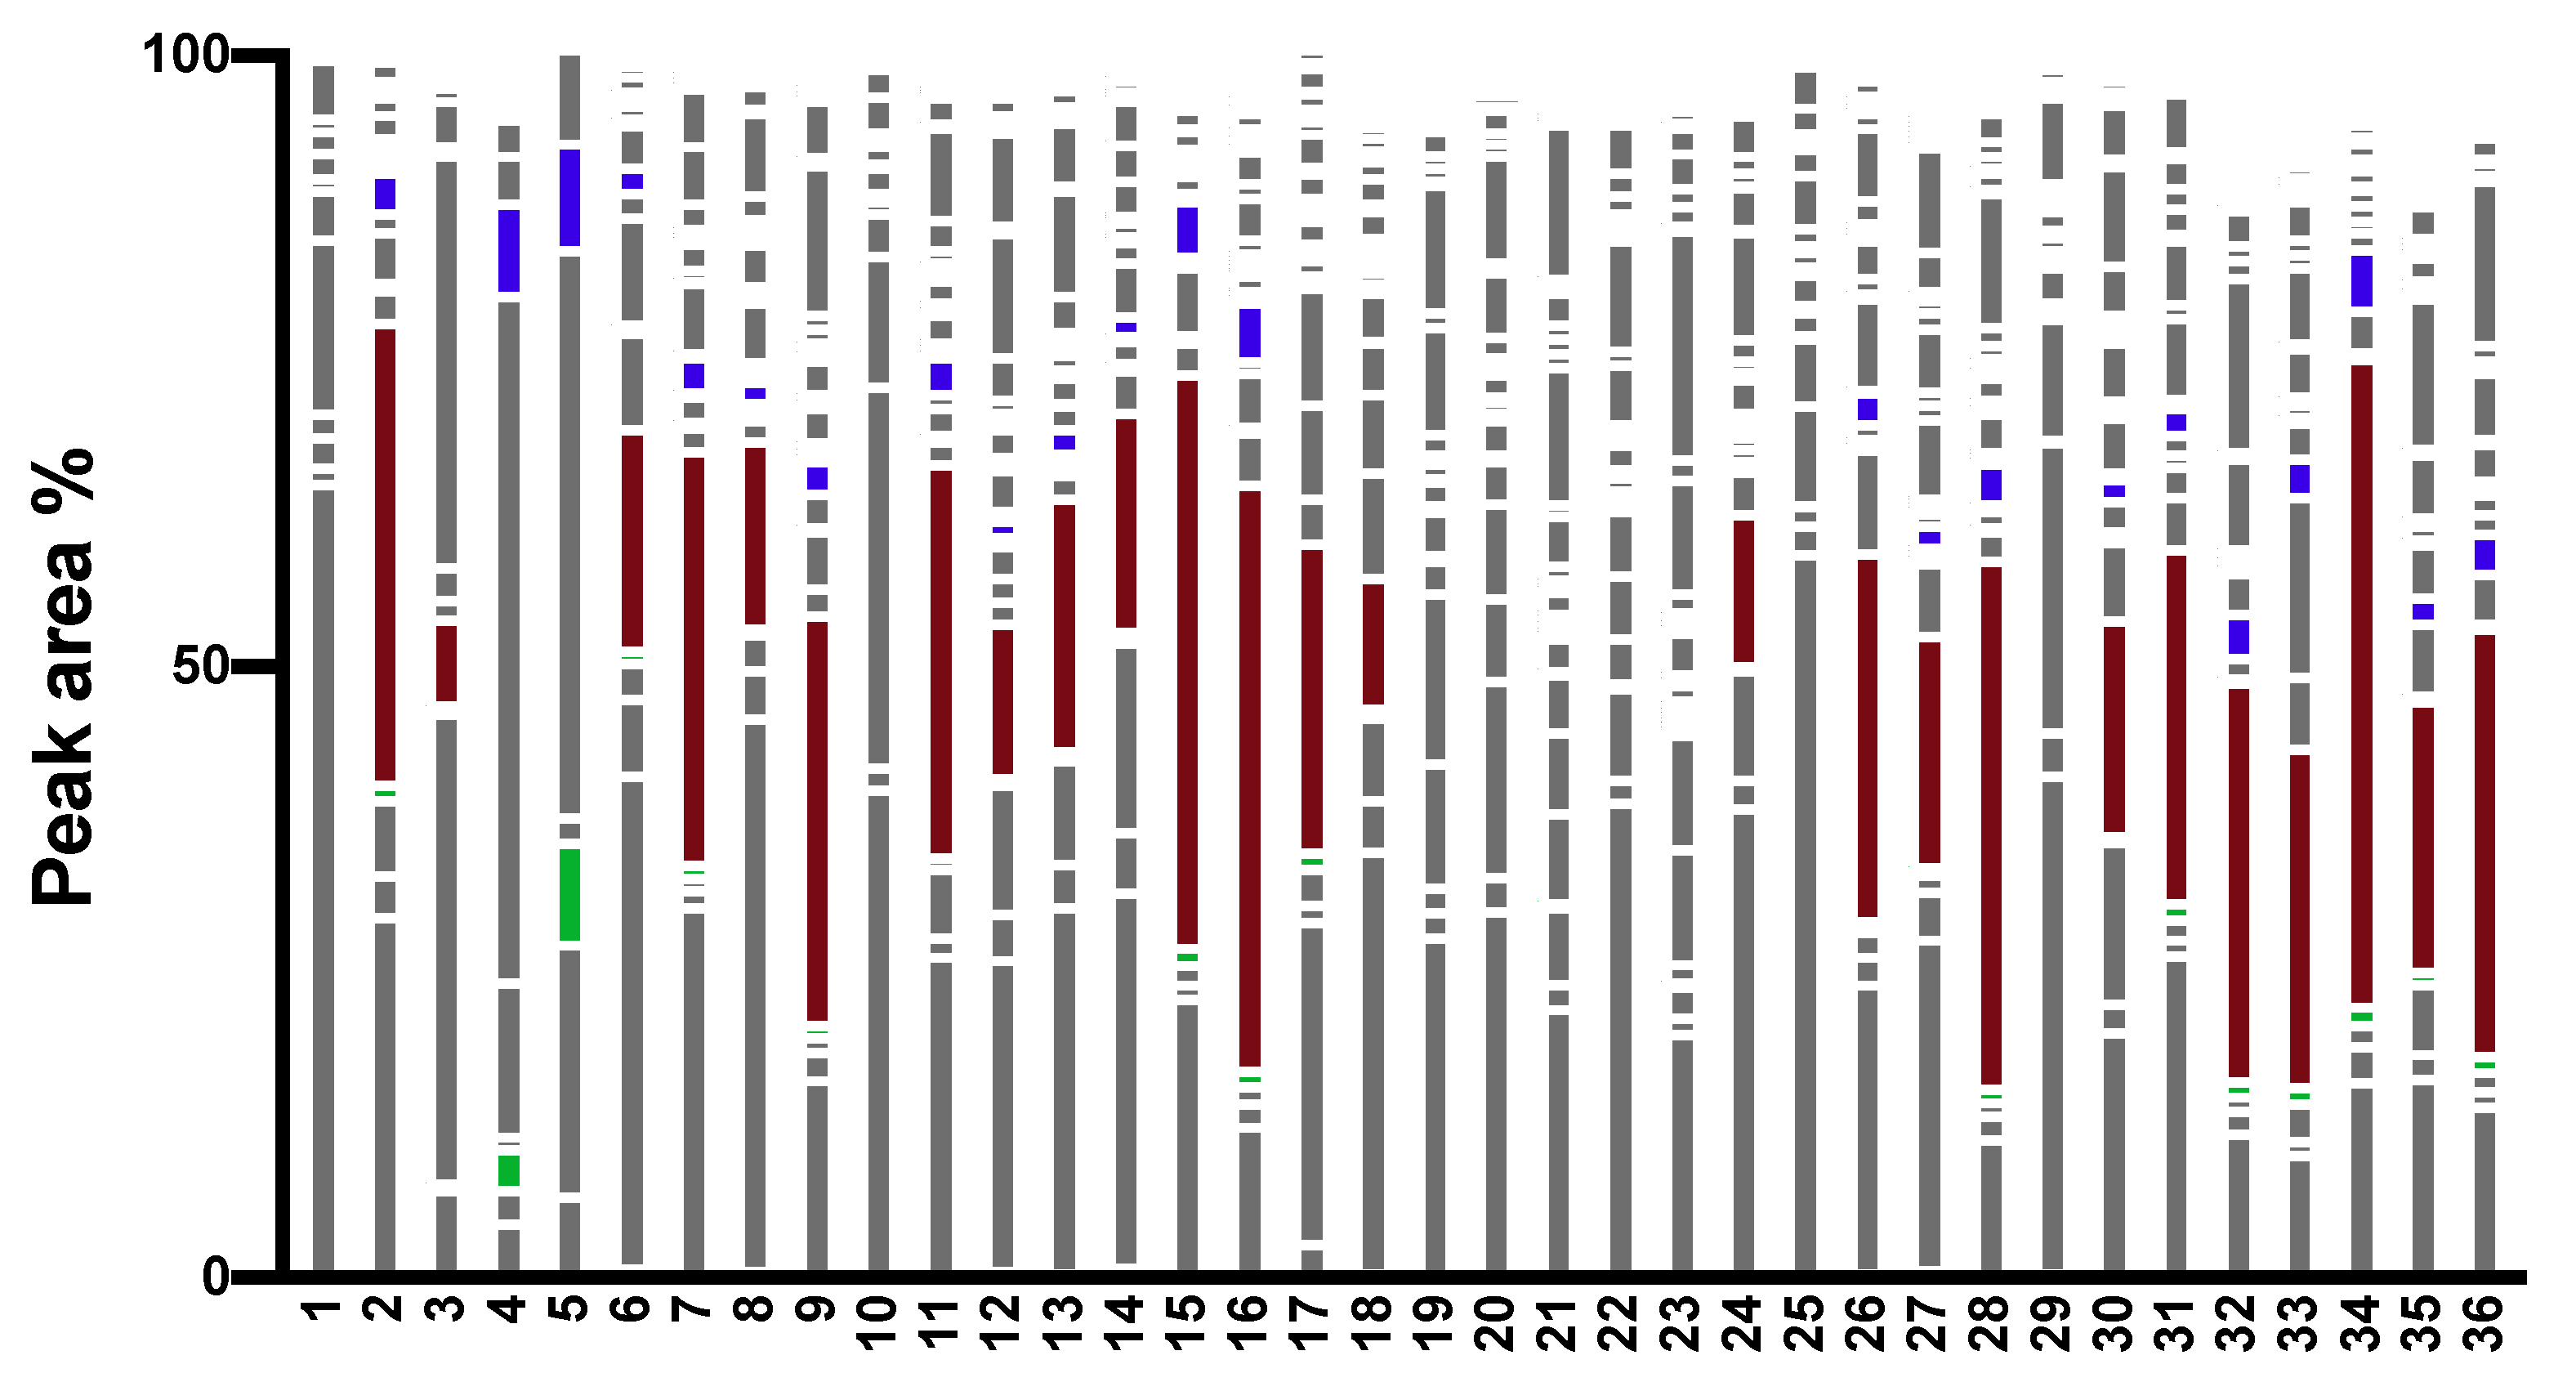
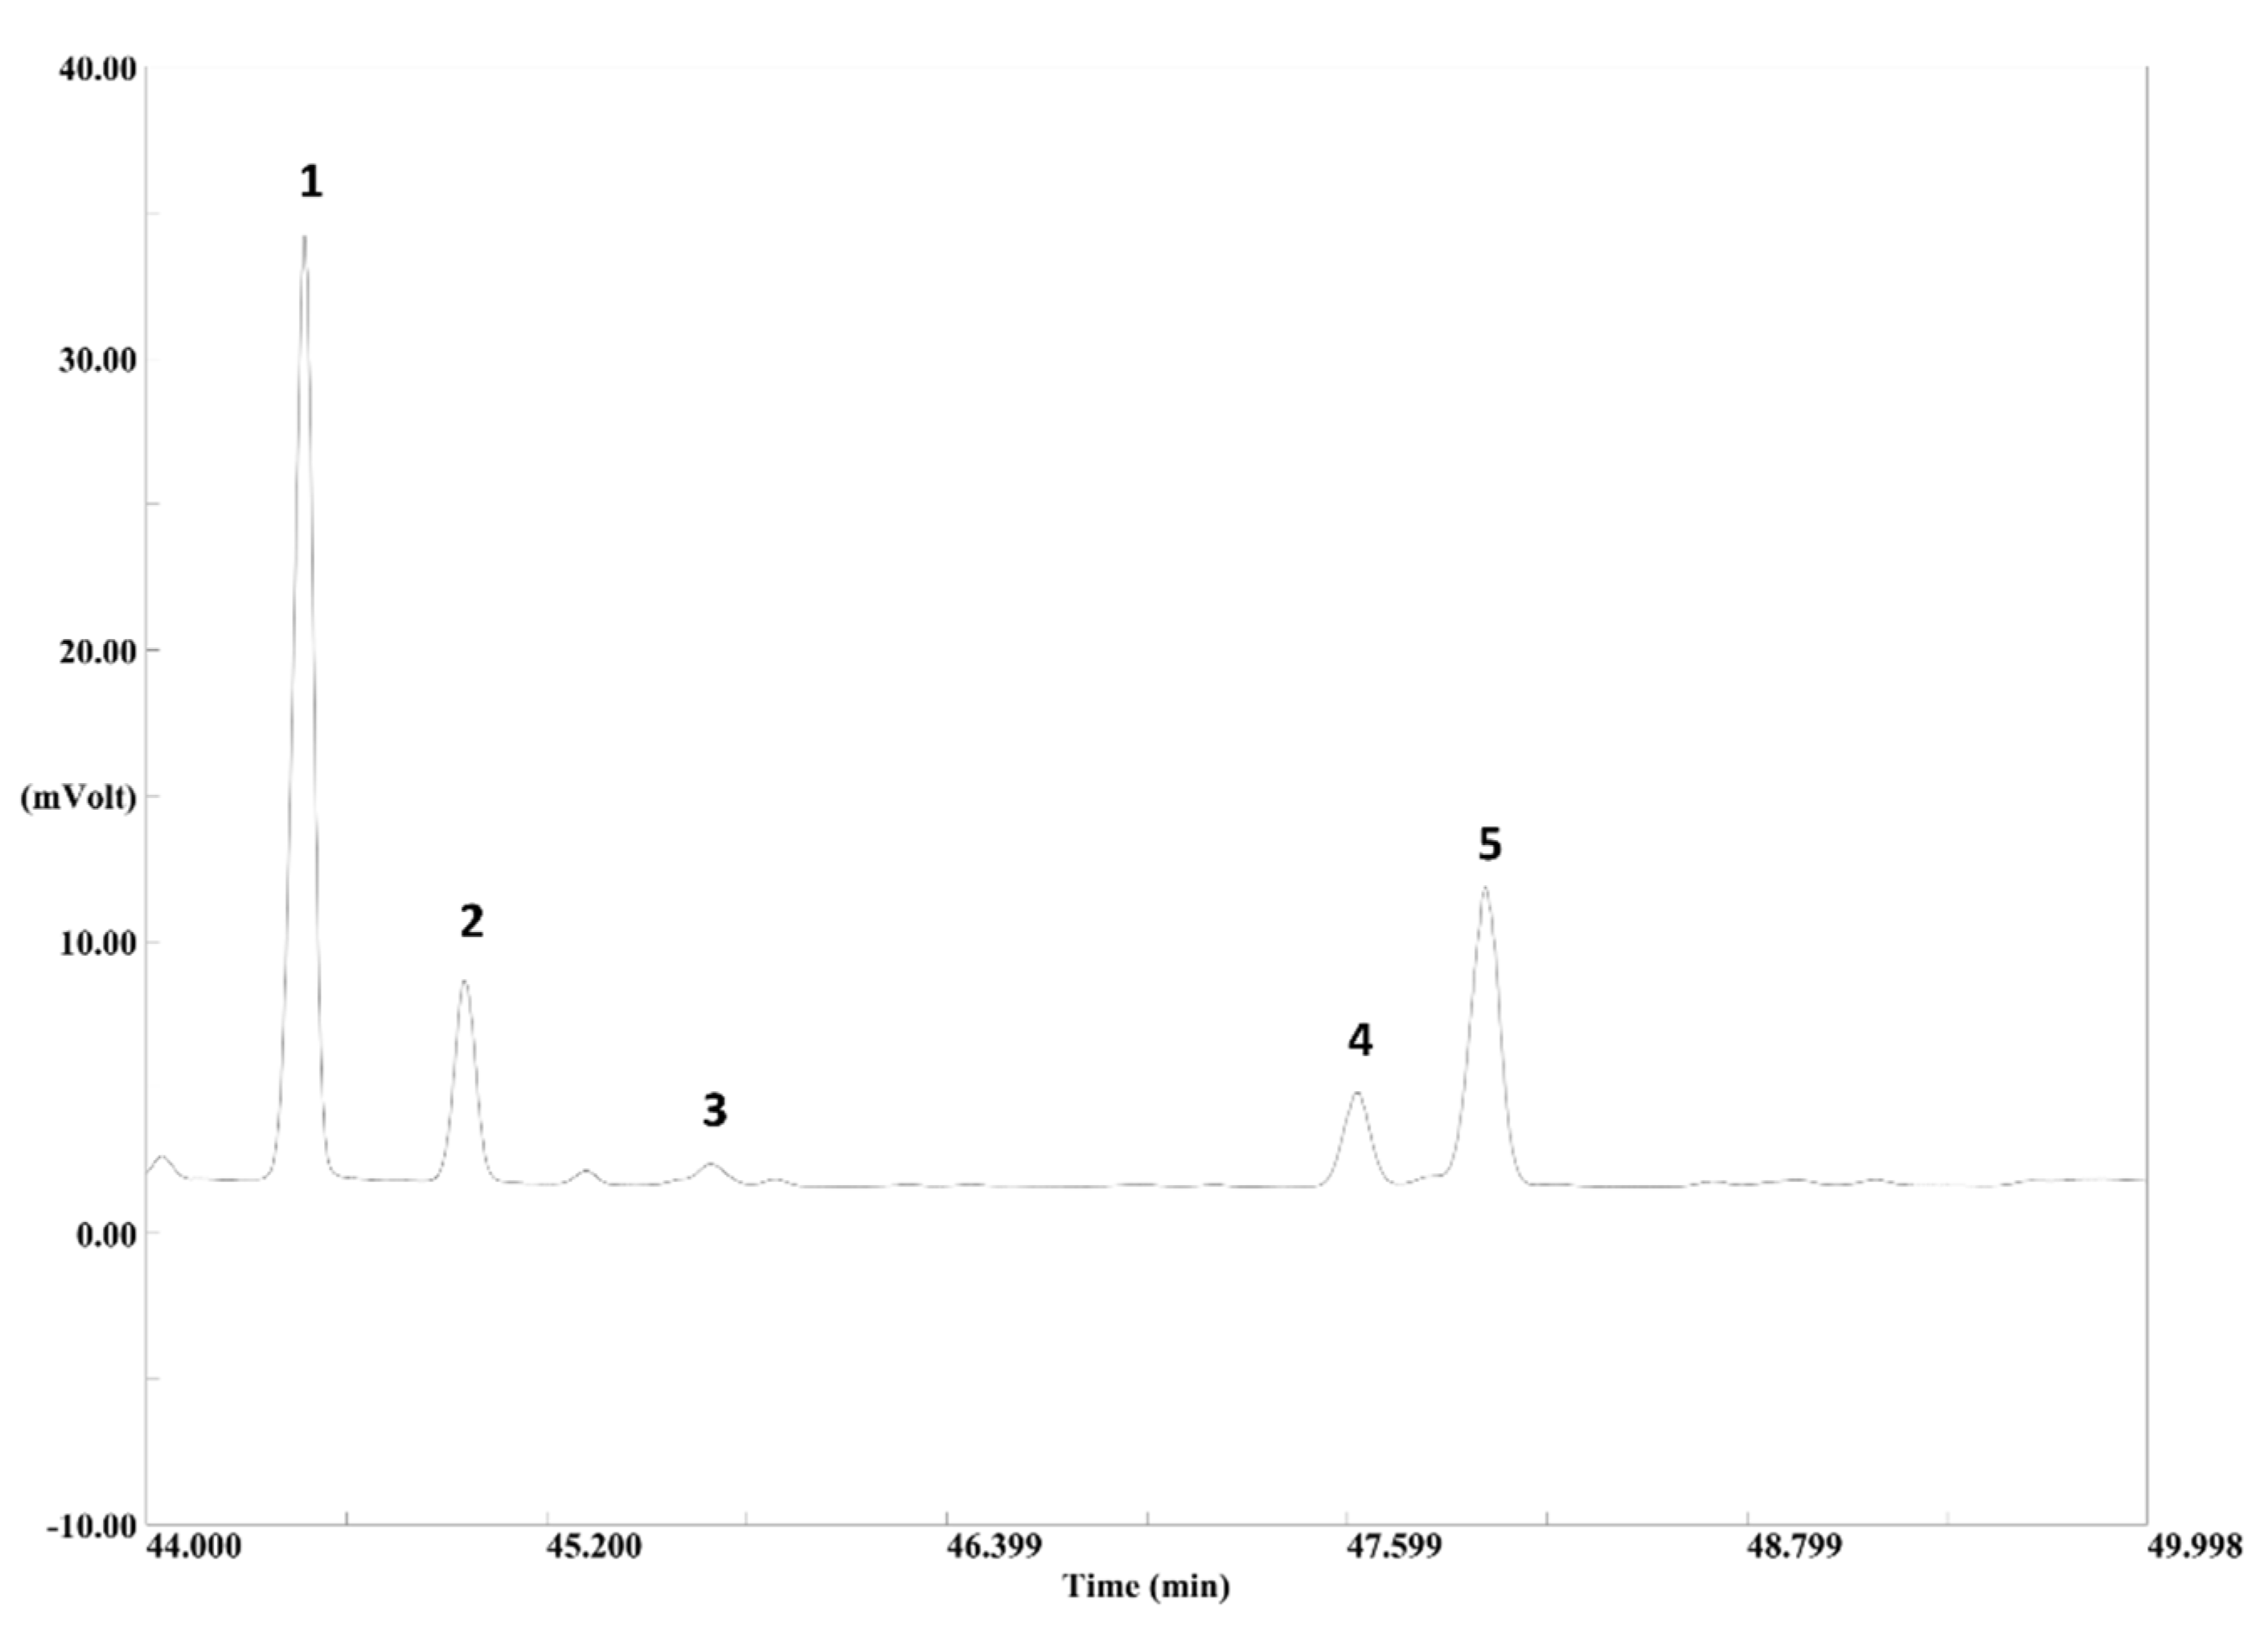
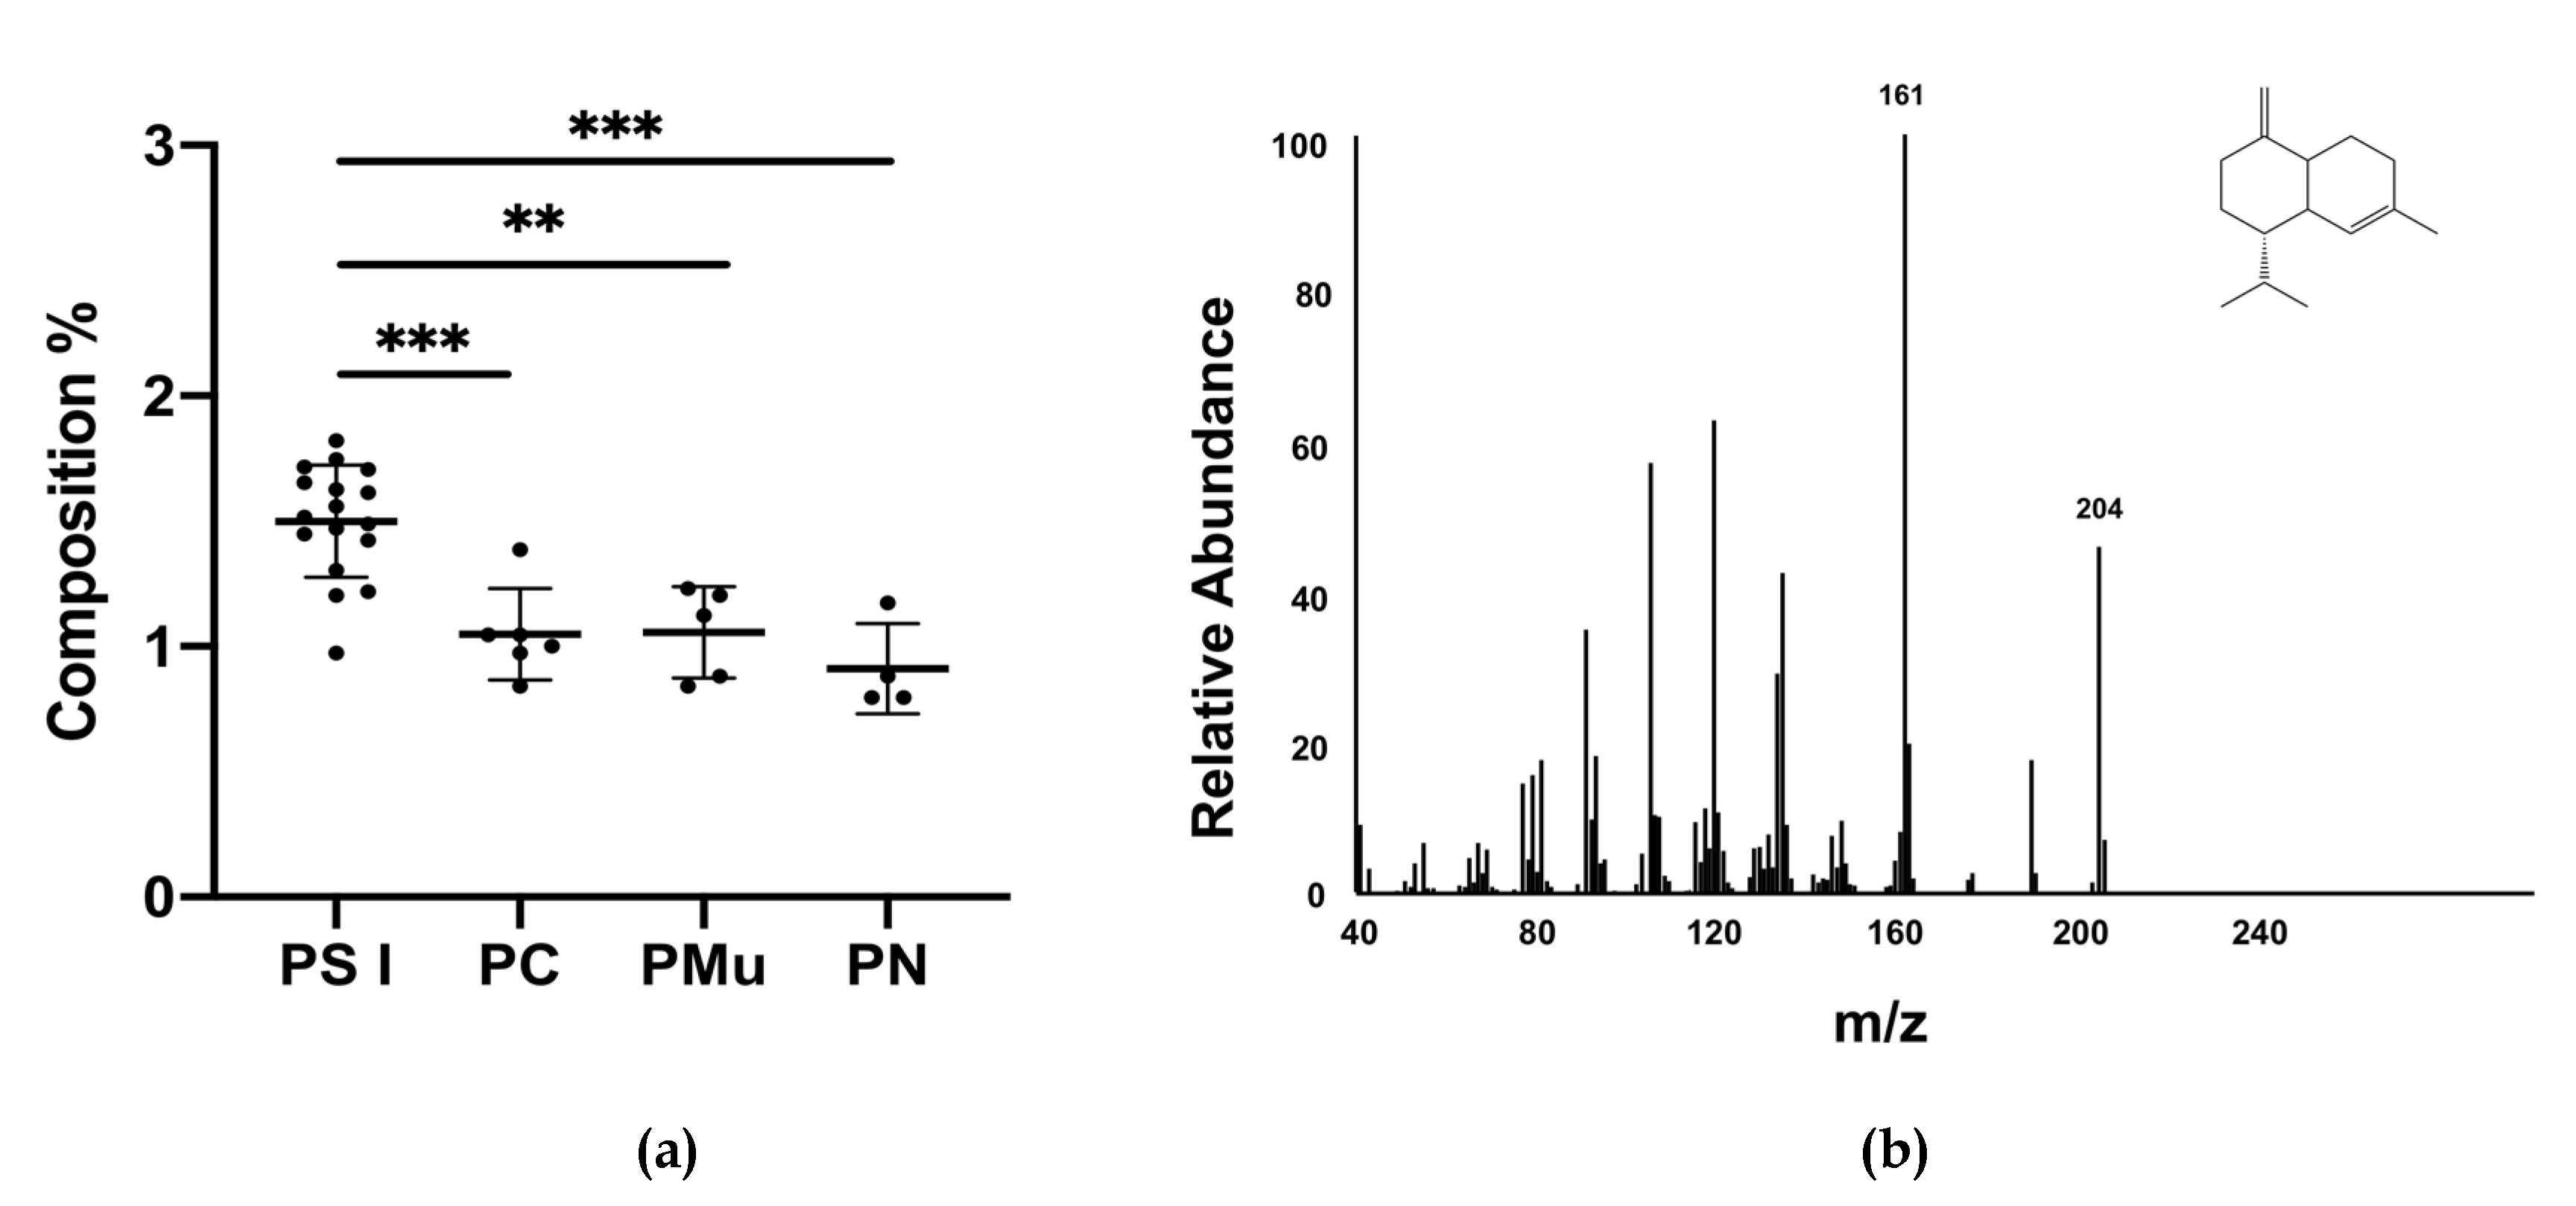
2.1. Chromatographic Profile
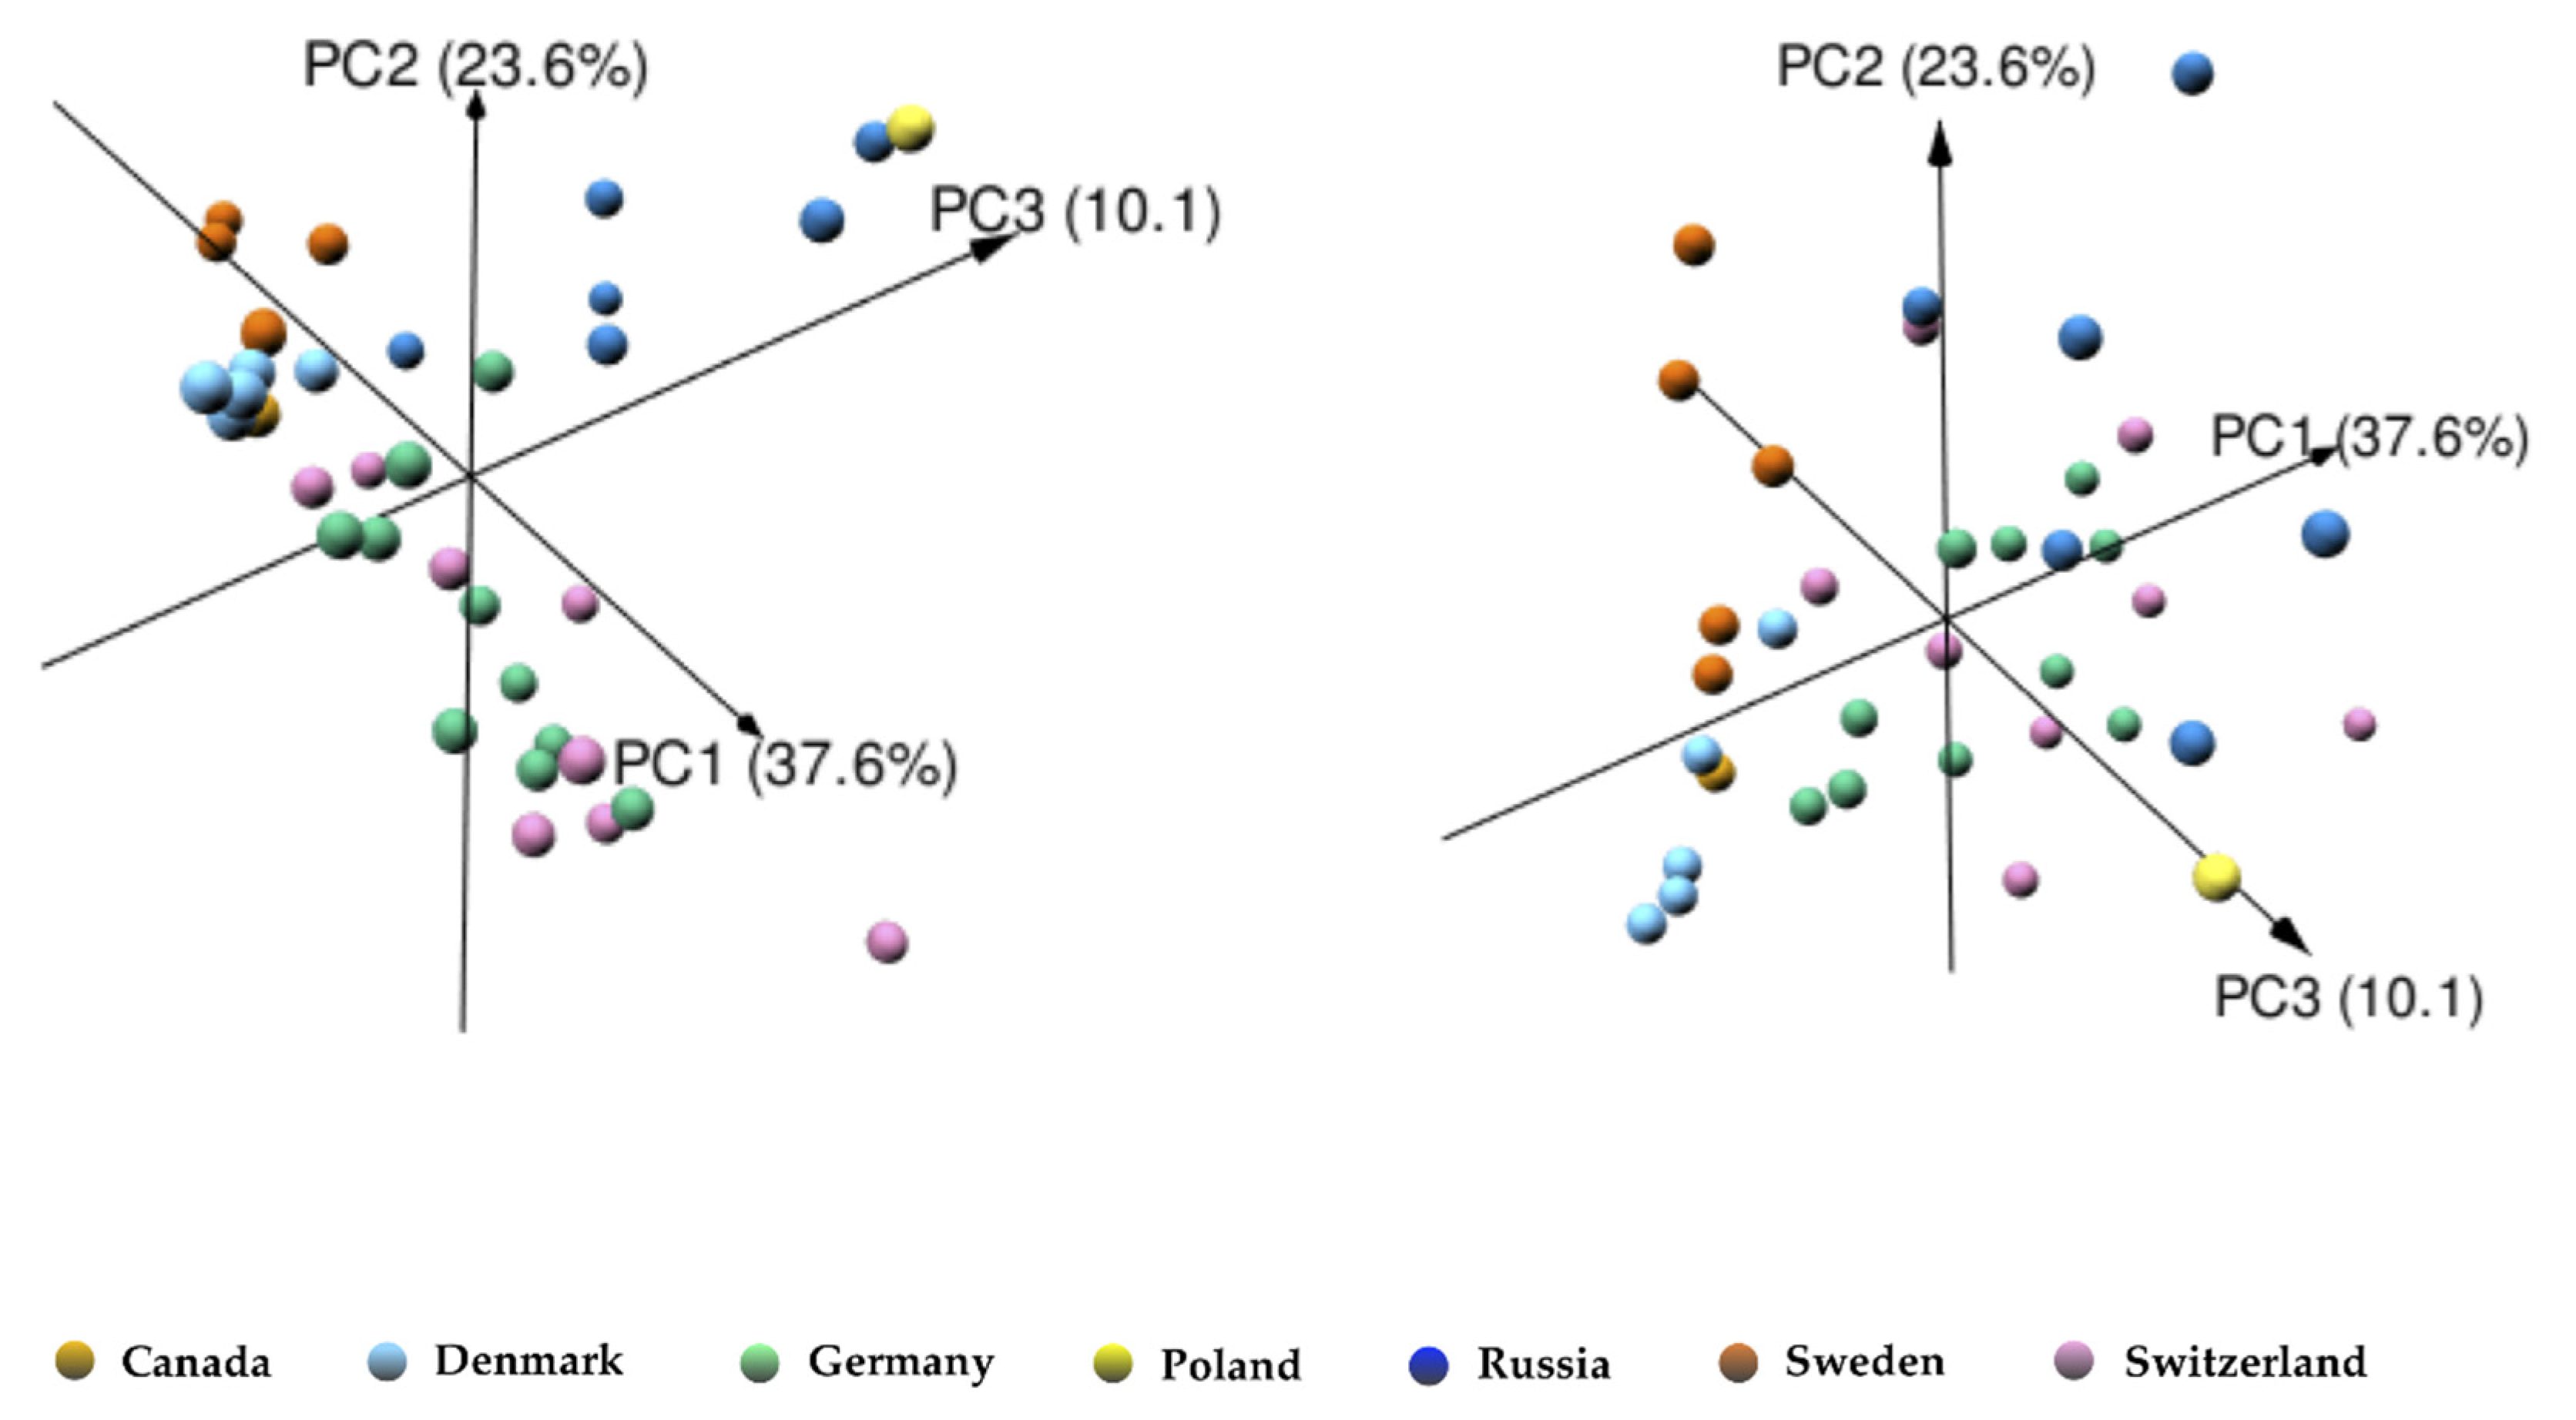
2.2. Geographical Origin
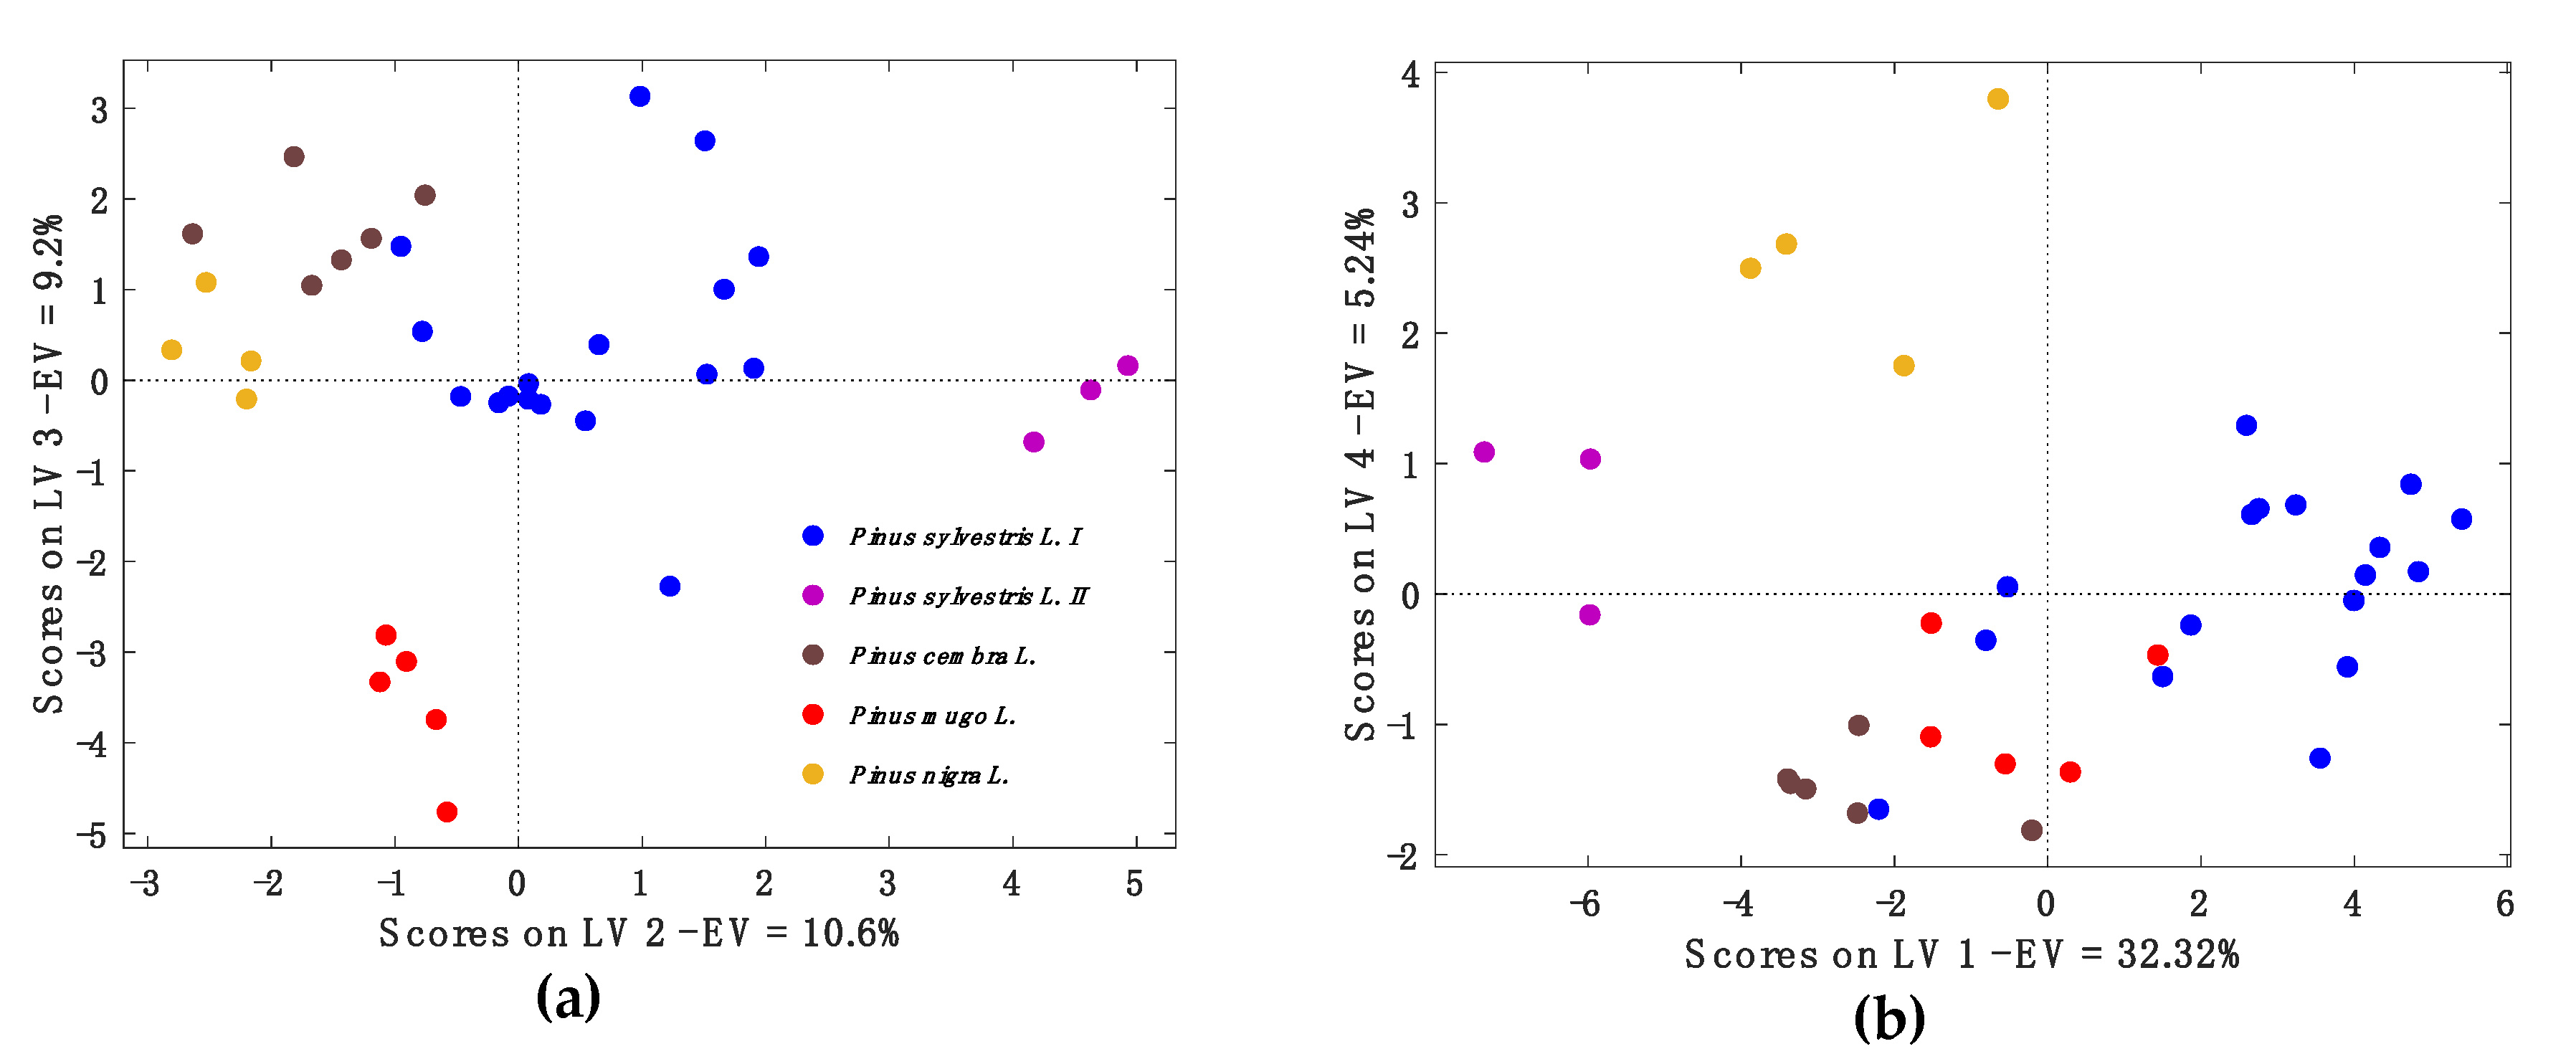
2.3. Classification Model
3. Materials and Methods
3.1. Chemicals and Solvents
3.2. Primary EO of PS, PC, PMu and PN
3.3. GC-FID Analysis for Chromatographic Fingerprint
3.4. GC-MS Analysis for Chromatographic Profile
3.5. Statistical Analysis
4. Conclusions
Supplementary Materials
Author Contributions
Funding
Acknowledgments
Conflicts of Interest
References
- Kurti, F.; Giorgi, A.; Beretta, G.; Mustafa, B.; Gelmini, F.; Testa, C.; Angioletti, S.; Giupponi, L.; Zilio, E.; Pentimalli, D.; et al. Chemical composition, antioxidant and antimicrobial activities of essential oils of different Pinus species from Kosovo. J. Essent. Oil Res. 2019, 31, 263–275. [Google Scholar] [CrossRef]
- Nikolic, B.M.; Mitic, Z.S.; Tesevic, V.V.; Dordevic, I.Z.; Todosijevic, M.M.; Bojovic, S.R.; Marin, P.D. Chemotaxonomic Considerations of the n-Alkane Composition in Pinus heldreichii, P. nigra, and P. peuce. Chem. Biodivers. 2018, 15, e1800161. [Google Scholar] [CrossRef] [PubMed]
- Judzentiene, A.; Kupcinskiene, E. Chemical composition on essential oils from needles of Pinus sylvestris L. grown in northern Lithuania. J. Essent. Oil Res. 2008, 20, 26–29. [Google Scholar] [CrossRef]
- Kubeczka, K.-H.; Schultze, W. Biology and chemistry of conifer oils. Flavour Fragr. J. 1987, 2, 137–148. [Google Scholar] [CrossRef]
- Lis, A.; Lukas, M.; Mellor, K. Comparison of Chemical Composition of the Essential Oils from Different Botanical Organs of Pinus mugo Growing in Poland. Chem. Biodivers. 2019, 16. [Google Scholar] [CrossRef] [PubMed]
- Bouyahya, A.; Belmehdi, O.; Abrini, J.; Dakka, N.; Bakri, Y. Chemical composition of Mentha suaveolens and Pinus halepensis essential oils and their antibacterial and antioxidant activities. Asian Pac. J. Trop. Med. 2019, 12, 117–122. [Google Scholar]
- Fahed, L.; Khoury, M.; Stien, D.; Ouaini, N.; Eparvier, V.; El Beyrouthy, M. Essential Oils Composition and Antimicrobial Activity of Six Conifers Harvested in Lebanon. Chem. Biodivers. 2017, 14. [Google Scholar] [CrossRef]
- Sarac, Z.; Matejic, J.S.; Stojanovic-Radic, Z.Z.; Veselinovic, J.B.; Dzamic, A.M.; Bojovic, S.; Marin, P.D. Biological activity of Pinus nigra terpenes-Evaluation of FtsZ inhibition by selected compounds as contribution to their antimicrobial activity. Comput. Biol. Med. 2014, 54, 72–78. [Google Scholar] [CrossRef]
- Park, J.S.; Lee, G.H. Volatile compounds and antimicrobial and antioxidant activities of the essential oils of the needles of Pinus densiflora and Pinus thunbergii. J. Sci. Food Agric. 2011, 91, 703–709. [Google Scholar] [CrossRef]
- Lee, J.H.; Lee, B.K.; Kim, J.H.; Lee, S.H.; Hong, S.K. Comparison of Chemical Compositions and Antimicrobial Activities of Essential Oils from Three Conifer Trees; Pinus densiflora, Cryptomeria japonica, and Chamaecyparis obtusa. J. Microbiol. Biotechnol. 2009, 19, 391–396. [Google Scholar] [CrossRef]
- Lee, J.H.; Yang, H.Y.; Lee, H.S.; Hong, S.K. Chemical composition and antimicrobial activity of essential oil from cones of Pinus koraiensis. J. Microbiol. Biotechnol. 2008, 18, 497–502. [Google Scholar] [PubMed]
- Pichette, A.; Larouche, P.L.; Lebrun, M.; Legault, J. Composition and antibacterial activity of Abies balsamea essential oil. Phytother. Res. 2006, 20, 371–373. [Google Scholar] [CrossRef] [PubMed]
- Hong, E.J.; Na, K.J.; Choi, I.G.; Choi, K.C.; Jeung, E.B. Antibacterial and antifungal effects of essential oils from coniferous trees. Biol. Pharm. Bull. 2004, 27, 863–866. [Google Scholar] [CrossRef] [PubMed]
- Bundesinstitut Fuer Arzneimittel und Medizinprodukte. Liste der Monographien der E-Kommission (Phyto-Therapie), die im Bundesanzeiger veroeffentlicht sind; Bundesanzeiger Verlagsgesellschaft: Köln, Germany, 1994. [Google Scholar]
- Baser, K.H.C.; Buchbauer, G. Handbook of ESSENTIAL OILS Science, Technology, and Applications, 2nd ed.; CRC Press: Boca Raton, FL, USA, 2016. [Google Scholar]
- Allenspach, M.D.; Valder, C.; Steuer, C. Absolute quantification of terpenes in conifer-derived essential oils and their antibacterial activity. J. Anal. Sci. Technol. 2020, 11. [Google Scholar] [CrossRef]
- Dogan, G.; Bagci, E. Chemical Composition of Essential Oil of Pinus nigra subsp pallasiana (Pinaceae) Twigs, From Different Regions of Turkey. J. Essent. Oil Bear. Plants 2018, 21, 511–519. [Google Scholar] [CrossRef]
- Lis, A.; Kalinowska, A.; Krajewska, A.; Mellor, K. Chemical Composition of the Essential Oils from Different Morphological Parts of Pinus cembra L. Chem. Biodivers. 2017, 14, e1600345. [Google Scholar]
- Thai, T.H.; Hien, N.T.; Ha, C.T.T.; Loc, P.K.; Dai, D.N.; Ogunwande, I.A. Chemical constituents of essential oils from three Vietnamese species of Pinus. Bol. Latinoam. Y Del Caribe De Plantas Med. Y Aromat. 2018, 17, 53–60. [Google Scholar]
- Abdissa, N.; Frese, M.; Sewald, N. Antimicrobial Abietane-Type Diterpenoids from Plectranthus punctatus. Molecules 2017, 22, 1919. [Google Scholar] [CrossRef] [PubMed]
- Fonseca, A.P.; Estrela, F.T.; Moraes, T.S.; Carneiro, L.J.; Bastos, J.K.; dos Santos, R.A.; Ambrosio, S.R.; Martins, C.H.G.; Veneziani, R.C.S. In Vitro Antimicrobial Activity of Plant-Derived Diterpenes against Bovine Mastitis Bacteria. Molecules 2013, 18, 7865–7872. [Google Scholar] [CrossRef] [PubMed]
- Seo, S.; Gomi, K.; Kaku, H.; Abe, H.; Seto, H.; Nakatsu, S.; Neya, M.; Kobayashi, M.; Nakaho, K.; Ichinose, Y.; et al. Identification of Natural Diterpenes that Inhibit Bacterial Wilt Disease in Tobacco, Tomato and Arabidopsis. Plant. Cell Physiol. 2012, 53, 1432–1444. [Google Scholar] [CrossRef]
- Urzua, A.; Rezende, M.C.; Mascayano, C.; Vasquez, L. A structure-activity study of antibacterial diterpenoids. Molecules 2008, 13, 882–891. [Google Scholar] [CrossRef] [PubMed]
- Li, W.H.; Chang, S.T.; Chang, S.C.; Chang, H.T. Isolation of antibacterial diterpenoids from Cryptomeria japonica bark. Nat. Prod. Res. 2008, 22, 1085–1093. [Google Scholar] [CrossRef] [PubMed]
- Kuzma, L.; Rozalski, M.; Walencka, E.; Rozalska, B.; Wysokinska, H. Antimicrobial activity of diterpenoids from hairy roots of Salvia sclarea L.: Salvipisone as a potential anti-biofilm agent active against antibiotic resistant Staphylococci. Phytomedicine 2007, 14, 31–35. [Google Scholar] [CrossRef] [PubMed]
- Urzua, A.; Jara, F.; Tojo, E.; Wilkens, M.; Mendoza, L.; Rezende, M.C. A new antibacterial clerodane diterpenoid from the resinous exudate of Haplopappus uncinatus. J. Ethnopharmacol. 2006, 103, 297–301. [Google Scholar] [CrossRef]
- Becerra, J.; Flores, C.; Mena, J.; Aqueveque, P.; Alarcon, J.; Bittner, M.; Hernandez, V.; Hoeneisen, M.; Ruiz, E.; Silva, M. Antifungal and antibacterial activity of diterpenes isolated from wood extractables of Chilean Podocarpaceae. Bol. De La Soc. Chil. De Quim. 2002, 47, 151–157. [Google Scholar] [CrossRef]
- Velikova, M.; Bankova, V.; Marcucci, M.C.; Tsvetkova, I.; Kujumgiev, A. Chemical composition and biological activity of propolis from Brazilian Meliponinae. Z. Fur Nat. C-A J. Biosci. 2000, 55, 785–789. [Google Scholar] [CrossRef]
- Bankova, V.; Marcucci, M.C.; Simova, S.; Nikolova, N.; Kujumgiev, A.; Popov, S. Antibacterial diterpenic acids from Brazilian propolis. Z. Fur Nat. C-A J. Biosci. 1996, 51, 277–280. [Google Scholar] [CrossRef]
- Feyaerts, A.F.L.; Van Dijck, P. Striking essential oil: Tapping into a largely unexplored source for drug discovery. Sci. Rep. 2020, 10, 2867. [Google Scholar] [CrossRef]
- Islam, M.T.; da Mata, A.M.O.F.; de Aguiar, R.P.S.; Paz, M.F.C.J.; de Alencar, M.V.O.B.; Ferreira, P.M.P.; Melo-Cavalcante, A.A.D. Therapeutic Potential of Essential Oils Focusing on Diterpenes. Phytother. Res. 2016, 30, 1420–1444. [Google Scholar] [CrossRef]
- Gonzalez, M.A. Aromatic abietane diterpenoids: Their biological activity and synthesis. Nat. Prod. Rep. 2015, 32, 684–704. [Google Scholar] [CrossRef]
- Kannaste, A.; Laanisto, L.; Pazouki, L.; Copolovici, L.; Suhorufsenko, M.; Azeem, M.; Toom, L.; Borg-Karlson, A.K.; Niinemets, U. Diterpenoid fingerprints in pine foliage across an environmental and chemotypic matrix: Isoabienol content is a key trait differentiating chemotypes. Phytochemistry 2018, 147, 80–88. [Google Scholar] [CrossRef] [PubMed]
- Gernandt, D.S.; Lopez, G.G.; Garcia, S.O.; Liston, A. Phylogeny and classification of Pinus. Taxon 2005, 54, 29–42. [Google Scholar] [CrossRef]
- EDQM Council of Europe. European Pharmacopoeia (Ph. Eur.), 10th ed.; EDQM Council of Europe: Strasbourg, France, 2020. [Google Scholar]
- Kharbach, M.; Marmouzi, I.; El Jemli, M.; Bouklouze, A.; Vander Heyden, Y. Recent advances in untargeted and targeted approaches applied in herbal-extracts and essential-oils fingerprinting-A review. J. Pharm. Biomed. Anal. 2020, 177, 112849. [Google Scholar] [CrossRef] [PubMed]
- Sanli, A.; Karadogan, T. Geographical Impact on Essential Oil Composition of Endemic Kundmannia Anatolica Hub.-Mor. (Apiaceae). Afr J. Tradit Complement. Altern Med. 2017, 14, 131–137. [Google Scholar] [CrossRef]
- Zouari, N.; Ayadi, I.; Fakhfakh, N.; Rebai, A.; Zouari, S. Variation of chemical composition of essential oils in wild populations of Thymus algeriensis Boiss. et Reut., a North African endemic species. Lipids Health Dis. 2012, 11, 28. [Google Scholar] [CrossRef]
- US Food and Drug Administration. FDA Guidance for Industry-Botancial Drug Products (Draft Guidance); US Food and Drug Administration: Rockville, WA, USA, 2000.
- World Health Organization. Guidelines for the assessment of herbal medicines; (No. WHO/TRM/91.4. Unpublished); World Health Organization: Geneva, Switzerland, 1991. [Google Scholar]
- Li, Y.; Shen, Y.; Yao, C.L.; Guo, D.A. Quality assessment of herbal medicines based on chemical fingerprints combined with chemometrics approach: A review. J. Pharm. Biomed. Anal. 2020, 185, 113215. [Google Scholar] [CrossRef]
- Chapman, J.; Truong, V.K.; Elbourne, A.; Gangadoo, S.; Cheeseman, S.; Rajapaksha, P.; Latham, K.; Crawford, R.J.; Cozzolino, D. Combining Chemometrics and Sensors: Toward New Applications in Monitoring and Environmental Analysis. Chem. Rev. 2020. [Google Scholar] [CrossRef]
- Li, P.; Zeng, S.L.; Duan, L.; Ma, X.D.; Dou, L.L.; Wang, L.J.; Li, P.; Bi, Z.M.; Liu, E.H. Comparison of Aurantii Fructus Immaturus and Aurantii Fructus based on multiple chromatographic analysis and chemometrics methods. J. Chromatogr. A 2016, 1469, 96–107. [Google Scholar] [CrossRef]
- Lafhal, S.; Vanloot, P.; Bombarda, I.; Kister, J.; Dupuy, N. Chemometric analysis of French lavender and lavandin essential oils by near infrared spectroscopy. Ind. Crop. Prod. 2016, 80, 156–164. [Google Scholar] [CrossRef]
- Hu, Y.C.; Kong, W.J.; Yang, X.H.; Xie, L.W.; Wen, J.; Yang, M.H. GC-MS combined with chemometric techniques for the quality control and original discrimination of Curcumae longae rhizome: Analysis of essential oils. J. Sep. Sci. 2014, 37, 404–411. [Google Scholar] [CrossRef]
- Wong, K.H.; Razmovski-Naumovski, V.; Li, K.M.; Li, G.Q.; Chan, K. Differentiation of Pueraria lobata and Pueraria thomsonii using partial least square discriminant analysis (PLS-DA). J. Pharm. Biomed. Anal. 2013, 84, 5–13. [Google Scholar] [CrossRef] [PubMed]
- Hiltunen, R. Variation and inheritance of some monoterpenes in Pinus sylvestris. Planta Med. 1975, 28, 315–323. [Google Scholar] [CrossRef] [PubMed]
- Smith, R.H. Xylem Monoterpenes of Pines: Distribution, Variation, Genetics, Function; Pacific Southwest Research Station: Berkeley, CA, USA, 2000.
- Azemard, C.; Menager, M.; Vieillescazes, C. Analysis of diterpenic compounds by GC-MS/MS: Contribution to the identification of main conifer resins. Anal. Bioanal. Chem. 2016, 408, 6599–6612. [Google Scholar] [CrossRef] [PubMed]
- Zerbe, P.; Chiang, A.; Yuen, M.; Hamberger, B.; Hamberger, B.; Draper, J.A.; Britton, R.; Bohlmann, J. Bifunctional cis-Abienol Synthase from Abies balsamea Discovered by Transcriptome Sequencing and Its Implications for Diterpenoid Fragrance Production. J. Biol. Chem. 2012, 287, 12121–12131. [Google Scholar] [CrossRef]
- Sallaud, C.; Giacalone, C.; Topfer, R.; Goepfert, S.; Bakaher, N.; Rosti, S.; Tissier, A. Characterization of two genes for the biosynthesis of the labdane diterpene Z-abienol in tobacco (Nicotiana tabacum) glandular trichomes. Plant. J. 2012, 72, 1–17. [Google Scholar] [CrossRef]
- Adams, R.P.; Beauchamp, P.S.; Dev, V.; Bathala, R.M. The Leaf Essential Oils of Juniperus communis L. Varieties in North America and the NMR and MS Data for Isoabienol. J. Essent. Oil Res. 2010, 22, 23–28. [Google Scholar] [CrossRef]
- Domenech-Carbo, M.T.; de la Cruz-Canizares, J.; Osete-Cortina, L.; Domenech-Carbo, A.; David, H. Ageing behaviour and analytical characterization of the Jatoba resin collected from Hymenaea stigonocarpa Mart. Int. J. Mass Spectrom. 2009, 284, 81–92. [Google Scholar] [CrossRef]
- Ding, L.X.; Zhao, M.; Xie, J.; Xu, G. Quantification of cis-Abienol in Oriental Tobacco Leaves by LC. Chromatographia 2007, 66, 520–532. [Google Scholar] [CrossRef]
- Vlad, P.F.K.; Khariton, K.S.; Koltsa, M.N.; Bordakh, O.D. Mass-spectrometric investigation of the abienols—Diterpene alcohols. Chem. Nat. Compd. 1974, 10, 24–28. [Google Scholar] [CrossRef]
- Amorello, D.; Orecchio, S.; Pace, A.; Barreca, S. Discrimination of almonds (Prunus dulcis) geographical origin by minerals and fatty acids profiling. Nat. Prod. Res. 2016, 30, 2107–2110. [Google Scholar] [CrossRef]
- Ivosev, G.; Burton, L.; Bonner, R. Dimensionality reduction and visualization in principal component analysis. Anal. Chem. 2008, 80, 4933–4944. [Google Scholar] [CrossRef] [PubMed]
- Adams, R.P. Identification of Essential Oil Components by Gas. Chromatography/Mass Spectrometry, 4th ed.; Allured Publishing Corporation: Carol Stream, IL, USA, 2007. [Google Scholar]
- Ballabio, D.; Consonni, V. Classification tools in chemistry. Part 1: Linear models. PLS-DA. Anal. Methods 2013, 5, 3790–3798. [Google Scholar] [CrossRef]
- Wold, S.; Sjostrom, M.; Eriksson, L. PLS-regression: A basic tool of chemometrics. Chemom. Intell. Lab. Syst. 2001, 58, 109–130. [Google Scholar] [CrossRef]
- Slosse, A.; Van Durme, F.; Samyn, N.; Mangelings, D.; Vander Heyden, Y. Evaluation of data preprocessings for the comparison of GC-MS chemical profiles of seized cannabis samples. Forensic. Sci. Int. 2020, 310, 110228. [Google Scholar] [CrossRef]
- Ballabio, D.; Grisoni, F.; Todeschini, R. Multivariate comparison of classification performance measures. Chemom. Intell. Lab. Syst. 2018, 174, 33–44. [Google Scholar] [CrossRef]
- Stein, S.M.; Mirokhin, D.; Tchekhovskoi, D.; Mallard, G.; Mikaia, A.; Zaikin, V.; Clifton, C. The NIST Mass Spectral Search Program for the NIST/EPA/NIH Mass Spectra Library; National Institute of Standards and Technology: Gaithersburg, MD, USA, 2002.
- Vandendool, H.; Kratz, P.D. A Generalization of the Retention Index System Including Linear Temperature Programmed Gas-Liquid Partition Chromatography. J. Chromatogr. 1963, 11, 463–471. [Google Scholar] [CrossRef]
Sample Availability: Samples of the compounds are not available from the authors. |


| Compounds | RI lit | RI cal | RSI | 1 | 2 | 3 | 4 | 5 | 6 | 7 | 8 | 9 | 10 | 11 | 12 | 13 | 14 | 15 | 16 | 17 | 18 | 19 | 20 | 21 | 37 | 44 | 53 |
|---|---|---|---|---|---|---|---|---|---|---|---|---|---|---|---|---|---|---|---|---|---|---|---|---|---|---|---|
| Monoterpene Hydrocarbons | |||||||||||||||||||||||||||
| Tricyclene | 1007 | 1013 | 932 | - | 0.6 | - | - | - | 1.1 | 0.4 | 0.9 | 0.6 | 0.4 | 0.4 | 0.9 | 0.8 | 1.2 | 0.2 | 0.4 | 3.1 | 0.8 | 0.4 | 0.5 | 0.4 | - | 0.7 | 0.2 |
| α-Pinene | 1026 | 1023 | 943 | 65.3 | 29.3 | 7.5 | 4.8 | 7.0 | 40.3 | 30.2 | 45.2 | 15.9 | 39.9 | 26.2 | 25.4 | 29.8 | 30.6 | 23.0 | 12.3 | 26.3 | 34.4 | 27.8 | 29.8 | 21.9 | 51.9 | 19.5 | 53.2 |
| Camphene | 1040 | 1065 | 959 | 1.3 | 3.3 | 0.6 | - | - | 6.3 | 1.4 | 4.0 | 2.3 | 1.8 | 1.6 | 3.8 | 3.6 | 5.0 | 1.1 | 1.9 | 1.4 | 4.2 | 2.0 | 2.8 | 2.1 | 0.8 | 2.6 | 1.2 |
| β-Pinene | 1114 | 1117 | 944 | 2.5 | 6.2 | 38.4 | 2.7 | 20.6 | 3.0 | 1.0 | 2.9 | 1.2 | 31.2 | 5.6 | 10.6 | 8.5 | 15.5 | 1.6 | 1.4 | 3.0 | 6.8 | 2.0 | 16.1 | 6.3 | 9.8 | 5.2 | 25.4 |
| Sabinene | 1110 | 1122 | 841 | - | 1.3 | 0.7 | 3.3 | 8.3 | 1.0 | 1.1 | 0.5 | 1.0 | - | 0.9 | 0.6 | 0.7 | 0.9 | 1.4 | 1.3 | 1.3 | 0.7 | - | - | 0.3 | 0.4 | 0.7 | 0.2 |
| 3-Carene | 1135 | 1147 | 944 | - | 37.8 | 7.0 | - | - | 18.1 | 33.9 | 15.3 | 33.5 | - | 32.2 | 12.5 | 20.7 | 17.9 | 47.0 | 47.9 | 25.3 | 10.7 | - | - | - | - | 0.2 | - |
| β-Myrcene | 1155 | 1160 | 937 | 1.9 | 2.6 | 1.6 | 1.1 | - | 7.8 | 1.9 | 1.7 | 2.2 | 10.7 | 1.9 | 1.9 | 1.9 | 3.5 | 2.6 | 4.3 | 3.7 | 8.6 | 10.2 | 6.7 | 7.3 | 1.5 | 26.3 | 1.0 |
| Limonene | 1205 | 1202 | 908 | 14.3 | 0.7 | 2.7 | 12.6 | 2.1 | 0.8 | 0.5 | 0.7 | 4.7 | 3.4 | 0.5 | 1.9 | 0.5 | 0.6 | 0.6 | 0.5 | 7.7 | 6.5 | 13.9 | 7.8 | 6.7 | 2.4 | 14.9 | 3.3 |
| β-Phellandrene | 1183 | 1208 | 946 | 4.0 | 4.1 | 33.6 | 56.2 | 46.4 | 8.7 | 2.1 | 0.3 | 0.4 | 1.0 | 2.2 | 2.6 | 0.4 | 1.8 | 5.5 | 4.4 | 9.5 | 4.1 | 2.7 | 3.5 | 4.7 | 22.4 | 9.6 | 0.9 |
| p-Cymene | 1253 | 1265 | 885 | - | 1.5 | - | - | - | 2.0 | 0.3 | 0.4 | 2.7 | 0.8 | 1.2 | 0.8 | 0.9 | 0.4 | 0.9 | 0.9 | 0.2 | 0.1 | 0.5 | 0.3 | 0.3 | - | 0.5 | 0.4 |
| Terpinolene | 1271 | 1279 | 924 | - | 3.4 | 0.8 | 7.5 | 8.7 | 2.1 | 2.9 | 1.8 | 2.7 | - | 3.0 | 1.3 | 2.0 | 1.6 | 4.5 | 4.8 | 0.8 | 0.1 | - | 0.2 | - | 0.2 | 1.1 | 0.3 |
| Oxygenated Monoterpenes | |||||||||||||||||||||||||||
| Bornyl acetate | 1554 | 1571 | 941 | - | - | - | - | - | 3.4 | 0.3 | 0.5 | 0.3 | - | 0.3 | 0.3 | 1.9 | 4.4 | 0.3 | 0.6 | 1.3 | 3.9 | 3.5 | 2.8 | 2.7 | 0.2 | 0.9 | 0.6 |
| α-Terpineol | 1675 | 1674 | 875 | - | - | - | - | - | - | - | 0.5 | 0.7 | - | 0.6 | 0.2 | - | - | 0.5 | 0.2 | 0.3 | 0.3 | 0.3 | 0.3 | 0.4 | - | 0.3 | 0.1 |
| Sesquiterpene Hydrocarbons | |||||||||||||||||||||||||||
| Longipinene | 1539 | 1454 | 906 | - | - | - | - | - | - | - | - | - | - | - | - | - | - | - | - | 0.8 | 0.1 | - | 0.2 | - | - | - | - |
| Copaene | 1493 | 1479 | 944 | - | - | - | - | - | - | - | 0.3 | 0.5 | - | 0.3 | 0.3 | 0.2 | - | - | 0.2 | - | 0.2 | 0.3 | 0.1 | 0.2 | - | - | 0.2 |
| Longifolene | 1590 | 1548 | 914 | - | - | - | - | - | - | - | 0.3 | - | - | - | - | - | - | - | - | 0.3 | 0.2 | - | - | - | - | - | - |
| β-Caryophyllene | 1597 | 1585 | 950 | - | 0.6 | - | - | - | 0.7 | 5.7 | 4.8 | 2.8 | 2.0 | 2.3 | 3.3 | 2.1 | 1.7 | 1.3 | 1.2 | 1.8 | 0.9 | 1.9 | 0.9 | 0.8 | 0.3 | 3.0 | 1.9 |
| Guaia-6,9-diene | - | 1596 | 881 | - | - | 3.7 | 3.9 | 7.0 | - | - | - | - | - | - | - | - | - | - | - | - | - | - | - | - | - | - | - |
| α-Humulene | 1671 | 1653 | 917 | - | - | - | - | - | - | 0.9 | 0.8 | 0.5 | 0.3 | 0.5 | 0.6 | 0.3 | 0.4 | 0.3 | 0.2 | 0.5 | 0.4 | 0.3 | 0.2 | 0.3 | 0.3 | 0.6 | 0.4 |
| γ-Muurulene | 1692 | 1678 | 936 | - | - | - | - | - | - | 0.2 | 0.6 | 0.7 | - | 0.5 | 0.5 | 0.4 | 0.1 | 0.1 | 0.2 | - | 0.3 | - | 0.3 | 0.3 | - | 0.3 | 0.2 |
| Germacrene d | 1693 | 1697 | 945 | - | 0.6 | - | - | - | - | 2.2 | 3.4 | 2.7 | 1.4 | 1.7 | 2.3 | 1.2 | 1.1 | 0.3 | 0.4 | 0.3 | 0.7 | 1.2 | 1.8 | 1.8 | 6.8 | 4.0 | 8.9 |
| β-Selinene | 1717 | 1704 | 937 | - | - | - | - | - | - | 0.3 | 0.8 | 0.8 | 0.2 | 0.8 | 0.7 | 0.6 | 0.1 | 0.2 | 0.4 | 0.2 | 0.3 | - | 0.4 | 0.2 | - | - | - |
| α-Selinene | 1703 | 1710 | 925 | - | - | - | - | - | - | 0.4 | 0.7 | 0.7 | - | 0.8 | 0.6 | 0.6 | 0.2 | 0.3 | 0.3 | 0.3 | 0.3 | - | 0.3 | 0.2 | - | 0.6 | - |
| α-Muurolene | 1727 | 1715 | 944 | - | 0.8 | - | - | - | - | 0.5 | 0.6 | 1.1 | 0.3 | 0.9 | 1.1 | 0.7 | 0.3 | 0.2 | 0.4 | 0.3 | 0.6 | 0.8 | 0.7 | 0.6 | - | - | - |
| Bicyclogermacrene | 1735 | 1720 | 932 | 1.0 | 0.8 | - | - | - | - | 2.0 | 1.9 | 1.2 | 0.7 | 2.5 | 3.4 | 2.9 | 2.8 | 0.8 | 1.1 | 0.3 | 0.2 | 1.6 | 1.6 | 1.1 | 0.9 | 1.0 | 0.1 |
| γ-Cadinene | 1765 | 1749 | 903 | 2.1 | 1.9 | - | 3.0 | 0.9 | 4.7 | 6.8 | 12.2 | 2.9 | 7.5 | 10.2 | 8.6 | 2.9 | 1.5 | 3.4 | 2.0 | 2.2 | 8.7 | 5.3 | 4.1 | 1.0 | 2.1 | 0.6 | |
| Oxygenated Sesquiterpenes | |||||||||||||||||||||||||||
| Cubebol | 1957 | 2040 | 924 | - | - | - | - | - | - | - | 0.3 | 0.7 | - | 0.4 | 0.6 | 0.5 | 0.1 | 0.2 | 1.2 | 0.6 | 0.7 | 1.3 | 0.8 | 0.9 | - | - | - |
| Germacrene-d-4-ol | 2018 | 2072 | 929 | 1.7 | 1.4 | - | - | - | 0.8 | 4.7 | 1.8 | 4.5 | 2.2 | 2.1 | 7.6 | 5.1 | 3.6 | 1.5 | 2.6 | 2.6 | 2.0 | 10.4 | 8.8 | 11.3 | 1.0 | 0.3 | 0.1 |
| Spathulenol | 2151 | 2114 | 916 | - | 0.3 | - | - | - | - | - | - | - | - | - | 0.2 | 0.3 | 0.2 | 0.3 | 0.6 | 1.1 | 1.4 | 0.4 | 0.9 | 1.1 | - | - | - |
| τ-Cadinol | 2169 | 2285 | 896 | - | 0.5 | - | - | - | - | - | 0.2 | 0.3 | - | 0.2 | 0.6 | 0.5 | 0.2 | 0.2 | 0.7 | 0.5 | 0.4 | 1.0 | 0.9 | 1.2 | - | 0.2 | - |
| τ-Muurolol | 2186 | 2177 | 926 | - | 0.6 | - | - | - | 0.4 | 0.3 | 0.2 | 0.4 | - | 0.2 | 0.7 | 0.6 | 0.3 | 0.2 | 0.7 | 0.5 | 0.5 | 1.0 | 0.1 | 1.1 | - | 0.3 | - |
| α-Cadinol | 2226 | 2222 | 925 | 1.1 | 1.5 | - | - | - | 1.2 | 0.6 | 0.3 | 0.6 | 0.3 | 0.3 | 1.4 | 1.2 | 0.9 | 0.4 | 1.2 | 1.2 | 1.0 | 2.0 | 1.8 | 2.6 | 0.2 | 0.7 | 0.1 |
| Oplapanone | 2545 | - | 955 | - | - | - | - | - | - | - | - | - | - | - | - | - | - | - | - | 0.3 | 0.9 | - | 0.2 | 0.9 | - | - | - |
| Oxygenated Diterpenes | |||||||||||||||||||||||||||
| Manool oxide | 2348 | - | 920 | - | - | - | - | - | - | 0.3 | - | - | - | - | - | - | - | - | - | 1.8 | - | 0.6 | - | 0.3 | - | - | - |
| Isoabienol | 2606 | 2727 | - | 4.8 | - | - | - | - | 0.9 | - | - | - | - | - | - | - | - | - | 0.5 | 0.6 | - | - | 12.6 | - | - | 0.1 | |
| Sandaracopimaral | 2786 | 2744 | 905 | - | - | - | - | - | - | - | - | - | - | - | - | - | 0.4 | 0.6 | - | - | 0.3 | 0.1 | 0.2 | - | - | - | |
| cis-Abienol | - | - | - | - | - | - | - | - | - | - | - | - | - | - | - | - | - | - | - | - | - | - | - | 0.2 | - | - | - |
| Palustral | 2850 | 2845 | 907 | - | - | - | - | - | - | - | - | - | - | - | - | - | - | - | - | 0.3 | - | 0.4 | 0.1 | - | - | 0.3 | - |
| Isopimaral | - | 2857 | 904 | - | - | 1.1 | - | - | - | - | - | - | - | - | - | - | 0.1 | 0.3 | 0.7 | - | - | 0.4 | 0.3 | 0.3 | - | 0.2 | - |
| Parameter | Class | Cross-Validation | Bootstrap | Random Resampling |
|---|---|---|---|---|
| Sn | PS I | 0.94 | 0.91 | 0.93 |
| PS II | 1.00 | 0.90 | 0.99 | |
| PC | 1.00 | 0.93 | 0.92 | |
| PMu | 0.75 | 0.75 | 0.80 | |
| PN | 1.00 | 0.95 | 0.98 | |
| Sp | PS I | 0.94 | 0.91 | 0.92 |
| PS II | 1.00 | 1.00 | 1.00 | |
| PC | 0.96 | 0.96 | 0.98 | |
| PMu | 1.00 | 0.97 | 0.98 | |
| PN | 1.00 | 1.00 | 1.00 | |
| NER | - | 0.94 | 0.89 | 0.93 |
| n.a. | - | 0.06 | 0.17 | 0.10 |
© 2020 by the authors. Licensee MDPI, Basel, Switzerland. This article is an open access article distributed under the terms and conditions of the Creative Commons Attribution (CC BY) license (http://creativecommons.org/licenses/by/4.0/).
Share and Cite
Allenspach, M.; Valder, C.; Flamm, D.; Grisoni, F.; Steuer, C. Verification of Chromatographic Profile of Primary Essential Oil of Pinus sylvestris L. Combined with Chemometric Analysis. Molecules 2020, 25, 2973. https://doi.org/10.3390/molecules25132973
Allenspach M, Valder C, Flamm D, Grisoni F, Steuer C. Verification of Chromatographic Profile of Primary Essential Oil of Pinus sylvestris L. Combined with Chemometric Analysis. Molecules. 2020; 25(13):2973. https://doi.org/10.3390/molecules25132973
Chicago/Turabian StyleAllenspach, Martina, Claudia Valder, Daniela Flamm, Francesca Grisoni, and Christian Steuer. 2020. "Verification of Chromatographic Profile of Primary Essential Oil of Pinus sylvestris L. Combined with Chemometric Analysis" Molecules 25, no. 13: 2973. https://doi.org/10.3390/molecules25132973
APA StyleAllenspach, M., Valder, C., Flamm, D., Grisoni, F., & Steuer, C. (2020). Verification of Chromatographic Profile of Primary Essential Oil of Pinus sylvestris L. Combined with Chemometric Analysis. Molecules, 25(13), 2973. https://doi.org/10.3390/molecules25132973