
Experimental Data Based Machine Learning Classification Models with Predictive Ability to Select in Vitro Active Antiviral and Non-Toxic Essential Oils

 ,
,  ,
, 
 , , , and
Abstract
:
1. Introduction
2. Results and Discussion
2.1. EOs’ Cytotoxic and Antiviral Effects
2.2. Machine Learning Modeling
2.2.1. Unsupervised Data Analysis
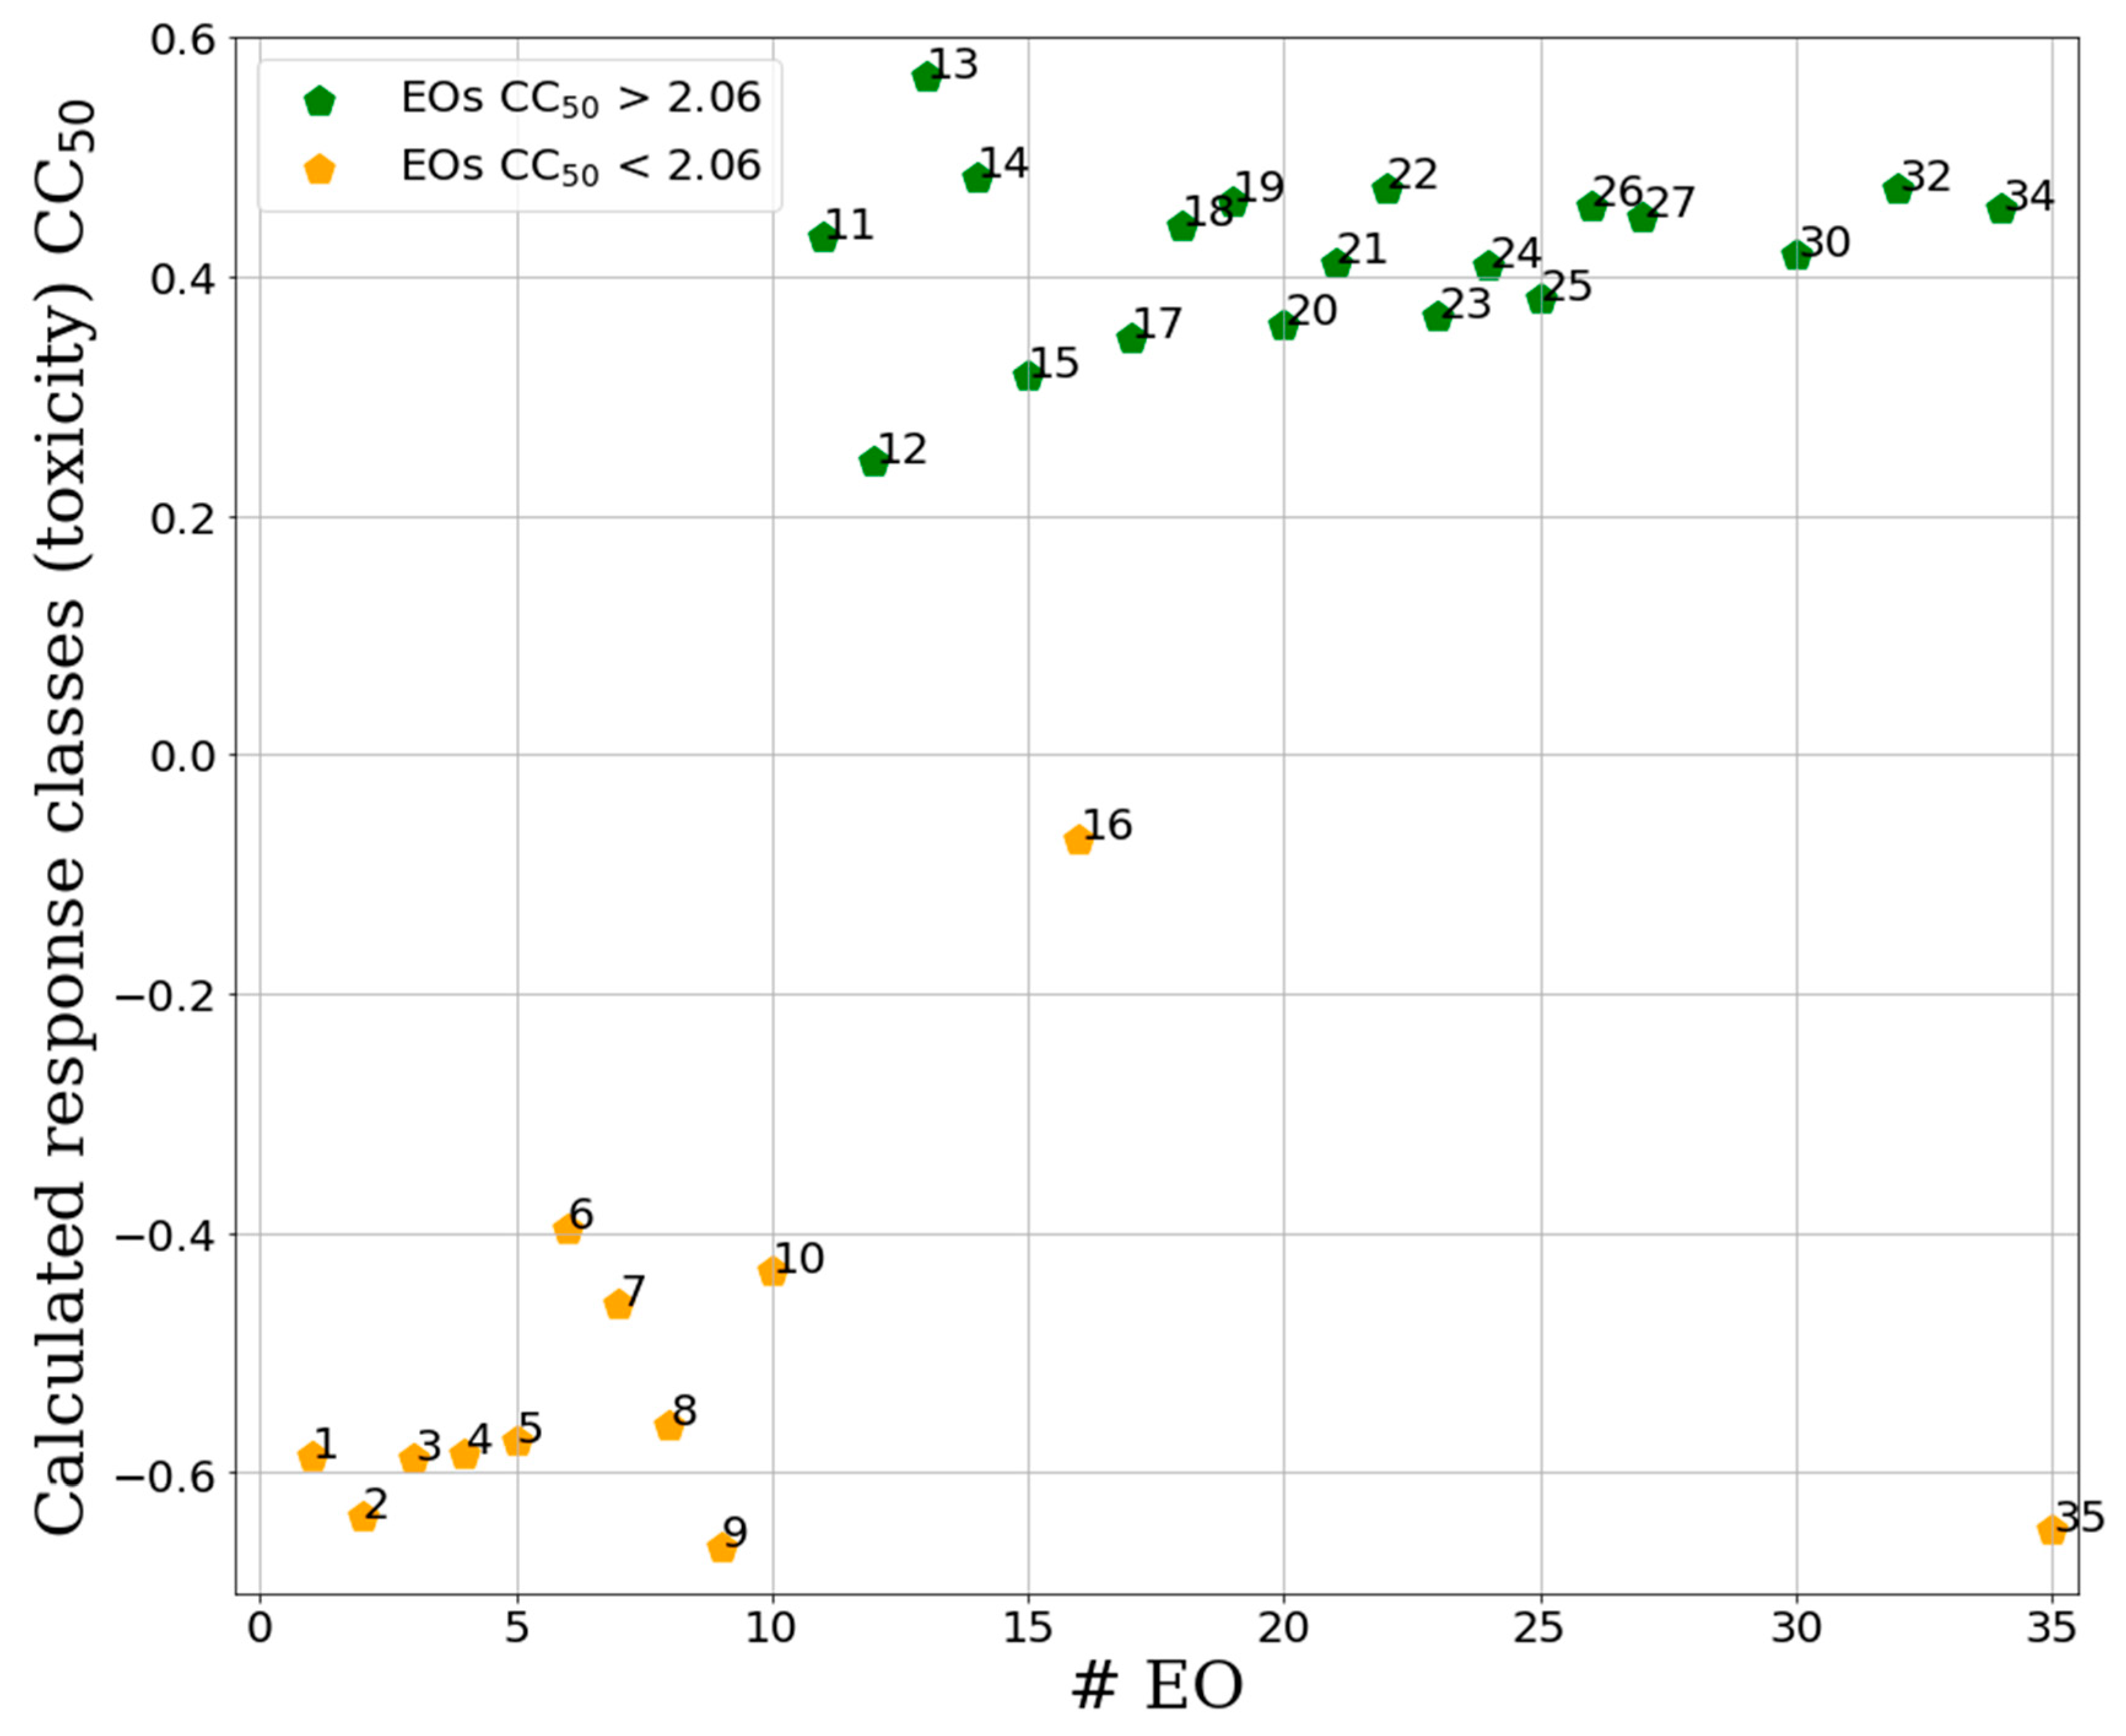
2.2.2. Supervised Classification Modeling
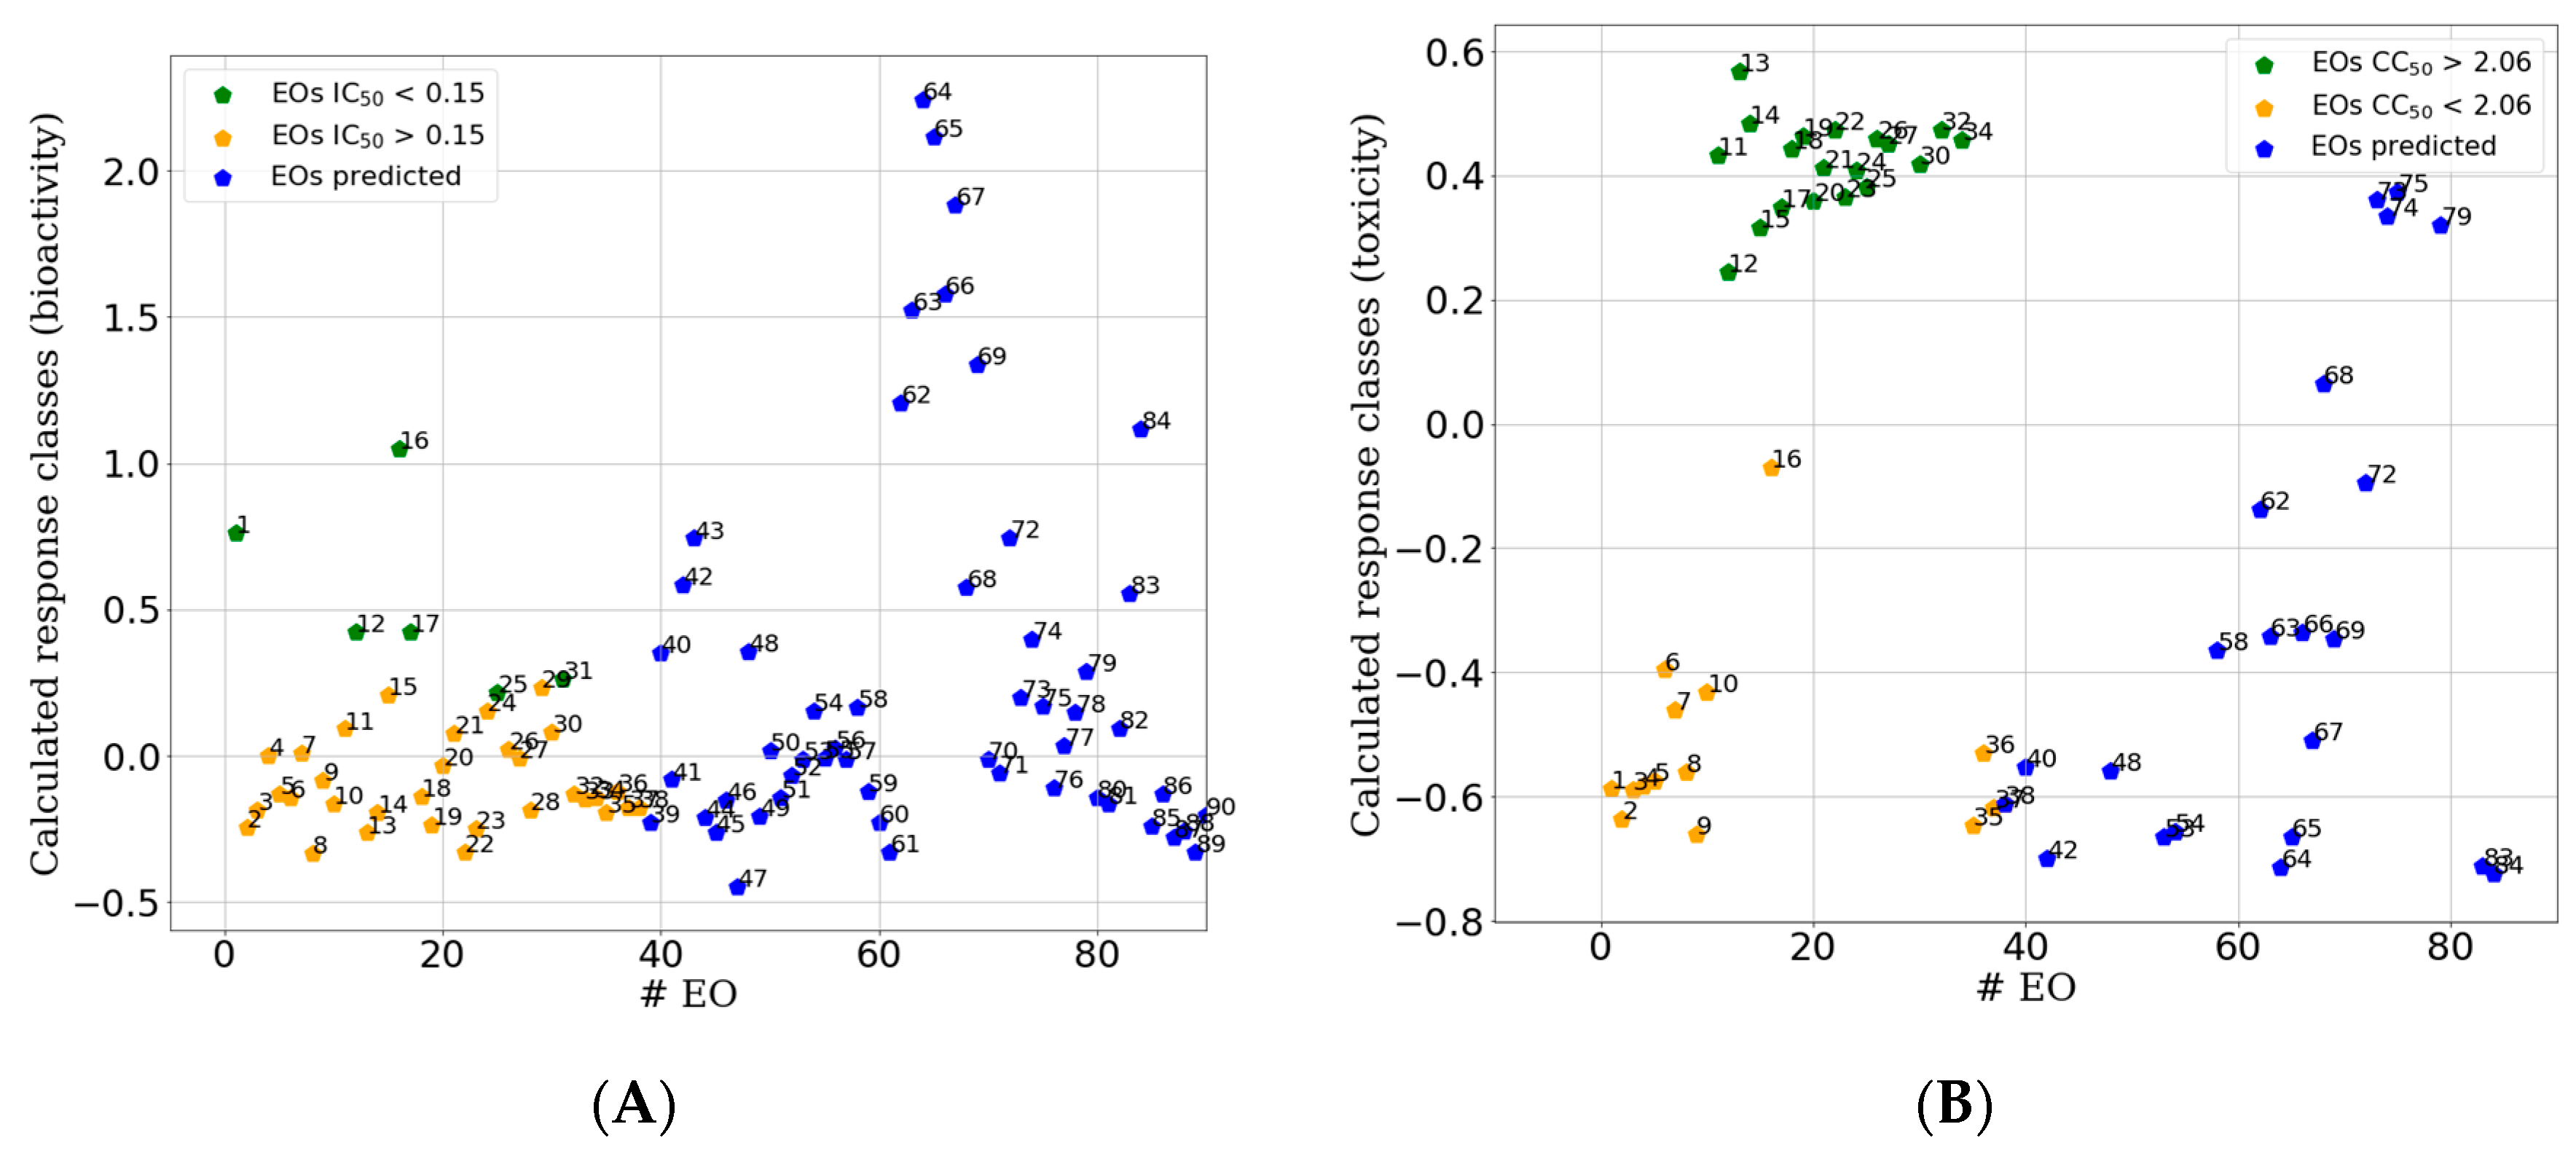
2.2.3. PLS-DA Classification Models Predictive Abilities
3. Material and Methods
3.1. Plants Materials and EOs Extraction
3.2. GC/MS Analysis
3.3. Cell Culture, Virus Production
3.4. Cellular Toxicity
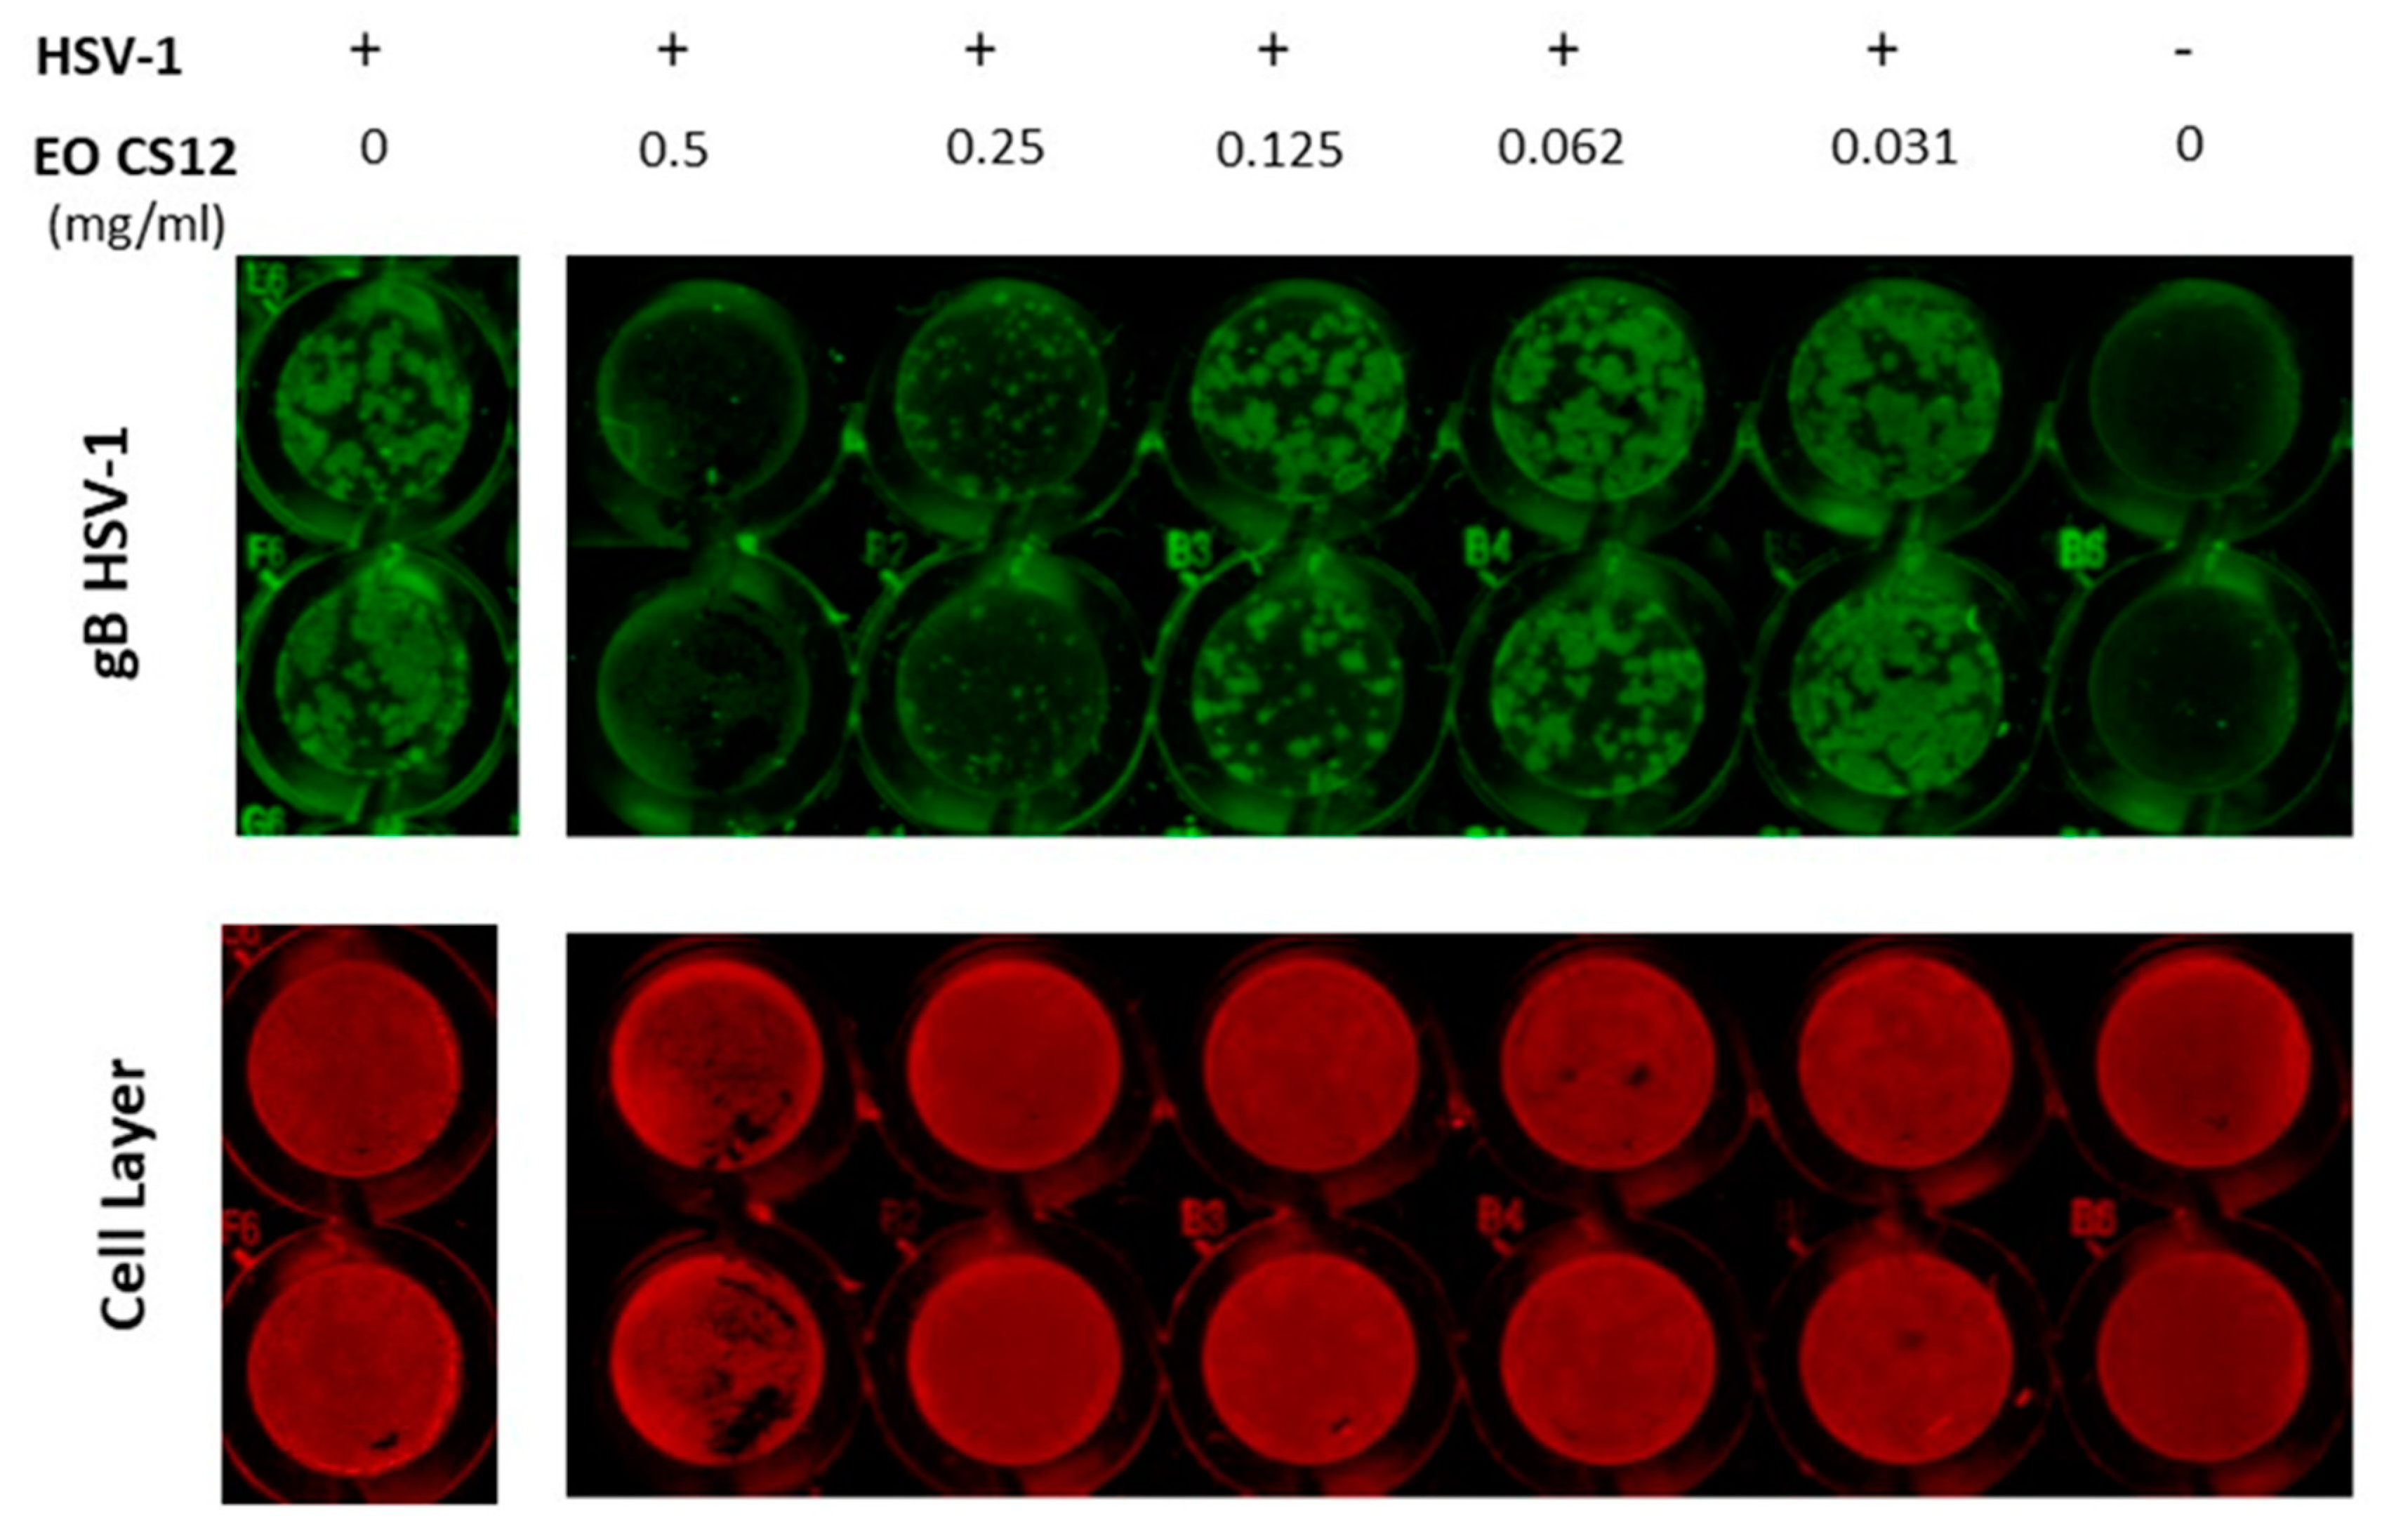
3.5. In Cell Western (ICW) Technique for Antiviral Activity
3.6. Biological Data Analysis
3.7. Machine Learning Classification Modeling
3.7.1. Unsupervised Data Analysis
3.7.2. Supervised Classification Modeling
3.8. Assessment of the Models’ Predictive Ability
4. Conclusions
Author Contributions
Funding
Conflicts of Interest
References
- Zuzarte, M.; Salgueiro, L. Essential Oils Chemistry. In Bioactive Essential Oils and Cancer; De Sousa, D.P., Ed.; Springer International Publishing: Cham, Switzerland, 2015; pp. 19–61. [Google Scholar]
- Schnitzler, P. Essential Oils for the Treatment of Herpes Simplex Virus Infections. Chemotherapy 2019, 64, 1–7. [Google Scholar] [CrossRef] [PubMed]
- Aramrueang, N.; Asavasanti, S.; Khanunthong, A. Leafy Vegetables, in Integrated Processing Technologies for Food and Agricultural By-Products; Pan, Z., Zhang, R., Zicari, S., Eds.; Academic Press 125 London Wall: London, UK, 2019; pp. 245–272. [Google Scholar]
- Pushpangadan, P.; George, V. Basil. In Handbook of Herbs and Spices, 2nd ed.; Peter, K.V., Ed.; Woodhead Publishing: Cambridge, UK, 2012; pp. 55–72. [Google Scholar]
- Bakkali, F.; Averbeck, S.; Averbeck, D.; Idaomar, M. Biological effects of essential oils—A review. Food Chem. Toxicol. 2008, 46, 446–475. [Google Scholar] [CrossRef] [PubMed]
- Basile, A.; Senatore, F.; Gargano, R.; Sorbo, S.; Del Pezzo, M.; Lavitola, A.; Ritieni, A.; Bruno, M.; Spatuzzi, D.; Rigano, D.; et al. Antibacterial and antioxidant activities in Sideritis italica (Miller) Greuter et Burdet essential oils. J. Ethnopharmacol. 2006, 107, 240–248. [Google Scholar] [CrossRef] [PubMed]
- Holley, R.A.; Patel, D. Improvement in shelf-life and safety of perishable foods by plant essential oils and smoke antimicrobials. Food Microbiol. 2005, 22, 273–292. [Google Scholar] [CrossRef]
- Naeini, A.; Naderi, N.J.; Shokri, H. Analysis and in vitro anti-Candida antifungal activity of Cuminum cyminum and Salvadora persica herbs extracts against pathogenic Candida strains. J. Mycol. Med. 2014, 24, 13–18. [Google Scholar] [CrossRef] [PubMed]
- Reichling, J.; Schnitzler, P.; Suschke, U.; Saller, R. Essential oils of aromatic plants with antibacterial, antifungal, antiviral, and cytotoxic properties—An overview. Complement. Med. Res. 2009, 16, 79–90. [Google Scholar] [CrossRef] [Green Version]
- Artini, M.; Patsilinakos, A.; Papa, R.; Bozovic, M.; Sabatino, M.; Garzoli, S.; Vrenna, G.; Tilotta, M.; Pepi, F.; Ragno, R.; et al. Antimicrobial and Antibiofilm Activity and Machine Learning Classification Analysis of Essential Oils from Different Mediterranean Plants against Pseudomonas aeruginosa. Molecules 2018, 23, 482. [Google Scholar] [CrossRef] [Green Version]
- Patsilinakos, A.; Artini, M.; Papa, R.; Sabatino, M.; Bozovic, M.; Garzoli, S.; Vrenna, G.; Buzzi, R.; Manfredini, S.; Selan, L.; et al. Machine Learning Analyses on Data including Essential Oil Chemical Composition and In Vitro Experimental Antibiofilm Activities against Staphylococcus Species. Molecules 2019, 24, 890. [Google Scholar] [CrossRef] [Green Version]
- DeCarlo, A.; Johnson, S.; Okeke-Agulu, K.I.; Dosoky, N.S.; Wax, S.J.; Owolabi, M.S.; Setzer, W.N. Compositional analysis of the essential oil of Boswellia dalzielii frankincense from West Africa reveals two major chemotypes. Phytochemistry 2019, 164, 24–32. [Google Scholar] [CrossRef]
- Freitas, J.V.B.; Alves Filho, E.G.; Silva, L.M.A.; Zocolo, G.J.; de Brito, E.S.; Gramosa, N.V. Chemometric analysis of NMR and GC datasets for chemotype characterization of essential oils from different species of Ocimum. Talanta 2018, 180, 329–336. [Google Scholar] [CrossRef]
- Clarke, S. Handling, safety and practical applications for use of essential oils. In Essential Chemistry for Aromatherapy, 2nd ed.; Clarke, S., Ed.; Churchill Livingstone: Edinburgh, Scotland, 2008; Chapter 8; pp. 231–264. [Google Scholar]
- Garzoli, S.; Pirolli, A.; Vavala, E.; Di Sotto, A.; Sartorelli, G.; Bozovic, M.; Angiolella, L.; Mazzanti, G.; Pepi, F.; Ragno, R. Multidisciplinary Approach to Determine the Optimal Time and Period for Extracting the Essential Oil from Mentha suaveolens Ehrh. Molecules 2015, 20, 9640–9655. [Google Scholar] [CrossRef] [PubMed] [Green Version]
- Civitelli, L.; Panella, S.; Marcocci, M.E.; De Petris, A.; Garzoli, S.; Pepi, F.; Vavala, E.; Ragno, R.; Nencioni, L.; Palamara, A.T.; et al. In vitro inhibition of herpes simplex virus type 1 replication by Mentha suaveolens essential oil and its main component piperitenone oxide. Phytomedicine 2014, 21, 857–865. [Google Scholar] [CrossRef] [PubMed]
- Toujani, M.M.; Ritta, M.; Civra, A.; Genovese, S.; Epifano, F.; Ghram, A.; Lembo, D.; Donalisio, M. Inhibition of HSV-2 infection by pure compounds from Thymus capitatus extract in vitro. Phytother. Res. 2018, 32, 1555–1563. [Google Scholar] [CrossRef] [PubMed]
- Bozovic, M.; Ragno, R. Calamintha nepeta (L.) Savi and its Main Essential Oil Constituent Pulegone: Biological Activities and Chemistry. Molecules 2017, 22, 290. [Google Scholar] [CrossRef]
- Garzoli, S.; Bozovic, M.; Baldisserotto, A.; Sabatino, M.; Cesa, S.; Pepi, F.; Vicentini, C.B.; Manfredini, S.; Ragno, R. Essential oil extraction, chemical analysis and anti-Candida activity of Foeniculum vulgare Miller—New approaches. Nat. Prod. Res. 2018, 32, 1254–1259. [Google Scholar] [CrossRef]
- Tariq, S.; Wani, S.; Rasool, W.; Bhat, M.A.; Prabhakar, A.; Shalla, A.H.; Rather, M.A. A comprehensive review of the antibacterial, antifungal and antiviral potential of essential oils and their chemical constituents against drug-resistant microbial pathogens. Microb. Pathog. 2019, 134, 103580. [Google Scholar] [CrossRef]
- Bozovic, M.; Garzoli, S.; Baldisserotto, A.; Andreotti, E.; Cesa, S.; Pepi, F.; Vertuani, S.; Manfredini, S.; Ragno, R. Variation in essential oil content and composition of Ridolfia segetum Moris based on 30-hour prolonged fractionated extraction procedure. Nat. Prod. Res. 2019, 1–4. [Google Scholar] [CrossRef]
- Brereton, R.G.; Lloyd, G.R. Partial least squares discriminant analysis for chemometrics and metabolomics: How scores, loadings, and weights differ according to two common algorithms. J. Chemom. 2018, 32, e3028. [Google Scholar] [CrossRef]
- Filzmoser, P.; Hron, K.; Templ, M. Principal Component Analysis. In Applied Compositional Data Analysis: With Worked Examples in R; Filzmoser, P., Hron, K., Templ, M., Eds.; Springer International Publishing: Cham, Switzerland, 2018; pp. 131–148. [Google Scholar]
- Tadtong, S.; Suppawat, S.; Tintawee, A.; Saramas, P.; Jareonvong, S.; Hongratanaworakit, T. Antimicrobial Activity of Blended Essential Oil Preparation. Nat. Prod. Commun. 2012, 7, 1401–1404. [Google Scholar] [CrossRef] [Green Version]
- Hongratanaworakit, T.; Srimuang, P.; Wichanpreechar, A.; Akarapattaranithi, T.; Taorang, B.; Rawdlaurh, P. Chemical Composition and Effects of Blended Essential Oil on Humans. J. Appl. Pharm. Sci. 2017, 7, 165–170. [Google Scholar] [CrossRef] [Green Version]
- Cherkasov, A.; Muratov, E.N.; Fourches, D.; Varnek, A.; Baskin, I.I.; Cronin, M.; Dearden, J.; Gramatica, P.; Martin, Y.C.; Todeschini, R.; et al. QSAR Modeling: Where Have You Been? Where Are You Going To? J. Med. Chem. 2014, 57, 4977–5010. [Google Scholar] [CrossRef] [PubMed] [Green Version]
- Bozovic, M.; Garzoli, S.; Sabatino, M.; Pepi, F.; Baldisserotto, A.; Andreotti, E.; Romagnoli, C.; Mai, A.; Manfredini, S.; Ragno, R. Essential Oil Extraction, Chemical Analysis and Anti-Candida Activity of Calamintha nepeta (L.) Savi subsp. glandulosa (Req.) Ball-New Approaches. Molecules 2017, 22, 203. [Google Scholar] [CrossRef] [PubMed] [Green Version]
- Bozovic, M.; Navarra, A.; Garzoli, S.; Pepi, F.; Ragno, R. Esential oils extraction: A 24-hour steam distillation systematic methodology. Nat. Prod. Res. 2017, 31, 2387–2396. [Google Scholar] [CrossRef] [PubMed]
- Schnitzler, P.; Koch, C.; Reichling, J. Susceptibility of Drug-Resistant Clinical Herpes Simplex Virus Type 1 Strains to Essential Oils of Ginger, Thyme, Hyssop, and Sandalwood. Antimicrob. Agents Chemother. 2007, 51, 1859. [Google Scholar] [CrossRef] [Green Version]
- Killington, R.A.; Stokes, A.; Hierholzer, J.C. Virus purification. In Virology Methods Manual; Mahy, B.W.J., Kangro, H.O., Eds.; Academic Press: London, UK, 1996; pp. 71–89. [Google Scholar]
- Mosmann, T. Rapid colorimetric assay for cellular growth and survival: Application to proliferation and cytotoxicity assays. J. Immunol. Methods 1983, 65, 55–63. [Google Scholar] [CrossRef]
- Denizot, F.; Lang, R. Rapid colorimetric assay for cell growth and survival. Modifications to the tetrazolium dye procedure giving improved sensitivity and reliability. J. Immunol. Methods 1986, 89, 271–277. [Google Scholar] [CrossRef]
- Fabiani, M.; Limongi, D.; Palamara, A.T.; De Chiara, G.; Marcocci, M.E. A Novel Method to Titrate Herpes Simplex Virus-1 (HSV-1) Using Laser-Based Scanning of Near-Infrared Fluorophores Conjugated Antibodies. Front. Microbiol. 2017, 8, 1085. [Google Scholar] [CrossRef] [Green Version]
- Guzman, C.; Bagga, M.; Kaur, A.; Westermarck, J.; Abankwa, D. ColonyArea: An ImageJ plugin to automatically quantify colony formation in clonogenic assays. PLoS ONE 2014, 9, e92444. [Google Scholar] [CrossRef]
- Ballabio, D.; Consonni, V. Classification tools in chemistry. Part 1: Linear models. PLS-DA. Anal. Methods 2013, 5, 3790–3798. [Google Scholar] [CrossRef]
- Ballabio, D. A MATLAB toolbox for principal Component Analysis and unsupervised exploration of data structure. Chemom. Intell. Lab. Syst. 2015, 149, 1–9. [Google Scholar] [CrossRef]
- Tistaert, C.; Thierry, L.; Szandrach, A.; Dejaegher, B.; Fan, G.; Frederich, M.; Vander Heyden, Y. Quality control of Citri reticulatae pericarpium: Exploratory analysis and discrimination. Anal. Chim. Acta 2011, 705, 111–122. [Google Scholar] [CrossRef] [PubMed]
- Höskuldsson, A. PLS regression methods. J. Chemom. 1988, 2, 211–228. [Google Scholar] [CrossRef]
- Ballabio, D.; Todeschini, R. Multivariate Classification for Qualitative Analysis. Infrared Spectrosc. Food Qual. Anal. Control 2009, 83, e102. [Google Scholar]
- Ballabio, D.; Grisoni, F.; Todeschini, R. Multivariate comparison of classification performance measures. Chemom. Intell. Lab. Syst. 2018, 174, 33–44. [Google Scholar] [CrossRef]
- Bora, H.; Kamle, M.; Mahato, D.K.; Tiwari, P.; Kumar, P. Citrus Essential Oils (CEOs) and Their Applications in Food: An Overview. Plants 2020, 9, 357. [Google Scholar] [CrossRef] [Green Version]
- Salehi, B.; Selamoglu, Z.; Sener, B.; Kilic, M.; Kumar Jugran, A.; de Tommasi, N.; Sinisgalli, C.; Milella, L.; Rajkovic, J.; Morais-Braga, M.F.B.; et al. Berberis Plants-Drifting from Farm to Food Applications, Phytotherapy, and Phytopharmacology. Foods 2019, 8, 522. [Google Scholar] [CrossRef] [Green Version]
- Gavahian, M.; Chu, Y.H.; Lorenzo, J.M.; Mousavi Khaneghah, A.; Barba, F.J. Essential oils as natural preservatives for bakery products: Understanding the mechanisms of action, recent findings, and applications. Crit. Rev. Food Sci. Nutr. 2020, 60, 310–321. [Google Scholar] [CrossRef]
- Salehi, B.; Upadhyay, S.; Erdogan Orhan, I.; Kumar Jugran, A.; Jayaweera, S.L.D.; Dias, A.D.; Sharopov, F.; Taheri, Y.; Martins, N.; Baghalpour, N.; et al. Therapeutic Potential of alpha- and beta-Pinene: A Miracle Gift of Nature. Biomolecules 2019, 9, 738. [Google Scholar] [CrossRef] [Green Version]
Sample Availability: Samples of the essential oils 1–90 are available from the authors. |


| Statistical Parameter | IC50-PLS-DA | IC50-PLS-DA |
|---|---|---|
| cut-off (mg/mL) | 0.25 | 0.20 |
| EV | 75% | 75% |
| FNER | 0.77 | 0.68 |
| CVNER | 0.71 | 0.61 |
| ACC | 0.76 | 0.68 |
| # a | EO Id b | IC50 (mg/mL) | CC50 (mg/mL) | SI | # a | EOs b | IC50 (mg/mL) | CC50 (mg/mL) | SI |
|---|---|---|---|---|---|---|---|---|---|
| 1 | FA2 | 0.14 | 1.45 | 9.70 | 20 | CS6 | 0.21 | 2.66 | 12.48 |
| 2 | FA6 | 0.16 | 1.82 | 11.31 | 21 | CO1 | 0.21 | 2.50 | 11.89 |
| 3 | FS1 | 0.19 | 1.01 | 5.17 | 22 | CO2 | 0.33 | >3.00 | >9.0 |
| 4 | FS2 | 0.19 | 0.31 | 1.61 | 23 | CO6 | 0.17 | 2.22 | 12.08 |
| 5 | FS6 | 0.19 | 1.51 | 7.78 | 24 | CJM2 | 0.33 | 2.50 | 7.60 |
| 6 | FO1 | 0.72 | 1.50 | 2.07 | 25 | CJM5 | 0.14 | >3.00 | >22.2 |
| 7 | FO3 | 0.65 | 1.02 | 1.58 | 26 | CAM1 | 0.20 | 2.65 | 13.11 |
| 8 | FO6 | 0.54 | 1.69 | 3.14 | 27 | CAM3 | 0.15 | 2.99 | 19.50 |
| 9 | FO24 | 0.58 | 0.36 | 0.61 | 28 | CAM5 | 0.44 | 1.10 | 2.50 |
| 10 | FOM3 | 0.18 | 1.7 | 9.63 | 29 | CSM1 | 0.17 | 2.00 | 11.5 |
| 11 | CJ1 | 0.27 | 2.15 | 7.87 | 30 | CSM3 | 0.24 | 2.12 | 8.97 |
| 12 | CJ2 | 0.14 | >3.00 | >22.2 | 31 | CSM5 | 0.12 | 1.93 | 15.77 |
| 13 | CA1 | 0.16 | 2.84 | 17.54 | 32 | COM1 | 0.28 | 2.76 | 9.78 |
| 14 | CA2 | 0.15 | >3.00 | >19.8 | 33 | COM3 | 0.31 | 1.99 | 6.36 |
| 15 | CA3 | 0.18 | 2.50 | 14.26 | 34 | COM5 | 0.36 | 2.46 | 6.74 |
| 16 | CA6 | 0.14 | 1.14 | 7.99 | 35 | R6 | 0.43 | 0.41 | 0.94 |
| 17 | CS1 | 0.14 | 2.50 | 17.82 | 36 | R24 | 0.18 | 0.36 | 1.99 |
| 18 | CS2 | 0.21 | 2.90 | 14.04 | 37 | RM4 | 0.30 | 0.90 | 3.05 |
| 19 | CS3 | 0.23 | 2.68 | 11.61 | 38 | RM6 | 0.20 | 0.33 | 1.65 |
| IC50-PLS-DA | CC50-PLS-DA | |
|---|---|---|
| cut-off (mg/mL) | 0.15 | 2.06 |
| ONPC | 7 | 3 |
| EV | 98% | 78% |
| FNER | 0.97 | 1.00 |
| CVNER | 0.85 | 0.97 |
| ACC | 0.87 | 0.97 |
| # | EO Id a | IC50 Class Predicted | CC50 Class Predicted | # | EOs a | IC50 Class Predicted | CC50 Class Predicted | # | EOsa | IC50 Class Predicted | CC50 Class Predicted |
|---|---|---|---|---|---|---|---|---|---|---|---|
| 39 | FA1 | NA | T | 57 | FSM5 | NA | T | 75 | CJM4 | A | NT |
| 40 | FA3 | A | T | 58 | FOM1 | A | T | 76 | CAM2 | NA | T |
| 41 | FA12 | NA | T | 59 | FOM2 | NA | T | 77 | CAM4 | NA | T |
| 42 | FA24 | A | T | 60 | FOM4 | NA | T | 78 | CSM2 | A | T |
| 43 | FS3 | A | T | 61 | FOM5 | NA | T | 79 | CSM4 | A | NT |
| 44 | FS12 | NA | T | 62 | CJ3 | A | T | 80 | COM2 | NA | T |
| 45 | FS24 | NA | T | 63 | CJ6 | A | T | 81 | COM4 | NA | T |
| 46 | FO2 | NA | T | 64 | CJ12 | A | T | 82 | R1 | NA | T |
| 47 | FO12 | NA | T | 65 | CJ24 | A | T | 83 | R2 | A | T |
| 48 | FAM1 | A | T | 66 | CA12 | A | T | 84 | R3 | A | T |
| 49 | FAM2 | NA | T | 67 | CA24 | A | T | 85 | R12 | NA | T |
| 50 | FAM3 | NA | T | 68 | CS12 | A | T | 86 | R30 | NA | T |
| 51 | FAM4 | NA | T | 69 | CS24 | A | T | 87 | RM1 | NA | T |
| 52 | FAM5 | NA | T | 70 | CO3 | NA | T | 88 | RM2 | NA | T |
| 53 | FSM1 | NA | T | 71 | CO12 | NA | T | 89 | RM3 | NA | T |
| 54 | FSM2 | A | T | 72 | CO24 | A | T | 90 | RM5 | NA | T |
| 55 | FSM3 | NA | T | 73 | CJM1 | A | NT | ||||
| 56 | FSM4 | NA | T | 74 | CJM3 | A | NT |
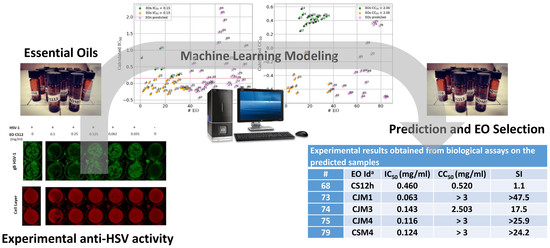
| # | EO Id a | IC50 (mg/mL) | CC50 (mg/mL) | SI |
|---|---|---|---|---|
| 68 | CS12h | 0.460 | 0.520 | 1.1 |
| 73 | CJM1 | 0.063 | >3 | >47.5 |
| 74 | CJM3 | 0.143 | 2.503 | 17.5 |
| 75 | CJM4 | 0.116 | >3 | >25.9 |
| 79 | CSM4 | 0.124 | >3 | >24.2 |
© 2020 by the authors. Licensee MDPI, Basel, Switzerland. This article is an open access article distributed under the terms and conditions of the Creative Commons Attribution (CC BY) license (http://creativecommons.org/licenses/by/4.0/).
Share and Cite
Sabatino, M.; Fabiani, M.; Božović, M.; Garzoli, S.; Antonini, L.; Marcocci, M.E.; Palamara, A.T.; De Chiara, G.; Ragno, R. Experimental Data Based Machine Learning Classification Models with Predictive Ability to Select in Vitro Active Antiviral and Non-Toxic Essential Oils. Molecules 2020, 25, 2452. https://doi.org/10.3390/molecules25102452
Sabatino M, Fabiani M, Božović M, Garzoli S, Antonini L, Marcocci ME, Palamara AT, De Chiara G, Ragno R. Experimental Data Based Machine Learning Classification Models with Predictive Ability to Select in Vitro Active Antiviral and Non-Toxic Essential Oils. Molecules. 2020; 25(10):2452. https://doi.org/10.3390/molecules25102452
Chicago/Turabian StyleSabatino, Manuela, Marco Fabiani, Mijat Božović, Stefania Garzoli, Lorenzo Antonini, Maria Elena Marcocci, Anna Teresa Palamara, Giovanna De Chiara, and Rino Ragno. 2020. "Experimental Data Based Machine Learning Classification Models with Predictive Ability to Select in Vitro Active Antiviral and Non-Toxic Essential Oils" Molecules 25, no. 10: 2452. https://doi.org/10.3390/molecules25102452
APA StyleSabatino, M., Fabiani, M., Božović, M., Garzoli, S., Antonini, L., Marcocci, M. E., Palamara, A. T., De Chiara, G., & Ragno, R. (2020). Experimental Data Based Machine Learning Classification Models with Predictive Ability to Select in Vitro Active Antiviral and Non-Toxic Essential Oils. Molecules, 25(10), 2452. https://doi.org/10.3390/molecules25102452