Article

New Strategies in the Cultivation of Olive Trees and Repercussions on the Nutritional Value of the Extra Virgin Olive Oil

1
Department of Pharmacy, University of Naples Federico II, Via Domenico Montesano 49, 80141 Napoli, Italy
2
LINFA SCARL. Via Zona Industriale Porto San Salvo, 89900 Vibo Valentia, Italy
3
Department of Veterinary Medicine and Animal Productions, University of Naples Federico II, Via Federico Delpino 1, 80137 Napoli, Italy
4
Institute for Sustainable Plant Protection, National Research Council, Via Università 133, 80055 Portici (NA), Italy
5
Department of Physics, University of Salerno, Via Giovanni Paolo II, 132, 84084 Fisciano (SA), Italy
6
Istituto Sistemi Complessi del Consiglio Nazionale delle Ricerche (ISC-CNR), 00185 Rome, Italy
7
Department of Agricultural Science, University of Naples Federico II, Via Università 100, 80055 Portici, Italy
*
Authors to whom correspondence should be addressed.
Molecules 2020, 25(10), 2345; https://doi.org/10.3390/molecules25102345
Submission received: 22 April 2020 / Revised: 5 May 2020 / Accepted: 10 May 2020 / Published: 18 May 2020
(This article belongs to the Special Issue Olive Oil: From Processing to Health Benefits)

Abstract

:
The health advantages of extra-virgin olive oil (EVOO) are ascribed mainly to the antioxidant ability of the phenolic compounds. Secoiridoids, hydroxytyrosol, tyrosol, phenolic acid, and flavones, are the main nutraceutical substances of EVOO. Applications of beneficial microbes and/or their metabolites impact the plant metabolome. In this study the effects of application of selected Trichoderma strains or their effectors (secondary metabolites) on the phenolic compounds content and antioxidant potential of the EVOOs have been evaluated. For this purpose, Trichoderma virens (strain GV41) and Trichoderma harzianum (strain T22), well-known biocontrol agents, and two their metabolites harzianic acid (HA) and 6-pentyl-α-pyrone (6PP) were been used to treat plants of Olea europaea var. Leccino and var. Carolea. Then the nutraceutical potential of EVOO was evaluated. Total phenolic content was estimated by Folin–Ciocalteau’s assay, metabolic profile by High-Resolution Mass spectroscopy (HRMS-Orbitrap), and antioxidant activity by DPPH and ABTS assays. Our results showed that in the cultivation of the olive tree, T22 and its metabolites improve the nutraceutical value of the EVOOs modulating the phenolic profile and improving antioxidants activity.

1. Introduction

The health benefits of the extra-virgin olive oil are ascribed mainly to phenolic compounds, among which the most concentrated are lignans (pinoresinol, acetoxypinoresinol, hydroxypinoresinol, etc.) and secoiridoids (ligstroside, oleuropein, etc.), with the latter located only in the Oleaceae family [1]. Other phenolics in EVOO are flavonoids (luteolin, apigenin, etc.), phenolic alcohols (tyrosol, hydroxytyrosol, etc.), and phenolic acids (hydroxybenzoic acid, ferulic acid, etc.) [2]. These substances modulate aging-associated processes and have antitumor, antiviral, anti-atherogenic, anti-inflammatory, antihepatotoxic, hypoglycemic, immunomodulatory [3,4,5,6], and anti-autoimmune (i.e., rheumatoid arthritis) properties [7]. The quality and content of the phenolic compounds in EVOO vary significantly according to the olive cultivar, environmental factors (altitude, agricultural practices, and amount of irrigation), oil extraction conditions (heating, added water, malaxation, pressure, centrifugation systems) and storage conditions [8]. The superior quality of the extra virgin olive oil is linked to olive fruits free of damage caused by pests, so pesticide (insecticides, fungicides, and herbicides) applications are used to enhance the number and size of olives. Unfortunately, residues from pesticides can pass into EVOO and determine health risks. Therefore, analytical procedures are carried out to determine their dosage in the oil. Organic agriculture is an alternative to the use of pesticides. These environmental systems depend on ecosystem management. Organic products are considered healthier and safer than conventional; therefore, they are required by the consumers despite their higher costs than conventional products. In the EU, subsidies were done to producers for compensating the lower incomes when they convert in organic the traditional cultivation (EC 2017) [9]. Biological control is one of the most appreciated alternatives against plant pathogens in a sustainable, environment-friendly strategy. The use of beneficial microbes have the benefit of the rhizosphere competence, allowing rapid establishment within the rhizosphere of a stable microbial community; suppression of pathogens by using a variety of mechanisms; overall improvement of plant health; plant growth promotion; enhancement of the nutrient availability and uptake, induction of host resistance similar to that stimulated by beneficial rhizobacteria, and positive change of the plant metabolome [10,11]. Trichoderma species are free-living fungi able to interact in the root, soil, and foliar environments with potential as biopesticides and biofertilizers [11,12]. They restore the beneficial balance of natural ecosystems by competing against the phytopathogens agents for space and nutrients [13]. They stimulate, in the plant, the production of secondary metabolites, including phenolic compounds, with health properties [14]. The commercial success of products containing these fungal antagonists can be attributed to the large volume of viable propagules that can be produced rapidly in several fermentation systems [15]. Biological diversity of the Trichoderma species produces a broad range of secondary metabolites; whose production varies according to the strain used [13]. Some of these biomolecules shown promising antifungal activity [16]. One factor that contributes to Trichoderma activities is related to the wide variety of metabolites that they produce. These metabolites have been found not only to directly inhibit the growth of pathogens, but also to increase disease resistance, enhance plant growth and modified plant metabolome [17]. Previous studies have shown that the Trichoderma T22 enhances the concentration of phenolics in the Vitis vinifera fruit and increases the tolerance of tomato plant to biotic and abiotic stresses by scavenging reactive oxygen species (ROS) and reutilizing oxidized glutathione and ascorbate [18,19]. It has been demonstrated that the Trichoderma GV41 improves antioxidant activity, total phenols concentration and profile in lettuce [14]. However, to date, nothing is known about the effects of these strains of Trichoderma on qualitative and quantitative profiles of the phenolic compounds in extra virgin olive oil. Therefore, the main objective of this study was to determine the possible impact of Trichoderma (T22 and GV41 on the nutraceutical value of the extra virgin olive oil produced by two Olea europaea varieties (Leccino and Carolea). Unfortunately, the use of the living fungus in agriculture is limited by the capacity of some strains to colonize every type of soils and plant roots, the impossibility of having directly proportional dose-response effects, and difficult storage conditions [20]. A solution to these problems is given using secondary metabolites of the Trichoderma. In this study, the ability of the tetrameric acid derivative with iron-binding activity (harzianic acid) and the food-grade volatile 6PP (pyrone 6-pentyl-α-pyrone) of improving the nutraceutical quality of the EVOO was also evaluated.

2. Results

2.1. Analyses of Phenolics

Q Exactive Orbitrap LC-MS/MS method allowed the identification and the quantification of the phenolic compounds in the samples. The identification of the phenolic compounds was made by comparing the retention times (Rt) to the mass spectra of the purified compounds and the standards. The ligstroside not commercially available was quantified by using the oleuropein in place of the authentic standard. Table 1 shows the retention time (RT) of phenolics obtained by UPLC-MS/MS.
A new chromatographic method was applied for the quantification of individual secondary metabolites, whose validation parameters were reported in Table 2. Limits of detection (LODs) range was from 0.02 to 1.0 mg/L, Limits of quantification (LOQs) 0.033 to 3.0 mg/L, and the linearity range between 88.7 and 1%.
Secoiridoids derivatives were the most representative phenolics in the two EVOO samples, and between these, the oleuropein-aglycone monoaldehyde, ligstroside-aglycone monoaldehyde, oleocanthal, and oleacein were the most abundant (Table 3).
The second group of phenolic compounds by concentration were phenolic alcohols (Table 4).
The third most abundant class of phenolic compounds were lignans (Table 5) followed by flavonoids (Table 6) and phenolic acids (Table 7).
Noteworthy was the content of luteolin in Caroleaoil and the ability of Ha biostimulation to improve it.

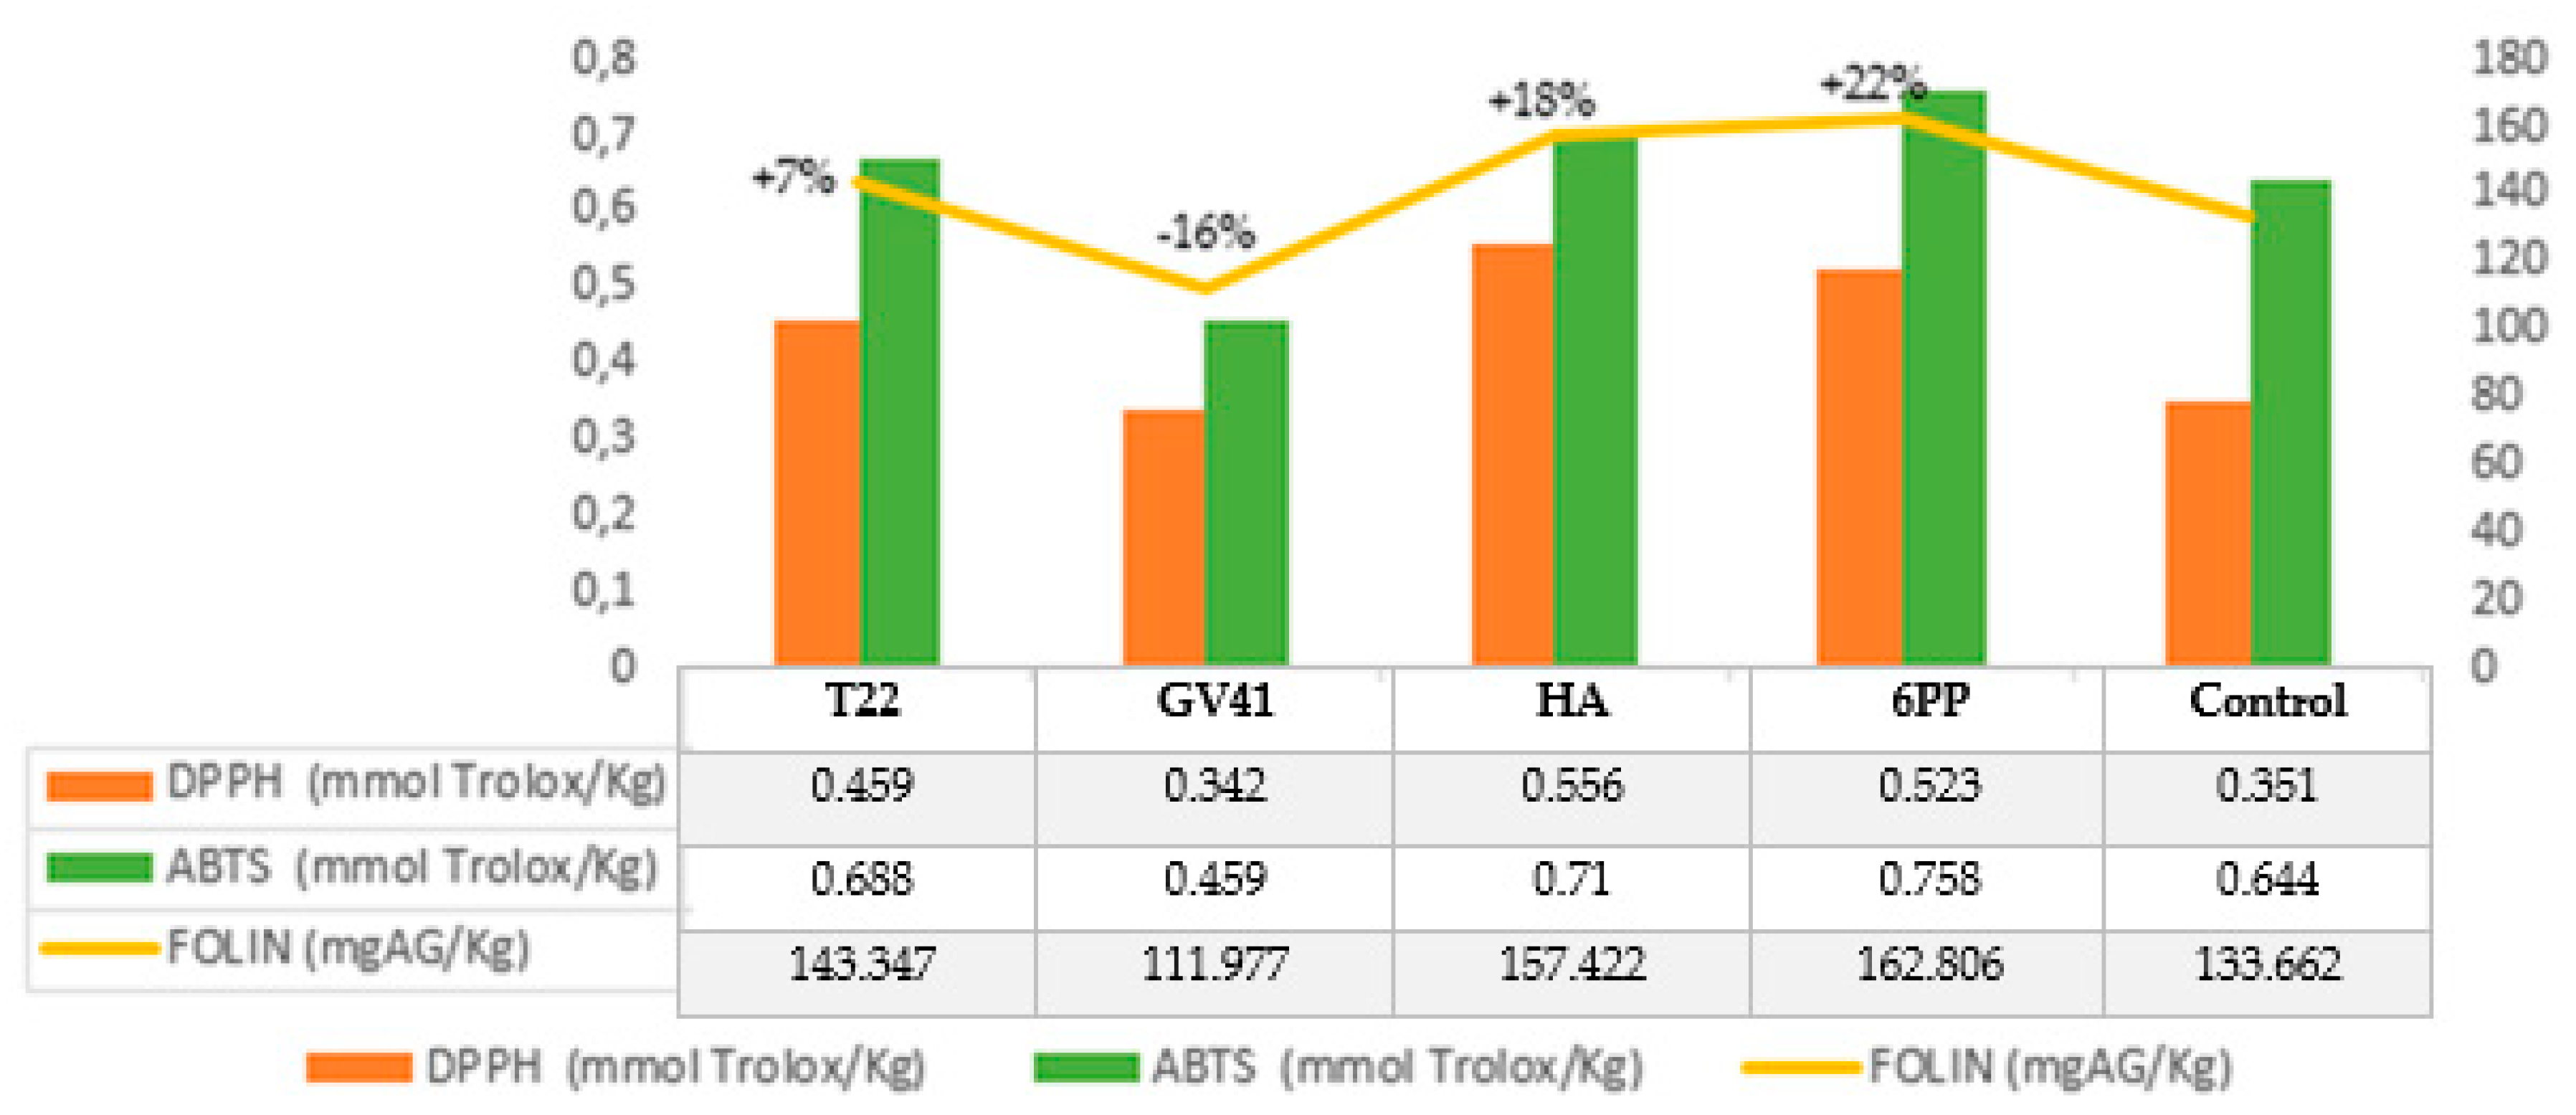
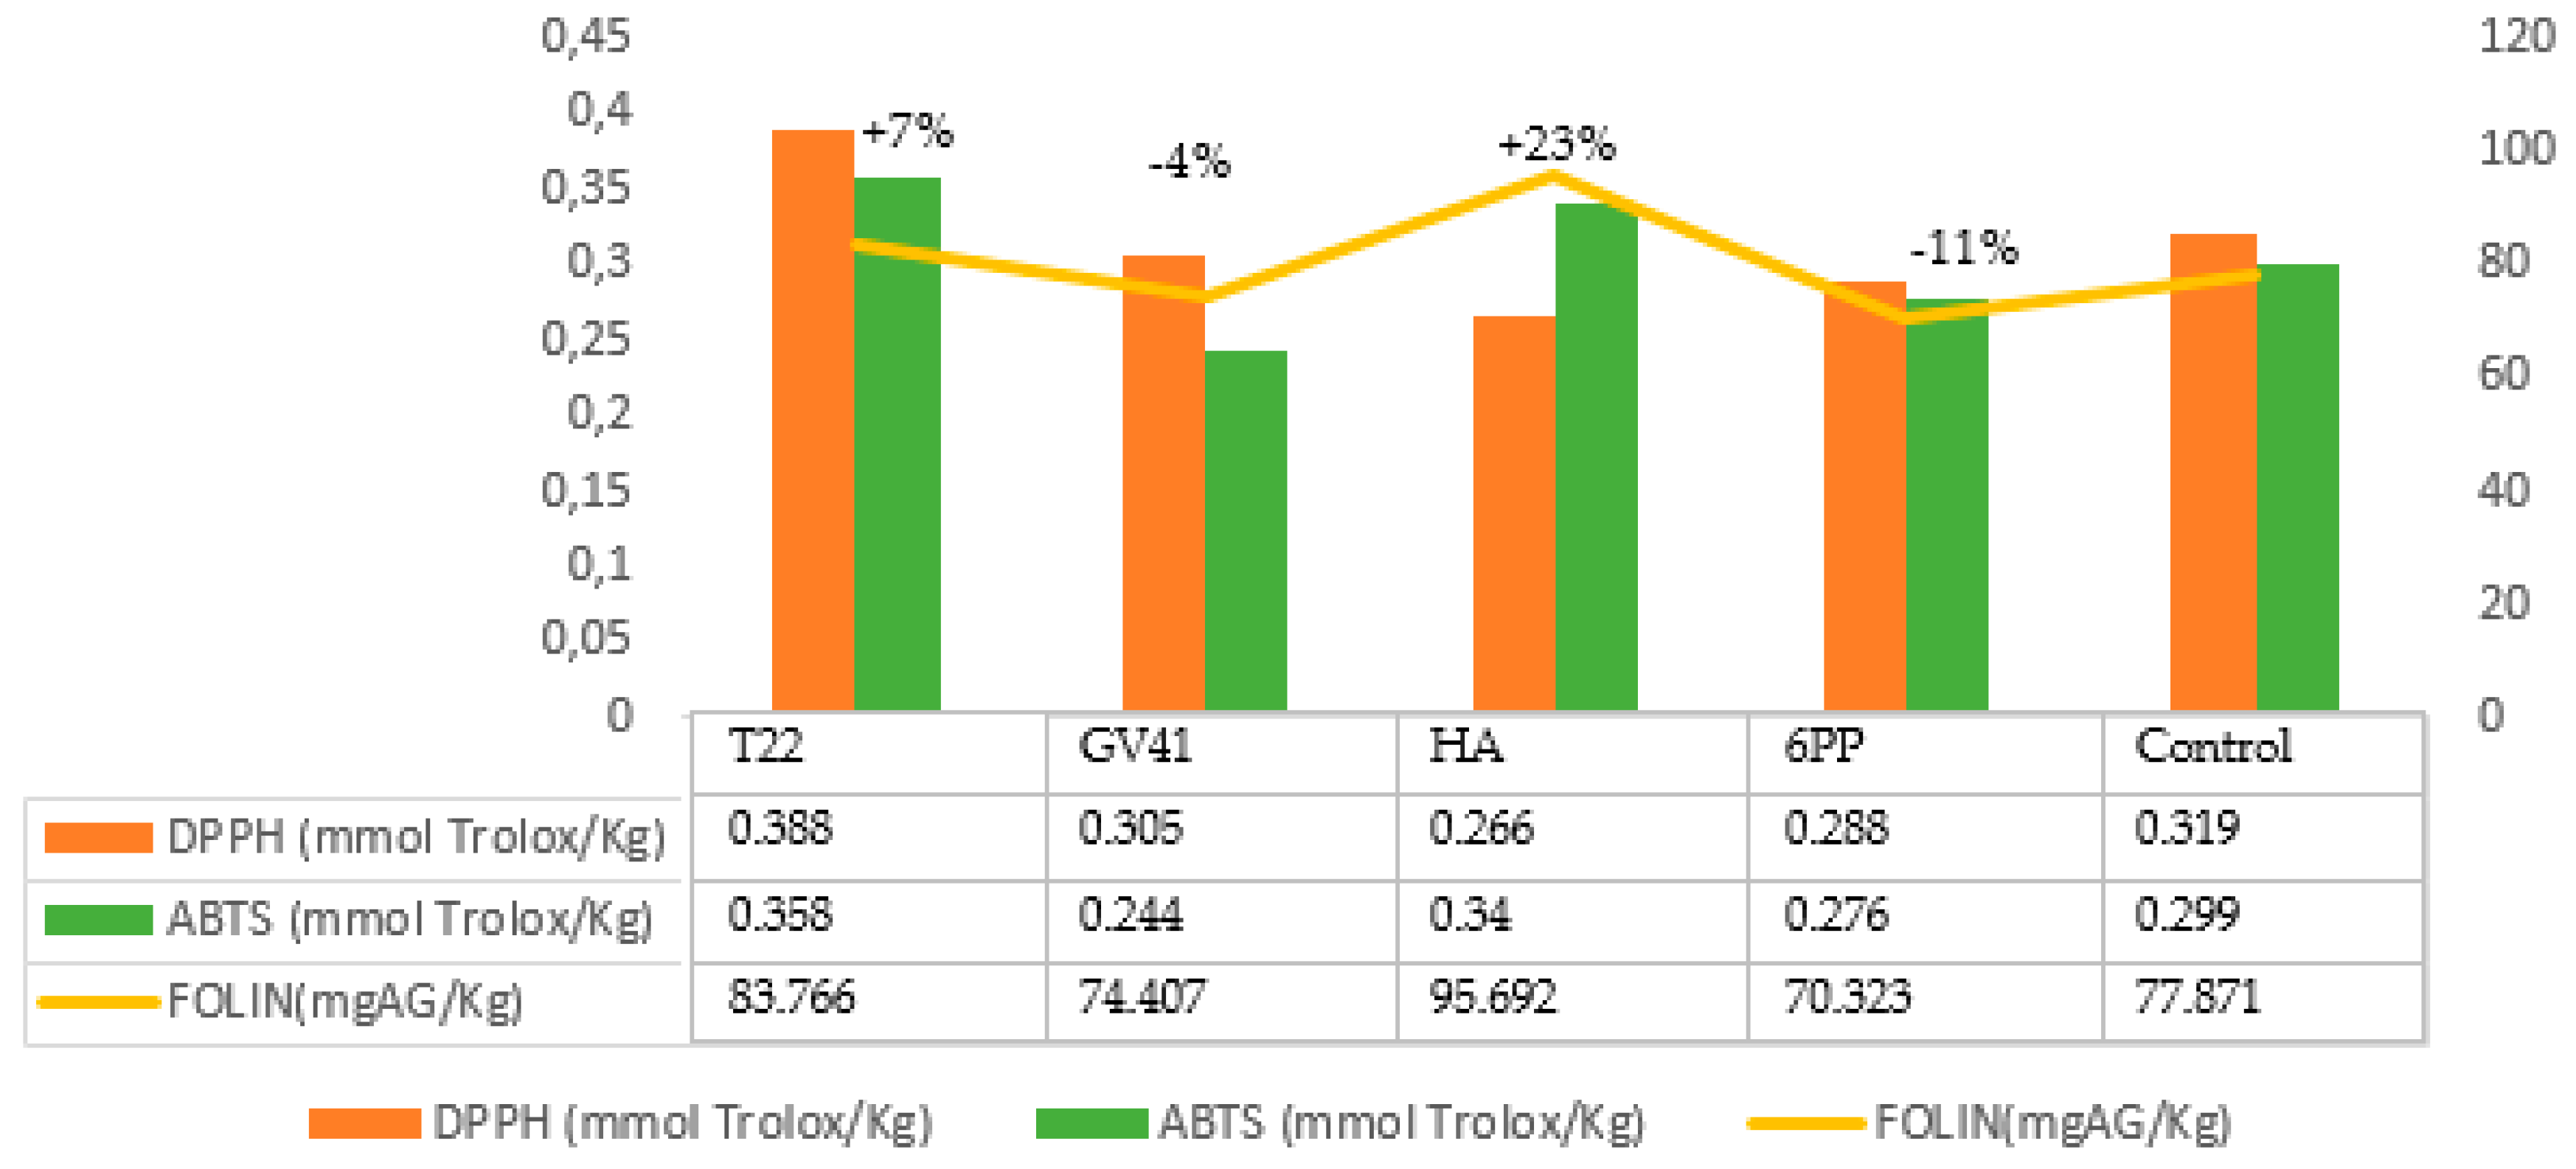
2.2. Phenol Content and Antioxidant Activity

As shown in Figure 1, the EVOO obtained from Leccino variety olives had the highest content of phenols (EVOOLeccino: 133.662 mg/kg−1; EVOOCarolea: 77.871 mg·kg−1). The treatment of the Carolea olive trees with the biocontrol agent 6PP, compared to the untreated trees, improved the concentration of phenols in EVOO (+22%), followed by HA (+18%), and T22 (+7%), only the treatment with the living fungus GV41 decreased their concentration (−16%) (Figure 1).
In Leccino EVOO, the highest concentration of phenols occurred in the oil produced from olives obtained by treating trees with HA (+23%), followed by T22 (+7%). On the contrary, the treatment of the olive trees with GV41 and 6PP decreased their concentration: −4% and −11%, respectively. (Figure 2).
DPPH and ABTS assays were used to determine the antioxidant activity of samples. A positive correlation was found between phenolic concentration and antioxidant activity measured by the ABTS test in all oil samples (Leccinooil = 0.970322; Cororeaoil = 0.757275). Concerning the correlation between phenolic concentration and antioxidant activity measured by DPPH test, it was positive (0.91454) in Leccinooil and negative in Coroleaoil (−0.09952).

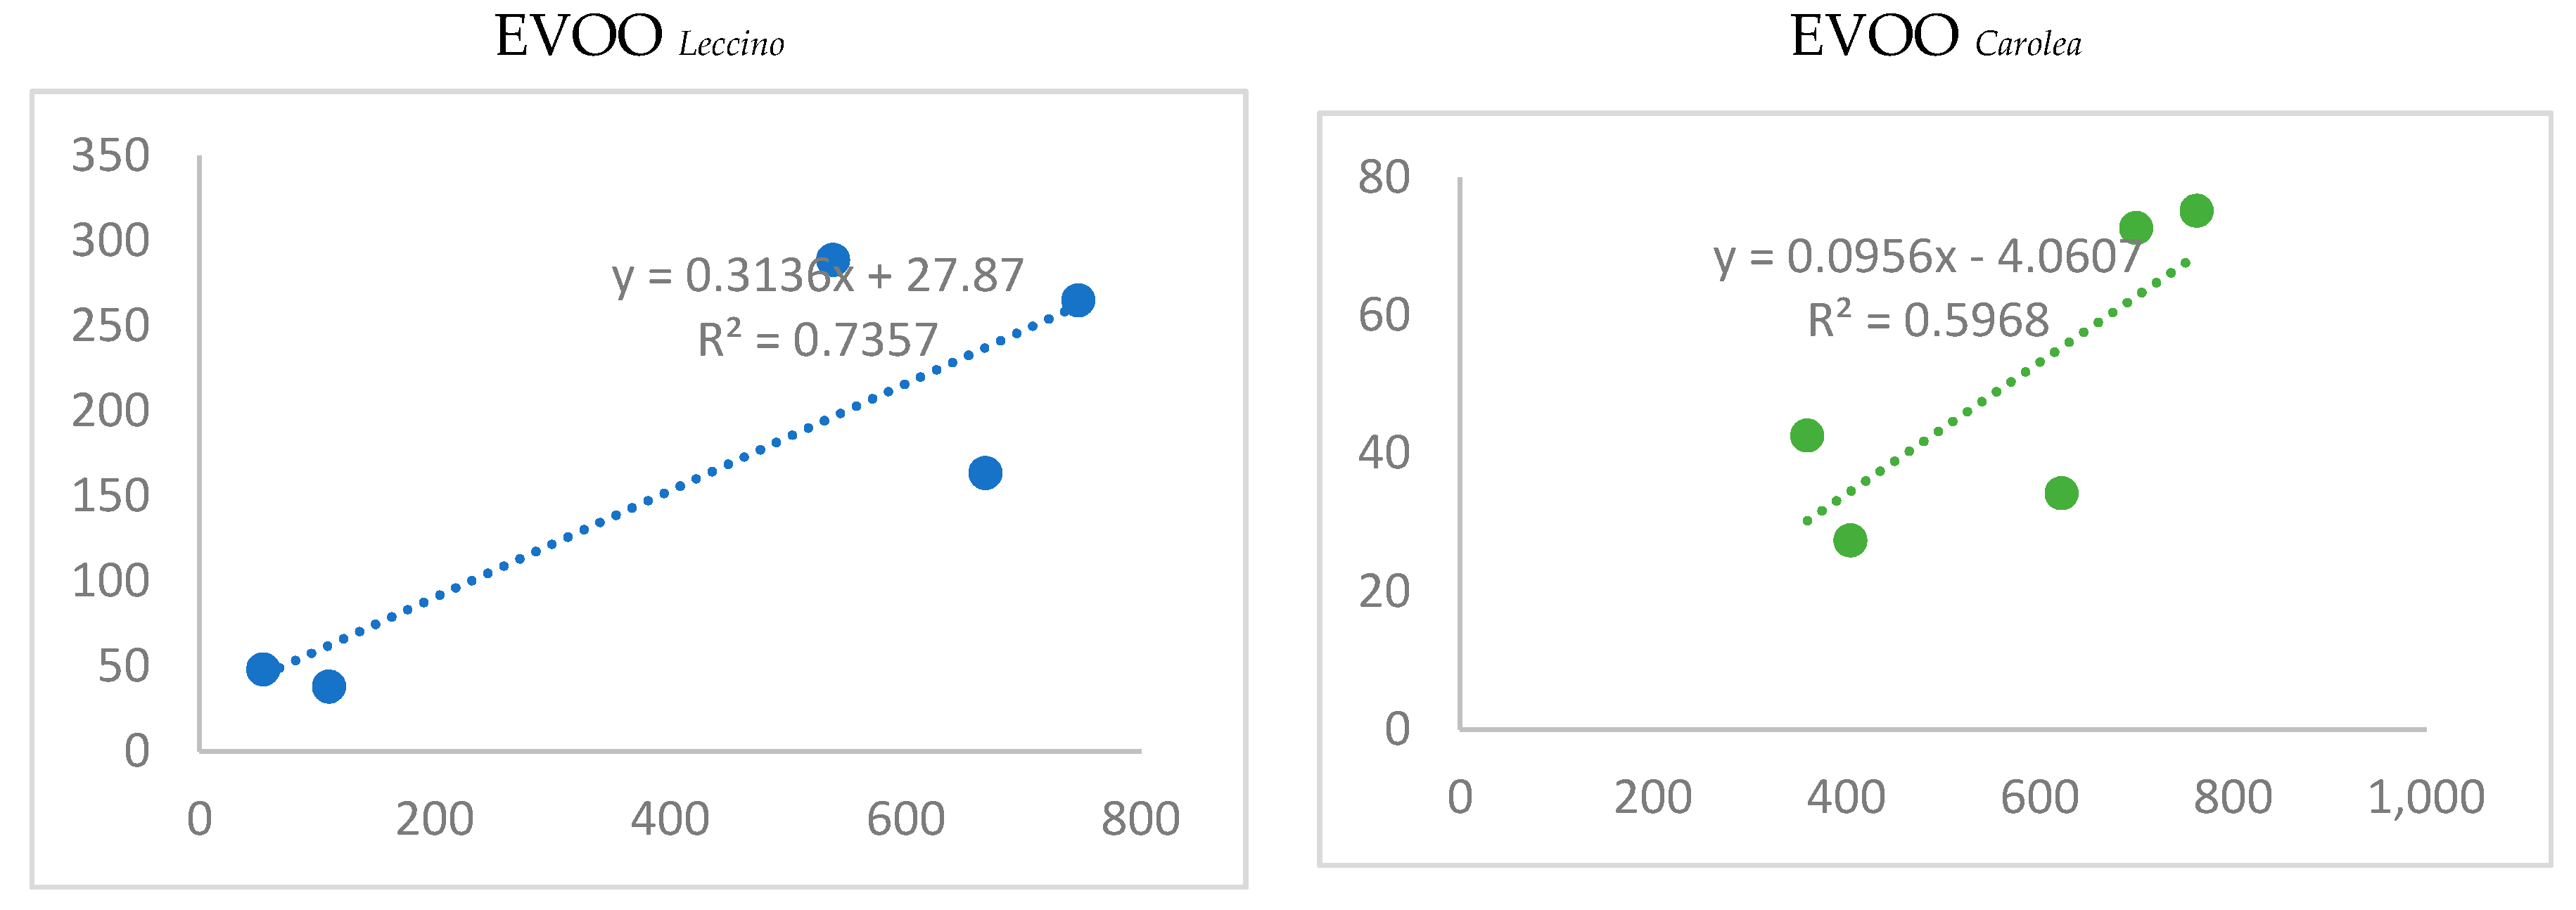
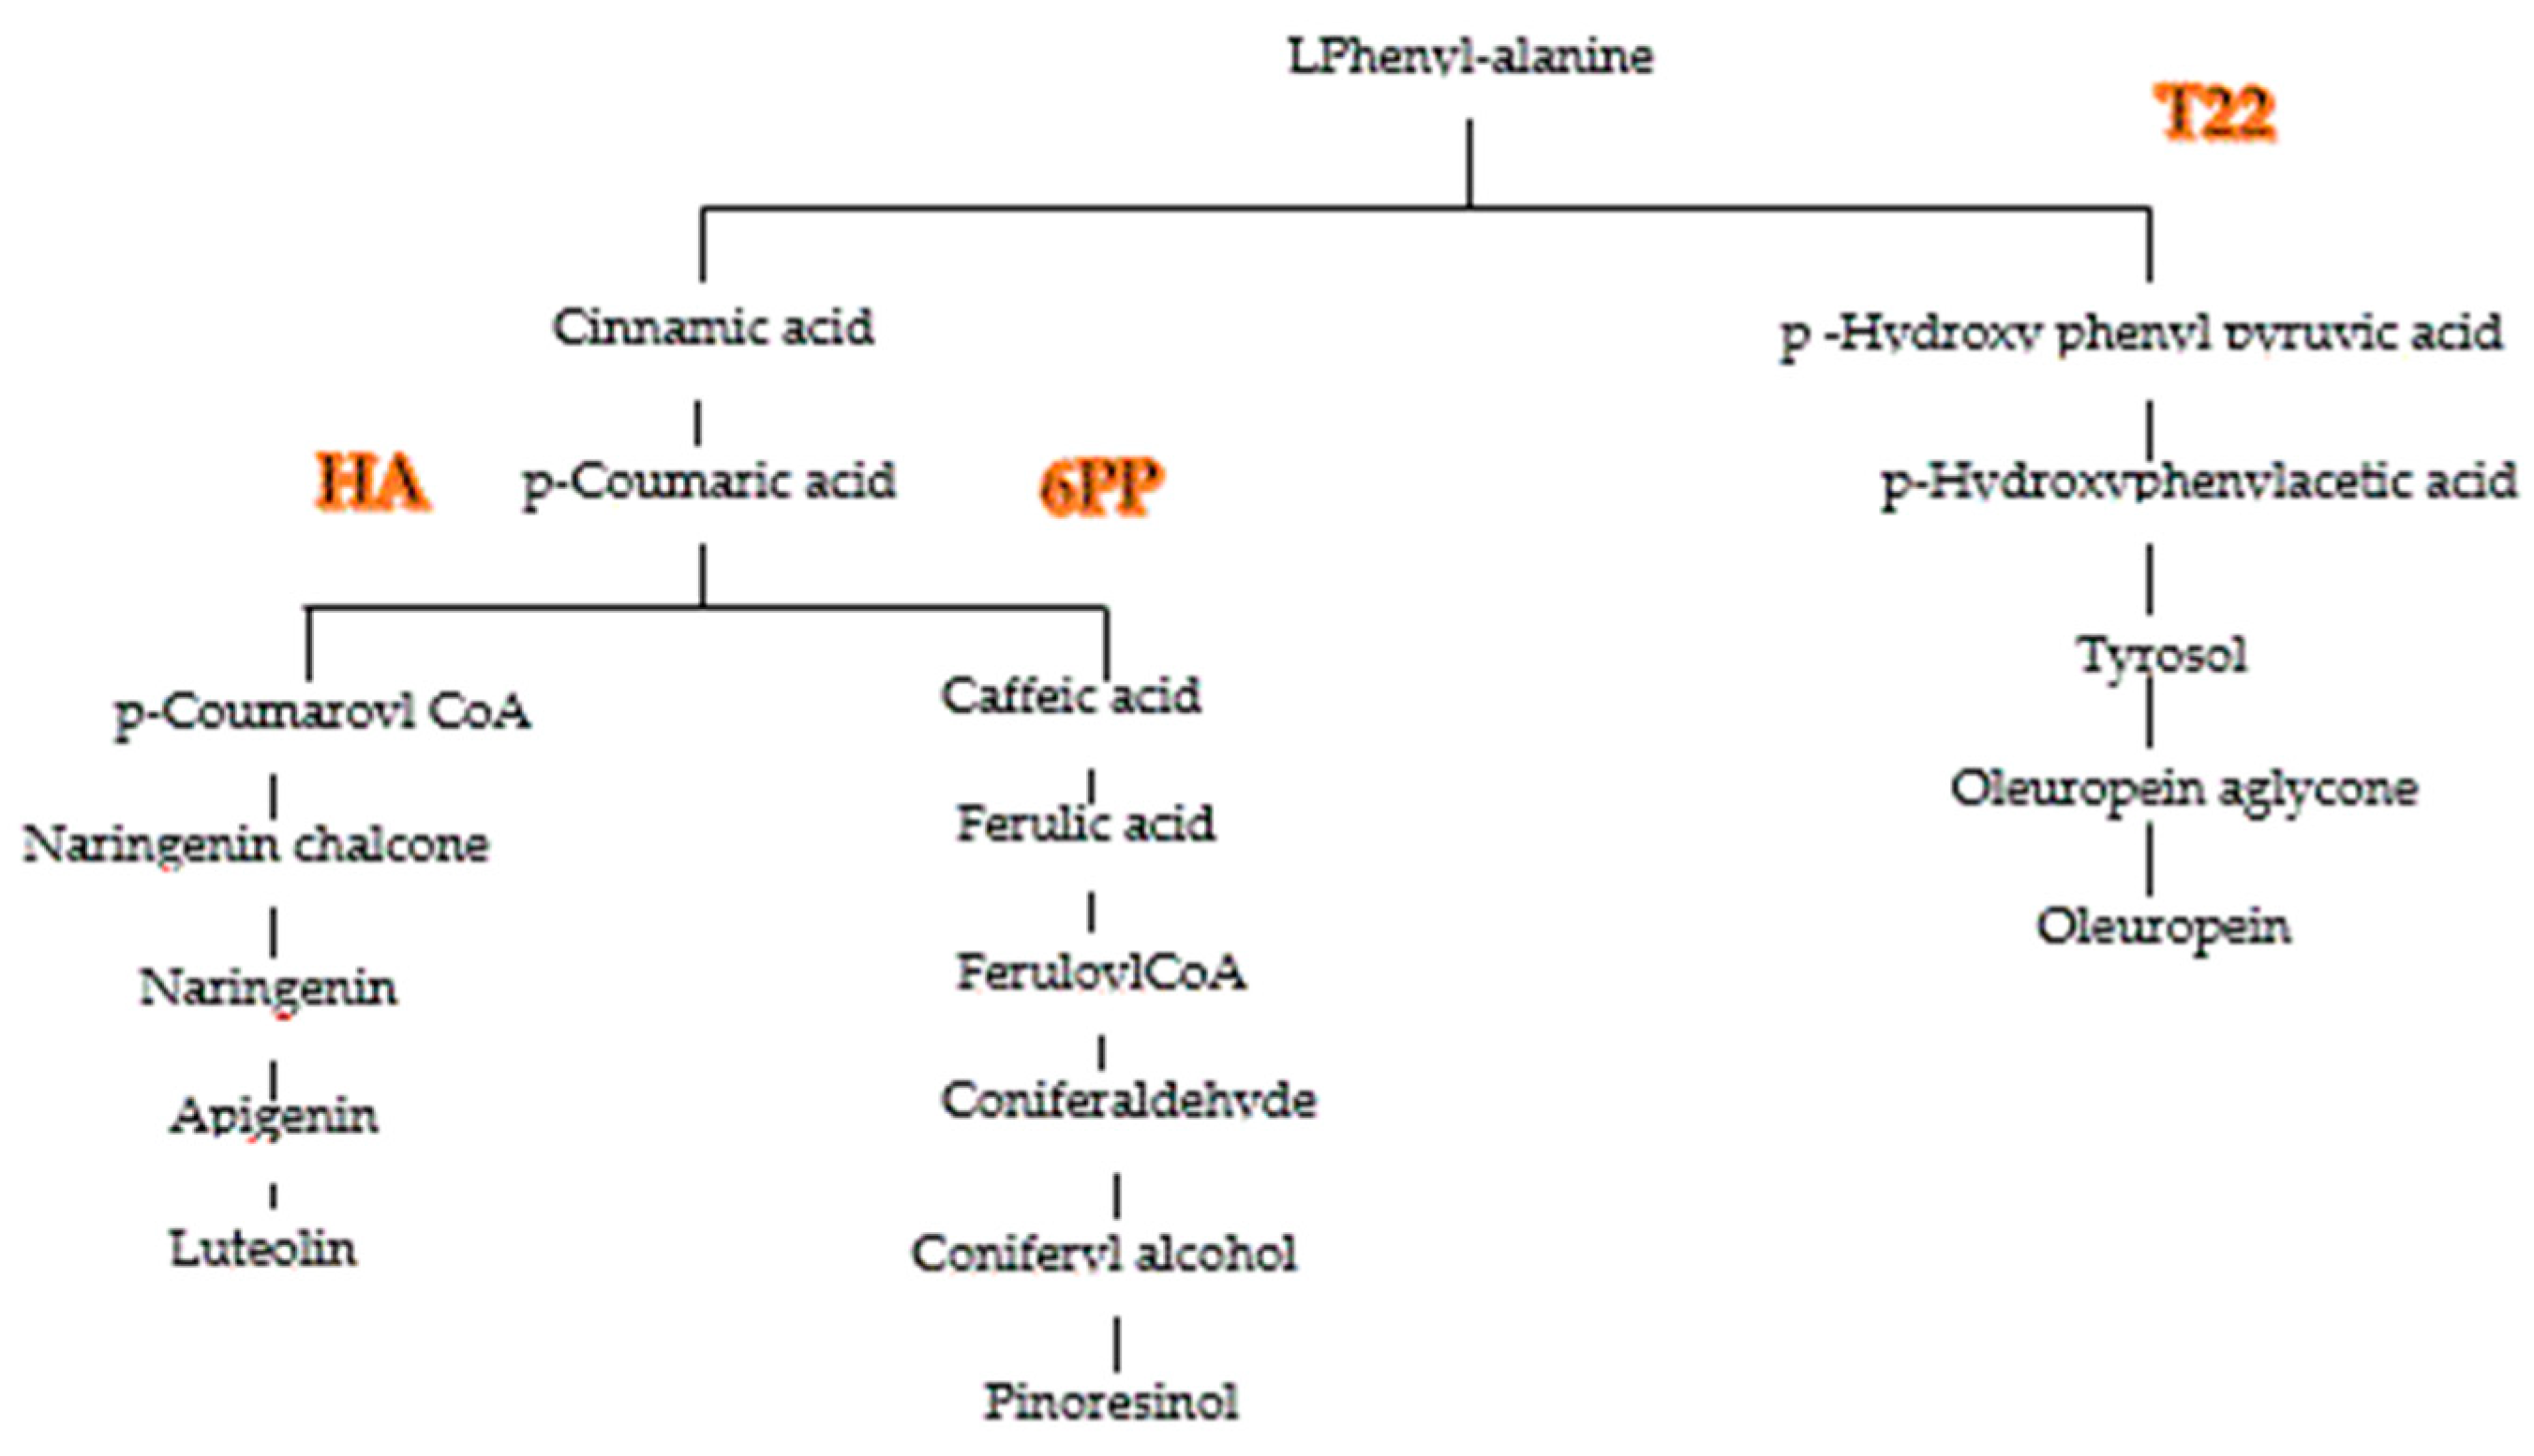
2.3. Secoiridoids and Phenolic Alcohols Correlation

Significant correlation indexes correlated secoiridoids and phenolic alcohols (EVOO Leccino − 0.7 and EVOO Carolea+ 0.6). These indexes were obtained by correlating the sum of the concentrations of the four most representative secoiridoids (oleuropein-aglycone monoaldehyde+ ligstroside-aglycone monoaldehyde + oleocanthal + oleacein) with the sum of the two phenolic acids (tyrosol + OHTyrosol) (Figure 3). The “+“ sign indicated that only a small part of secoiridoids degraded.

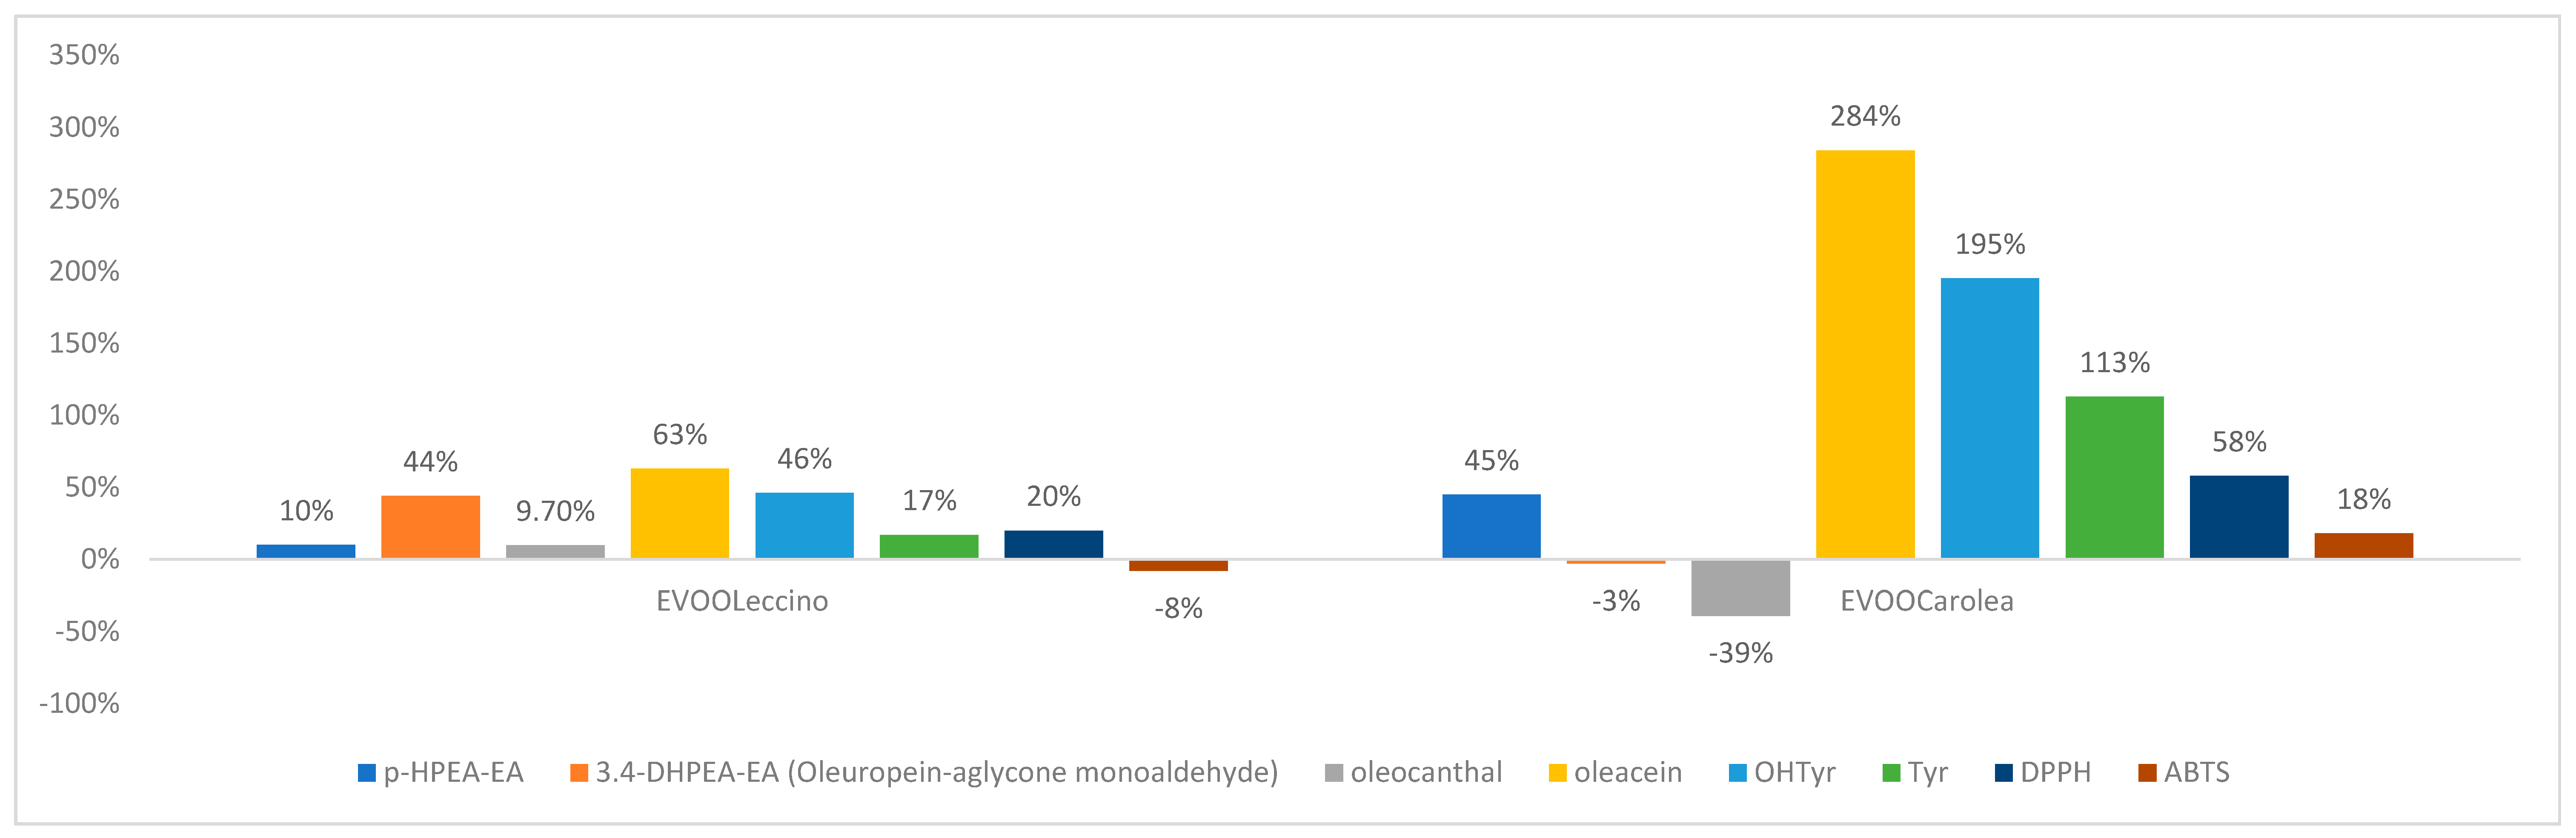
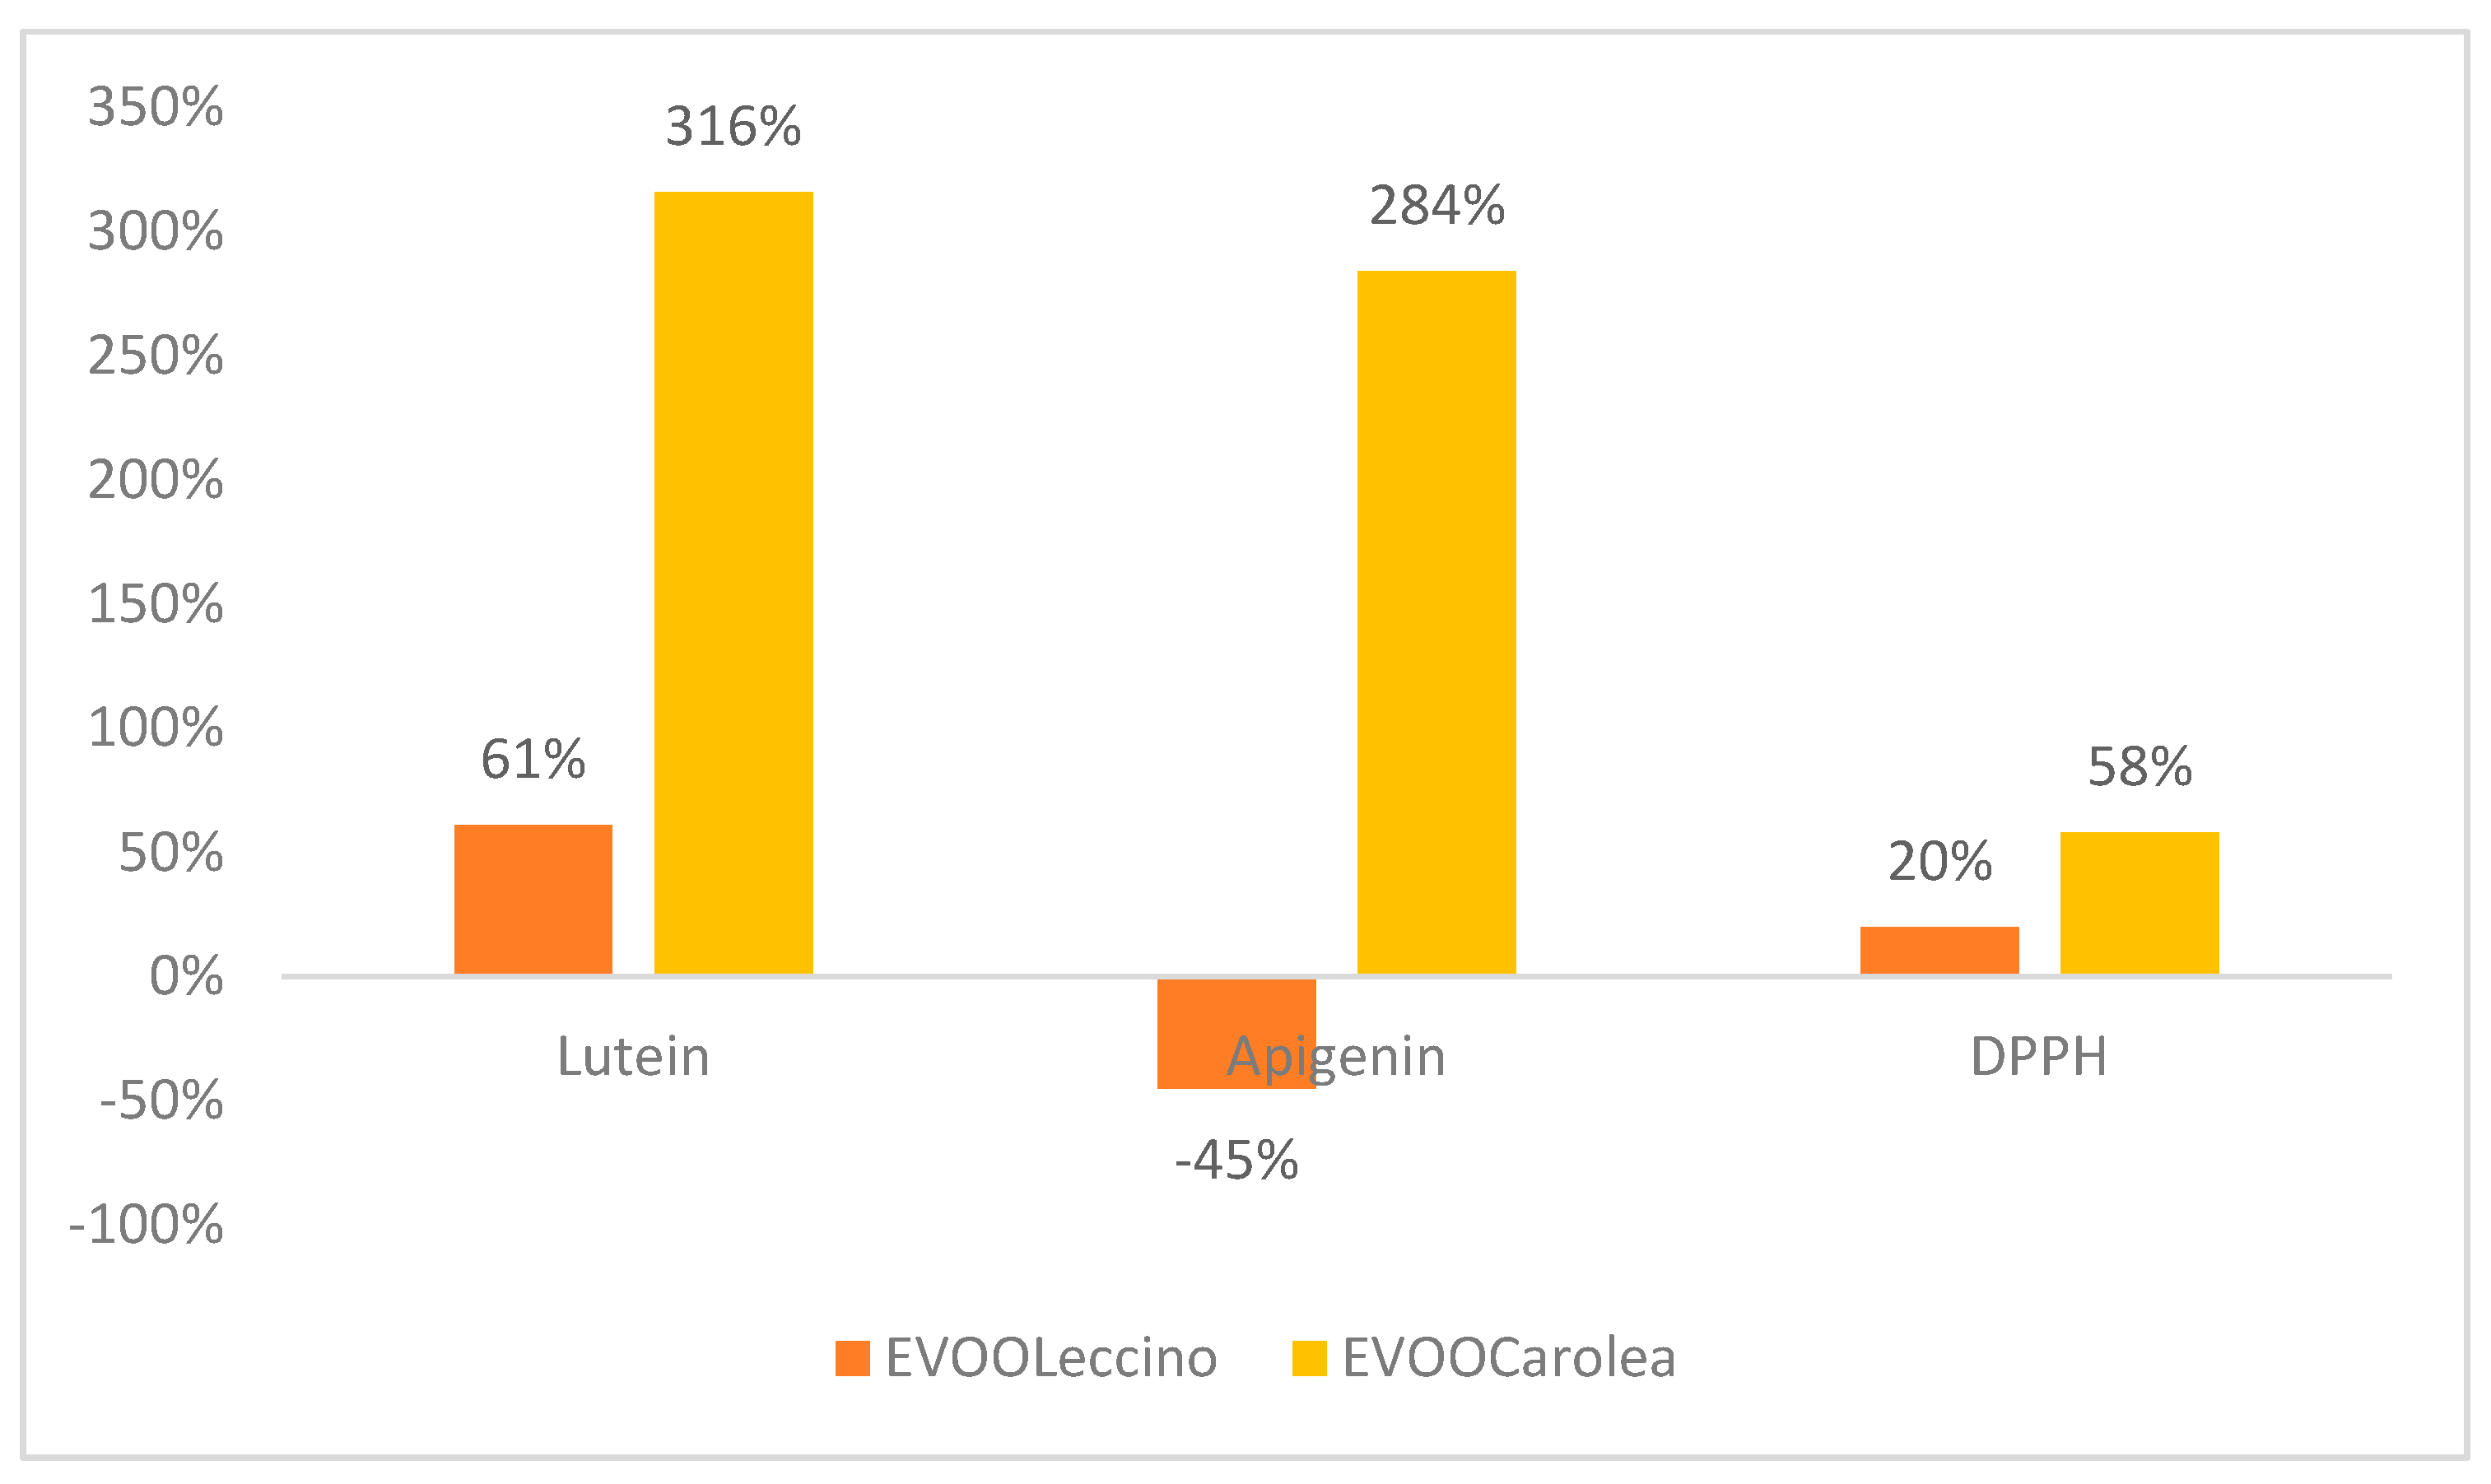
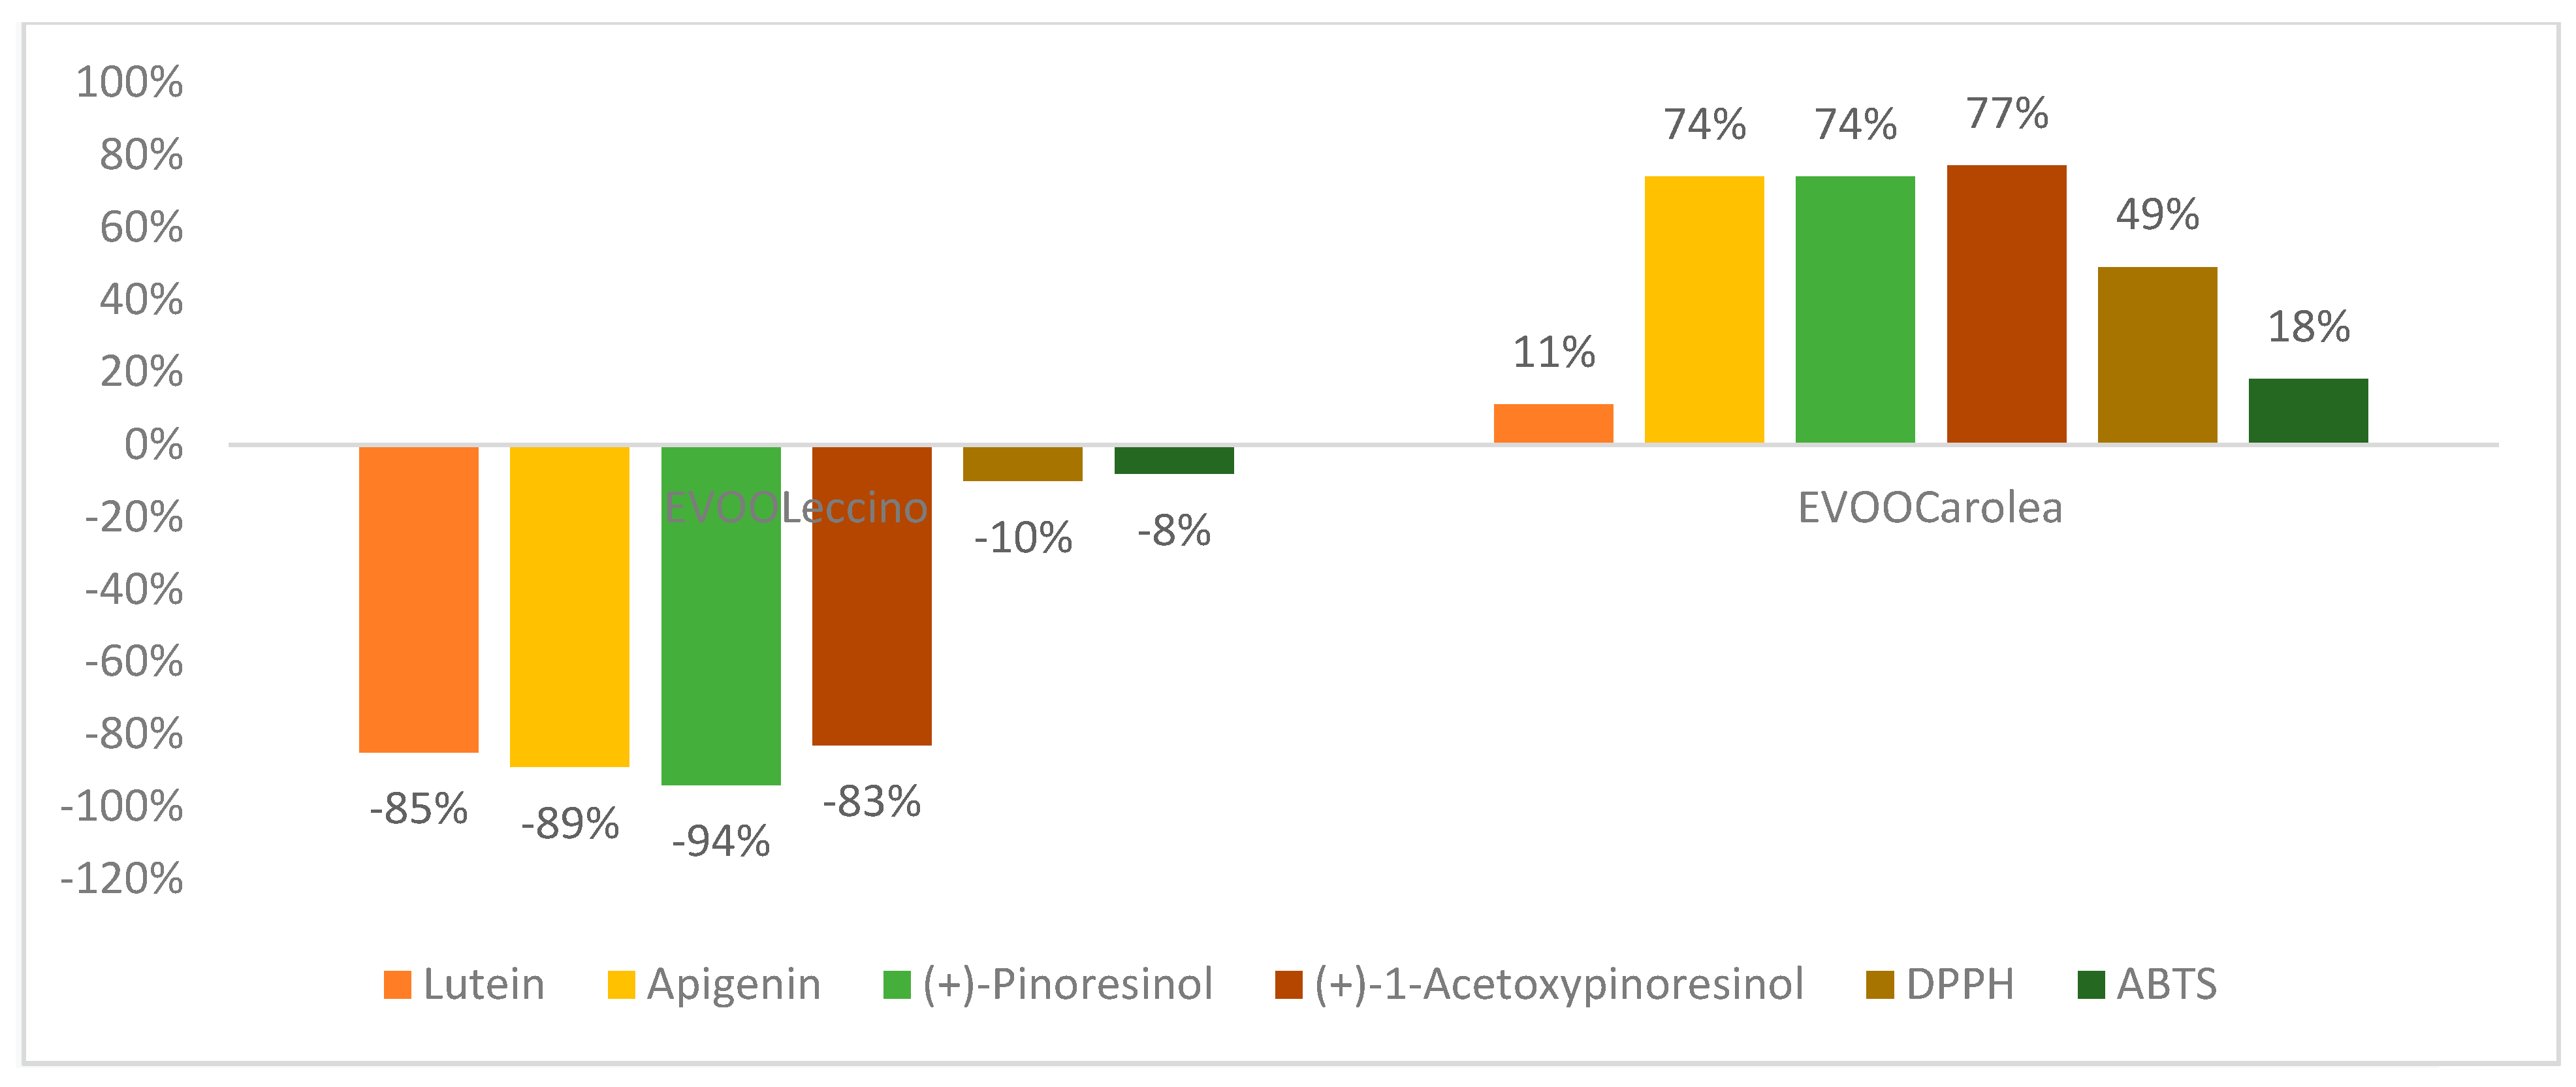
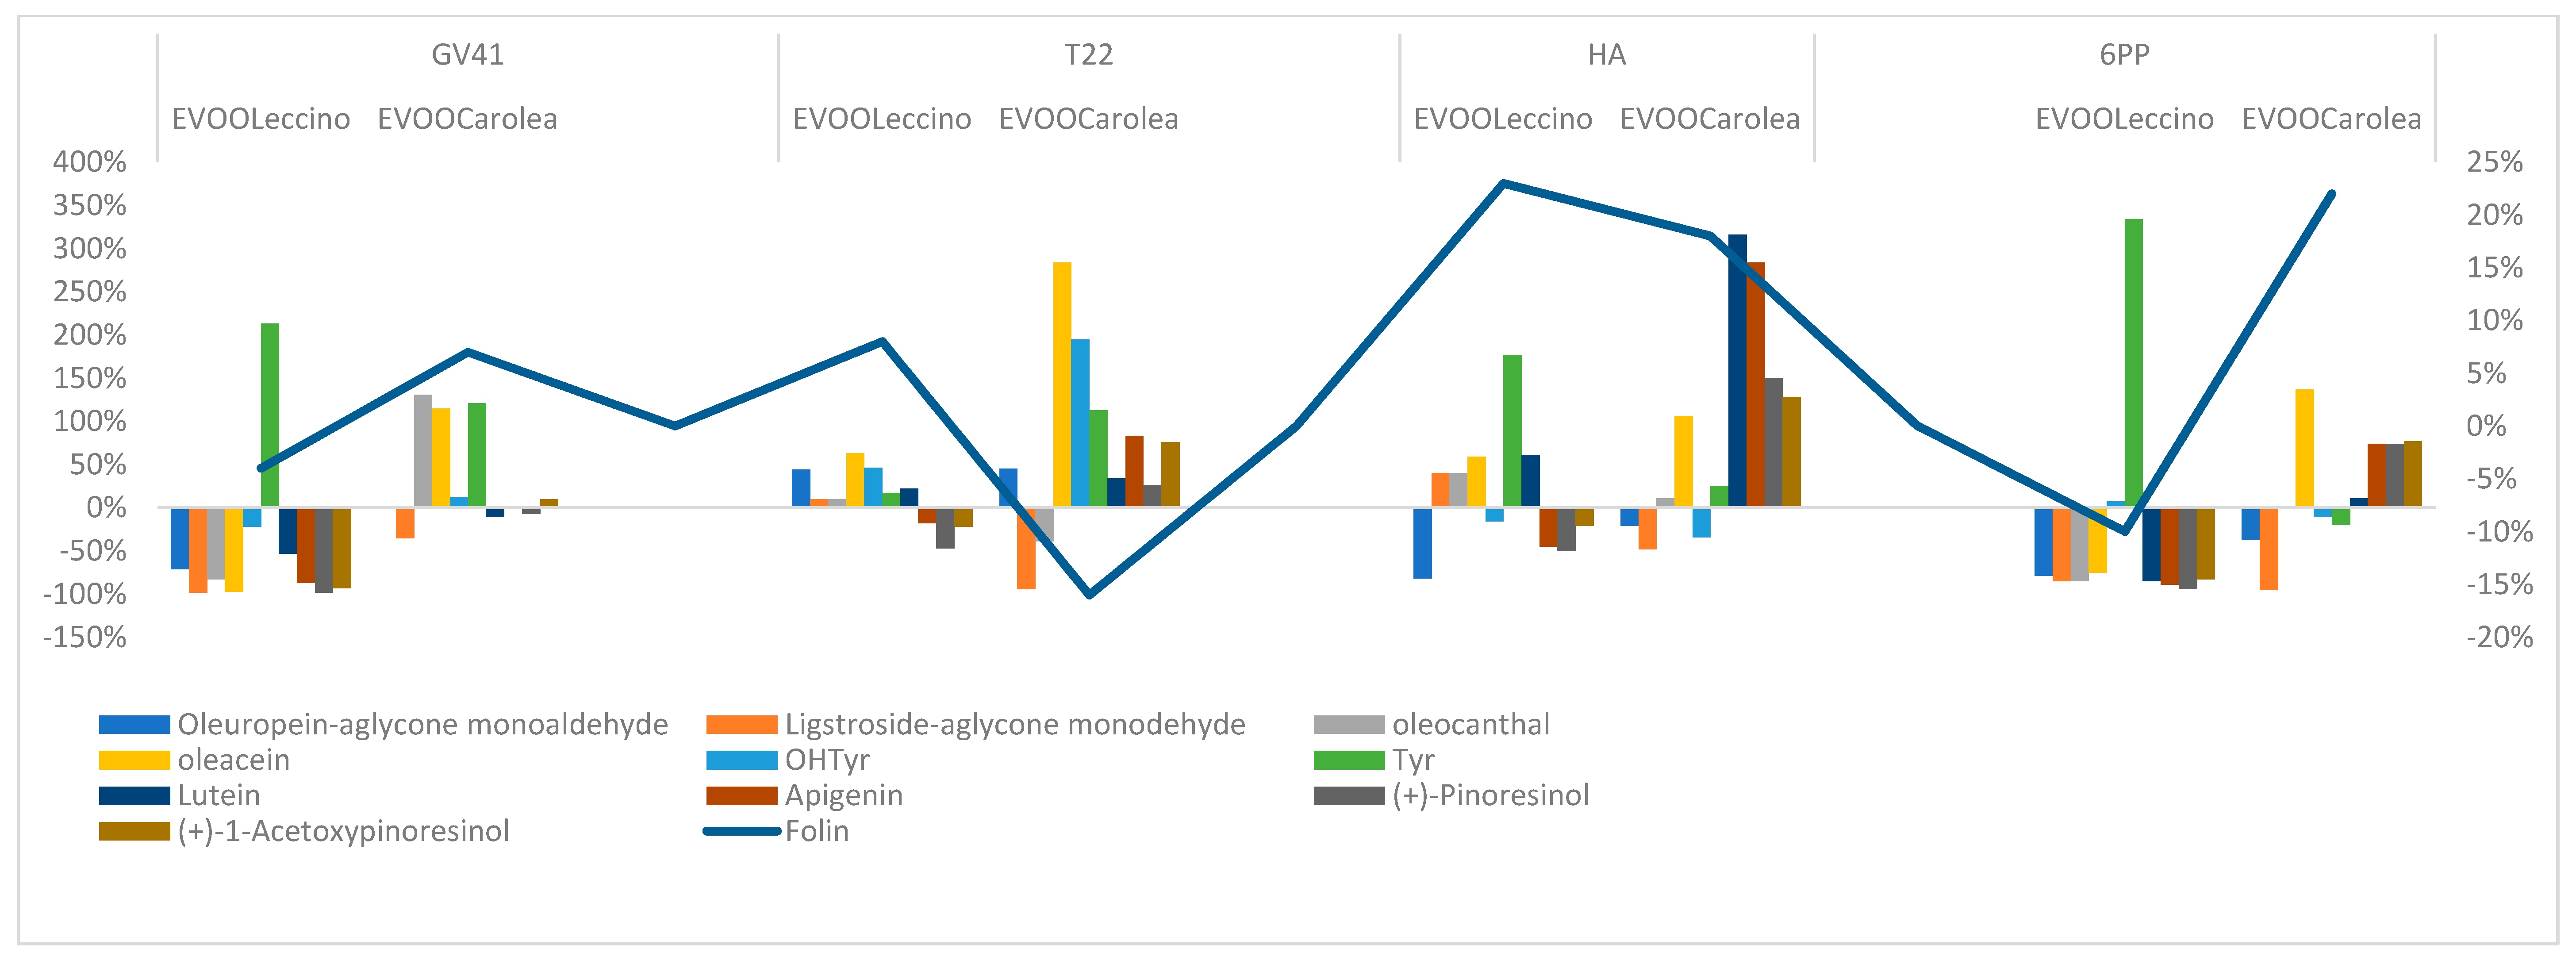
2.4. Variation (%) of the Most Representative Phenolics

T22 strain determined in both oil samples an increase of the oleuropein-aglycon mono aldehyde of 45%. In the EVOO Carolea, was shown a remarkable negative variation (%) of ligstroside decarboxymethyl-aglycone (Figure 4).
HA treatment influenced flavonoid production in both monovarietal oils. The antioxidant activity of EVOOCarolea was higher than EVOO Leccino (Figure 5).
The 6PP biostimulation interfered with the production of the flavonoids and the lignans in the olives (Figure 6).
The total phenolic content was strongly affected by variations of the concentration of oleacein, tyrosol and apigenin (Figure 7).

3. Discussion

Two monovarietal EVVOs olives were analyzed to determine the possible impact on their nutraceutical properties when biocontrol strategy was used in the fields. This goal was obtained by treating two monovarietal olive trees (Olea europaea var. Leccino and Olea europaea var Carolea) with two strains of Trichoderma (GV41 and T22), and their metabolites HA and 6PP and evaluating the total content of phenols in the oil, determining the single phenol quality and quantity and comparing these data with the antioxidant activity of the oils. A remarkable variability was found in phenolic composition between the two sets of monovarietal EVOOs analyzed. The phenolic identification was obtained by using an Orbitrap platform in MS and MS/MS levels, and phenolic quantification was performed by using a UPLC-MS technology. The quantification method was validated in terms of linearity, precision, and sensitivity. The correlation factor of the calibration curve 1 established the first one, LODs, and the LOQs confirmed method sensitivity, and the relative standard deviation (RSD) <10% validated the repeatability. Nine secoiridoids, two phenolic alcohols, two lignans, two flavonoids, and six phenolic acids were characterized comparing the mass spectra with standards, except the ligstroside whose identification occurred comparing mass data with literature data, [21] and the hydroxybenzoic acid isomers, for which the retention times and the mass spectra were used. In all olive oils, the secoiridoid derivatives were the most abundant phenols, followed by phenolic alcohols, flavonoids, and phenolic acids. The lignans and the flavonoids were in the aglycon form since they degrade during the malaxation process. A significant correlation index between secoiridoids and phenolic alcohols (Figure 3) confirmed that tyrosol and the OHtyrosol were degradation products of ligstroside and oleuropein [22]. All biostimulant treatments, increased the total polyphenol content in EVOOs, except GV41 and 6PP in the EVOO Leccino. The DPPH test and the ABTS method tested the antioxidant activity. The DPPH detected the ability of an antioxidant to transfer one electron to reduce any compound. The ABTS method determined the aptitude of the antioxidant to quench free radicals by hydrogen donation [23]. In this study, a significative correlation was found between the total phenolic content, and both tests used to determine the antioxidant activity. The DPPH measures were higher than that obtained with the ABTS test in the samples containing higher concentrations of flavonoids, O-diphenols and secoiridoids since DPPH test overestimates slow reacting antioxidants with many phenol groups as lutein, OHTyrosol and secoiridoid derivatives, able to donate hydrogen and improve radical stability by forming an intramolecular hydrogen bond between the free hydrogen of phenoxyl radicals, therefore the ABTS method is the best for the determination of the antioxidant activity in the oil [24]. The T22 biostimulation interferes above all with the production of secoiridoids in the olive. In both oil samples were found an increase of the oleuropein-aglycon mono aldehyde. A decreased concentration of ligstroside decarboxymethyl-aglycone was shown in the EVOO Carolea, probably due to transformation in its degradation product (tyrosol) (Figure 4). The biostimulation with the T22 strain enhanced the concentration of the total phenolic content of 7% in both oil samples (Figure 1 and Figure 2). This increase determines the growth of the antioxidant activity of 20% (DPPH = 22%; ABTS = 20%) in the EVOO Leccino, (Figure 2) and different measures of antioxidant activity in the EVOO Corolea, (Figure 1) according to the method used to determine it (DPPH test = 31% and ABTS test = 4%) (Figure 4), since the higher concentration of secoiridoids and flavonoids in EVOO Carolea than EVOO Leccino, were overestimated in the DPPH method. The biostimulation with HA increased the phenolic content (particularly the flavonoidic fraction) in both monovarietal oils (Figure 5). The higher concentration of flavonoids in EVOO Carolea than EVOO Leccino (Table 6), determined the overestimation in the DPPH method (Figure 5). The biostimulation with the 6PP metabolite decreased the total phenol concentration in the EVOO Leccino and enhanced it in the EVOO Corolea (Figure 1 and Figure 2). Consequently, the antioxidant activity decreased in the EVOO Leccino and improved in the EVOO Corolea. more than the control (Figure 6). The different variations of the polyphenol classes concentrations under the microbe or the microbe metabolites biostimulation (Figure 7) suggested that the nutraceutical properties [25] of the EVOO depended on the biostimulant used to grow olive trees (Figure 8). The biostimulation with T22 mainly enhanced the concentration of the secoiridoid fraction of phenols. As known, oleuropein is commercially available as a food supplement used to prevent the oxidation and the inflammatory damage, the cardiovascular and the cancer diseases, and as antiviral and antimicrobial agents [26]. Instead, the HA metabolite increased the flavonoids in the EVOOs. Luteolin has showed antitumorigenic, antimutagenic, antioxidative, immunomodulatory, and anti-inflammatory properties useful in cancer, cardiovascular diseases, and neurodegenerative pathologies prevention [27,28]. Finally, the 6PP metabolite improved lignans concentration in the EVOOs. Pinoresinol and acetoxypinoresinol intake has been related to LDL oxidation prevention, and health properties correlate to estrogen hormonal disfunction such as protection against cancer (prostate and breast) [29].

4. Materials and Methods

4.1. Study Area

This study was carried out in two experimental sites situated in Calabria, the most southern region of the Italian peninsula (ranges between 38°12′ and 40° latitude North and between 16°30′ and 17°15′ longitude East). The provinces of Calabria are: Catanzaro (CZ, regional capital), Reggio Calabria, Cosenza (CS), Crotone (KR), and Vibo Valentia (VV). The two experimental sites are in the villages of Cariati (CS), and Roccabernarda (KR). The climate of this Region is predominantly Mediterranean, temperatures are very mild, especially in the coastal plains. In the summer the heat is shared by the entire regional territory and only the altitude mitigates the heat or the breezes; peaks of over 35 °C are common. In the case of invasions of very hot African air, the temperatures exceed the 40 °C threshold. In Winter, on the other hand, temperatures remain mild with maxima greater than 10 °C on the coasts and cold in the internal areas and in the mountains, where the snow falls abundantly, and above 1000 m can persist throughout the period from December to March.

4.2. Plant Material

The possible impact of bioformulates was tested on two cultivars of Olea europaea: Leccino and Carolea. Plant material were given by Dr. Andrea Sicari (LINFA scarl, Vibo Valentia, Italy).
Plants (15 years old) in excellent nutritional and phytosanitary status with an adequate number of fruiting branches and a low ratio of wood and leaves were used for experimental purposes. The experimental field contained 20 plants split in 12 rows (3 rows per treatment). Six treatments were applied starting from February until July after plants sprouted. Each bioformulate (10−6 M HA, 10−6 M 6 PP, 106 ufc/mL GV41, and 106 ufc/mL T22) and one control sample (water treatment) were applied to the root system (drenching around the root system at 10 cm deep) and the leaves (10 L per row of which 5 L was spray and 5 L was drenching).

4.3. Fungal Material

Biological Control laboratories of the University of Naples Federico II provide the Trichoderma strains. The strains Trichoderma harzianum (T22 and GV41), and Trichoderma harzianum (M10 Trichoderma harzianum Rifai, anamorph ATCC® 20847™, (LGC Standards S.r.l., Sesto San Giovanni, Mi Italy) were maintained on potato 125 dextrose agar (HiMedia, Laboratories Mumbai, India) and shielded with sterilized mineral oil (Sigma Aldrich, St. Louis, MO, USA).

4.4. Isolation and Characterization of Harzianic Acid

The Trichoderma strains M10 was used to produce the bioactive molecules. Mycelia were inoculated into 1L of sterile potato dextrose broth (PDB, HiMedia Mumbai, India). Cultures of each strain were grown for 30 days at 25 °C, and then vacuum-filtered through filter paper (Whatman No. 4, Brentford, UK). Ethyl acetate (EtOAc) was used to extract the filtrate (2 L). Organic fractions were dried with Na2SO4 and the solvent evaporated in vacuum at 35 °C. The red residue obtained from M10 was dissolved in CHCl3 and extracted three-times with NaOH 2M. Harzianic acid (HA) then precipitated with HCl 2M. The solid was recovered (135mg), solubilized and subjected to RP-18 vacuum chromatography (20 g Si gel RP-18, 40–63μm Sigma Aldrich, St. Louis, MO), eluting with a gradient of methanol (MeOH): H2O:CH3CN (0.5:9:0.5/v:v:v to 10:0:0/v:v:v). After separation, approximately 45mg of pure HA was collected. The compounds were detected spectrophotometrically on TLC (UV: λ 254 or λ 366 nm) and by dipping the plates in a 5% (w/v) ethanol solution of 2M H2SO4 and heating at 110 °C for 10min. The purified metabolites were characterized by NMR (Bruker AM 400 spectrometer; Bruker, Billerica, Massachusetts, USA) operating at 400 (1H) MHz using residual and deuterated solvent peaks as a reference standard or by LC-MS/MS QTOF (Agilent Technologies, Santa Clara, CA, USA) with a dual ESI (Electrospray Ionization) source, coupled to a DAD (Diode-Array Detection; Agilent Technologies, Santa Clara, CA, USA).

4.5. Oil Production

The oils samples were cold produced at a semi-industrial scale in a local two-phase mill. It was kept at a constant temperature (10 ± 2 °C) in dark bottles without headspace until analysis.

4.5.1. Chemicals

All the chemicals used are from Sigma Aldrich St. Louis, MO, USA, unless specified differently.

4.5.2. Extraction of Phenolic Compounds from Olive Oil

The method proposed by Vasquez Roncero [32] was used. In 25 mL hexane were put 25 g oil. 15 mL methanol:water (3:2 v/v) extracted the polar in three times. The extracts combined were treated once with 25 mL hexane. The solvent was evaporated in a rotary evaporator (Büchi, Switzerland) at 40° C. The insoluble residue was abundantly washed with CH3OH and filtered through 0.2 μm nylon filter and immediately stored at −18 °C until analysis.

4.5.3. Ultra High Pressure Liquid Chromatograph

Polyphenol compounds were isolated and quantified by an Ultra High Pressure Liquid Chromatograph (UHPLC, Thermo Fisher Scientific, Waltham, MA, USA) equipped with a Dionex Ultimate 3000 degassing system, a quaternary UHPLC pump (Thermo Fisher Scientific, Waltham, MA, USA) working at 1250 bar, and a column (Thermo Scientific, Waltham, MA, USA) Accucore aQ 2.6 µm (100 × 2.1 mm) in a thermostated compartment (T = 30 °C). 5 µL of the sample was injected. The eluent phase consists of a gradient programmed as follows: 0 to 5 min −5% of phase B, 25 min −40% of phase B, 25.1 min −100% of phase B, 27 min −100% of phase B, 27.1 min −5% of phase B, 35 min −5% of phase B, 31 min −0% of phase B where phase A was H2O 0.1% of acetic acid and phase B was acetonitrile. The flow rate was 0.4 mL/min.

4.6. Mass Spectrometry Analysis

A Q Exactive Orbitrap LC-MS/MS (Thermo Fisher Scientific, Waltham, MA, USA) was used for experimental purposes provided of an ESI source (HESI II, Thermo Fisher Scientific, Waltham, MA, USA) [spray voltage −3.0 kV, capillary temperature 200 °C, auxiliary gas (N2 > 95%) 15, sheath gas (N2 > 95%) 30, auxiliary gas heater temperature 305 °C and S-lens RF level 50]. The mass detection was obtained in two acquisition modes: negative-ion modes (full scan; mass resolving power 35,000 full width at half maximum (at m/z 200), the automatic gain control target 1 × 10⁵ ions for a maximum injection time of 200 ms, and scan range 100–1500 m/z, scan rate 2 s−1) and targeted selected ion monitoring [15 s-time window, quadrupole isolation window 1.2 m/z, and resolution power 35,000 full width at half maximum (at m/z 200)].

4.7. Validation of the Method Used to Quantify Single Phenols

Method was validated following AOAC instructions (AOAC 2012) [33]. The parameters analyzed were linearity, LOD, LOQ, repeatability, and reproducibility. Three points (in triplicate) were used to build the calibration curves of each compound. Method linearity was obtained from the regression coefficient of the calibration curve LOD (Limits of detection) and LOQ limits of quantification were calculated from the regression curve. Nine different concentrations of each phenolic standard three times gave intraday repeatability.
LODs = 3   ×   standard   deviation a n g u l a r   c o e f f i c i e n t   ;   LOQs = 10   ×   standard   deviation a n g u l a r   c o e f f i c i e n t

4.8. Total Phenolic Compounds

The total polyphenols amount was evaluated by using the Folin–Ciocalteau’s assay as reported by Singleton and Rossi (1965) [34]. In a falcon (15 mL), 2.5 mL dd H2O and 625 µL methanolic extract, 625 µL of Folin–Ciocalteau’s phenol reagent were shaken. After 6 min, 6.25 mL of 7% Na2CO3 solution was added to the mixture. The solution was diluted with 5 mL dd H2O and mixed. The absorbance (Lambda 25, PerkinElmer, Italy) of reagent blank was determined at 760 nm by spectrophotometer after incubation for 90 min at room temperature. All biological replicates of samples were analyzed in triplicate. Total phenolic content was expressed as mg gallic equivalents (GAE)/kg FW.

4.9. Antioxidant Activity Measurements

DPPH method. 2,2-Diphenyl-1-picrylhydrazyl (DPPH) radical-scavenging capacity was measured using the method described by Brand-Williams et al. (1995) [35]. Fraction aliquots (20 μL) were added to 3 mL of DPPH solution (6 × 10⁻⁵ mol/L) and the absorbance was determined at λ517 nm every 5 min until the steady state (Lambda 25, PerkinElmer, Italy). Calibration curve was obtained using 6-Hydroxy-2,5,7,8-tetramethylchroman-2-carboxylic acid (Trolox), a water-soluble analog of α-tocopherol, as standard and results were expressed as mmol Trolox equivalent (TE) kg−1 FW. All biological replicates of samples were analyzed in triplicate.
ABTS method. 2,2′-azinobis (3-Ethylbenzothiazoline-6-sulfonic acid) (ABTS) procedure modified from Re et al. was used (1999) [36]. A concentrate solution of the reagent (stock solution) was prepared dissolving 9.6 mg of ABTS in 2.5 mL of water and adding 44 mL of a solution made by dissolving 37.5 mg of potassium persulphate, K2S2O8, in 1 mL of water. The stock solution was kept in the dark at 4 °C for 8 h before use; the work solution was obtained from the stock solution by dilution using a 1:88 (v/v) ratio. Dilution was adjusted depending on the measured absorbance at λ734 nm (A734) in the work solution, until a value between 0.7 and 0.8. Subsequently, 100 μL of sample and 1 mL of work solution were added, and A734 was measured exactly after 2 min and 30 s. (Lambda 25, PerkinElmer, Italy). Calibration curve was obtained using 6-Hydroxy-2,5,7,8-tetramethylchroman-2-carboxylic acid (Trolox), a water-soluble analog of α- tocopherol, as standard and results were expressed as mmol Trolox equivalent (TE) kg−1 FW. All biological replicates of samples were analyzed in triplicate.

5. Conclusions

Our results confirmed the ability of the Trichoderma harzianum (strain T22) and its metabolites (6PP and HA) in the defense system of the Olea europaea tree and demonstrate that the ABTS test is the preferred method for determining the antioxidant activity in the EVOO. To the best of our knowledge, the present work is the first report that correlates the nutraceutical properties of the EVOO to a specific biostimulation method used in the field. Our results suggest new possibilities of using Thricoderma and its metabolites to select the nutraceutical properties of the EVOO and recommend the use of Thricoderma metabolites in olive tree cultivation to avoid some of the limitations related to the application of living microbes.

Author Contributions

Formal analysis and writing—original draft preparation, I.D.; data curation, G.G.; data curation, A.G.; formal analysis, F.L.F. and P.C.; investigation A.S. and M.L.; formal analysis and writing, F.V.; project administration, A.R. All authors have read and agreed to the published version of the manuscript.

Funding

The following projects supported this work: MIUR (Ministry of Education, University and Research)—PON (National Operational Program) [grant number Linfa 03PE_00026_1], [grant number Marea 03PE_00106]; POR (Regional Operational Program) FESR ((European Regional Development Fund) Campania 2014–2020 [grant number Bioagro NR. onc3-003189].

Conflicts of Interest

The authors declare no conflicts of interest.

References

  1. Servili, M.; Sordini, B.; Esposto, S.; Urbani, S.; Veneziani, G.; di Maio, I.; Selvaggini, R.; Taticchi, A. Biological activities of phenolic compounds of extra virgin olive oil. Antioxidants 2014, 3, 1–23. [Google Scholar] [CrossRef] [Green Version]
  2. Rigacci, S.; Stefani, M. Nutraceutical properties of olive oil polyphenols. An itinerary from cultured cells through animal models to humans. Int. J. Mol. Sci. 2016, 17, 843. [Google Scholar] [CrossRef] [Green Version]
  3. Fabiani, R.; Rosignoli, P.; de Bartolomeo, A.; Fuccelli, R.; Servili, M.; Montedoro, G.F.; Morozzi, G. Oxidative DNA damage is prevented by extracts of olive oil, hydroxytyrosol and other olive phenolic compounds in human blood mononuclear cells and HL60 cells. J. Nutr. 2008, 138, 1411–1416. [Google Scholar] [CrossRef] [Green Version]
  4. Tundis, R.; Loizzo, M.; Menichini, F.; Statti, G.; Menichini, F. Biological and pharmacological activities of iridoids: Recent developments. Mini Rev. Med. Chem. 2008, 8, 399–420. [Google Scholar] [CrossRef]
  5. Dini, I.; Laneri, S. Nutricosmetics: A brief overview. Phytother. Res. 2019, 33, 3054–3063. [Google Scholar] [CrossRef]
  6. Tafuri, S.; Cocchia, N.; Carotenuto, D.; Vassetti, A.; Staropoli, A.; Mastellone, V.; Peretti, V.; Ciotola, F.; Albarella, S.; Del Prete, C.; et al. Chemical Analysis of Lepidium meyenii (Maca) and Its Effects on Redox Status and on Reproductive Biology in Stallions. Molecules 2019, 24, 1981. [Google Scholar] [CrossRef] [Green Version]
  7. Alarcón de la Lastra, C.; Barranco, M.D.; Motilva, V.; Herrerías, J.M. Mediterranean diet and health: Biological importance of olive oil. Curr. Pharm. Des. 2001, 10, 933–950. [Google Scholar] [CrossRef] [Green Version]
  8. Servili, M.; Selvaggini, R.; Esposto, S.; Taticchi, A.; Montedoro, G.; Morozzi, G. Health and sensory properties of virgin olive oil hydrophilic phenols: Agronomic and technological aspect of production that affect their occurence in the oil. J. Chromatogr. 2004, 1054, 113–127. [Google Scholar] [CrossRef]
  9. EC (2017) EU funding under the new CAP. Agriculture and Rural Development. Organic Farming. Available online: https://ec.europa.eu/agriculture/organic/eu-funding/eu-funding-and-the-new-cap_en. (accessed on 27 July 2017).
  10. Harman, G.E.; Howell, C.R.; Viterbo, A.; Chet, I.; Lorito, M. Trichoderma species, opportunistic avirulent plant symbionts. Nat. Rev. Microbiol. 2004, 2, 43–56. [Google Scholar] [CrossRef] [PubMed]
  11. Lorito, M.; Woo, S.L.; Harman, G.E.; Monte, E. Translational research on Trichoderma: From Omics to the field. Ann. Rev. Phytopathol. 2010, 48, 395–417. [Google Scholar] [CrossRef] [PubMed] [Green Version]
  12. Woo, S.L.; Ruocco, M.; Vinale, F.; Nigro, M.; Marra, R.; Lombardi, N.; Pascale, A.; Lanzuise, S.; Manganiello, G.; Lorito, M. Trichoderma-based products and their widespread use in agriculture. Open Mycol. J. 2014, 8, 71–126. [Google Scholar] [CrossRef] [Green Version]
  13. Reino, J.L.; Guerrero, R.F.; Hernandez-Galan, R.; Collado, I.G. Secondary metabolites from species of the biocontrol agent Trichoderma. Phytochem. 2008, 7, 89–123. [Google Scholar] [CrossRef]
  14. Pascale, A.; Vinale, F.; Manganiello, G.; Nigro, M.; Lanzuise, S.; Ruocco, M.; Marra, R.; Lombardi, N.; Woo, S.L.; Lorito, M. Trichoderma and its secondary metabolites improve yield and quality of grapes. Crop Prot. 2017, 92, 176–181. [Google Scholar] [CrossRef] [Green Version]
  15. Agosin, E.; Aguilera, J.M. Industrial production of active propagules of Trichoderma for agricultural use. In Trichoderma and Gliocladium., Enzymes, Biological Control and Commercial Applications; Harman, G.E., Kubicek, C.P., Eds.; Taylor & Francis Ltd.: London, UK, 1998; Volume 2, pp. 205–227. [Google Scholar]
  16. Vinale, F.; Nigro, M.; Sivasithamparam, K.; Flematti, G.; Ghisalberti, E.L.; Ruocco, M.; Varlese, R.; Marra, R.; Lanzuise, S.; Eid, A.; et al. Harzianic acid: A novel siderophore from Trichoderma harzianum. FEMS Microbiol. Lett. 2013, 347, 123–129. [Google Scholar]
  17. Keswani, C.; Singh, H.B.; Hermosa, R.; García-Estrada, C.; Caradus, J.; He, Y.W.; Aichour, S.M.; Glare, T.R.; Borriss, R.; Vinale, F.; et al. Antimicrobial secondary metabolites from agriculturally important fungi as next biocontrol agents. Appl. Microb. Biotech. 2019, 103, 9287–9303. [Google Scholar] [CrossRef]
  18. Mastouri, F.; Bjorkman, T.; Harman, G.E. Trichoderma harzianum enhances antioxidant defense of tomato seedlings and resistance to water deficit. Mol. Plant Microbe Interact. 2012, 25, 1264–1271. [Google Scholar] [CrossRef] [PubMed] [Green Version]
  19. Rouphael, Y.; Carillo, P.; Colla, G.; Fiorentino, N.; Sabatino, L.; El-Nakhel, C.; Giordano, M.; Pannico, A.; Cirillo, V.; Shabani, E.; et al. Appraisal of combined applications of trichoderma virens and a biopolymer-based biostimulant on lettuce agronomical, physiological, and qualitative properties under variable regimes. Agronomy 2020, 10, 196. [Google Scholar] [CrossRef] [Green Version]
  20. Woo, S.L.; Scala, F.; Ruocco, M.; Lorito, M. The molecular biology of the interactions between Trichoderma spp., phytopathogenic fungi and plants. Phytopathology 2006, 96, 181–185. [Google Scholar] [CrossRef] [Green Version]
  21. Klen, T.J.; Wondra, A.G.; Vrhovšek, U.; Mozetič, V.B. Phenolic profiling of olives and olive oil process-derived matrices using UPLC-DAD-ESI-QTOF-HRMS analysis. J. Agric. Food Chem. 2015, 63, 3859–3872. [Google Scholar] [CrossRef]
  22. Dini, I.; Graziani, G.; Fedele, F.L.; Sicari, A.; Vinale, F.; Castaldo, L.; Ritieni, A. Effects of Trichoderma biostimulation on the phenolic profile of extra-virgin olive oil and olive oil by-products. Antioxidants 2020, 9, 284. [Google Scholar] [CrossRef] [Green Version]
  23. Prior, R.L.; Wu, X.; Schaich, K. Standardized methods for the determination of antioxidant capacity and phenolics in foods and dietary supplements. J. Agric. Food Chem. 2005, 53, 4290–4302. [Google Scholar] [CrossRef] [PubMed]
  24. Benavente-Garcia, O.; Castillo, J.; Lorente, J.; Ortuno, A.; Del Rio, J.A. Antioxidant activity of phenolics extracted from Olea europaea L. leaves. Food Chem. 2000, 68, 457–462. [Google Scholar] [CrossRef]
  25. Dini, I.; Seccia, S.; Senatore, A.; Coppola, D.; Morelli, E. Development and Validation of an Analytical Method for Total Polyphenols Quantification in Extra Virgin Olive Oils. Food Anal. Methods 2020, 13, 457–464. [Google Scholar] [CrossRef]
  26. Omar, S.H. Oleuropein in olive and its pharmacological effects. Sci. Pharm. 2010, 78, 133–154. [Google Scholar] [CrossRef] [Green Version]
  27. Montesano, D.; Rocchetti, G.; Cossignani, L.; Senizza, B.; Pollini, L.; Lucini, L.; Blasi, F. Untargeted Metabolomics to Evaluate the Stability of Extra-Virgin Olive Oil with Added Lycium barbarum Carotenoids during Storage. Foods 2019, 8, 179. [Google Scholar] [CrossRef] [Green Version]
  28. Xu, H.; Linn, B.S.; Zhang, Y.; Ren, J. A review on the antioxidative and prooxidative properties of luteolin. React. Oxyg. Species 2019, 7, 136–147. [Google Scholar] [CrossRef] [Green Version]
  29. López-Biedma, A.; Sánchez-Quesada, C.; Delgado-Rodríguez, M.; Gaforio, J.J. The biological activities of natural lignans from olives and virgin olive oils: A review. J. Funct. Foods 2016, 26, 36–47. [Google Scholar] [CrossRef]
  30. Obied, H.K.; Prenzler, P.D.; Ryan, D.; Servili, M.; Taticchi, A.; Esposto, S.; Robards, K. Biosynthesis and biotransformations of phenol-conjugated oleosidic secoiridoids from Olea europaea L. Nat. Prod. Rep. 2008, 25, 1167–1179. [Google Scholar] [CrossRef]
  31. Marín, L.; Gutiérrez-del-Río, I.; Yagüe, P.; Manteca, Á.; Villar, C.J.; Lombó, F. De novo biosynthesis of apigenin, luteolin, and eriodictyol in the Actinomycete Streptomyces albus and production improvement by feeding and spore conditioning. Front. Microbiol. 2017, 8, 921. [Google Scholar] [CrossRef] [Green Version]
  32. Vázquez Roncero, A. Les polyphe’nols de l’huile d’olive et leur influence sur les caracte’ristiques de l’huile. Rev Franç Corps Gras 1978, 25, 21–26. [Google Scholar]
  33. AOAC (2012) Appendix F: cGuidelines for Standard Method Performance Requirements (SMPR). AOAC Official Methods of Analysis. Available online: http://www.eoma.aoac.org/app_f.pdf. (accessed on 1 May 2020).
  34. Singleton, V.L.; Rossi, J.A. Colorimetry of total phenolics with phosphmolybdic phospotungstic acid reagents. A J. Enol. Vitic. 1965, 16, 144–158. [Google Scholar]
  35. Brand-Williams, W.; Cuvelier, M.E.; Berset, C. Use of a free radical method to evaluate antioxidant activity. Lwt – Food Sci. Technol. 1995, 28, 25–30. [Google Scholar] [CrossRef]
  36. Re, R.; Pellegrini, N.; Proteggente, A.; Pannala, A.; Yang, M.; Rice-Evans, C. Antioxidant activity applying an improved ABTS radical cation decolorization assay. Free Radic. Biol. Med. 1999, 26, 1231–1237. [Google Scholar] [CrossRef]
Sample Availability: Samples of the oil and phenolic extracts are available from the authors.
Figure 1. Phenolic content and antioxidant activity in the EVOO obtained by Carolea olives.
Molecules 25 02345 g001
Figure 2. Phenolic content and antioxidant activity in the EVOO obtained by Leccino olives.
Molecules 25 02345 g002
Figure 3. Correlation graphs of secoiridoids and phenolic alcohols.
Molecules 25 02345 g003
Figure 4. Variation (%) of the most representative secoiridoids, their degradation products, and antioxidant activity in EVOOs obtained from olive tree treated with T22 strains.
Molecules 25 02345 g004
Figure 5. Variation (%) of flavonoids and antioxidant activity measured by DPPH test in EVOOs obtained from olive tree treated with HA.
Molecules 25 02345 g005
Figure 6. Variation (%) of flavonoids, lignans and antioxidant activity in the EVOO samples obtained from olive tree treated with 6PP.
Molecules 25 02345 g006
Figure 7. Variation (%) of the phenolic class of compounds and total phenol content in the EVOO samples.
Molecules 25 02345 g007
Figure 8. Interferences of Trichoderma T22 and its metabolites (HA and 6PP) on Shikimate pathway [23,30,31].
Molecules 25 02345 g008
Table 1. Analytical parameters of phenolics identification; all compounds were monitored in negative mode.
Phenolic CompoundsRT (min)FormulaTheoretical m/z of Deprotonated Molecular Ions [M − H]Experimental m/z of Deprotonated Molecular ions [M − H]Calculated Errors ∆ppmFragmentsCollision Energy
(eV)
Phenolic acids
Vanillic acid4.30C8H8O4167.03498167.035221.44152.0114320
p-Coumaric acid9.71C9H10O5163.04007163.040281.29119.0502320
Cinnamic acid11.54C9H8O2147.04515147.045361.43103.0450120
Ferulic acid11.81C10H10O4193.05063193.050841.09178.0268520
4-Hydroxybenzoic acid2.57C7H6O3137.02442137.024561.0293.0343112
3-Hydroxybenzoic acid2.88C7H6O3137.02442137.024581.1793.0343112
Flavonoids
Apigenin19.12C15H10O5269.04555269.045971.56225.0559235
Luteolin19.07C15H10O6285.04046285.041062.10133.0294030
Lignans
(+) Pinoresinol17.00C20H22O6357.13436357.134871.43151.0396140
(+) 1-Acetoxypinoresinol19.10C22H24O8415.13984415.140070.55415.1382140
Phenolic Alcohols
Hydroxytyrosol (3,4 DHPEA)1.60C8H10O3153.05572153.055800.52123.0456112
Tyrosol (p-HPEA)2.75C8H10O2137.06080137.060961.17119.0502212
Secoiridoids
Elenolic acid13.14C11H14O6241.07176241.072121.49209.0457310
Oleacein (3.4 DHPEA-EDA)16.14C17H20O6319.11871319.118980.85301.108215
Oleuropein16.69C25H32O13539.17701539.177671.22377.1239320
Ligstroside18.25C25H32O12523.18210523.182791.32361.1291412
Ligstroside-decarboxymethyl aglycone oleocanthal(p-HPEA-EDA)18.59C17H20O5303.12380303.124412.01301.108212
Secologanoside19.49C16H21O11389.1092 389.1092580.59345.1195 12
Oleuropein-aglycone mono-aldehyde (3.4 DHPEA-EA)21.25C19H22O8377.12419377.124420.61345.0979012
p-HPEA-EA (Ligstroside- aglycone monoaldehyde)21.59C19H2207361.12145361.12141−0.11291.112221
Table 2. Validation parameters of the quantification method.
Phenolic CompoundsLinearity
(mg/L)
R2LOD
(mg/L)
LOQ
(mg/L)
Intraday RSD
% (n = 3), 50 mg/L
Phenolic Acids
Vanillic acid1–500.8870.2000.6001.1
p-Coumaric acid1−501.0000.1000.3001.8
Cinnamic acid1−500.9910.2000.6000.9
4-Hydroxybenzoic acid1−500.9980.2070.6220.9
3-Hydroxybenzoic acid1−500.9950.2050.6221.1
Flavonoids
Apigenin0.5−500.8990.0660.2002.1
Luteolin0.5−500.9910.0660.2001.4
Lignans
(+) Pinoresinol1−500.9990.020.0600.5
(+)1-Acetoxypinoresinol1−500.8990.2330.7001.5
Phenolic Alcohols
3.4 DHPEA (Hydroxytyrosol)1−500.9920.6662.0003.0
p-HPEA (Tyrosol)1−500.9910.0400.1331.6
Secoiridoids
Elenolic acid1−500.9910.3331.0000.7
Oleuropein1−500.9910.1660.5005.0
Ligstroside1−500.9910.1660.5004.0
Oleocanthal1−500.8990.4161.2503.0
Secologanoside1−500.9670.3331.0002.1
3.4-DHPEA-EA (Oleuropein-aglycone monoaldehyde)1−500.9981.0003.0002.1
p-HPEA-EA (Ligstroside- aglycone monoaldehyde)1−500.9990.0330.1000.7
3.4 DHPEA-EDA (Oleacein)1−500.9910.0330.1001.1
Table 3. Content of secoiridoids in EVOO (mg/kg).
OleuropeinLigstrosideSecologanosideElenolic Acidp-HPEA-EA3.4-DHPEA-EA (Oleuropein-aglycone monoaldehyde)p- HPEA-EDA (Ligstroside- decarboxymethyl aglycone)3.4-DHPEA-EDA
(oleacein)
Leccino cultivar
T220.051 ± 00.016 ± 0.0040.022 ± 0.0030.782 ± 0.006113.34 ± 0.234151.672 ± 0.018113.34 ± 0.234368.416 ± 5.474
GV410.062 ± 0.0020.002 ± 0.0010.012 ± 0.0010.176 ± 0.00217.71 ± 0.01930.307 ± 0.50317.71 ± 0.0196.207 ± 0.09
HA0.053 ± 0.0030.015 ± 0.0020.083 ± 0.0081.317 ± 0.023144.889 ± 1.34918.578 ± 2.467144.889 ± 1.349359.45 ± 2.078
6PP0.053 ± 0.0010.001 ± 0.0010.004 ± 0.0010.126 ± 0.00215.661 ± 0.34322.335 ± 0.4115.661 ± 0.34356.547±0.319
Control0.046 ± 0.0030.007 ± 0.0010.01 ± 02.704 ± 0.144103.342 ± 0.553105.488 ± 0.506103.342 ± 0.553226.173 ± 0.065
Carolea cultivar
T220.056 ± 0.0020.012 ± 0.0010.011 ± 02.511 ± 0.014139.98 ± 1.635305.157 ± 1.554139.98 ± 1.635114.526 ±0.321
GV410.064 ± 0.0030.027 ± 00.118 ± 0.0011.535 ± 0.004249.437 ± 1.244208.585 ± 3.183149.437 ± 1.24455.067 ± 0.1
HA0.069 ± 0.0010.023 ± 0.0020.181 ± 0.0055.555 ± 0.071119.875 ± 0.849166.79 ± 0.291119.875 ± 0.84952.865 ± 0.406
6PP0.053 ± 0.0010.001 ± 0.0010.004 ± 0.0012.226 ± 0.01108.81 ± 1.891133.9 ± 1.021108.81 ± 1.89160.665 ± 0.169
Control0.377 ± 0.4310.038 ± 0.0060.124 ± 0.0091.28 ± 0.237108.172 ± 15.044210.729 ± 6.933228.172 ± 15.04425.634 ± 6.69
Table 4. Content of phenolic alcohols in EVOO (mg/kg).
3.4 DHPEA (Hydroxytyrosol)p-HPEA (Tyrosol)
Leccino cultivar
T220.928 ± 0.008155.108 ± 0.731
GV410.498 ± 0.016164.541 ± 0.932
HA0.535 ± 0.01146.029 ± 0.881
6PP0.683 ± 0.005228.288 ± 2.377
Control0.636 ± 0.00752.657 ± 0.562
Carolea cultivar
T220.308 ± 0.00772.356 ± 0.893
GV410.294 ± 0.01474.904 ± 3.824
HA0.174 ± 0.00242.38 ± 0.75
6PP0.238 ± 0.00327.106 ± 0.901
Control0.263 ± 0.00933.916 ± 0.403
Table 5. Content of lignans in EVOO (mg/kg).
(+)-Pinoresinol(+)-1-Acetoxypinoresinol
Leccino cultivar
T220.855 ± 0.02438.972 ± 1.817
GV410.033 ± 0.0013.655 ± 0.108
HA0.799 ± 0.00739.227 ± 0.554
6PP0.104 ± 0.0038.715 ± 0.321
Control1.608 ± 0.0149.807 ± 0.558
Carolea cultivar
T220.376 ± 0.00133.433 ± 0.882
GV410.276 ± 0.00320.821 ± 0.511
HA0.744 ± 0.0243.291 ± 0.269
6PP0.517 ± 0.00533.547 ± 0.516
Control0.298 ± 0.06318.967 ± 0.461
Table 6. Content of flavonoids in EVOO (mg/kg).
LuteolinApigenin
Leccino cultivar
T220.634 ± 0.0050.075 ± 0.001
GV410.244 ± 0.0120.012 ± 0
HA0.835 ± 0.0090.086 ± 0.001
6PP0.08 ± 0.0020.01 ± 0
Control0.52 ± 0.0150.091 ± 0
Carolea cultivar
T222.749 ± 0.0090.188 ± 0.007
GV411.841 ± 0.0040.102 ± 0.001
HA8.505 ± 0.0020.395 ± 0.005
6PP2.261 ± 0.0470.179 ± 0.003
Control2.045 ± 0.3460.103 ± 0.01
Table 7. Content of phenolic acids in EVOO (mg/kg).
4-Hydroxy Benzoic Acid3-Hydroxy Benzoic AcidVanillic Acidp-Coumaric AcidCinnamic AcidFerulic Acid
Leccino cultivar
T220.419 ± 0.0130.031 ± 0.0080.356 ± 0.030284 ± 0.0020.143 ± 0.0020.144 ± 0.004
GV410.027 ± 0.0020.02 ± 0.0020.08 ± 0.0010.109 ± 0.0050.023 ± 0.0010.036 ± 0.001
HA0.501 ± 0.0130.055 ± 0.010.599 ± 0.0110.373 ± 0.0040.165 ± 0.0030.179 ± 0.002
6PP0.044 ± 0.0010.007 ± 00.057 ± 0.0010.036 ± 0.0010.018 ± 0.0010.019 ± 0
Control0.56 ± 0.0070.075 ± 0.0041.23 ± 0.0660.381 ± 0.0070.176 ± 0.0010.32 ± 0.005
Carolea cultivar
T220.166 ± 0.0010.218 ± 0.0041.142 ± 0.0061.23 ± 0.0040.361 ± 0.0140.38 ± 0.003
GV41 0.226 ± 0.0030.139 ± 0.0050.698 ± 0.0020.824 ± 0.0020.196 ± 0.0010.294 ± 0.003
HA 0.345 ± 0.0060.437 ± 0.0082.527 ± 0.0323.805 ± 0.0010.759 ± 0.0090.888 ± 0.011
6PP0.25 ± 0.0080.174 ± 0.0021.013 ± 0.0041.012 ± 0.0210.344 ± 0.0050.313 ± 0.001
Control 0.308 ± 0.0450.119 ± 0.0030.583 ± 0.1080.915 ± 0.1550.197 ± 0.0190.307 ± 0.007

