Abstract
We have previously demonstrated that singlet oxygen photosensitization abilities of Zn(II) phthalocyanines (Zn(II)Pcs) are enhanced through α-functionalization with bulky fluorinated substituents (i.e., bis(trifluoromethyl)phenyl units) at facing positions of ABAB Zn(II)Pcs, where A and B refer to differently functionalized isoindoles. In this work, we have prepared the Zn(II)Pc ABAB 1 endowed with hydrophilic triethylene glycol monomethyl ether (i.e., at the A isoindoles) to provide solubility in aqueous media, together with its A3B and A4 counterparts, and compared their ability to behave as photosensitizers for photodynamic therapy. All photophysical data, aggregation studies and preliminary in vitro biological assays in cell cultures of SCC-13 (squamous cell carcinoma) and HeLa (cervical cancer cells), have proved ABAB 1 as the best photosensitizer of the series.
1. Introduction
Phthalocyanines (Pcs) stand out for their chemical stability, versatility, and propensity to generate reactive oxygen species (ROS) when photoexcited with light of the far red region of the UV–Vis spectrum [1]. These properties make Pcs interesting for their application in medicine as photosensitizers (PS) for photodynamic therapy (PDT) against cancer [2]. Owing to their extended π-conjugation, Pcs usually exhibit high aggregation tendency and solvophobic effects, forming oligomers in solution [3,4]. This high level of aggregation affects their photochemical and photophysical properties, which results in their photodynamic inactivation, avoiding ROS and singlet oxygen (1O2) generation and diffusion. Yet, aggregation tendency is not only their unique weakness, but also their inherent insolubility in water (which is crucial in order to reach the therapeutic target). These two facts together restrict drastically Pcs for in vivo application as PS. In this context, the choice of adequate substituents is decisive to achieve solubility in aqueous media and hinder their aggregation. Hydrophilic groups can be introduced to reach water solubility [5], whereas aggregation can be reduced or avoided by the introduction of bulky substituents in the Pc [6]. Among the different metallic Pcs used for PDT, Zn(II)Pcs stand out as one of the most promising, as they present high efficiencies in the generation of 1O2 [7,8,9,10]. Recently, our research group has described new paradigmatic ABAB Zn(II)Pcs (with A and B coding for differently functionalized isoindole constituents) that show both hindered aggregation and notably high 1O2 quantum yield (ΦΔ) values, featuring also chemical flexibility to incorporate additional functionalization that affords, for instance, water solubility [6]. For that purpose, a bulky phthalonitrile precursor endowed with bis(trifluoromethyl)phenyl units is used to avoid aggregation in the target ABAB Zn(II)Pc, but also to hamper its self-condensation, and thus force its cross-condensation with other phthalonitrile [11], which can be functionalized with hydrophilic groups.
The use of polyethylene glycol (PEG) chains is a popular approach to enhance the biocompatibility of hydrophobic drugs in general [12], and of PDT agents in particular. Among other advantages, PEG chains lead to a prolonged blood-circulating lifetime, allows for the minimization of nonspecific uptake and favors the enhanced permeability and retention (EPR) effect. All that features combined can result in an elevated concentration of the drug at the tumor site [13]. From a chemical point of view, PEG chains have proved to enhance the solubility in a variety of solvents, including nonpolar ones, aprotic polar solvents like DMSO, and protic polar solvents such as water [14,15]. Several Pcs functionalized with PEG chains of different length as peripheral [13,15,16,17] or axial groups [18,19] have shown solubility in biological media, and some of them have been studied as PS for PDT [20,21].
Herein, we report on the synthesis and characterization of a series of triethylene glycol (TEG)-containing Zn(II)Pcs, namely ABAB-1, A3B-1 and A4-1, the study of their 1O2 generation capabilities, and preliminary biological assays to determine their potential as PS for PDT. The target Pcs have been synthesized following two different synthetic pathways: (i) a divergent route that allows to obtain generic ABAB and A3B Zn(II)Pcs functionalized with phenolic groups (ABAB-2 and A3B-2 Zn(II)Pcs in Scheme 1), which represent synthons, over which it is possible to add hydrophilic groups such as PEG chains; and (ii) the straightforward preparation of ABAB-1 and A3B-1 (and also A4-1) starting from adequately functionalized phthalonitriles. We have performed aggregation and photophysical studies in solution over this family of compounds in order to ratify our previous results regarding the enhanced 1O2 generation abilities of the nonaggregated ABAB-type Zn(II)Pc compounds with regard to their A3B and A4 counterparts [22]. Going one step further, we have performed in vitro assays to examine the toxicity of ABAB-1, A3B-1 and A4-1 in different tumor cells, i.e., SCC-13 and HeLa, as well as their cell localization. The final goal here is to demonstrate the benefits of bis(trifluoromethyl)phenyl-containing Zn(II)Pcs versus other substitution patterns.
Scheme 1.
Synthesis of triethylene glycol monomethyl ether substituted ABAB-1, A3B-1 and A4-1 ZnPcs. (i) Zn(OAc)2, o-DCB/DMF (2:1), 150 °C, 15 h; (ii) TEG-Ts, K2CO3, DMF, 50 °C, overnight; (iii) Zn(OAc)2, pentanol, 1,8-diazabicyclo [5.4.0]undec-7-ene (DBU), 150 °C, 1h.
2. Results and Discussion
2.1. Synthesis
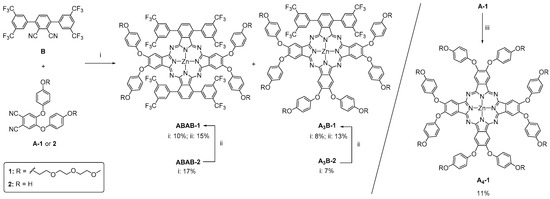
The synthesis of Pcs containing different substituents is usually carried out by cyclotetramerization of appropriately substituted precursors through the condensation of two types of phthalonitriles in a statistical process. Starting from the same proportion of both precursors, a mixture of six products is expected, but by using bulky phthalonitrile B [11] with two bis(trifluoromethyl)phenyl units, only three Zn(II)Pcs (i.e., ABAB, A3B and A4) are usually obtained. For the preparation of our targeted Zn(II)Pcs, in particular ABAB-1 and A3B-1, endowed with bulky groups over B isoindole rings and hydrophilic TEG substituents over the A positions, we have performed cross-condensation reactions with the bulky phthalonitrile B, and either A-1—already containing the TEG moieties—or 4,5-bis(4-hydroxyphenoxy)phthalonitrile A-2 [23] (see Scheme 1). The latter approach, yielding the intermediate Zn(II)Pcs ABAB-2 and A3B-2 [24] that should be further O-alkylated, was tackled in the basis of previous studies, which had shown that the crossed condensation between B and A-2 is a highly efficient process (see below), and the Zn(II)Pcs formed are easily isolated from the reaction mixture [24].
Phthalonitrile A-1 was thus prepared by O-alkylation of A-2 [23] with the tosyl derivative of triethylene glycol monomethyl ether (TEG-Ts) [25] in 53% yield (see Scheme S1). Then, the reaction between phthalonitriles A and B was carried out by heating an equimolar mixture of them at 150 °C in o-dichlorobenzene (o-DCB)/DMF and in the presence of Zn(OAc)2. For the selected A:B ratio, the yield in A3B Zn(II)Pcs is lower (8% for A3B-1 and 7% for A3B-2) than those obtained for their corresponding ABAB Zn(II)Pcs (10% for ABAB-1 and 17%, for ABAB-2). The O-alkylation reaction of ABAB-2 and A3B-2 with TEG-Ts to give, respectively, ABAB-1 and A3B-1 took place in poor yields (15% and 13%, respectively), making this linear approach less efficient than the preparation of A-1 and its condensation with B. It is worth mentioning that the corresponding symmetric A4 Zn(II)Pc is not detected quantitatively in any reaction mixture. This symmetric octasubstituted, TEG-Zn(II)Pc A4-1 is useful to perform a full comparative study of the influence of the bulky fluorinated substituents and the TEG moieties on the solubility, aggregation and 1O2 generation studies of this family of Zn(II)Pcs. In this context, this molecule was synthesized through a direct self-condensation of A-1 phthalonitrile, using in this case the classical pentanol/DBU conditions, which gave rise to A4-1 in 11% yield.
Figure 1 shows the 1H NMR spectra of ABAB-1, A3B-1, and A4-1. The signal pattern for each compound arises from the molecular symmetry group these compounds belong to, namely, D2h for ABAB-1, C2h for A3B-1 and D4h for A4-1. Thus, highly symmetrical A4-1 presents less signals than ABAB-1, which at the same time exhibits a simpler spectrum than A3B-1. The 1H NMR of ABAB-1, shows four singlets for the aromatic protons of the isoindole units and the trifluoromethylphenyl groups, two doublets for the phenoxy substituents, and a set of signals for the TEG chains with a chemical shift between 3.0 and 4.5 ppm. A3B-1 produces six singlets for the isoindole units and the trifluoromethylphenyl substituents, and a multiplet that corresponds to the presence of three types of phenoxy groups. Figure 1 also shows structural models for the three compounds, where the molecular amphiphilic nature is represented in blue (hydrophilic zone) and yellow (hydrophobic zone). The products show good solubility in polar media, and, although they are no soluble directly in water due to the strong amphiphilic character, they are soluble in DMSO/water or MeOH/water (1:99) mixtures.
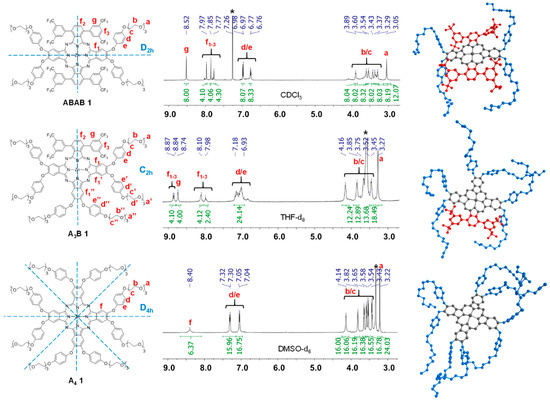
Figure 1.
1H NMR spectra for ABAB-1 (in CDCl3), A3B-1 (in THF-d8) and A4-1 (in DMSO-d6). Geometry optimization (MM2, SCIGRESS (FJ 2.8.1 EU 3.3.1)) for each molecule is shown.
2.2. Photophysical Characterization
The UV–Vis spectra of ABAB-1 and A3B-1, in both non-coordinating toluene and coordinating THF, show split Q-bands accompanied by the typical vibrational absorptions, although splitting is much more pronounced in ABAB-1, which is consistent with its D2h symmetry (Figures S1 and S2 and Table 1). Indeed, the absorption spectra of these compounds do not show any evidence of aggregation, as otherwise expected due to the presence of rather bulky substituents at the non-peripheral positions of the Pc core. Further confirmation of the lack of aggregation for these Zn(II)Pc results from absorption studies performed at a range of concentrations (between ~0.5·10−6 M – 5·10−6 M) (Figures S1 and S2), with an analysis of linear regression between the intensity of the Q-band and the concentration giving R2 values of ~0.999. A4-1, with a regular single Q-band in its UV–Vis spectrum, does not show either any evidence of aggregation in these solvents, probably because the phenyloxy substituents hamper π–π stacking of the Pc cores as well (Figures S1 and S2). Increasing the number of α-bis(trifluoromethyl)phenyl substituents produces a red-shift of the Q-band maximum, namely, from 682 nm for A4-1 to 712 nm for ABAB-1 in toluene solutions (Table 1). On the other hand, fluorescence studies have been also performed in toluene and THF solutions of ABAB-1, A3B-1 and A4-1, showing an increase in the Stokes shift as the number of bis(trifluoromethyl)phenyl units attached to the Zn(II)Pc increases (Figure S3). Fluorescence quantum yield (ΦF) (Figure S4), and singlet (τS) and triplet state (τT) lifetimes (extracted from Time-Resolved Fluorescence -TRF- experiments in Figure S5) are included in Table 1. The results are consistent with those of non-aggregated Zn(II)Pcs, and show a modest solvent dependence. The mono-exponential fluorescence decay kinetics confirm that ABAB-1, A3B-1, and A4-1 are in monomeric form in THF and toluene solutions, and the singlet excited-state lifetimes are similar for the two solvents.

Table 1.
Photophysical properties of Zn(II)Pcs ABAB-1, A3B-1 and A4-1 in toluene and THF.
The quantification of the ϕΔ, for ABAB-1, A3B-1, and A4-1 has been performed by two different methods. The first one entails the measurement of the photoinduced decomposition of 1,3-diphenylisobenzofuran (DPBF) in DMSO solutions, under the irradiation of the corresponding Zn(II)Pcs. The spectroscopic data obtained from these measurements are shown in Figure S6. For the three compounds, the decrease in the DPBF absorption was completely linear (R2 = 0.99), while no change was observed in the absorption of Zn(II)Pcs during the measurement, which evidences that photobleaching is not taking place under the irradiation conditions. ABAB-1, A3B-1, and A4-1 showed ΦΔ values of 93%, 85%, and 53%, respectively. These values should be considered with caution since indirect methods could be subjected to different variables, but are useful for comparative purposes. From those results we can infer that the larger the number of bulky fluorinated groups at α-positions, the better the 1O2 generation efficiency, as otherwise expected considering previous studies with related compounds [22], which show the important role of the bulky, electron-withdrawing bis(trifluoromethyl) groups in the 1O2 production. It is important to mention that aggregation is not considered to evaluate these results since the three compounds are non-aggregated in DMSO (see below). On the other hand, we have evaluated the ΦΔ for ABAB-1, A3B-1, and A4-1 via the direct detection of 1O2 phosphorescence at 1275 nm exciting at 355 nm, both in toluene and THF solutions (Figure S7 and Table 1). The ΦΔ values show the same trend observed in the indirect measurements, namely, a parallel increase with the number of bulky fluorinated substituents and, indeed, ΦF and ΦΔ change concomitantly in the opposite direction. Overall, the measured ΦΔ values are moderately higher than those reported for other amphiphilic Zn(II)Pcs, which confirms that the substitution pattern of this family of compounds improves the photophysical properties of the dye core, rendering them adequate for PDT applications. Importantly, we tried to perform measurements of 1O2 generation in water, but only residual signals were detected, which can be rationalized by the formation of aggregates (see below).
2.3. Aggregation Experiments
Pcs have tendency to form aggregates from their aromatic systems for minimizing the solvation energy, particularly in the case of polar solvents as water. Although a certain organization of the dyes in vesicles or micelles can facilitate their transport through the blood system, it is important that once the PS is delivered to the target tissue, it remains as non-aggregated species, at least in some extent, that leading to more efficient 1O2 generation through their photoexcitation. For that reason, aggregation studies are important for the former evaluation of their potential application in vitro. Absorption and emission experiments were carried out over solutions of TEG-functionalized ABAB-1, A3B-1, and A4-1. Although they are not soluble in pure water, they appear to be soluble upon addition from stock DMSO solutions to Milli-Q water until a 1:99 DMSO/water ratio is reached, what is admissible for further in vitro assays. Therefore, we performed aggregation studies by registering UV–Vis and fluorescence spectra of the three Zn(II)Pcs in different mixtures of DMSO/water, in order to compare the specific behavior derived from the presence of two substituted isoindole units with bulky fluorinated groups (ABAB-1) versus one (A3B-1) or none of them (A4-1). Mixed solutions of DMSO/water ranging from 100:0 to 1:99 were measured, in both absorption (Figure 2) and emission (Figure S8) experiments. Importantly, initial measurements in pure DMSO correspond to a fully non-aggregated state for the three compounds. Looking at the absorbance spectra, we can determine that from 100% to 80% DMSO, ABAB-1 presents an almost constant absorption for the Q-band, whereas A3B-1 shows a gradual decrease of its intensity and broadening, as well as a rise of a band with shorter wavelength, compatible with the formation of co-facial H-type aggregated species. Furthermore, in the case of ABAB-1, when a 70:30 DMSO/water ratio is reached, the spectrum shows a sudden decrease of the Q-band intensity, and the concomitant emergence of a shoulder of at lower wavelength. Below 70% of DMSO contents, we can observe a constant behavior for both ABAB-1 and A3B-1 compounds, indicating that a stable situation is reached. In the case of A4-1, a sudden decrease of the Q-band, as well as a broadening and rising of a band at shorter wavelength compatible with the formation of aggregates, are observed starting at 80:20 DMSO/water ratios. In the case of emission studies, we can discern that the fluorescence of A3B-1 and A4-1 shows a sharp decrease in intensity when the water proportion increases, until a total cancellation of fluorescence at 70:30 DMSO/water ratio. On the other hand, ABAB-1 shows a similar behavior than that observed in the absorption spectrum, that is, a huge decrease of the emission after the addition of 30% water. A magnification of this spectrum shows us that since this moment a residual fluorescence signal is kept with the same intensity, which means that we have reach a balanced situation with the presence of non-aggregated species in the medium.
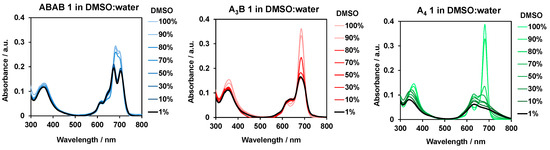
Figure 2.
UV–Vis spectra of ABAB-1, A3B-1, and A4-1 in different DMSO/water ratios.
2.4. Determination of the Log Po/w
For a preliminary evaluation of the relative lipophilicity of ABAB-1, A3B-1, and A4-1, and their affinity for cell membranes, n-octanol/PBS partition coefficients were determined using the shake-flask method (see Figure S9), which does not require standard compounds and is based on the direct determination of equilibrium partition concentrations of a compound in a biphasic system. Although the three compounds have a common structural Pc core, they exhibited different amphiphilic character. ABAB-1 renders a higher octanol/water partition coefficient than A3B-1 and A4-1, (see Figure 3), for [Zn(II)Pc] = 10−5 M in the octanol/water mixture (%DMSO < 1%), thus indicating the relative order of lipophilicity nature. In fact, the log PO/W values suggest that ABAB-1 and A3B-1 are mostly hydrophobic and have very high affinity for membranes. On the other hand, A4-1 is more amphiphilic, and its presence in the aqueous phase is more abundant, which is concordant which its higher solubility in this medium.
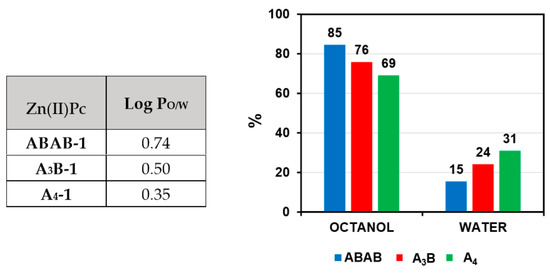
Figure 3.
n-octanol/water partition experiments with ABAB-1, A3B-1, and A4-1.
2.5. Biological Studies
Biological experiments with human HeLa (cervical adenocarcinoma cells) and SCC-13 (skin squamous carcinoma cells) strains have been performed using ABAB-1, A3B-1, and A4-1 as PS, in order to evaluate the potential of our design.
2.5.1. Cytotoxicity Studies
Phototoxicity of some Zn(II)Pcs has already been tested against cervical and oral skin squamous carcinoma cells in in vitro experiments. However, due to the aggregation problems they present, it is necessary to transport them through complex conjugates [26,27,28]. Herein, we have studied the activity of ABAB-1, A3B-1 and A4-1 Zn(II)Pcs as independent molecular entities upon red light irradiation by the 3-(4,5-dimethylthiazol-2-yl)-2,5-diphenyltetrazolium bromide (MTT) assay in SCC-13 and HeLa cell lines. For this purpose, we first evaluated the inherent toxicity of two different concentrations of the three Zn(II)Pcs (1·10−6 and 1·10−7 M) in cells, after 5 h of incubation in presence of PS in the dark. Separately, we have evaluated the possible damage caused by irradiation, treating the cells with the highest red light dose used in this work (9 J/cm2), in the absence of the PS. The results shown in Table 2 indicate that neither the presence of the Zn(II)Pc at these concentrations, nor the administration of red light, induced significant cytotoxic effects in the cell lines studied, and survival rates above 95% were obtained. In addition, we have analyzed whether the percentage of DMSO influences the single action of the PS or light, not observing changes in cell survival when combined with DMSO (Table 2).
Table 2.
Toxicity effects in SCC-13 and HeLa cells induced by red light, in the absence of any Pcs, and by incubation with either of the Zn(II)Pcs 1 in the dark. Cell toxicity was evaluated by the MTT assay, 24 h after treatment.
Then, we evaluated the photodynamic activity of ABAB-1, A3B-1, and A4-1 toward SCC-13 and HeLa cells upon irradiation. For the photodynamic treatments, we used two different concentrations (i.e., 1·10−6 and 1·10−7 M) and, after 5 h of incubation, cells were exposed to different red light doses (3, 6 and 9 J/cm2). It is important to mention here that, for a better comparison between the three compounds, one should calculate the total number of photons absorbed by each. However such calculation is very challenging, if not impossible, because they are likely to be aggregated to different extents, which leads to severe spectral changes (see Figure 2). Moreover, their distribution in the different cell compartments may be different, adding further uncertainty to the absorbance of the active species responsible for cell death. Thus, the only meaningful comparison is by concentration.
Figure S10 shows concentration-dependent response for the three compounds; cells were more sensitive to PDT when higher concentration (1·10−6 M) were applied. We selected the concentration of 1·10−6 M to perform the rest of experiments. Figure 4 shows the results for both cell lines treated with the Zn(II)Pcs; a drastic decrease in cell survival was revealed with the light dose in both cells lines. ABAB-1 was the most sensitive at low red light dose, but the results for ABAB-1 and A3B-1 were similar when using 6 or 9 J/cm2 irradiations. Notably, the measured cell survival values are actually comparable to those of monomeric Si(IV)Pc-PEG species, which present IC50 values for HeLa cells of 0.28 μM [20], and also to other tetra-PEG functionalized Zn(II)Pcs [29]. On the other hand, A4-1 was always less efficient in comparison with the other Zn(II)Pcs, leading to only 20% of cell death in both cell lines with the highest light dose (i.e., 9 J/cm2) (Figure 4a). Importantly, the trend found for cell survival values is parallel to the relative efficiency of the three Pc dyes as 1O2 generators (Table 1). Cell morphology of the treated cells was also analyzed 24 h after PDT using phase contrast microscopy (Figure 4b), revealing cytoplasmic retraction, with a rounded aspect similar to that of cells in apoptosis, in both cell lines treated with ABAB-1 and A3B-1 at higher light doses [30]. Interestingly, these images are well correlated with the results obtained from cell viability assays. We next analyzed by fluorescence microscopy the intracellular ROS formation in SCC-13 and HeLa cells when subjected to PDT with Zn(II)Pcs ABAB-1, A3B-1 and A4-1, using for this purpose the DHF-DA fluorescent probe (Figure S11, Supporting Information). As shown in Figure S11, controls and cells incubated with Zn(II)Pcs in dark conditions did not exhibit green florescent due. In contrast, cells subjected to PDT showed an intense fluorescence in both cell types with the two of the compounds, ABAB-1 and A3B-1 (compared to baseline levels) revealing a prominent ROS production after PDT. However, cells treated with A4-1 presented a very low fluorescence, indicating a low ROS production that is in agreement with the cell survival results.
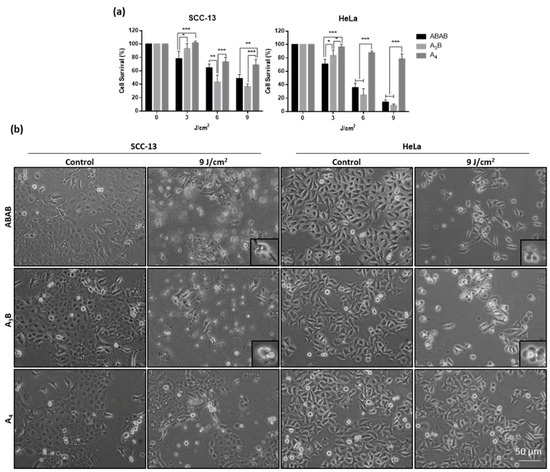
Figure 4.
(a) Phototoxicity induced by ABAB-1, A3B-1, and A4-1 in SCC-13 and HeLa cells. Cells were incubated with concentrations of 1·10−6 for 5 h and then irradiated with red light at variable doses. The survival was dependent of red light dose; A4-1 was the less sensible to light irradiation. Cell survival was evaluated by the MTT test 24 h after treatments. Each value corresponds to the mean obtained from three independent experiments ± SD. (* p < 0.05; ** p < 0.01; *** p < 0.001). (b) Morphological changes observed in SCC-13 and HeLa cells 24 h after photodynamic treatment with the three Pcs (1·10−6 M, 5 h incubation followed by 9 J/cm2 of red light).
2.5.2. Localization Study
To localize the Zn(II)Pcs in the treated cells, they were irradiated with green light (545 nm) with a BP545 filter. In Figure 5 we can see that ABAB-1, A3B-1, and A4-1 are located inside the cells. They appear with a vesicular morphology and they are probably localized in lysosomes or endosomes, which suggest that they are internalized through an endocytic pathway. Unfortunately, the fluorescence of these Zn(II)Pcs is too weak to be appreciated if specific probes for each organelle are used, which fluorescence mask the emission of the Zn(II)Pcs. For the sake of comparison, we are including in Appendix A (Figure A1) images of subcellular localization of organelles for SCC-13 and HeLa cells after incubation with known fluorescent probes.
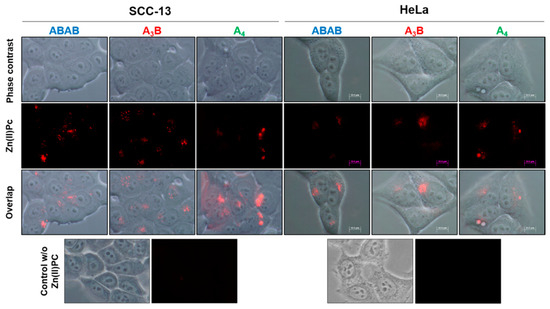
Figure 5.
Cellular localization of ABAB-1, A3B-1, and A4-1 (red) in SCC-13 and HeLa cells when they are observed with a fluorescence microscopy (irradiated with green light at 545 nm) and without other cell dye. They appear with a vesicular morphology inside cells.
3. Materials and Methods
3.1. General Methods and Characterization Techniques
Chemical reagents were purchased from Merck-Sigma Aldrich, Alfa Aesar, Acros Organics, TCI or Fluorochem, as main commercial suppliers, and were used without further purification unless it is indicated. Solvents were purchased from Carlo Erba Reagents, and anhydrous solvents were dried with 4Å molecular sieves (Panreac). All reactions were performed in standard glasswares, except for the cyclotetramerization reactions that were carried out in high pressure sealed tubes. The monitoring of the reactions has been carried out by thin layer chromatography (TLC), employing aluminum sheets coated with silica gel type 60 F254 (0.2 mm thick, E. Merck). Purification and separation of the synthesized products was performed by column chromatography, using silica gel (230–400 mesh, 0.040–0.063 mm, Merck) and eluents are indicated for each particular case. Gel permeation chromatography (GPC) was performed using Bio-Beads S-X1 (200–400 mesh, Bio-Rad). Infrared (IR) spectra were recorded on a Cry 630 FTIR spectrophotometer from Agilent Technologies, using solid samples (diamond ATR). High-resolution mass spectrometry (HR-MS) were recorded using positive ESI Positive TOF_MS or matrix-assisted laser desorption/ionization (MALDI). Electrospray ionization (ESI) mass spectra were recorded with an API Q-Star Pulsar i from Sciex. Matrix used are indicated in each spectrum. MALDI-TOF HR-MS spectra were recorded with a Bruker Ultrareflex III spectrometer. MS data are expressed in m/z units. All MS experiments were carried out at the Servicio Interdepartmental de Investigación (SIdI) of the Universidad Autónoma de Madrid. Nuclear magnetic resonance spectra (1H NMR and 13C NMR) were recorded on Bruker AC-300 (300 MHz) or Bruker XRD-500 (500 MHz) instruments. Deuterated solvents employed are indicated in each spectrum. Aggregation studies were performed using aqueous miliQ-water, and organic spectroscopy grade solvents. UV–Vis spectra for aggregation experiments were recorded with a UV-vis JASCO-V660 spectrophotometer using 10 × 10 mm quartz cuvettes.
3.2. Synthesis
Compounds 3,3″,5,5″-tetrakis(trifluoromethyl)-[1,1′:4’,1″-terphenyl]-2′,3′-dicarbonitrile (B) [11], 4,5-bis(4-hidroxiphenoxy)phthalonitrile (A-2) [23], 2-(2-(2-methoxyethoxy)ethoxy)ethyl p-toluenesulfonate (TEG-Ts) [25], and ABAB Zn(II)Pc 2 [24], have been prepared according to published procedures.
4,5-bis-(4-(2-(2-(2-methoxyethoxy)ethoxy)ethoxy)phenoxy)phthalonitrile (A-1): In a two-neck round bottom flask, A-2 (150 mg, 0.44 mmol) and TEG-Ts (291 mg, 0.91 mmol) were solved in dry DMF (6 mL) and heated to 50 °C. Then, anhydrous K2CO3 (199 mg, 1.44 mmol) was added in several portions. Reaction was kept at this temperature under argon atmosphere for three days. After cooling the reaction mixture was diluted with 100 mL of water and extracted with EtOAc (3 × 50 mL). The collected organic phase was washed with water (3 × 50 mL), brine (50 mL) and dried with MgSO4. The solvent was filtered and evaporated under reduced pressure. Then, product was purified by column chromatography on SiO2 with EtOAc as eluent, resulting in 275 mg (98% yield) of a brown oil. 1H NMR (300 MHz, CDCl3): δ 3.38 (s, 6H, TEG-CH3), 3.53–3.62 (m, 4H, TEG-CH2), 3.63–3.83 (m, 12H, TEG-CH2), 3.85–3.95 (m, 4H, TEG-CH2), 4.12–4.23 (m, 4H, TEG-CH2), 6.96–7.13 (m, 10H, CHAr). 13C NMR (75 MHz, CDCl3): δ 59.2, 68.2, 69.8, 70.7, 70.8, 71.0, 72.1, 109.9, 115.3, 116.5, 120.7, 121.6, 147.4, 152.6, 157.0. IR (ATR) ν-1 (cm-1): 2875, 2229, 1499, 1292, 1246, 1206, 1105. HR-MS (ESI+, +TOF, Ionizing phase: MeOH + NaI) for C34H40N2O10: m/z 659.2568 [M + Na]+, (calculated: 659.2575).
Zn(II)PcA3B-2: Phthalonitrile B (150 mg, 0.27 mmol), phthalonitrile A-2 (93 mg, 0.27 mmol) and anhydrous Zn(AcO)2 (50 mg, 0.27 mmol) were placed in a 5 mL high pressure resistant flask equipped with a magnetic stirrer, and then 2.7 mL ([B] = 0.1 M) of dry o-DCB/DMF (2:1) were added. The mixture was heated to 150–160 °C overnight under an argon atmosphere. After cooling the solvent was removed under vacuum. The product was purified by column chromatography on SiO2 (dioxane/heptane in gradient from 1:1 to 2:1) where the second fraction to elute containing the desired product A3B-2. The product was further purified by an additional column chromatography on Bio-Beads using CHCl3 as eluent. After evaporation of the solvent blue solid was obtained, which were recrystallized from dichloromethane (DCM)/heptane. Yield: 16 mg (7%). 1H NMR (300 MHz, DMSO-d6): δ 6.71–7.21 (m, 24H, O-Ph-O), 7.76 (s, 2H, CHAr), 8.04 (s, 2H, CHAr), 8.21 (s, 2H, CHAr), 8.63 (s, 4H, CHAr), 8.78 (s, 4H, CHAr), 9.28–9.56 (br s, 6H, OH). 13C NMR (75 MHz, THF-d8): δ 116.1, 116.4, 116.5, 118.8, 120.1, 120.9, 121.7, 125.3, 129.4, 129.8, 130.2, 131.1, 131.7, 133.4, 133.6, 134.4, 135.8, 142.5, 148.9, 149.0, 149.7, 150.1, 150.7, 150.8, 151.2, 151.2, 151.3, 153.1, 153.2, 153.5, 153.6, 153.9, 154.6, 154.9. IR (ATR) ν-1 (cm-1): 3416, 2954, 2883, 1723, 1507, 1449, 1362, 1279, 1196, 1182, 1133, 1034. MS (MALDI, matrix DCTB + PEGNa 1500) for C84H44F12N8O12Zn: m/z 1648.2177 [M]+, (calculated: 1648.2173).
Zn(II)Pc ABAB-1: Method a: Phthalonitrile B (150 mg, 0.27 mmol), and A-1 (172 mg, 0.27 mmol) and anhydrous Zn(AcO)2 (50 mg, 0.27 mmol) were placed in a 5 mL high pressure resistant flask equipped with a magnetic stirrer, and then 2.7 mL ([B] = 0.1 M) of dry o-DCB/DMF 2:1 were added. The mixture was heated to 150–160 °C overnight under an argon atmosphere. After cooling the solvent was removed under vacuum. Then, the product was purified by column chromatography on SiO2 (heptane/dioxane 1:1 as eluent) where the first green fraction to elute contained the desired product. It was further purified by an additional column chromatography on Bio-Beads using CHCl3 as eluent. After evaporation of the solvent a blue solid was obtained, which was recrystallized from DCM/heptane. Yield: 33 mg (10%). Method b: ABAB-2 (10 mg, 0.0054 mmol) and TEG-Ts (34 mg, 0.11 mmol) were solved in dry DMF (7 mL) and heated to 50 °C. Then, anhydrous K2CO3 was added (7 mg, 0.048 mmol) and the reaction was kept under this temperature and argon atmosphere overnight. The reaction was monitored by TLC (heptane/dioxane) and extra anhydrous K2CO3 additions could be needed until complete the conversion. After cooling the solvent was evaporated under reduced pressure. Then, the product was purified by column chromatography on SiO2 (heptane/dioxane 1:1 as eluent). It was further purified by an additional column chromatography on Bio-Beads using CHCl3 as eluent. After evaporation of the solvent a blue solid was obtained, which was washed with heptane. Yield: 2 mg (15%). 1H NMR (500 MHz, CDCl3): δ 3.05 (s, 12H, TEG-CH3), 3.29 (m, 8H, TEG-CH2), 3.37 (m, 8H, TEG-CH2), 3.43 (m, 8H, TEG-CH2), 3.54 (m, 8H, TEG-CH2), 3.60 (m, 8H, TEG-CH2), 3.89 (m, 8H, TEG-CH2) 6.76 (d, 8H, J = 9.01 Hz, O-Ph-O), 6.98 (d, 8H, J = 9.01 Hz, O-Ph-O), 7.77 (s, 4H, CHAr), 7.85 (s, 4H, CHAr), 7.97 (s, 4H, CHAr), 8.52 (s, 8H, CHAr). 13C NMR (125 MHz, CDCl3): δ 58.8, 67.6, 69.7, 70.2, 70.4, 70.7, 71.8, 114.5, 115.5, 118.7, 121.5, 123.6 (q, J = 271.6 Hz, CF3); 131.2, 131.5, 134.8, 135.3, 136.8, 142.6, 151.1, 151.9, 152.4, 153.4, 154.6. IR (ATR) ν-1 (cm-1): 2916, 2874, 1501, 1410, 1377, 1275, 1198, 1178, 1127, 1104, 896. HR-MS (MALDI, matrix: DCTB + PPGNa 2000) for C116H96F24N8O20Zn: m/z 2440.5741 [M]+, (calculated: 2440.5644).
Zn(II)Pc A3B-1: Method a: Phthalonitrile B (150 mg, 0.27 mmol), and A-1 (172 mg, 0.27 mmol) and anhydrous Zn(AcO)2 (50 mg, 0.27 mmol) were placed in a 5 mL high pressure resistant flask equipped with a magnetic stirrer, and then 2.7 mL ([B] = 0.1 M) of dry o-DCB/DMF 2:1 were added. The mixture was heated to 150–160 °C overnight under an argon atmosphere. After cooling the solvent was removed under vacuum. Then, the product was purified by column chromatography on SiO2 (heptane/dioxane in gradient from 100:0 to 0:100) where the second green fraction to elute contained the desired product. It was further purified by an additional column chromatography on Bio-Beads using CHCl3 as eluent. After evaporation of the solvent a blue solid was obtained, which was recrystallized from DCM/heptane. Yield: 27 mg (8%). Method b: A3B-2 (10 mg, 0.0061 mmol) and excess of TEG-Ts (39 mg, 0.12 mmol) were solved in dry DMF (7 mL) and heated to 50 °C. Then, K2CO3 (7.5 mg, 0.054 mmol) was added, and the reaction was kept under this temperature and argon atmosphere overnight. The reaction was monitored by TLC (heptane/dioxane) and extra anhydrous K2CO3 additions could be needed until complete the conversion. After cooling the solvent was evaporated under reduced pressure. Then, the product was purified by column chromatography on SiO2 (heptane/dioxane in gradient from 100:0 to 0:100). It was further purified by an additional column chromatography on Bio-Beads using CHCl3 as eluent. After evaporation of the solvent a blue solid was obtained, which was recrystallized from EtOAc/heptane. Yield: 2 mg (13%). 1H NMR (300 MHz, THF-d8): δ 3.27 (br s, 18H, TEG-CH3); 3.45 (br s, 12H, TEG-CH2), 3.52–3.75 (m, 36H, TEG-CH2); 3.85 (br s, 12H, TEG-CH2); 4.16 (br s, 12H, TEG-CH2); 6.93–7.18 (m, 24H, O-Ph-O); 7.98 (br s, 2H, CHAr); 8.10 (br s, 4H, CHAr); 8.74 (s, 4H, CHAr); 8.84 (s, 2H, CHAr); 8.87 (s, 2H, CHAr). 13C NMR (75 MHz, THF-d8): δ 59.0, 69.0, 70.8, 71.5, 71.7, 71.8, 74.6, 116.0, 116.2, 116.6, 116.8, 119.1, 119.6, 120.3, 120.4, 122.2, 123.8, 131.7, 132.0, 132.2, 133.2, 135.6, 135.8, 135.9, 136.0, 136.1, 136.6, 137.5, 138.3, 152.3, 153.4, 156.0, 156.5. IR (ATR) ν−1 (cm−1): 2870, 1501, 1450, 1404, 1276, 1198, 1127, 1093, 1029, 890, 800. HR-MS (MALDI, matrix: DCTB + PPGNa 2000) for C126H128F12N8O30Zn: m/z 2524.7894 [M]+, (calculated: 2524.7831).
Zn(II)Pc A4-1: A mixture of A-1 (90 mg, 0.14 mmol) and Zn(OAc)2 (9.7 mg, 0.053 mmol) was placed in a 5 mL high pressure resistant flask equipped with a magnetic stirrer, and then 1.4 mL of pentanol and 0.1 mL of DBU were added. Then mixture was heated to 150 °C under argon atmosphere for 1 h. After cooling the solvent was removed under vacuum. The product was purified by column chromatography on SiO2 (EtOAc/MeOH in gradient from 100:0 to 0:100). After evaporate the solvent under reduced pressure, the product was washed with DCM/heptane and a green solid was obtained. Yield: 9.7 mg (11%). 1H NMR (500 MHz, DMSO-d6): δ 3.22 (s, 24H, TEG-CH3); 3.43 (t, 16H, J = 5.05 Hz, TEG-CH2); 3.54 (t,16H, J = 5.05 Hz, TEG-CH2); 3.58 (t, 16H, J = 4.94 Hz, TEG-CH2); 3.65 (t, 16H, J = 4.94 Hz, TEG-CH2); 3.82 (br t, 16H, TEG-CH2); 4.14 (br t, 16H, TEG-CH2); 7.04 (d, 16H, J = 8.70 Hz, O-Ph-O); 7.31 (d, 16H, J = 8.70 Hz, O-Ph-O); 8.40 (br s, 3H, CHAr-Pc(core)). 13C NMR (125 MHz, DMSO-d6): δ 58.0, 67.6, 69.1, 69.6, 69.9, 70.0, 71.3, 112.3, 115.7, 119.8, 133.2, 149.8, 150.4, 154.9. IR (ATR) ν−1 (cm−1): 3016, 2933, 1502, 1450, 1425, 1400, 1284, 1200, 1130, 936. HR-MS (MALDI, matrix DCTB + PPGNa 2000 + PPGNa 2700) for C136H160N8O40Zn: m/z 2608.9966 [M]+, (calculated: 2609.0018).
3.3. Spectroscopic Techniques
ΦΔ in DMSO was measured following an indirect method based on the photoinduced decomposition of a scavenger, in this case DPBF which reacts with 1O2 after the excitation with visible light filtered below 530 nm (hν > 530 nm) [31]. Non-substituted Zn(II)Pc was used as reference compound which present a ΦΔ = 0.67 in DMSO [32]. For these studies, a stock solution in DMSO of DPBF was prepared (with an absorbance of ~1 a.u.), and 2 mL were transferred into a 10 × 10 mm quartz optical cell and bubbled with 3O2 for 1 min. Then, concentrated stock solutions of the corresponding Zn(II)Pcs in DMSO were added, in a defined amount to reach an absorbance of the final solution in the Q-band maximum of 0.1 ± 0.05 a.u. The solutions were stirred and irradiated for defined time intervals using a halogen lamp of 300 W. The length of time intervals was modified for each experiment, obtaining an absorbance diminution of DPBF ~3–4%. Incident light was filtered through a water filter (6 cm) and an additional filter to remove light under 530 nm (Newport FSQ-OG530 filter). Moreover, neutral density filters (FBS-ND03 and FB-ND10, were used). Decrease of DPBF absorbance with irradiation time was monitored at 414 nm and all experiments were performed three times. Average values are represented, and ΦΔ is calculated through Equation (1); R and S indicate reference and sample, respectively. k is the slope of a plot of ln (A0/At) versus irradiation time (t). A0 and At are the absorbance of DPBF at the monitored wavelength before and after irradiation time (t). IaT is the total amount of light absorbed by the dye. IaT is calculated as a sum of intensities of the absorbed light Ia at wavelengths from 530 nm to 800 nm. Ia at given wavelength is calculated using Beer’s law (Equation (2)), where I0 is the transmittance of the filter at a given wavelength and A is the absorbance of the dye at this wavelength.
All spectroscopic measurements for Photophysical Characterization (Section 2.2), were carried out in 1 cm quartz cuvettes (Hellma, Germany) in air-saturated solutions, at room temperature using spectroscopic grade solvents. Absorption spectra were recorded using a double beam UV–Vis–NIR Varian Cary 6000i spectrophotometer (Varian, Palo Alto, CA, USA). Absorption coefficients were derived from the slopes of Lambert-Beer plots. Fluorescence emission spectra were recorded using a Spex Fluoromax-4 spectrofluorometer (Horiba Jobin-Yvon, Edison, NJ, USA). The samples were excited at: ABAB-1 667 (THF) and 702 nm (toluene); A3B-1 665 (THF) and 670 nm (toluene); A4-1 693 (THF) and 672 nm (toluene). Fluorescent quantum yields (ΦF) were determined by comparing the integrated fluorescent intensity of optically matched solutions between samples (S) and reference (R) ZnPc in 1-propanol (ΦF = 0.20) [22]. The samples were excited at: ABAB-1 609 (THF) and 603 nm (toluene); A3B-1 610 (THF) and 605 nm (toluene); A4-1 610.5 (THF) and 610 nm (toluene). Fluorescence intensity was corrected using the refractive index of the solvents used (Equation (3)).
Time-resolved fluorescence decays were measured using a Fluotime 200 time-correlated fluorescence lifetime spectrophotometer (PicoQuant GmbH, Berlin, Germany), equipped with a red sensitive photomultiplier. Excitation was achieved by means of a 654 nm picosecond laser working at 1 MHz repetition rate. The counting frequency was always below 1%. Fluorescence lifetimes were analyzed using PicoQuant FluoFit 4.0 data analysis software.
1O2 generation in THF and toluene was studied by time-resolved near-infrared phosphorescence by means of a customized setup [33,34]. Briefly, a pulsed Nd:YAG laser (FTSS355-Q, Crystal Laser, Berlin, Germany) working at 1 kHz repetition rate (for THF and toluene) at 355 nm (third harmonic, 0.5 μJ per pulse) was used to excite the sample. A 1064-nm rugate notch filter (Edmund Optics) and an uncoated SKG-5 filter (CVI Laser Corporation) were placed in the laser path to remove any residual NIR emission. The light emitted by the sample was filtered with a 1100 nm long-pass filter (Edmund Optics) and later by a narrow bandpass filter at 1275 nm (BK-1270-70-B, bk Interferenzoptik). A thermoelectric-cooled NIR-sensitive photomultiplier tube assembly (H9170-45, Hamamatsu Photonics, Hamamatsu, Japan) was used as detector. Photon counting was achieved with a multichannel scaler (NanoHarp 250, PicoQuant, Berlin, Germany). The time dependence of the 1O2 phosphorescence with the signal intensity S(t) is described by Equation (4), in which τT and τΔ are the lifetimes of the photosensitizer triplet state and of 1O2 respectively, and S(0) is a pre-exponential parameter proportional to ΦΔ. Curve fitting was performed with the Graphpad Prism version 7.00 for Windows, (GraphPad Software, La Jolla California USA, www.graphpad.com). ΦΔ was determined by comparing the S(0) values of optically matched solutions of the drug and the reference (phenalenone (PN), in toluene and THF ΦΔ = 0.99 and 0.96 respectively) [35,36], at 355 nm as described by Equation (5).
3.4. Determination of the Log Po/w
Initially, equal volumes of n-octanol and water were mixed vigorously for 3 days at 25 °C to promote solvent saturation in both phases. Each sample of Zn(II)Pc 1 was then added from stock solutions in DMSO to 2 mL of the mixture (%DMSO < 1%, [Zn(II)Pc] = 10-5 M) and stirred for 30 min; next, they were incubated 1 h at room temperature. After separation, 10 μL of n-octanol phase and 10 μL of PBS phase were taken and diluted by DMSO to 1.01 mL. The UV–Vis spectra of both phases were recorded, and the partition coefficient was calculated based on the absorbance values at Q-band maxima (702 nm for ABAB-1, 685 nm for A3B-1 and 681 nm for A4-1). The results are the average of three independent measurements.
3.5. Biological Assays
3.5.1. Cell Culture
HeLa (cervical adenocarcinoma cells) and SCC-13 (skin squamous carcinoma cells) human cancer cell lines were used for cell cultures. They were grown using DMEM (Dulbecco’s Modified Eagle’s medium) culture media, supplemented with 10% Foetal Bovine Serum (FBS) and 1% antibiotics (G penicillin, 100 U/mL; streptomycin, 100 µg/mL), purchased from Fisher. They were incubated in HERACell incubator (Heraus) at 37 °C with 5% CO2 concentration and 95% relativity humidity.
3.5.2. Photodynamic Treatment
Solutions of ABAB-1, A3B-1, and A4-1 were prepared in concentrations of 1·10−6 and 1·10−7 M and added to cell cultures in well plates P24 with DMEM (supplemented with antibiotics but without FBS). The cells were incubated with each Pc (previously dissolved in DMSO keeping the DMSO content below 1%) for 5 h in darkness, immediately were irradiated with different red light doses (3, 6 and 9 J/cm2). Light source was constituted by a rectangular matrix with 384 LED (light emitting diodes), (WP7143 SURC, Kingbright) with an emission peak of 637 nm and a bandwidth of ± 17 nm. The fluence rate used was 12.7 mW/cm2. After irradiation, cell culture was replaced by fresh media supplemented with antibiotics and FBS, and cells were incubated 24 h until their evaluation.
3.5.3. Cell Viability
Cell survival was determined after photodynamic treatment, both darkness plates and irradiated plates, through MTT assays. This is a colorimetric technique based on mitochondrial enzymes capacity of alive cells to reduce the water-soluble compound 3-(4,5-dimethylthiazol-2-yl)-2,5-diphenyltetrazolium bromide (MTT) to formazan, an insoluble compound which has a purple colour. After 24 h of incubation, MTT was added to well plates in a final concentration of 100 µg/mL, for 3 h at 37 °C. Then, DMSO (Panreac) was added in order to solve formazan and optical density was measured in SpectraFluor plate reader (Tecan), with a wavelength of 542 nm.
3.5.4. Measurement of Intracellular ROS
The intracellular production of ROS in SCC-13 and HeLa cells was evaluated as previously described [37]. Cells were incubated with Zn(II)Pcs (1·10−6 M) for 5 h, and during the last hour 2,7-dichloro-dihydrofluorescein diacetate (DHF-DA, Abcam) was added to the cultures, reaching a final concentration of 6·10−6 M. Afterwards, and without removing DHF-DA, cells were exposed to green light (3 and 6 J/cm2) and immediately after irradiation analyzed by fluorescence microscopy, under blue excitation light (λexc = 436 nm). ROS production was quantified by using Image J after measuring green fluorescence.
3.5.5. Optical Microscopy and Statistical Analysis
Microscopic observations were carried out using an Olympus BX61 epifluorescence microscope equipped with green filter (exciting filter BP510-550). Photographs were obtained with the digital camera Olympus CCD DP70 and processed using the Adobe Photoshop CS5 extended version 12.0 software (Adobe Systems Inc., San Jose, CA, USA).
Data are expressed as the mean value of at least three experiments ± standard deviations (SD). The statistical significance was determined using analysis of variance (ANOVA) followed by Bonferroni’s test, and p < 0.05 was considered statistically significant.
3.5.6. Subcellular Localization
In order to determine intracellular localization of Zn(II)Pcs, cells were grown in coverslips in P12 well plates and they were incubated with the PS in a concentration of 10−6 M for 18 h at 37 °C. After incubation, cells were washed with PBS and were observed with fluorescence microscopy.
4. Conclusions and Future Perspectives
Three amphiphilic polyethyleneglycol-functionalized Zn(II)Pcs, namely, ABAB-1, A3B-1, and A4-1, have been synthesized in the search for new PS for PDT applications. ABAB-1, A3B-1 are both obtained in a crossed-condensation reaction of two differently substituted phthalonitriles, combining bulky fluorinated substituents in the B isoindoles, which have previously proved effective in suppressing aggregation and increasing the 1O2 generation efficiency, and hydrophilic triethyleneglycol substituents in A isoindoles to impart water solubility. On the other hand, A4-1 is an octa(triethyleneglycol) Pc which has been prepared to experimentally demonstrate that the presence of the bulky fluorinated substituents is fundamental to achieve good photosensitization abilities. In fact, photophisycal and aggregation studies have determined that ABAB-1 is the compound that most efficiently generates 1O2 (τΔ trend is ABAB-1 > A3B-1 > A4-1), and is less prone to aggregate in water media. Finally, in vitro assays have been carried out in order to determine the toxicity for tumor cells for the three Zn(II)Pcs. It has been proved that none of these Pcs are toxic for tumor cells in darkness, but when the tissue is irradiated in the presence of the PS, fatality turns out. Moreover, consistently with the 1O2 generation studies, the impact is higher in the case of ABAB-1 and A3B-1, than A4-1. These findings make Zn(II)Pcs with bulky bis(trifluoromethyl)phenyl groups, particularly those with an ABAB pattern candidates of choice as PS. The next step in this research is to incorporate groups with extended hydrophilicity, and also bind molecules for specific targeting that would allow increasing selectivity against different tumor tissues.
Supplementary Materials
The following are available online.
Author Contributions
Chemical synthesis, M.Á.R.-M., and A.G.C.; photophysical and aggregation studies: M.Á.R.-M.; biological studies, M.M. and P.G.-J.; writing—review and editing, M.Á.R.-M. and G.d.l.T.; supervision, project administration, and funding acquisition, Á.J., S.N., G.d.l.T., and T.T. All authors have read and agreed to the published version of the manuscript.
Funding
This research was funded by MINECO, Spain (CTQ2017-85393-P and CTQ2016-78454-C2-1-R), Instituto de Salud Carlos III and Feder Funds (FIS PI18/00708) and ERA-NET/MINECO EuroNanoMed2017-191/PCIN-2017-042.
Conflicts of Interest
The authors declare no conflict of interest.
Appendix A

Figure A1.
Subcellular localization of organelles of SCC-13 and HeLa cells after incubation with known fluorescent probes. Phase contrast (PhC). Green fluorescence is from Golgi apparatus (Golgi), mitochondrial (Mito) and lysosomes (Lyso). A blue (450–490 nm) exciting lamp was used for organelles probes. Scale bar 10 µm.

Materials and methods for subcellular localization of Figure A1: To analyze the intracellular localization of organelles, SCC-13 and HeLa cells were grown on coverslips and, incubated with known fluorescent probes for lysosomes (LysoTracker Green DND-26, Invitrogen), mitochondria (MitoTracker Green FM, Invitrogen), or Golgi apparatus (NBD, C6-ceramide (N-[6-[(7-nitro-2-1,3-benzoxadiazol-4-yl)amino]hexanoyl]-D-erythro-sphingosine, Invitrogen)) at the concentrations indicated by the suppliers. Then, cells were briefly washed in PBS, mounted on slides with a drop of PBS and immediately observed under the fluorescence microscope.
References
- Leznoff, C.C.; Lever, A.B.P. Phthalocyanines: Properties and Aplications; VCH Publishers: New York, NY, USA, 1989; Volume 1–4. [Google Scholar]
- Allen, C.M.; Sharman, W.M.; Van Lier, J.E. Current status of phthalocyanines in the photodynamic therapy of cancer. J. Porphyr. Phthalocyanines 2001, 5, 161–169. [Google Scholar] [CrossRef]
- Chen, Z.; Lohr, A.; Saha-Möller, C.R.; Würthner, F. Self-assembled π-stacks of functional dyes in solution: Structural and thermodynamic features. Chem. Soc. Rev. 2009, 38, 564–584. [Google Scholar] [PubMed]
- Wasielewski, M.R. Self-Assembly Strategies for Integrating Light Harvesting and Charge Separation in Artificial Photosynthetic Systems. Acc. Chem. Res. 2009, 42, 1910–1921. [Google Scholar] [CrossRef] [PubMed]
- Dumoulin, F.; Durmuş, M.; Ahsen, V.; Nyokong, T. Synthetic pathways to water-soluble phthalocyanines and close analogs. Co-ord. Chem. Rev. 2010, 254, 2792–2847. [Google Scholar] [CrossRef]
- Revuelta-Maza, M.A.; Hally, C.; Nonell, S.; De La Torre, G.; Torres, T. Crosswise Phthalocyanines with Collinear Functionalization: New Paradigmatic Derivatives for Efficient Singlet Oxygen Photosensitization. ChemPlusChem 2019, 84, 673–679. [Google Scholar] [CrossRef]
- Zorlu, Y.; Ermeydan, M.A.; Dumoulin, F.; Ahsen, V.; Savoie, H.; Boyle, R.W. Glycerol and galactose substituted zinc phthalocyanines. Synthesis and photodynamic activity. Photochem. Photobiol. Sci. 2009, 8, 312. [Google Scholar] [CrossRef] [PubMed]
- Huang, Y.; Xu, G.; Peng, Y.; Lin, H.; Zheng, X.; Xie, M. Zinc Phthalocyanine Tetrasulfonate (ZnPcS4): A New Photosensitizer for Photodynamic Therapy in Choroidal Neovascularization. J. Ocul. Pharmacol. Ther. 2007, 23, 377–386. [Google Scholar] [CrossRef]
- Lamch, Ł.; Kulbacka, J.; Dubińska-Magiera, M.; Saczko, J.; Wilk, K.A. Folate-directed zinc (II) phthalocyanine loaded polymeric micelles engineered to generate reactive oxygen species for efficacious photodynamic therapy of cancer. Photodiagn. Photodyn. Ther. 2019, 25, 480–491. [Google Scholar] [CrossRef]
- Wei, G.; Huang, L.; Jiang, Y.; Shen, Y.; Huang, Z.; Huang, Y.; Sun, X.; Zhao, C. Lenvatinib-zinc phthalocyanine conjugates as potential agents for enhancing synergistic therapy of multidrug-resistant cancer by glutathione depletion. Eur. J. Med. Chem. 2019, 169, 53–64. [Google Scholar] [CrossRef]
- Fazio, E.; Jaramillo-Garcia, J.; De La Torre, G.; Torres, T. Efficient Synthesis of ABAB Functionalized Phthalocyanines. Org. Lett. 2014, 16, 4706–4709. [Google Scholar] [CrossRef]
- Van Vlerken, L.E.; Vyas, T.K.; Amiji, M.M. Poly(ethylene glycol)-modified Nanocarriers for Tumor-targeted and Intracellular Delivery. Pharm. Res. 2007, 24, 1405–1414. [Google Scholar] [CrossRef] [PubMed]
- Liu, J.-Y.; Jiang, X.-J.; Fong, W.-P.; Ng, D.K.P. Highly photocytotoxic 1,4-dipegylated zinc(ii) phthalocyanines. Effects of the chain length on the in vitro photodynamic activities. Org. Biomol. Chem. 2008, 6, 4560. [Google Scholar] [CrossRef] [PubMed]
- Kroon, J.M.; Koehorst, R.B.M.; Van Dijk, M.; Sanders, G.M.; Sudhölter, E.J.R. Self-assembling properties of non-ionic tetraphenylporphyrins and discotic phthalocyanines carrying oligo(ethylene oxide) alkyl or alkoxy units. J. Mater. Chem. 1997, 7, 615–624. [Google Scholar] [CrossRef]
- Tuncel, S.; Dumoulin, F.; Gailer, J.; Sooriyaarachchi, M.; Atilla, D.; Durmuş, M.; Bouchu, D.; Savoie, H.; Boyle, R.W.; Ahsen, V. A set of highly water-soluble tetraethyleneglycol-substituted Zn(II) phthalocyanines: Synthesis, photochemical and photophysical properties, interaction with plasma proteins and in vitro phototoxicity. Dalton Trans. 2011, 40, 4067–4079. [Google Scholar] [CrossRef]
- Uslan, C.; Köksoy, B.; Durmuş, M.; Öztürk, Y.; Çakar, Z.P.; Gürsel, Y.H.; Sesalan, B.S.; Işleyen, N.D. The synthesis and investigation of photochemical, photophysical and biological properties of new lutetium, indium, and zinc phthalocyanines substituted with PEGME-2000 blocks. JBIC J. Boil. Inorg. Chem. 2019, 24, 191–210. [Google Scholar] [CrossRef]
- Foley, S.; Jones, G.; Liuzzi, R.; McGarvey, D.J.; Perry, M.H.; Truscott, T.G. The synthesis and photophysical properties of polyether substituted phthalocyanines of potential use in photodynamic therapy. J. Chem. Soc. Perkin Trans. 2 1997, 29, 1725–1730. [Google Scholar] [CrossRef]
- Bandera, Y.; Burdette, M.K.; Shetzline, J.A.; Jenkins, R.; Creager, S.E.; Foulger, S.H. Synthesis of water soluble axially disubstituted silicon (IV) phthalocyanines with alkyne & azide functionality. Dyes Pigments 2016, 125, 72–79. [Google Scholar]
- Huang, J.-D.; Wang, S.; Lo, P.-C.; Fong, W.-P.; Ko, W.-H.; Ng, D.K.P. Halogenated Silicon (IV) phthalocyanines with axial poly(ethylene glycol) chains. Synthesis, spectroscopic properties, complexation with bovine serum albumin and in vitro photodynamic activities. New J. Chem. 2004, 28, 348–354. [Google Scholar] [CrossRef]
- Uslan, C.; Öztürk, Y.; Yıldız, B.T.; Çakar, Z.P.; Göksel, M.; Durmus, M.; Gursel, Y.H.; Sesalan, B.Ş.; Işleyen, N.D. A novel of PEG-conjugated phthalocyanine and evaluation of its photocytotoxicity and antibacterial properties for photodynamic therapy. J. Porphyr. Phthalocyanines 2018, 22, 10–24. [Google Scholar] [CrossRef]
- Jin, Y.; Zhang, X.; Zhang, B.; Kang, H.; Du, L.; Li, M. Nanostructures of an amphiphilic zinc phthalocyanine polymer conjugate for photodynamic therapy of psoriasis. Colloids Surf. B Biointerfaces 2015, 128, 405–409. [Google Scholar] [CrossRef]
- Revuelta-Maza, M.A.; Nonell, S.; De La Torre, G.; Torres, T. Boosting the singlet oxygen photosensitization abilities of Zn(II) phthalocyanines through functionalization with bulky fluorinated substituents. Org. Biomol. Chem. 2019, 17, 7448–7454. [Google Scholar] [CrossRef] [PubMed]
- Li, M.; Khoshdel, E.; Haddleton, D.M. Synthesis of water soluble PEGylated (copper) phthalocyanines via Mitsunobu reaction and Cu(i)-catalysed azide–alkyne cycloaddition (CuAAC) “click” chemistry. Polym. Chem. 2013, 4, 4405. [Google Scholar] [CrossRef]
- Revuelta-Maza, M.Á.; González-Jiménez, P.; Hally, C.; Agut, M.; Nonell, S.; de la Torre, G.; Torres, T. Fluorine-substituted tetracationic ABAB-phthalocyanines for efficient photodynamic inactivation of Gram-positive and Gram-negative bacteria. Eur. J. Med. Chem. 2020, 187, 111957. [Google Scholar] [CrossRef] [PubMed]
- Ajiro, H.; Takahashi, Y.; Akashi, M. Thermosensitive Biodegradable Homopolymer of Trimethylene Carbonate Derivative at Body Temperature. Macromolecules 2012, 45, 2668–2674. [Google Scholar] [CrossRef]
- Garcia, A.M.; Weerasekera, H.D.A.; Pitre, S.P.; McNeill, B.; Lissi, E.; Edwards, A.M.; Alarcon, E.I.; Edwards-Mujica, A.M. Photodynamic performance of zinc phthalocyanine in HeLa cells: A comparison between DPCC liposomes and BSA as delivery systems. J. Photochem. Photobiol. B Boil. 2016, 163, 385–390. [Google Scholar] [CrossRef] [PubMed]
- Young, J.; Yee, M.; Kim, H.; Cheung, J.; Chino, T.; Düzgüneş, N.; Konopka, K. Phototoxicity of Liposomal Zn- and Al-phthalocyanine Against Cervical and Oral Squamous Cell Carcinoma Cells In Vitro. Med. Sci. Monit. Basic Res. 2016, 22, 156–164. [Google Scholar] [CrossRef]
- Li, L.; Luo, Z.; Chen, Z.; Chen, J.; Zhou, S.; Xu, P.; Hu, P.; Wang, J.; Chen, N.; Huang, J.; et al. Enhanced Photodynamic Efficacy of Zinc Phthalocyanine by Conjugating to Heptalysine. Bioconjug. Chem. 2012, 23, 2168–2172. [Google Scholar] [CrossRef]
- Çakır, D.; Göksel, M.; Çakır, V.; Durmuş, M.; Biyiklioglu, Z.; Kantekin, H. Amphiphilic zinc phthalocyanine photosensitizers: Synthesis, photophysicochemical properties and in vitro studies for photodynamic therapy. Dalton Trans. 2015, 44, 9646–9658. [Google Scholar] [CrossRef]
- Rello, S.; Stockert, J.C.; Moreno, V.; Pacheco, M.; Juarranz, A.; Villanueva, A.; Cañete, M.; Gamez, A. Morphological criteria to distinguish cell death induced by apoptotic and necrotic treatments. Apoptosis 2005, 10, 201–208. [Google Scholar] [CrossRef]
- Makhseed, S.; Tuhl, A.; Samuel, J.; Zimcik, P.; Al-Awadi, N.; Novakova, V. New highly soluble phenoxy-substituted phthalocyanine and azaphthalocyanine derivatives: Synthesis, photochemical and photophysical studies and atypical aggregation behavior. Dyes Pigments 2012, 95, 351–357. [Google Scholar] [CrossRef]
- Kuznetsova, N.A.; Gretsova, N.S.; Kalmykova, E.A.; Makarova, E.A.; Dashkevich, S.N.; Negrimovsky, V.M.; Lukyanets, E.A. Structure-photochemical properties relationship for porphyrins and related compounds. Zh. Obshch. Khim 2000, 70, 140–148. [Google Scholar]
- Jiménez-Banzo, A.; Ragàs, X.; Kapusta, P.; Nonell, S. Time-resolved methods in biophysics. 7. Photon counting vs. analog time-resolved singlet oxygen phosphorescence detection. Photochem. Photobiol. Sci. 2008, 7, 1003. [Google Scholar] [CrossRef] [PubMed]
- Nonell, S.; Braslavsky, S.E. [4] Time-resolved singlet oxygen detection. In Methods in Enzymology; Academic Press: Cambridge, MA, USA, 2000; Volume 319, pp. 37–49. ISBN 0076-6879. [Google Scholar]
- Martí, C.; Jürgens, O.; Cuenca, O.; Casals, M.; Nonell, S. Aromatic ketones as standards for singlet molecular oxygen O2(1Δg) photosensitization. Time-resolved photoacoustic and near-IR emission studies. J. Photochem. Photobiol. A Chem. 1996, 97, 11–18. [Google Scholar] [CrossRef]
- Schmidt, R.; Tanielian, C.; Dunsbach, R.; Wolff, C. Phenalenone, a universal reference compound for the determination of quantum yields of singlet oxygen O2(1Δg) sensitization. J. Photochem. Photobiol. A Chem. 1994, 79, 11–17. [Google Scholar] [CrossRef]
- Blázquez-Castro, A.; Carrasco, E.; Calvo, M.I.; Jaén, P.; Stockert, J.C.; Juarranz, Á.; Sanz-Rodriguez, F.; Espada, J. Protoporphyrin IX-dependent photodynamic production of endogenous ROS stimulates cell proliferation. Eur. J. Cell Boil. 2012, 91, 216–223. [Google Scholar] [CrossRef] [PubMed]


© 2020 by the authors. Licensee MDPI, Basel, Switzerland. This article is an open access article distributed under the terms and conditions of the Creative Commons Attribution (CC BY) license (http://creativecommons.org/licenses/by/4.0/).