Calculation of the Isobaric Heat Capacities of the Liquid and Solid Phase of Organic Compounds at and around 298.15 K Based on Their “True” Molecular Volume


Abstract
:1. Introduction
2. General Procedure
2.1. Geometry Optimization
2.2. Calculation of the “True” Molecular Volume
3. Results
3.1. General Remarks
3.2. “True” Molecular Volumes
3.3. Sources of Heat-Capacity Data
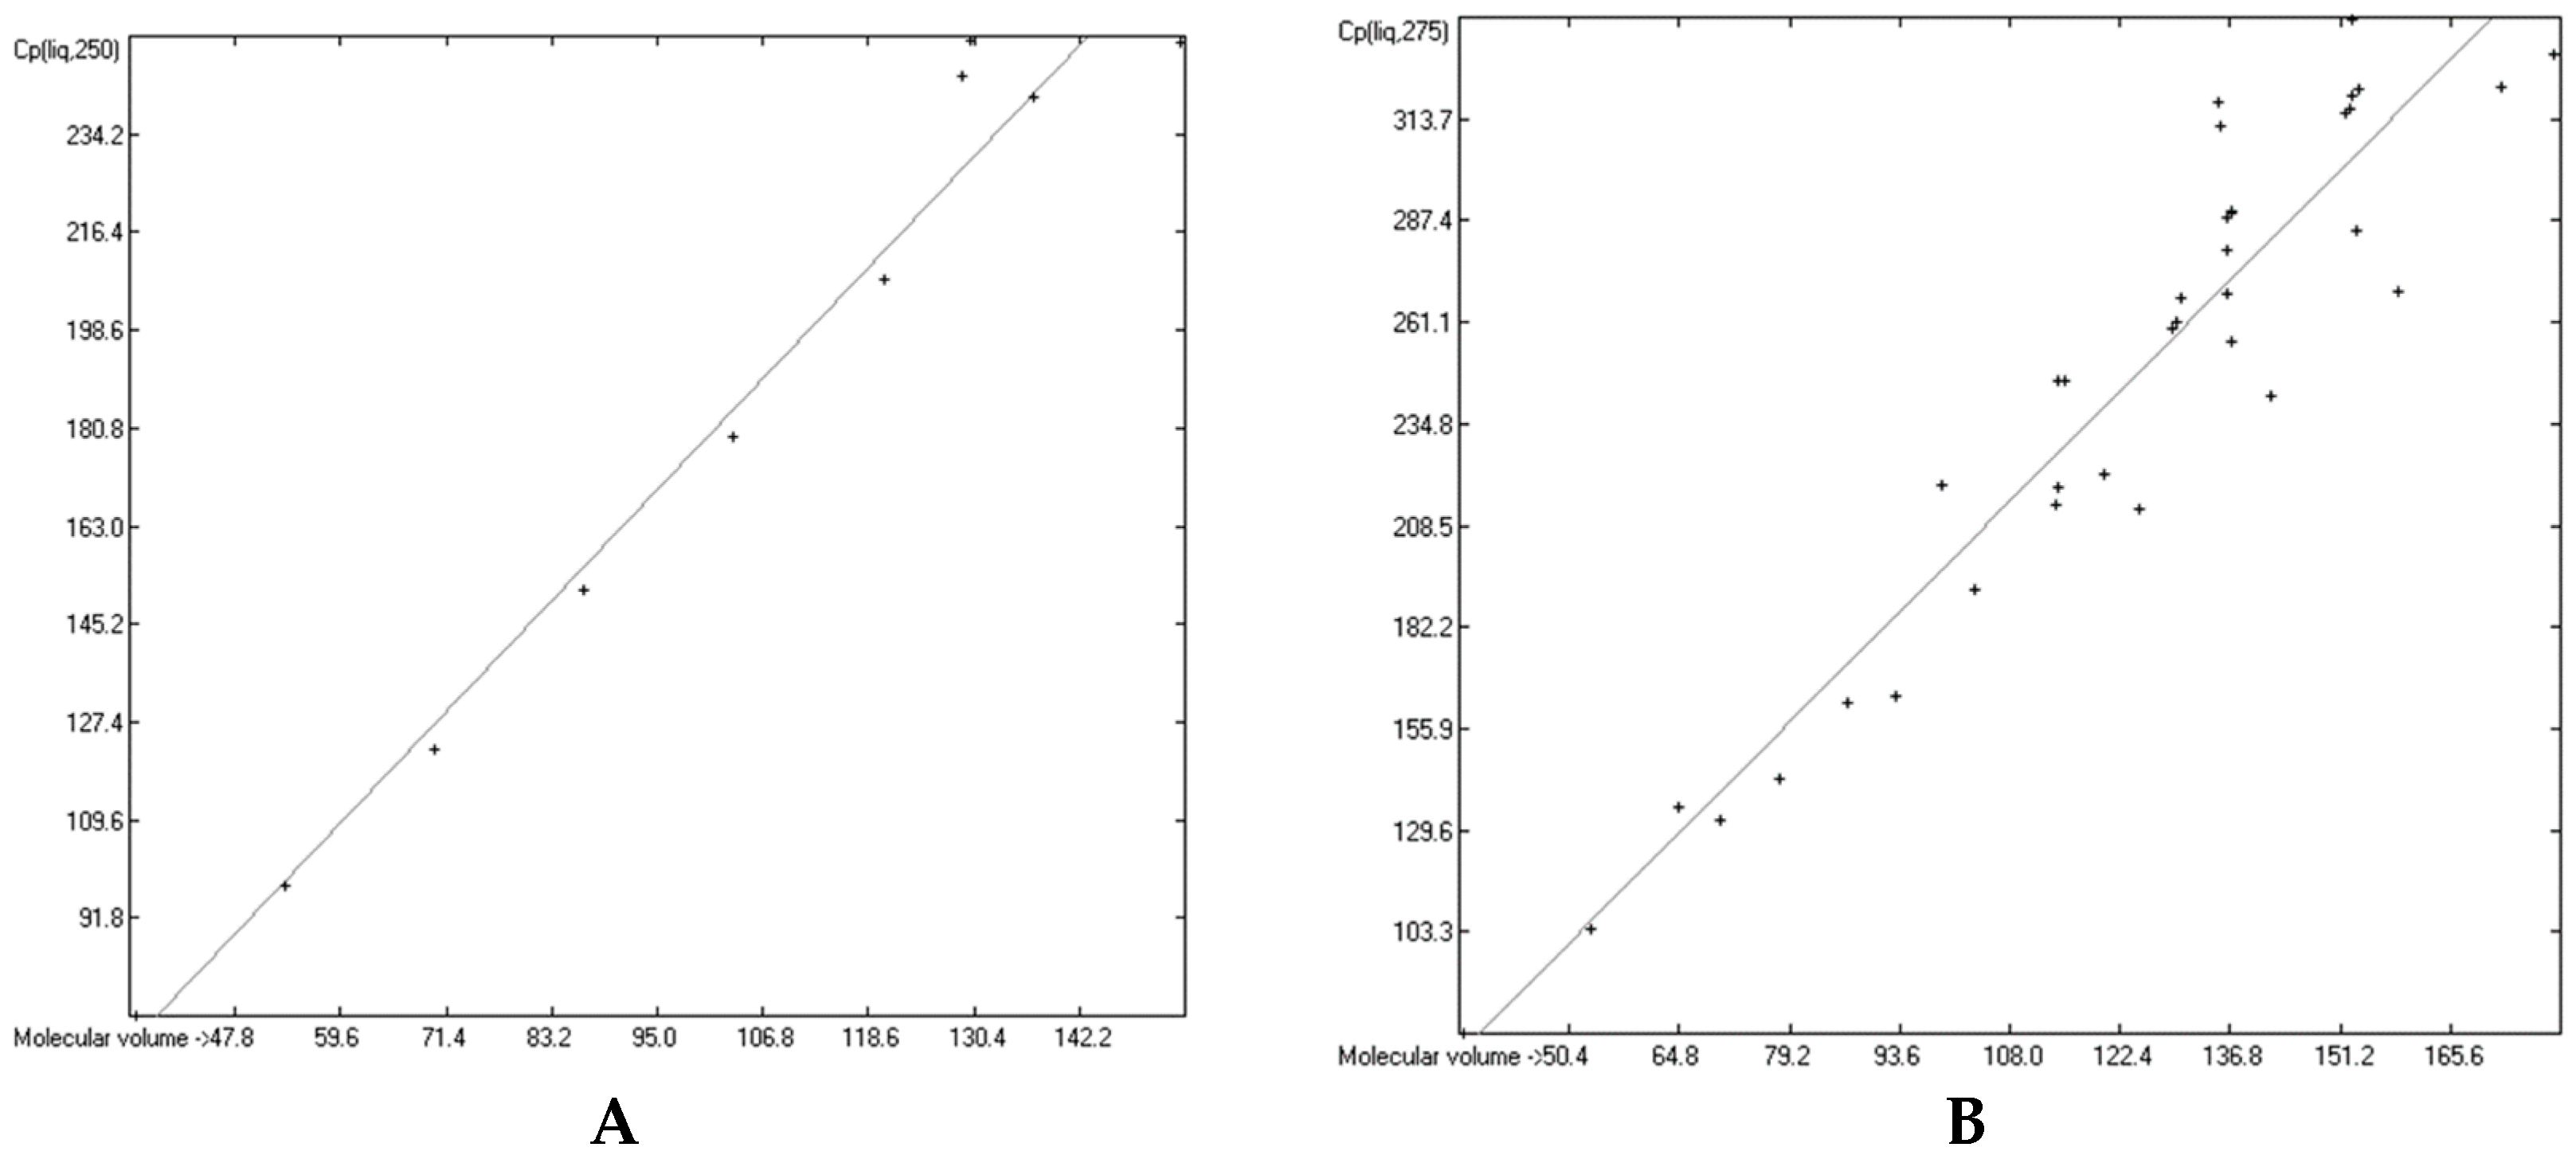
3.4. Heat Capacity of Liquids
3.4.1. Heat Capacity of Liquids of Molecules Free of Hydroxy Groups
3.4.2. Heat Capacity of Liquid Alcohols and Acids
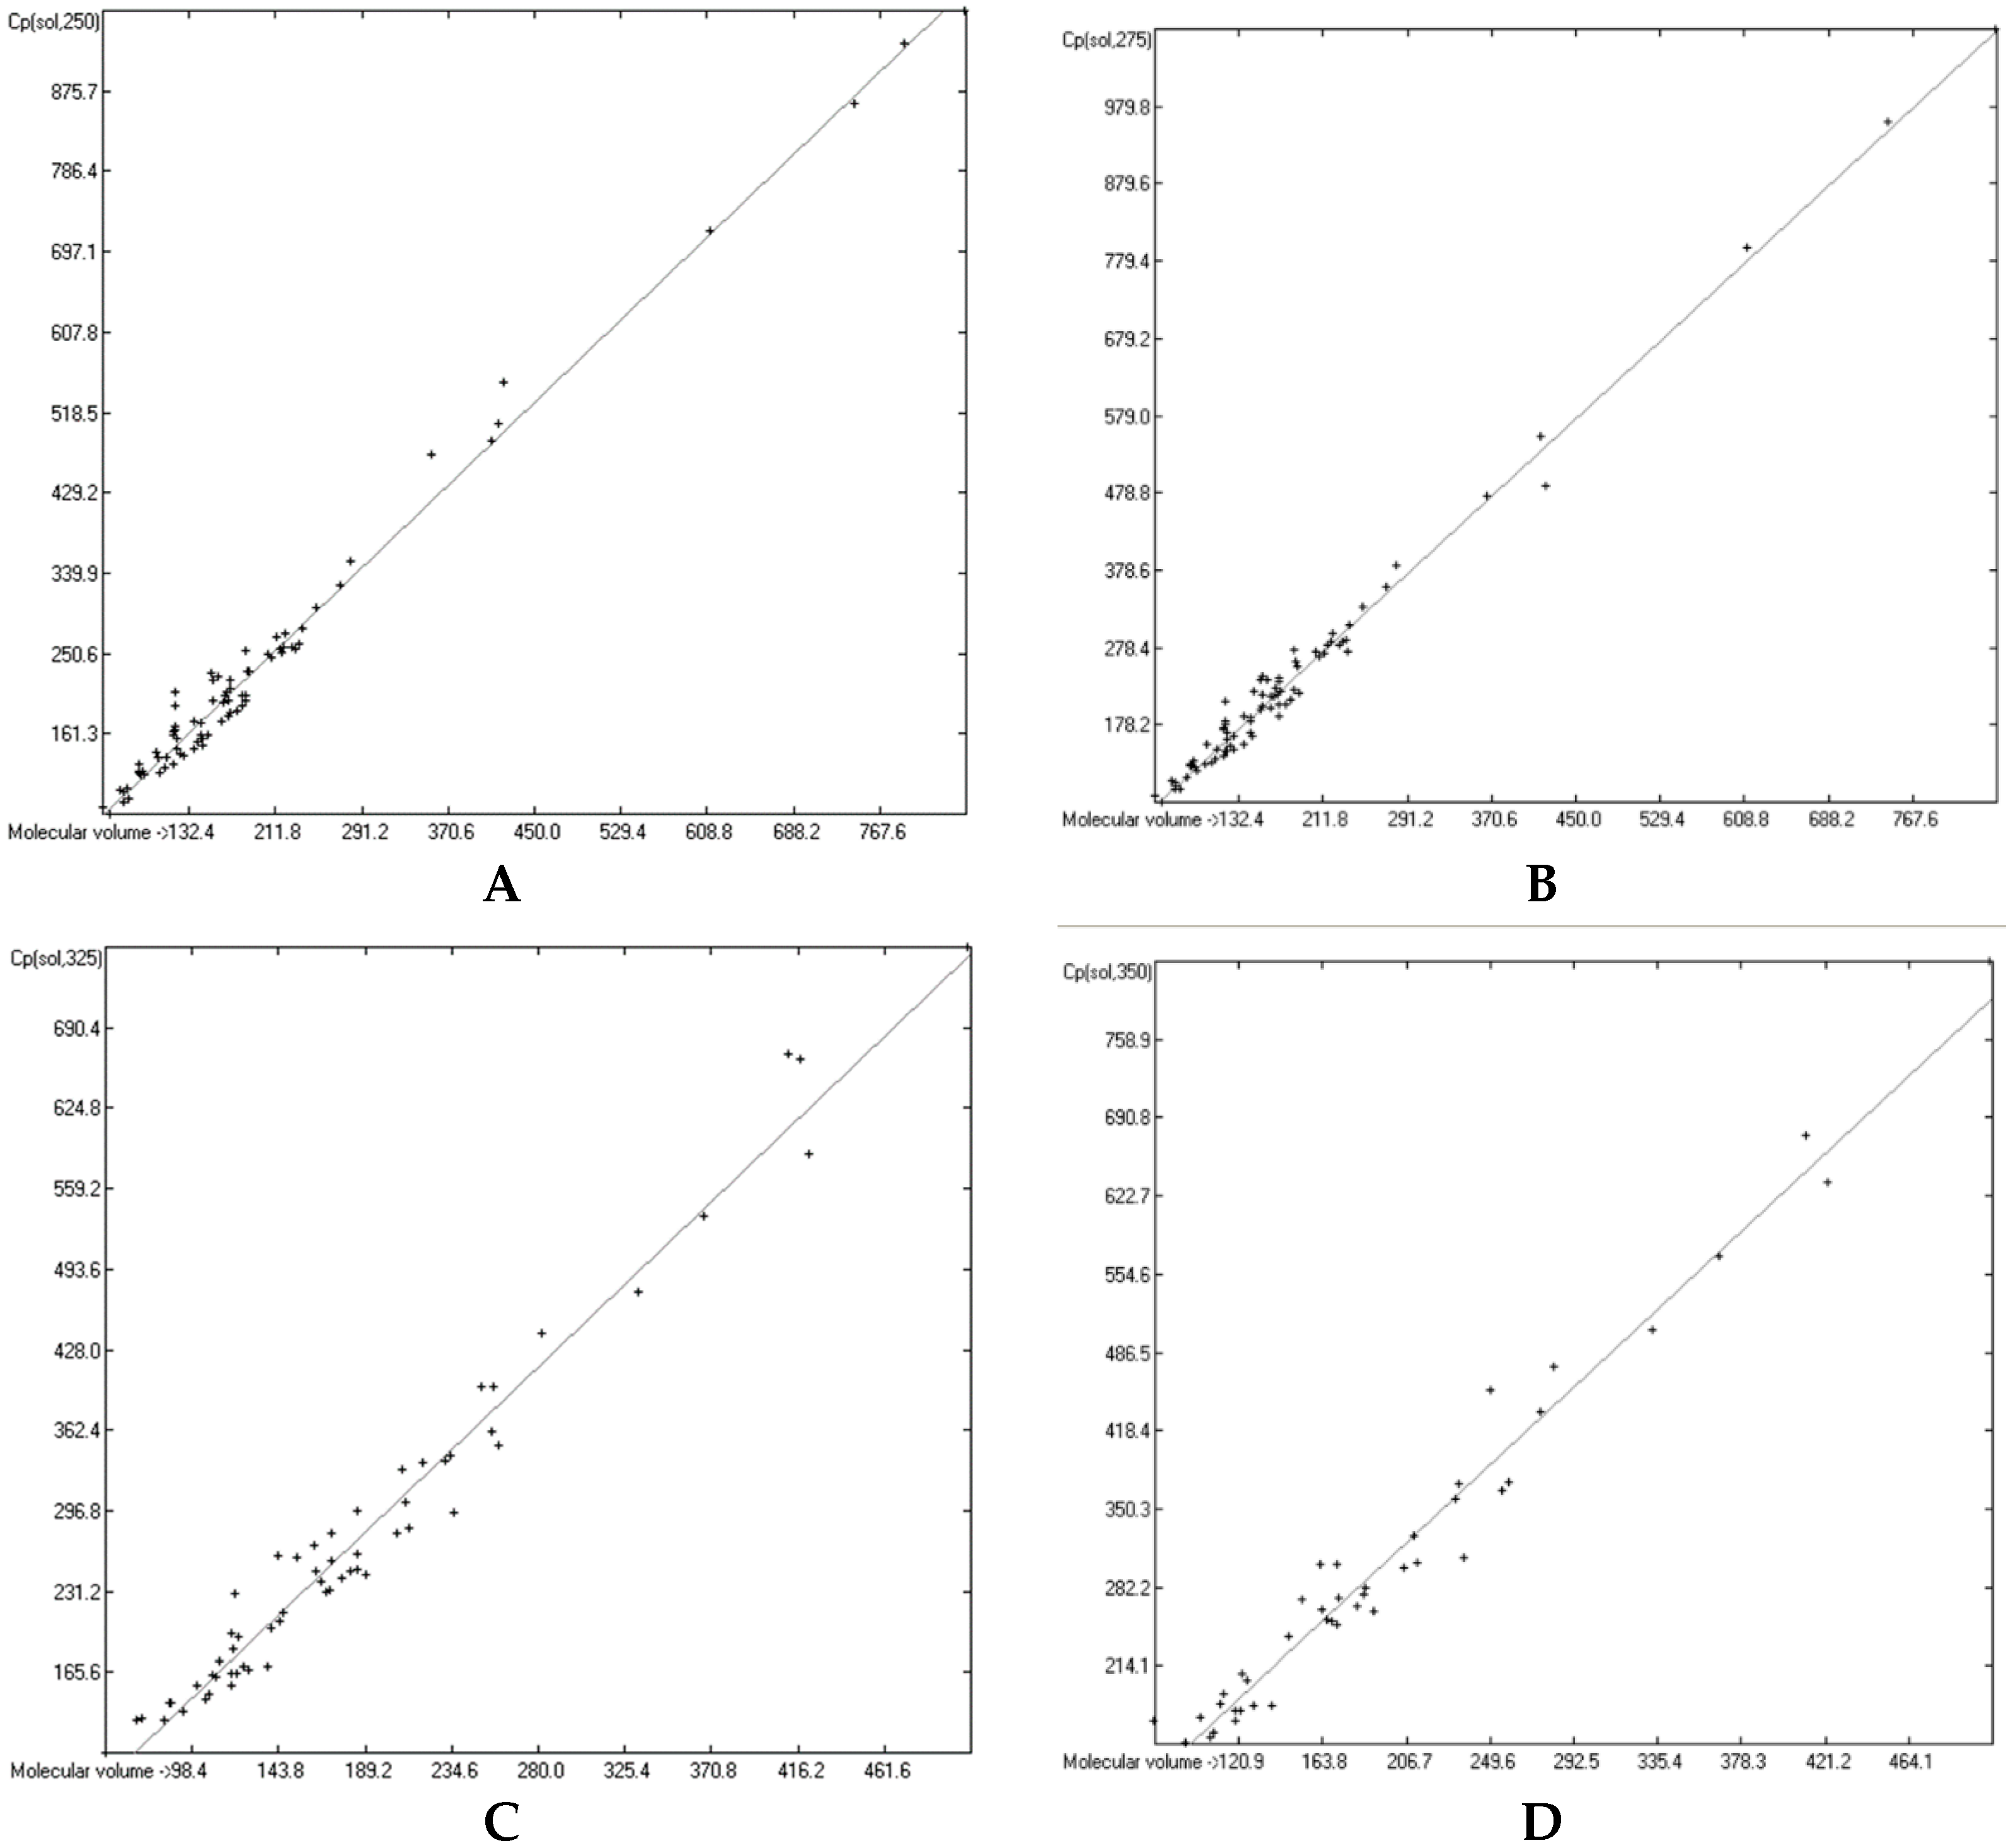
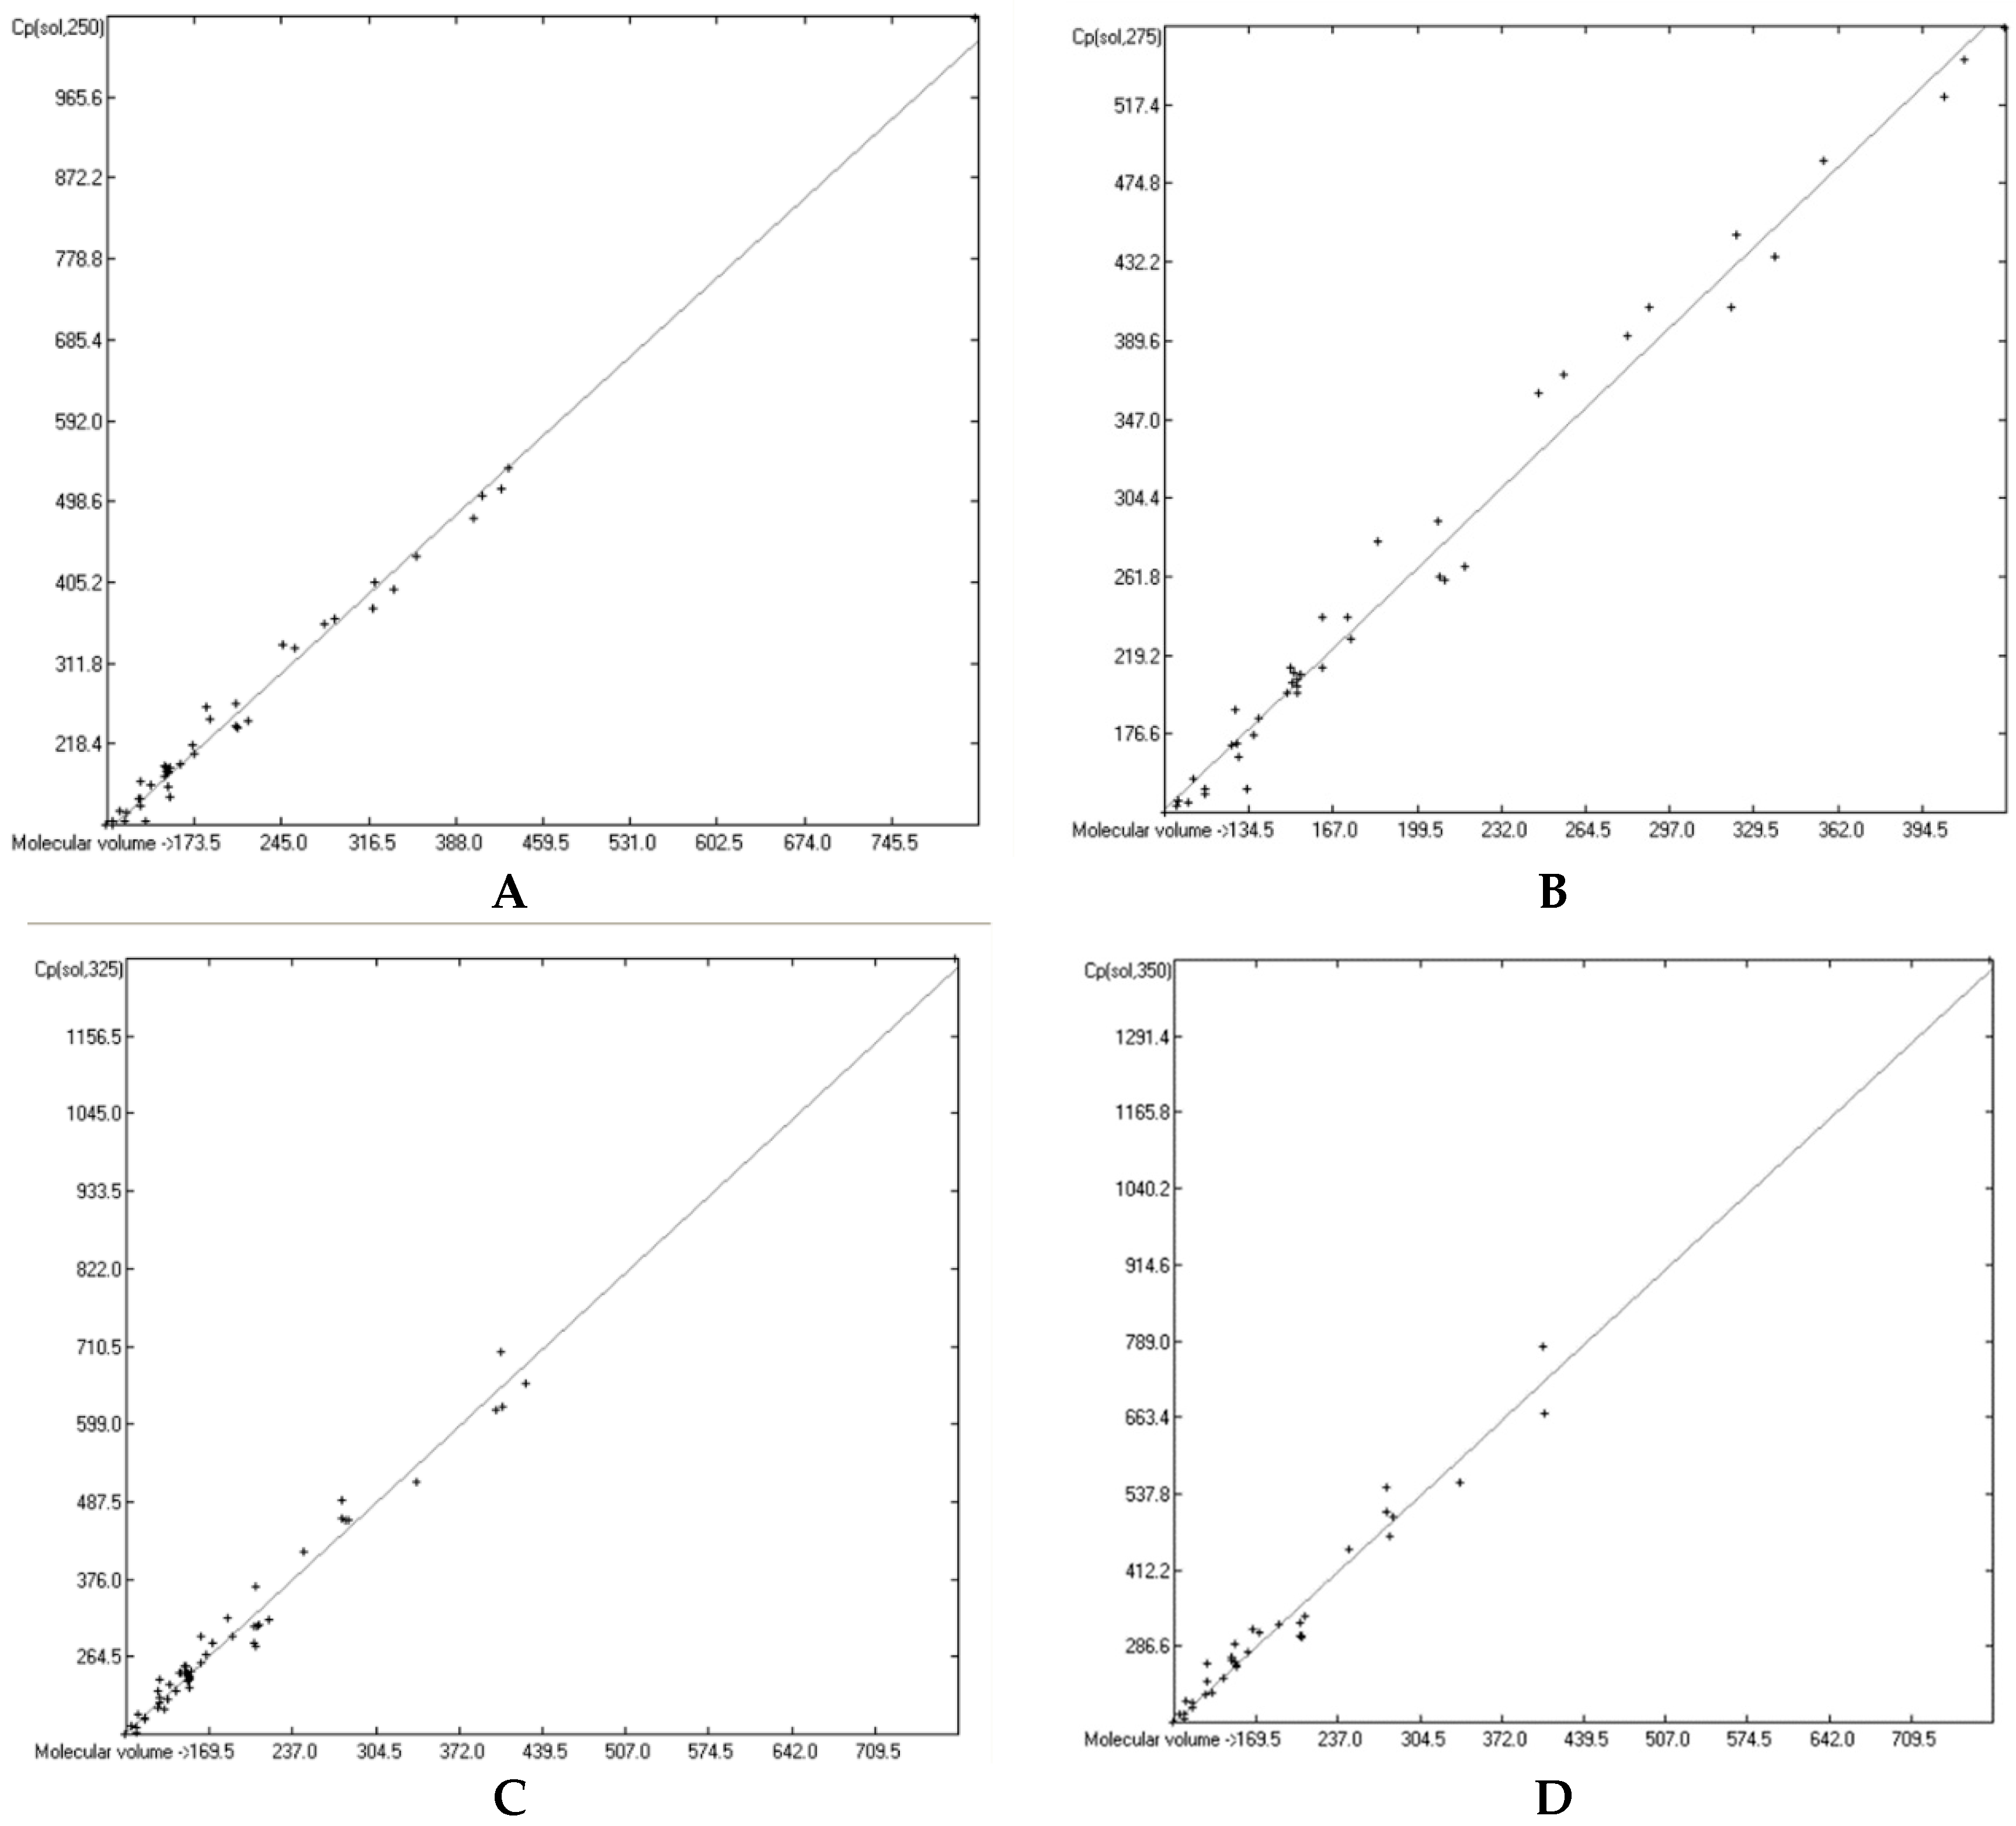
3.5. Heat Capacity of Solids
3.6. Temperature Dependence of the Heat Capacities
4. Conclusions
Supplementary Materials
Funding
Acknowledgments
Conflicts of Interest
References
- Karasz, F.E. Adiabatic calorimetry. Contemp. Phys. 1963, 4, 321–330. [Google Scholar] [CrossRef]
- Watson, E.; O’Neill, S. Differential Microcalorimeter. U.S. Patent 3,263,484, 2 August 1966. [Google Scholar]
- Simon, S.L. Temperature-modulated differential scanning calorimetry: Theory and application. Thermochim. Acta 2001, 374, 55–71. [Google Scholar] [CrossRef]
- Danley, R.L. New modulated DSC measurement technique. Thermochim. Acta 2003, 402, 91–98. [Google Scholar] [CrossRef]
- Chickos, J.S.; Hesse, D.G.; Liebman, J.F. A Group Additivity Approach for the Estimation of Heat Capacities of Organic Liquids and Solids. Struct. Chem. 1993, 4, 261–269. [Google Scholar] [CrossRef]
- Ruzicka, V.; Domalski, E.S. Estimation of the Heat Capacities of Organic Liquids as a Function of Temperature using Group Additivity. I. Hydrocarbon Compounds. J. Phys. Chem. Ref. Data 1993, 22, 597–618. [Google Scholar] [CrossRef]
- Ruzicka, V.; Domalski, E.S. Estimation of the Heat Capacities of Organic Liquids as a Function of Temperature using Group Additivity. II. Compounds of Carbon, Hydrogen, Halogens, Nitrogen, Oxygen, and Sulfur. J. Phys. Chem. Ref. Data 1993, 22, 619–657. [Google Scholar] [CrossRef]
- Zàbransky, M.; Ruzicka, V. Estimation of the Heat Capacities of Organic Liquids as a Function of Temperature using Group Additivity: An Amendment. J. Phys. Chem. Ref. Data 2004, 33, 1071–1081. [Google Scholar] [CrossRef]
- Goodman, B.T.; Wilding, W.V.; Oscarson, J.L.; Rowley, R.L. Use of the DIPPR Database for Development of Quantitative Structure-Property Relationship Correlations: Heat Capacity of Solid Organic Compounds. J. Chem. Eng. Data 2004, 49, 24–31. [Google Scholar] [CrossRef]
- Kolskà, Z.; Kukal, J.; Zàbransky, M.; Ruzicka, V. Estimation of the Heat Capacity of Organic Liquids as a Function of Temperature by a Three-Level Group Contribution Method. Ind. Eng. Chem. Res. 2008, 47, 2075–2085. [Google Scholar] [CrossRef]
- Gardas, R.L.; Coutinho, J.A.P. A Group Contribution Method for Heat Capacity Estimation of Ionic Liquids. Ind. Eng. Chem. Res. 2008, 47, 5751–5757. [Google Scholar] [CrossRef]
- Ceriani, R.; Gani, R.; Meirelles, A.J.A. Prediction of heat capacities and heats of vaporization of organic liquids by group contribution methods. Fluid Phase Equil. 2009, 283, 49–55. [Google Scholar] [CrossRef]
- Valderrama, J.O.; Toro, A.; Rojas, R.E. Prediction of the heat capacity of ionic liquids using the mass connectivity index and a group contribution method. J. Chem. Thermodyn. 2011, 43, 1068–1073. [Google Scholar] [CrossRef]
- Randic, M. Characterization of molecular branching. J. Am. Chem. Soc. 1975, 97, 6609–6615. [Google Scholar] [CrossRef]
- Valderrama, J.O.; Rojas, R.E. Mass connectivity index, a new molecular parameter for the estimation of ionic liquid properties. Fluid Phase Equil. 2010, 297, 107–112. [Google Scholar] [CrossRef]
- Sattari, M.; Gharagheizi, F.; Ilani-Kashkouli, P.; Mohammadi, A.H.; Ramjugernath, D. Development of a group contribution method for the estimation of heat capacities of ionic liquids. J. Therm. Anal. Calorim. 2014, 115, 1863–1882. [Google Scholar] [CrossRef]
- Albert, J.; Müller, K. A Group Contribution Method for the Thermal Properties of Ionic Liquids. Ind. Eng. Chem. Res. 2014, 53, 17522–17526. [Google Scholar] [CrossRef]
- Nancarrow, P.; Lewis, M.; AbouChakra, L. Group Contribution Methods for Estimation of Ionic Liquid Heat Capacities: Critical Evaluation and Extension. Chem. Eng.Technol. 2015, 38, 632–644. [Google Scholar] [CrossRef]
- Morad, N.A.; Kamal, A.A.M.; Panau, F.; Yew, T.W. Liquid Specific Heat Capacity Estimation for Fatty Acids, Triacylglycerols, and Vegetable Oils Based on Their Fatty Acid Composition. J. Am. Oil Chem. Soc. 2000, 77, 1001–1005. [Google Scholar] [CrossRef]
- Reid, R.C.; Praustnitz, J.M.; Poling, B.E. The Properties of Gases and Liquids, 4th ed.; McGraw Hill: Singapore, 1988. [Google Scholar]
- Rihany, D.N.; Doraisamy, L.K. Estimation of Heat Capacity, of Organic Compounds from Group Contributions. Ind. Eng. Chem. Fundam. 1965, 4, 17–21. [Google Scholar] [CrossRef]
- Sallamie, N.; Shaw, J.M. Heat capacity prediction for polynuclear aromatic solids using vibration spectra. Fluid Phase Equil. 2005, 237, 100–110. [Google Scholar] [CrossRef]
- Müller, K.; Albert, J. Contribution of the Individual Ions to the Heat Capacity of Ionic Liquids. Ind. Eng. Chem. Res. 2014, 53, 10343–10346. [Google Scholar] [CrossRef]
- Barati-Harooni, A.; Najafi-Marghmaleki, A.; Arabloo, M.; Mohammadi, A.H. Chemical structural models for prediction of heat capacities of ionic liquids. J. Mol. Liq. 2017, 232, 113–122. [Google Scholar] [CrossRef]
- Preiss, U.P.R.M.; Slattery, J.M.; Krossing, I. In Silico Prediction of Molecular Volumes, Heat Capacities, and Temperature-Dependent Densities of Ionic Liquids. Ind. Eng. Chem. Res. 2009, 48, 2290–2296. [Google Scholar] [CrossRef]
- Paulechka, Y.U.; Kabo, A.G.; Blokhin, A.V.; Kabo, G.J.; Shevelyova, M.P. Heat Capacity of Ionic Liquids: Experimental Determination and Correlations with Molar Volume. J. Chem. Eng. Data 2010, 55, 2719–2724. [Google Scholar] [CrossRef]
- Glasser, L.; Jenkins, H.D.B. Volume-Based Thermodynamics: A Prescription for Its Application and Usage in Approximation and Prediction of Thermodynamic Data. J. Chem. Eng. Data 2011, 56, 874–880. [Google Scholar] [CrossRef]
- Glasser, L.; Jenkins, H.D.B. Ambient isobaric heat capacities, C(p,m), for ionic solids and liquids: An application of volume-based thermodynamics (VBT). Inorg. Chem. 2011, 5, 8565–8569. [Google Scholar] [CrossRef] [PubMed]
- Leitner, J.; Vonka, P.; Sedmidubsky, D.; Svoboda, P. Application of Neumann–Kopp rule for the estimation of heat capacity of mixed oxides. Thermochim. Acta 2010, 497, 7–13. [Google Scholar] [CrossRef]
- Naef, R. A Generally Applicable Computer Algorithm Based on the Group Additivity Method for the Calculation of Seven Molecular Descriptors: Heat of Combustion, LogPO/W, LogS, Refractivity, Polarizability, Toxicity and LogBB of Organic Compounds; Scope and Limits of Applicability. Molecules 2015, 20, 18279–18351. [Google Scholar] [CrossRef] [Green Version]
- Naef, R.; Acree, W.E. Calculation of Five Thermodynamic Molecular Descriptors by Means of a General Computer Algorithm Based on the Group-Additivity Method: Standard Enthalpies of Vaporization, Sublimation and Solvation, and Entropy of Fusion of OrdinaryOrganic Molecules and Total Phase-Change Entropy of Liquid Crystals. Molecules 2017, 22, 1059. [Google Scholar] [CrossRef]
- Naef, R.; Acree, W.E. Application of a General Computer Algorithm Based on the Group-Additivity Method for the Calculation of two Molecular Descriptors at both Ends of Dilution: Liquid Viscosity and Activity Coefficient in Water at infinite Dilution. Molecules 2018, 23, 5. [Google Scholar] [CrossRef]
- Naef, R.; Acree, W.E., Jr. Calculation of the Surface Tension of Ordinary Organic and Ionic Liquids by Means of a Generally Applicable Computer Algorithm Based on the Group-Additivity Method. Molecules 2018, 23, 1224. [Google Scholar] [CrossRef]
- Lide, D.R. (Ed.) CRC Handbook of Chemistry and Physics; CRC Press: Boca Raton, FL, USA, 2005. [Google Scholar]
- Van der Bondi, A. Waals Volumes and Radii. J. Phys. Chem. 1964, 68, 441–451. [Google Scholar] [CrossRef]
- Ermer, O. Calculation of molecular properties using force fields. Applications in organic chemistry. Springer Link Ser. Struct. Bond. 2005, 27, 161–211. [Google Scholar]
- Kurtz, S.S., Jr.; Sankin, A. Calculation of Molecular Volumes of Hydrocarbons. Ind. Eng. Chem. 1954, 46, 2186–2191. [Google Scholar] [CrossRef]
- Ye, C.; Shreeve, J.M. Rapid and Accurate Estimation of Densities of Room-Temperature Ionic Liquids and Salts. J. Phys. Chem. A 2007, 111, 1456–1461. [Google Scholar] [CrossRef]
- Jenkins, H.D.B.; Roobottom, H.K.; Passmore, J.; Glasser, L. Relationships among Ionic Lattice Energies, Molecular (Formula Unit) Volumes, and Thermochemical Radii. Inorg. Chem. 1999, 38, 3609–3620. [Google Scholar] [CrossRef] [PubMed]
- Conolly, M.L. Computation of Molecular Volume. J. Am. Chem. Soc. 1985, 107, 1118–1124. [Google Scholar] [CrossRef]
- Gavezzotti, A. The Calculation of Molecular Volumes and the Use of Volume Analysis in the Investigation of Structured Media and of Solid-state Organic Reactivity. J. Am. Chem. Soc. 1983, 105, 5220–5225. [Google Scholar] [CrossRef]
- Zhao, Y.H.; Abraham, M.H.; Zissimos, A.M. Determination of McGowan Volumes for Ions and Correlation with van der Waals Volumes. J. Chem. Inf. Comput. Sci. 2003, 43, 1848–1854. [Google Scholar] [CrossRef]
- Ruzicka, V.; Zabransky, M.; Majer, V. Heat Capacities of Organic Compounds in the Liquid State II. C1 to C18 1-Alkanes. J. Phys. Chem. Ref. Data 1991, 20, 405–444. [Google Scholar] [CrossRef]
- Zabransky, M.; Ruzicka, V.; Majer, V. Heat Capacities of Organic Compounds in the Liquid State, I. C1 to C18 1-Alkanols. J. Phys. Chem. Ref. Data 1990, 19, 719–762. [Google Scholar] [CrossRef]
- Costa, J.C.S.; Mendes, A.; Santos, L.M.N.B.F. Chain Length Dependence of the Thermodynamic Properties of n-Alkanes and their Monosubstituted Derivatives. J. Chem. Eng. Data 2018, 63, 1–20. [Google Scholar] [CrossRef]
- Domalski, E.S.; Hearing, E.D. Estimation of the Thermodynamic Properties of Hydrocarbons at 298.15K. J. Phys. Chem. Ref. Data 1988, 17, 1637–1678. [Google Scholar] [CrossRef]
- Domalski, E.S.; Hearing, E.D. Heat Capacities and Entropies of Organic Compounds in the Condensed Phase Volume II. J. Phys. Chem. Ref. Data 1990, 19, 881–1047. [Google Scholar] [CrossRef]
- Domalski, E.S.; Hearing, E.D. Heat Capacities and Entropies of Organic Compounds in the Condensed Phase Volume III. J. Phys. Chem. Ref. Data 1996, 25, 1–523. [Google Scholar] [CrossRef]
- Jin, Y.; Wunderlich, B. Heat Capacities of Parafflns and Polyethylene. J. Phys. Chem. 1991, 95, 9000–9007. [Google Scholar] [CrossRef]
- Korotkovskii, V.I.; Lebedev, A.V.; Ryshkova, O.S.; Bolotnikov, M.F.; Shevchenko, Y.E.; Neruchev, Y.A. Thermophysical Properties of Liquid Squalane C30H62 within the Temperature Range of 298.15-413.15 K at Atmospheric Pressure. High Temp. 2012, 50, 471–474. [Google Scholar] [CrossRef]
- Wang, L.; Tan, Z.-C.; Meng, S.-H.; Liang, D.-B. Low-temperature heat capacity and phase transition of n-hexatriacontane. Thermochim. Acta 1999, 342, 59–65. [Google Scholar] [CrossRef] [Green Version]
- Tkachenko, E.S.; Varushchenko, R.M.; Druzhinina, A.I.; Reshetova, M.D.; Borisova, N.E. Heat Capacity and Thermodynamic Functions of Diphenylacetylene. J. Chem. Eng. Data 2011, 56, 4700–4709. [Google Scholar] [CrossRef]
- Varushchenko, R.M.; Druzhinina, A.I.; Senyavin, V.M.; Sarkisova, V.S. The low-temperature heat capacities, phase transitions and thermodynamic properties of 1,3-dimethyladamantane and 1-ethyladamantane. J. Chem. Thermodyn. 2005, 37, 141–151. [Google Scholar] [CrossRef]
- Smirnova, N.N.; Letyanina, I.A.; Zakharova, Y.A.; Pimerzin, A.A.; Vishnevskaya, E.E. Thermodynamic properties of neopentylbenzene over the range from T -> (0 to 350) K. J. Chem. Thermodyn. 2012, 48, 118–122. [Google Scholar] [CrossRef]
- Cheda, J.A.R.; Westrum, E.F., Jr. Subambient-Temperature Thermophysics of Acenaphthene and Acenaphthylene: Molecular Disorder in the Latter. J. Phys. Chem. 1994, 98, 2482–2488. [Google Scholar] [CrossRef]
- Yagofarov, M.I.; Lapuk, S.E.; Mukhametzyanov, T.A.; Ziganshin, M.A.; Schick, C.; Solomonov, B.N. Application of fast scanning calorimetry to the fusion thermochemistry of low-molecular-weight organic compounds: Fast-crystallizing m-terphenyl heat capacities in a deeply supercooled liquid state. Thermochim. Acta 2018, 668, 96–102. [Google Scholar] [CrossRef]
- Rodrigues, A.S.M.C.; Rocha, M.A.A.; Santos, L.M.N.B.F. Isomerization effect on the heat capacities and phase behavior of oligophenyls isomers series. J. Chem. Thermodyn. 2013, 63, 78–83. [Google Scholar] [CrossRef]
- Varushchenko, R.M.; Efimova, A.A.; Druzhinina, A.I.; Tkachenko, E.S.; Nesterov, I.A.; Nesterova, T.N.; Verevkin, S.P. The heat capacities and thermodynamic functions of 4-methylbiphenyl and 4-tert-butylbiphenyl. J. Chem. Thermodyn. 2010, 42, 1265–1272. [Google Scholar] [CrossRef]
- Efimova, A.A.; Varushchenko, R.M.; Druzhinina, A.I.; Chelovskaya, N.V.; Tkachenko, E.S.; Nesterov, I.A.; Nesterova, T.N. Heat Capacity and Thermodynamic Functions of 4,4′-Dimethylbiphenyl and 4,4′-Di-tert-butylbiphenyl. Russ. J. Phys. Chem. A 2010, 84, 343–349. [Google Scholar] [CrossRef]
- Tkachenko, E.S.; Druzhinina, A.I.; Varushchenko, R.M.; Tarazanov, S.V.; Nesterova, T.N.; Reshetova, M.D.; Polyakova, O.V. Heat Capacity and Thermodynamic Functions of 2-Methylbiphenyl and 3,3′-Dimethylbiphenyl in the Range of 6 to 372 K. Russ. J. Phys. Chem. A 2013, 87, 705–713. [Google Scholar] [CrossRef]
- Ribeiro da Silva, M.A.V.; Santos, L.M.N.B.F.; Lima, L.M.S.S. Thermodynamic study of 1,2,3-triphenylbenzene and 1,3,5-triphenylbenzene. J. Chem. Thermodyn. 2010, 42, 134–139. [Google Scholar] [CrossRef]
- Fulem, M.; Lastovka, V.; Straka, M.; Ruzicka, K.; Shaw, J.M. Heat Capacities of Tetracene and Pentacene. J. Chem. Eng. Data 2008, 53, 2175–2181. [Google Scholar] [CrossRef]
- Torres, L.A.; Campos, M.; Martinez, M.; Rojas, A. The thermochemistry of coronene revisited. J. Chem. Thermodyn. 2009, 41, 957–965. [Google Scholar] [CrossRef]
- Rojas-Aguilar, A.; Martinez-Herrera, M. Enthalpies of combustion and formation of fullerenes by micro-combustion calorimetry in a Calvet calorimeter. Thermochim. Acta 2005, 437, 126–133. [Google Scholar] [CrossRef]
- Jin, Y.; Cheng, J.; Varma-Nair, M.; Liang, G.; Fu, Y.; Wunderlich, B.; Xiang, X.-D.; Mostovoy, R.; Zettl, A.K. Thermodynamic Characterization of C60 by Differential Scanning Calorimetry. J. Phys. Chem. 1992, 96, 5151–5156. [Google Scholar] [CrossRef]
- Korotkovskii, V.I.; Ryshkova, O.S.; Neruchev, Y.A.; Goncharov, A.L.; Postnikov, E.B. Isobaric heat capacity, isothermal compressibility and fluctuational properties of 1-bromoalkanes. Int. J. Thermophys. 2016, 37, 58–71. [Google Scholar] [CrossRef]
- Chorazewski, M.; Tkaczyk, M. Heat Capacity, Speed of Ultrasound, and Density for 1,5-Dibromopentane + Heptane within the Temperature Range from 293.15 K to 313.15 K. J. Chem. Eng. Data 2006, 51, 1825–1831. [Google Scholar] [CrossRef]
- Straka, M.; Ruzicka, K.; Fulem, M.; Cervinka, C. Heat capacity of selected chlorohydrocarbons. Fluid Phase Equil. 2012, 336, 128–136. [Google Scholar] [CrossRef]
- Melent’ev, V.V.; Postnikov, E.B.; Polishuk, I. Experimental Determination and Modeling Thermophysical Properties of 1-Chlorononane in a Wide Range of Conditions: Is It Possible To Predict a Contribution of Chlorine Atom? Ind. Eng. Chem. Res. 2018, 57, 5142–5150. [Google Scholar] [CrossRef]
- Bazyleva, A.B.; Blokhin, A.V.; Kabo, G.J.; Kabo, A.G.; Paulechka, Y.U. Thermodynamic properties of 1-bromoadamantane in the condensed state and molecular disorder in its crystals. J. Chem. Thermodyn. 2005, 37, 643–657. [Google Scholar] [CrossRef]
- Van der Linde, P.R.; van Miltenburg, J.C.; van den Berg, G.J.K.; Oonk, H.A.J. Low-Temperature Heat Capacities and Derived Thermodynamic Functions of 1,4-Dichlorobenzene, 1,4-Dibromobenzene, 1,3,5-Trichlorobenzene, and 1,3,5-Tribromobenzene. J. Chem. Eng. Data 2005, 50, 164–172. [Google Scholar] [CrossRef] [Green Version]
- Verevkin, S.P.; Schick, C. Vapour pressures and heat capacity measurements on the C7–C9 secondary aliphatic alcohols. J. Chem. Thermodyn. 2007, 39, 758–766. [Google Scholar] [CrossRef]
- Serra, P.B.P.; Ruzicka, K.; Fulem, M.; Vlk, O.; Krakovsky, I. Calorimetric and FTIR study of selected aliphatic heptanols. Fluid Phase Equil. 2016, 423, 43–54. [Google Scholar] [CrossRef]
- Serra, P.B.P.; Krakovsky, I.; Fulem, M.; Ruzicka, K. Calorimetric and FTIR study of selected aliphatic octanols. J. Therm. Anal. Calor. 2018, 134, 2157–2170. [Google Scholar] [CrossRef]
- Stejfa, V.; Fulem, M.; Ruzicka, K.; Matejka, P. Vapor pressures and thermophysical properties of selected hexenols and recommended vapor pressure for hexan-1-ol. Fluid Phase Equil. 2015, 402, 18–29. [Google Scholar] [CrossRef]
- Straka, M.; Ruzicka, K.; Fulem, M. Heat capacities of 2-propenol and selected cyclohexylalcohols. Thermochim. Acta 2014, 587, 67–71. [Google Scholar] [CrossRef]
- Charapennikau, M.B.; Blokhin, A.V.; Kabo, A.G.; Kabo, G.J. The heat capacities and parameters of solid phase transitions and fusion for 1- and 2-adamantanols. J. Chem. Thermodyn. 2003, 35, 145–157. [Google Scholar] [CrossRef]
- Svoboda, V.; Zabransky, M.; Barta, M. Molar heat capacities of 2-methoxyethanol, 2-ethoxyethanol, and 2-propoxyethanol in the temperature range from 298 K to 330 K. J. Chem. Thermodyn. 1991, 23, 711–712. [Google Scholar] [CrossRef]
- Atake, T.; Kawaji, H.; Tojo, T.; Kawasaki, K.; Ootsuka, Y.; Katou, M.; Koga, Y. Heat Capacities of Isomeric 2-Butoxyethanols from 13 to 300 K: Fusion and Glass Transition. Bull. Chem. Soc. Jpn. 2000, 73, 1987–1991. [Google Scholar] [CrossRef]
- Francesconi, R.; Bigi, A.; Rubini, K.; Comelli, F. Excess Enthalpies, Heat Capacities, Densities, Viscosities and Refractive Indices of Dimethyl Sulfoxide + Three Aryl Alcohols at 308.15 K and Atmospheric Pressure. J. Chem. Eng. Data 2005, 50, 1932–1937. [Google Scholar] [CrossRef]
- Ruzicka, K.; Fulem, M.; Serra, P.B.P.; Vlk, O.; Krakovsky, I. Heat capacities of selected cycloalcohols. Thermochim. Acta 2014, 596, 98–108. [Google Scholar] [CrossRef]
- Feng, J.; Shang, Y.; Zhang, Y. Research on synthesis and thermodynamic properties of 2-methoxycyclohexanol. J. Therm. Anal. Calorim. 2018, 131, 2197–2203. [Google Scholar] [CrossRef]
- Caceres-Alonso, M.; Costas, M.; Andreoli-Ball, L.; Patterson, D. Steric effects on the self-association of branched and cyclic alcohols in inert solvents. Apparent heat capacities of secondary and tertiary alcohols in hydrocarbons. Can. J. Chem. 1988, 66, 989–998. [Google Scholar] [CrossRef] [Green Version]
- Steja, V.; Bazyleva, A.; Fulem, M.; Rohlicek, J.; Skorepova, E.; Ruzicka, K.; Blokhin, A.V. Polymorphism and thermophysical properties of L- and DL-menthol. J. Chem. Thermodyn. 2019, 131, 524–543. [Google Scholar] [CrossRef]
- Steifa, V.; Dergal, F.; Mokbel, I.; Fulem, M.; Jose, J.; Ruzicka, K. Vapor pressures and thermophysical properties of selected monoterpenoids. Fluid Phase Equil. 2015, 406, 124–133. [Google Scholar] [CrossRef]
- Hu, J.; Tamura, K.; Murakami, S. Excess thermodynamic properties of binary mixtures of ethyl acetate with benzene, ethanol, and 2,2,2-trifluoroethan-1-ol at 298.15 K. Fluid Phase Equil. 1997, 134, 239–253. [Google Scholar] [CrossRef]
- Costa, J.C.S.; Lima, C.F.R.A.C.; Mendes, A.; Santos, L.M.N.B.F. Fluorination effect on the thermodynamic properties of long-chain hydrocarbons and alcohols. J. Chem. Thermodyn. 2016, 102, 378–385. [Google Scholar] [CrossRef]
- Goralski, P.; Tkaczik, M. Heat Capacities of Some Liquid α,ω-Alkanediols within the Temperature Range between (293.15 and 353.15) K. J. Chem. Eng. Data 2008, 53, 1932–1934. [Google Scholar] [CrossRef]
- Zemankova, K.; Troncoso, J.; Romani, L. Excess volumes and excess heat capacities for alkanediol + watersystems in the temperature interval (283.15–313.15) K. Fluid Phase Equil. 2013, 356, 1–10. [Google Scholar] [CrossRef]
- Pietrzak, A.; Ludzik, K. Excess volumes and excess heat capacities of {1,2-alkanediol + methanol} mixtures and ionic volumes in these systems. Fluid Phase Equil. 2015, 401, 56–63. [Google Scholar] [CrossRef]
- Zorebski, E.; Goralski, P. Molar heat capacities for (1-butanol + 1,4-butanediol, 2,3-butanediol, 1,2-butanediol, and 2-methyl-2,4-pentanediol) as function of temperature. J. Chem. Thermodyn. 2007, 39, 1601–1607. [Google Scholar] [CrossRef]
- Pietrzak, A.; Piekarski, H. Molar heat capacities for {isomer of butanediol + methanol} as function of mixture composition and temperature. J. Chem. Thermodyn. 2014, 79, 171–177. [Google Scholar] [CrossRef]
- Della Gatta, G.; Jozwiak, M.; Ferloni, P. Heat capacities near room temperature of ten solid alkane-α,ω-diols HO–(CH2)n–OH where n = 6 and 8 <= n <= 16. J. Chem. Thermodyn. 1999, 31, 537–546. [Google Scholar] [CrossRef]
- Schrödle, S.; Hefter, G.; Buchner, R. Effects of hydration on the thermodynamic properties of aqueous ethylene glycol ether solutions. J. Chem. Thermodyn. 2005, 37, 513–522. [Google Scholar] [CrossRef]
- Svärd, M.; Krishna, G.R.; Rasmuson, A.C. Synthesis, crystallisation and thermodynamics of two polymorphs of a new derivative of meglumine: 1-(2,2,3-trimethyl-1,3-oxazolidin-5-yl)-butane-1,2,3,4-tetrol. Cryst. Eng. Comm. 2018, 20, 88. [Google Scholar] [CrossRef]
- Svärd, M.; Hjorth, T.; Bohlin, M.; Rasmuson, A.C. Calorimetric Properties and Solubility in Five Pure Organic Solvents of N-Methyl-D-Glucamine (Meglumine). J. Chem. Eng. Data 2016, 61, 1199–1204. [Google Scholar] [CrossRef]
- Lian, Y.-N.; Chen, A.-T.; Suurkuusk, J.; Wadsö, I. Polyol – Water Interactions as Reflected by Aqueous Heat Capacity Values. Acta Chem. Scand. A 1982, 36, 735–739. [Google Scholar] [CrossRef]
- Wasiak, M.; Komudzinska, M.; Piekarski, H.; Tkaczyk, M. Heat capacity and phase behaviour of {pentaethylene glycolmonoheptyl ether + water} system. Two-point scaling approach. J. Mol. Liq. 2018, 266, 781–788. [Google Scholar] [CrossRef]
- Maria, T.M.R.; Eusebio, M.E.S. Molar Heat Capacity of 1,2-Cyclohexanediol Isomers From (173 to 428) K. J. Chem. Eng. Data 2008, 53, 1316–1320. [Google Scholar] [CrossRef] [Green Version]
- Wang, S.; Zhang, Y.; Zhang, J.; Wang, S.; Tan, Z.; Shi, Q. Heat capacities and thermodynamic functions of D-ribose and D-mannose. J. Therm. Anal. Calor. 2018, 133. [Google Scholar] [CrossRef]
- Yamamura, Y.; Iwagaki, S.; Hishida, M.; Nagatomo, S.; Fukada, K.; Saito, K. Heat capacity and standard thermodynamic functions of three ketohexoses in monosaccharides including rare sugars: D-fructose, D-psicose, and D-tagatose. J. Chem. Thermodyn. 2019, 131, 420–430. [Google Scholar] [CrossRef]
- Boerio-Goates, J. Heat-capacity measurements and thermodynamic functions of crystalline a-D-glucose at temperatures from 10 K to 340 K. J. Chem. Thermodyn. 1991, 23, 403–409. [Google Scholar] [CrossRef]
- Jia, R.; Sun, K.; Li, R.; Zhang, Y.; Wang, W.; Yin, H.; Fang, D.; Shi, Q.; Tan, Z. Heat capacities of some sugar alcohols as phase change materials for thermal energy storage applications. J. Chem. Thermodyn. 2017, 115, 233–248. [Google Scholar] [CrossRef]
- Hernandez-Segura, G.O.; Campos, M.; Costas, M.; Torres, L.A. Temperature dependence of the heat capacities in the solid state of 18 mono-, di-, and poly-saccharides. J. Chem. Thermodyn. 2009, 41, 17–20. [Google Scholar] [CrossRef]
- Magon, A.; Wurm, A.; Schick, C.; Pangloli, P.; Zivanovic, S.; Skotnicki, M.; Pyda, M. Reprint of “Heat capacity and transition behavior of sucrose by standard, fast scanning and temperature-modulated calorimetry. Thermochim. Acta 2015, 603, 149–161. [Google Scholar] [CrossRef]
- Kabo, G.J.; Paulechka, Y.U.; Voitkevich, O.V.; Blokhin, A.V.; Stepurko, E.N.; Kohut, S.V.; Voznyi, Y.V. Experimental and theoretical study of thermodynamic properties of levoglucosan. J. Chem. Thermodyn. 2015, 85, 101–110. [Google Scholar] [CrossRef]
- Diot, M.; de Braver, C.; Germain, P. Calorimetric Behaviour of Anhydrous β-Cyclodextrin at Very Low Temperature. J. Incl. Phenom. Mol. Recogn. Chem. 1998, 30, 143–150. [Google Scholar] [CrossRef]
- Bhatia, S.C.; Rani, R.; Bhatia, R. Densities, Speeds of Sound, and Refractive Indices of Binary Mixtures of Decan-1-ol with Anisole, o-Cresol, m-Cresol, and p-Cresol at T = (298.15, 303.15, and 308.15) K. J. Chem. Eng. Data 2011, 56, 1669–1674. [Google Scholar] [CrossRef]
- Wang, Y.; Wang, J.; Zhao, X.; Zhu, L.; Yang, L.; Sha, Z. Determination and thermodynamic modeling of solid–liquid phase equilibrium for the 2,4,6-trimethylphenol and 2,5-dimethylphenol binary system. J. Therm. Anal. Calorim. 2018, 132, 1923–1931. [Google Scholar] [CrossRef]
- Schaake, R.C.F.; van Miltenburg, J.C.; de Kruif, C.G. Thermodynamic properties of the normal alkanoic acids I I. Molar heat capacities of seven even-numbered normal alkanoic acids. J. Chem. Thermodvn. 1982, 14, 771–778. [Google Scholar] [CrossRef]
- Yu, H.-G.; Tan, Z.-C.; Liu, Y.; Lan, X.-Z.; Xu, F.; Huang, X.-M.; Sun, L.-X. Standard enthalpy of formation and heat capacities of 3,5-di-tert-butylsalicylic acid. Thermochim. Acta 2003, 404, 89–95. [Google Scholar] [CrossRef]
- Vecchio, S.; Brunetti, B. Vapor pressures, standard molar enthalpies, entropies Gibbs energies of sublimation and heat capacities of 2,5- and 3,5-dibromobenzoic acids. Fluid Phase Equil. 2013, 338, 148–154. [Google Scholar] [CrossRef]
- Camarillo, E.A.; Flores, H.; Santiago, O. Energy Content of Cinnamic Acid Derivatives Found in Coffee Bean by Combustion Calorimetry. J. Chem. Biol. Phy. Sci. Sec. C 2016, 6, 1223–1229. [Google Scholar]
- Garcia-Castro, M.A.; Amador, P.; Rojas, A.; Hernandez-Perez, J.M.; Solano-Altamirano, J.M.; Flores, H.; Salas-Lopez, K. Experimental and computational thermochemistry of 3- and 4-nitrophthalic acids. J. Chem. Thermodyn. 2018, 127, 117–125. [Google Scholar] [CrossRef]
- Bernardes, C.E.S.; Simoes, R.G.; Diogo, H.D.; Minas de Piedade, M.E. Thermochemistry of 2,2,5,7,8-pentamethylchroman-6-ol (PMC) and 6-hydroxy-2,5,7,8-tetramethylchroman-2-carboxylic acid (trolox). J. Chem. Thermodyn. 2014, 73, 140–147. [Google Scholar] [CrossRef]
- Kong, Y.-X.; Di, Y.-Y.; Yang, W.-W.; Gao, S.-L.; Tan, Z.-C. Low Temperature Heat Capacities and Standard Molar Enthalpy of Formation of 2-Pyrazinecarboxylic Acid (C5H4N2O2)(s). Acta Chim. Slov. 2010, 57, 370–375. [Google Scholar]
- Joseph, A.; Bernardes, C.E.S.; Minas da Piedade, M.E. Heat capacity and thermodynamics of solid and liquid pyridine-3-carboxylic acid (nicotinic acid) over the temperature range 296 K to 531 K. J. Chem. Thermodyn. 2012, 55, 23–28. [Google Scholar] [CrossRef]
- Knyazev, A.V.; Smirnova, N.N.; Shipilova, A.S.; Shushunov, A.N.; Gusarova, E.V.; Knyazeva, S.S. Thermodynamic properties and low-temperature X-ray diffraction of vitamin B3. Thermochim. Acta 2015, 604, 115–121. [Google Scholar] [CrossRef]
- Agafonova, L.E.; Varushchenko, R.M.; Druzhinina, A.I.; Polyakova, O.V.; Kolesov, Y.S. Heat Capacity, Saturation Vapor Pressure, and Thermodynamic Functions of Ethyl Esters of C3–C5 and C18 Carboxylic Acids. Russ. J. Phys. Chem. A 2011, 85, 1516–1527. [Google Scholar] [CrossRef]
- Noel, J.A.; White, M. A: Heat Capacities of Potential Organic Phase Change Materials. J. Chem. Thermodyn. 2019, 128, 127–133. [Google Scholar] [CrossRef]
- Bogatishcheva, N.S.; Faizullin, M.Z.; Nikitin, E.D. Heat capacities and thermal diffusivities of some n-alkanoic acid methyl esters. J. Chem. Thermodyn. 2019, 130, 33–37. [Google Scholar] [CrossRef]
- Dzida, M.; Jezak, S.; Sumara, J.; Zarska, M.; Goralski, P. High-Pressure Physicochemical Properties of Ethyl Caprylate and Ethyl Caprate. J. Chem. Eng. Data 2013, 58, 1955–1962. [Google Scholar] [CrossRef]
- Dzida, M.; Jezak, S.; Sumara, J.; Zarska, M.; Goralski, P. High pressure physicochemical properties of biodiesel components used for spray characteristics in diesel injection systems. Fuel 2013, 111, 165–171. [Google Scholar] [CrossRef]
- Kozyro, A.A.; Blokhin, A.V.; Kabo, G.J.; Paulechka, Y.U. Thermodynamic properties of some cyclohexyl esters in the condensed state. J. Chem. Thermodyn. 2001, 33, 305–331. [Google Scholar] [CrossRef]
- Liu, X.; Su, C.; Qi, X.; He, M. Isobaric heat capacities of ethyl heptanoate and ethyl cinnamate at pressures up to 16.3 Mpa. J. Chem. Thermodyn. 2016, 93, 70–74. [Google Scholar] [CrossRef]
- Kulagina, T.G.; Samosudova, Y.S.; Latyanina, I.A.; Sevast’anov, E.V.; Smirnova, N.N.; Smirnova, L.A.; Mochalova, A.E. The Thermodynamic Properties of 2-Ethylhexyl Acrylate over the Temperature Range from T → 0 to 350 K. Russ. J. Phys. Chem. A 2012, 86, 747–751. [Google Scholar]
- Blokhin, A.V.; Paulechka, Y.U.; Kabo, G.J.; Kozyro, A.A. Thermodynamic properties of methyl esters of benzoic and toluic acids in the condensed state. J. Chem. Thermodyn. 2002, 34, 29–55. [Google Scholar] [CrossRef]
- Ledo, J.M.; Flores, H.; Hernandez-Perez, J.M.; Ramos, F.; Camarillo, E.A.; Solano-Altamirano, J.M. Gas-phase enthalpies of formation of ethyl hydroxybenzoates: An experimental and theoretical approach. J. Chem. Thermodyn. 2018, 116, 176–184. [Google Scholar] [CrossRef]
- Navarro, A.M.; Garcia, B.; Hoyuelos, F.J.; Penacoba, I.A.; Ibeas, S.; Leal, J.M. Heat Capacity Behavior and Structure of Alkan-1-ol/Alkylbenzoate Binary Solvents. J. Phys. Chem. B 2012, 116, 9768–9775. [Google Scholar] [CrossRef]
- Inaba, A.; Suzuki, H.; Massalska-Arodz, M.; Rozwadowski, T. Polymorphism and thermodynamic functions of liquid crystalline material 4-cyano-3-fluorophenyl 4-butylbenzoate. J. Chem. Thermodyn. 2012, 54, 204–210. [Google Scholar] [CrossRef]
- Ledo, J.M.; Flores, H.; Solano-Altamirano, J.M.; Ramos, F.; Hernandez-Perez, J.M.; Camarillo, E.A.; Rabell, B.; Amador, M.P. Experimental and theoretical study of methyl n-hydroxybenzoates. J. Chem. Thermodyn. 2018, 124, 1–9. [Google Scholar] [CrossRef]
- Lugo, L.; Segovia, J.J.; Carmen Martin, M.; Fernandez, J.; Villamanan, M.A. An experimental setup for isobaric heat capacities for viscous fluids at high pressure: Squalane, bis(2-ethylhexyl) sebacate and bis(2-ethylhexyl) phthalate. J. Chem. Thermodyn. 2012, 49, 75–80. [Google Scholar] [CrossRef]
- Pokomy, V.; Steifa, V.; Fulem, M.; Cervinka, C.; Ruzicka, K. Vapor Pressures and Thermophysical Properties of Dimethyl Carbonate, Diethyl Carbonate, and Dipropyl Carbonate. J. Chem. Eng. Data 2017, 62, 3206–3215. [Google Scholar] [CrossRef]
- Verevkin, S.P.; Emel’yanenko, V.N.; Toktonov, A.V.; Chernyak, Y.; Schäffner, B.; Börner, A. Cyclic alkylene carbonates. Experiment and first principle calculations for prediction of thermochemical properties. J. Chem. Thermodyn. 2008, 40, 1428–1432. [Google Scholar] [CrossRef]
- Mansson, M. Enthalpies of combustion and formation of ethyl propionate and diethyl carbonate. J. Chem. Thermodyn. 1972, 4, 865–871. [Google Scholar] [CrossRef]
- Shen, C.; Li, W.; Zhou, C. Investigation on molar heat capacity, standard molar enthalpy of combustion for guaiacol and acetyl guaiacol ester. Chin. J. Chem. Eng. 2016, 24, 1772–1778. [Google Scholar] [CrossRef]
- Knyazev, A.V.; Emel’yanenko, V.N.; Smirnova, N.N.; Stepanova, O.V.; Shipilova, A.S.; Markin, A.V.; Samosudova, Y.S.; Gusarova, E.V.; Knyazeva, S.S.; Verevkin, S.P. Thermodynamic properties of methylprednisolone aceponate. J. Chem. Thermodyn. 2016, 103, 244–248. [Google Scholar] [CrossRef]
- Comelli, F.; Francesconi, R.; Bigi, A.; Rubini, K. Excess Molar Enthalpies, Molar Heat Capacities, Densities, Viscosities, and Refractive Indices of Dimethyl Sulfoxide + Esters of Carbonic Acid at 308.15 K and Atmospheric Pressure. J. Chem. Eng. Data 2006, 51, 665–670. [Google Scholar] [CrossRef]
- Lv, X.-C.; Tan, Z.-C.; Shi, Q.; Zhang, H.-T.; Sun, L.-X.; Zhang, T. Molar Heat Capacity and Thermodynamic Properties of 4-Methyl-4-cyclohexene-1,2-dicarboxylic Anhydride [C9H10O3]. J. Chem. Eng. Data 2005, 50, 932–935. [Google Scholar] [CrossRef]
- Lv, X.-C.; Tan, Z.-C.; Di, Y.-Y.; Shi, Q.; Sun, L.-X.; Zhang, T. Molar heat capacity and thermodynamic properties of 1-cyclohexene-1,2-dicarboxylic anhydride [C8H8O3]. J. Chem. Thermodyn. 2004, 36, 787–792. [Google Scholar] [CrossRef]
- Garcia-Castro, M.A.; Amador, P.; Hernandez-Perez, J.M.; Medina-Favela, A.E.; Flores, H. Experimental and Computational Thermochemistry of 3- and 4-Nitrophthalic Anhydride. J. Phys. Chem. A 2014, 118, 3820–3826. [Google Scholar] [CrossRef]
- Fuchs, R. Heat capacities of liquid ketones and aldehydes at 298 K. Can. J. Chem. 1980, 58, 2305–2306. [Google Scholar] [CrossRef] [Green Version]
- Temprado, M.; Roux, M.V.; Chickos, J.S. Some Thermophysical Properties of Several Solid Aldehdes. J. Therm. Anal. Calorim. 2008, 94, 257–262. [Google Scholar] [CrossRef]
- Sharma, V.K.; Malik, S.; Solanki, S. Thermodynamic Studies of Molecular Interactions in Mixtures Containing Tetrahydropyran, 1,4-Dioxane, and Cyclic Ketones. J. Chem. Eng. Data 2017, 62, 623–632. [Google Scholar] [CrossRef]
- Wang, S.-X.; Tan, Z.-C.; Shi, Q.; Di, Y.-Y.; Zhang, H.-T.; Xu, F.; Sun, L.-X.; Zhang, T. Calorimetric study and thermal analysis of crystalline 2,4-dinitrobenzaldehyde (C7H4N2O5). J. Chem. Thermodyn. 2005, 37, 349–355. [Google Scholar] [CrossRef]
- Nagumo, T.; Matsuo, T.; Suga, H. Thermodynamic Study on Camphor Crystals. Thermochim. Acta 1989, 139, 121–132. [Google Scholar] [CrossRef]
- Stejfa, V.; Fulem, M.; Ruzicka, K.; Cervinka, C. Thermodynamic study of selected monoterpenes II. J. Chem. Thermodyn. 2014, 79, 272–279. [Google Scholar] [CrossRef]
- Stejfa, V.; Fulem, M.; Ruzicka, K.; Cervinka, C. Thermodynamic study of selected monoterpenes III. J. Chem. Thermodyn. 2014, 79, 280–289. [Google Scholar] [CrossRef]
- De Kruif, C.G.; van Miltenburg, J.C.; Blok, J.G. Molar heat capacities and vapour pressures of solid and liquid benzophenone. J. Chem. Thermodyn. 1983, 15, 129–136. [Google Scholar] [CrossRef]
- Rojas-Aguilar, A.; Flores-Lara, H.; Martinez-Herrera, M.; Ginez-Carbajal, F. Thermochemistry of benzoquinones. J. Chem. Thermodyn. 2004, 36, 453–463. [Google Scholar] [CrossRef]
- Sanchez-Bulas, T.; Cruz-Vasquez, O.; Hernandez-Obregon, J.; Rojas, A. Enthalpies of fusion, vaporisation and sublimation of crown ethers determined by thermogravimetry and differential scanning calorimetry. Thermochim. Acta 2017, 650, 123–133. [Google Scholar] [CrossRef]
- Bykova, T.A.; Lebedev, B.V. Thermodynamic Properties of Dibenzo-24-crown-8 in the Range from T -> 0 to 500 K. Russ. J. Gen. Chem. 2004, 74, 250–255. [Google Scholar] [CrossRef]
- Rodriguez, S.; Lafuente, C.; Artigas, H.; Royo, F.M.; Urieta, J.S. Densities, speeds of sound, and isentropic compressibilities of a cyclic ether with chlorocyclohexane, or bromocyclohexane at the temperatures 298.15K and 313.15K. J. Chem. Thermodyn. 1999, 31, 139–149. [Google Scholar] [CrossRef]
- Druzhinina, A.I.; Pimenova, S.M.; Lukyanova, V.A. Low temperature heat capacity and thermodynamic parameters of phase transitions of 4-nitro-4’-tert-butyl-diphenyl oxide. J. Chem. Thermodyn. 2017, 105, 312–316. [Google Scholar] [CrossRef]
- Druzhinina, A.I.; Pimenova, S.M.; Tarazanov, S.V.; Nesterova, T.N.; Varushchenko, R.M. Thermodynamic properties of 4-tert-butyl-diphenyl oxide. J. Chem. Thermodyn. 2015, 87, 69–77. [Google Scholar] [CrossRef]
- Goralski, P.; Wasiak, M.; Bald, A. Heat Capacities, Speeds of Sound, and Isothermal Compressibilities of Some n-Amines and Tri-n-amines at 298.15 K. J. Chem. Eng. Data 2002, 47, 83–86. [Google Scholar] [CrossRef]
- Verevkin, S.P. Thermochemistry of amines: Strain in six-membered rings from experimental standard molar enthalpies of formation of morpholines and piperazines. J. Chem. Thermodyn. 1998, 30, 1069–1079. [Google Scholar] [CrossRef]
- Verevkin, S.P. Thermochemistry of Amines: Experimental Standard Molar Enthalpies of Formation of N-Alkylated Piperidines. Struct. Chem. 1998, 9, 113–119. [Google Scholar] [CrossRef]
- Sun, Q.; Zhang, Y.; Xu, K.; Ren, Z.; Song, J.; Zhao, F. Studies on Thermodynamic Properties of FOX-7 and Its Five Closed-Loop Derivatives. J. Chem. Eng. Data 2015, 60, 2057–2061. [Google Scholar] [CrossRef]
- Verevkin, S.P. Relationships among strain energies of monoand poly-cyclic cyclohexanoid molecules and strain of their component rings. J. Chem. Thermodyn. 2002, 34, 263–275. [Google Scholar] [CrossRef]
- Costa, J.C.S.; Santos, L.M.N.B.F. Hole Transport Materials Based Thin Films: Topographic Structures and Phase Transition Thermodynamics of Triphenylamine Derivatives. J. Phys. Chem. C 2013, 117, 10919–10928. [Google Scholar] [CrossRef]
- Domanska, U.; Marciniak, M. Experimental solid–liquid equilibria for systems containing alkan-1-ol + 1,3-diaminopropane Heat capacities of alkan-1-ols and amines—Thermodynamic functions of dissociation and enthalpies of melting of the congruently melting compounds for the systems (alkan-1-ol + amine). Fluid Phase Equil. 2005, 235, 30–41. [Google Scholar] [CrossRef]
- Verevkin, S.P.; Morgenthaler, J.; Rüchardt, C. Thermochemistry of imines: Experimental standard molar enthalpies of formation. J. Chem. Thermodyn. 1997, 29, 1175–1183. [Google Scholar] [CrossRef]
- Shi, Q.; Tan, Z.-C.; Tong, B.; Di, Y.-Y.; Zhang, Z.-H.; Zeng, J.-L.; Sun, L.-X.; Li, Y.-S. Low-temperature heat capacity and standard molar enthalpy of formation of crystalline 2-pyridinealdoxime (C6H6N2O). J. Chem. Thermodyn. 2007, 39, 817–821. [Google Scholar] [CrossRef]
- Li, H.-Y.; Yan, B.; Guan, Y.-L.; Ma, H.-X.; Song, J.-R.; Zhao, F.-Q. Thermodynamic properties of 4-amino-3-furazanecarboxamidoxime. J. Chem. Thermodyn. 2015, 90, 87–91. [Google Scholar] [CrossRef]
- Straka, M.; Ruzicka, K.; Ruzicka, V. Heat Capacities of Chloroanilines and Chloronitrobenzenes. J. Chem. Eng. Data 2007, 52, 1375–1380. [Google Scholar] [CrossRef]
- Tian, Q.-F.; Tan, Z.-C.; Shi, Q.; Xu, F.; Sun, L.-X.; Zhang, T. Heat capacity and thermodynamic properties of N-(2-cyanoethyl)aniline (C9H10N2). Thermochim. Acta 2005, 430, 53–58. [Google Scholar] [CrossRef]
- Emel’yanenko, V.N.; Zaitseva, K.V.; Nagrimanov, R.N.; Solomonov, B.N.; Verevkin, S.P. Benchmark Thermodynamic Properties of Methyl- and Methoxy-Benzamides: Comprehensive Experimental and Theoretical Study. J. Phys. Chem. A 2016, 120, 8419–8429. [Google Scholar] [CrossRef] [PubMed]
- Sun, X.-H.; Liu, Y.-F.; Tan, Z.-C.; Ji, P.-J.; Wang, M.-H. Heat Capacity and Thermodynamic Properties of Crystalline 2-Chloro-N,N-dimethylnicotinamide. Chin. J. Chem. 2005, 23, 1490–1494. [Google Scholar] [CrossRef] [Green Version]
- Abate, L.; Badea, E.; Blanco, I.; D’Angelo, D.; Della Gatta, G. Heat capacities of a series of terminal linear alkyldiamides determined by DSC. J. Therm. Anal. Calorim. 2007, 90, 575–580. [Google Scholar] [CrossRef]
- Di, Y.-Y.; Tan, Z.-C.; Wu, X.-M.; Meng, S.-H.; Qu, S.-S. Heat capacity and thermochemical study of trifluoroacetamide (C2H2F3NO). Thermochim. Acta 2000, 356, 143–151. [Google Scholar] [CrossRef]
- Salas-Lopez, K.; Amador, P.; Rojas, A.; Melendez, F.J.; Flores, H. Experimental and Theoretical Thermochemistry of the Isomers 3- and 4-Nitrophthalimide. J. Phys. Chem. A 2017, 121, 5509–5519. [Google Scholar] [CrossRef]
- Notario, R.; Roux, M.V.; Ros, F.; Emel’yanenko, V.N.; Zaitsau, D.H.; Verevkin, S.P. Thermochemistry of 1,3-diethylbarbituric and 1,3-diethyl-2-thiobarbituric acids: Experimental and computational study. J. Chem. Thermodyn. 2014, 77, 151–158. [Google Scholar] [CrossRef] [Green Version]
- Roux, M.V.; Notario, R. Experimental and Computational Thermochemical Study of 2-Thiobarbituric Acid: Structure−Energy Relationship. J. Phys. Chem. A 2012, 116, 4639–4645. [Google Scholar] [CrossRef] [PubMed]
- Roux, M.V.; Notario, R.; Segura, M.; Chickos, J.S. Thermophysical Study of 2-Thiobarbituric Acids by Differential Scanning Calorimetry. J. Chem. Eng. Data 2012, 57, 249–255. [Google Scholar] [CrossRef]
- Ribeiro da Silva, M.M.C.; Ribeiro da Silva, M.A.V.; Freitas, V.L.S.; Roux, M.V.; Jimenez, P.; Temprado, M.; Davalos, J.Z.; Cabildo, P.; Claramunt, R.M.; Elguero, J. Structural studies of cyclic ureas: 3. Enthalpy of formation of barbital. J. Chem. Thermodyn. 2009, 41, 1400–1407. [Google Scholar] [CrossRef] [Green Version]
- Kabo, G.J.; Kozyro, A.A.; Diky, V.V.; Simirsky, V.V. Additivity of Thermodynamic Properties of Organic Compounds in Crystalline State. 2. Heat Capacities and Enthalpies of Phase Transition of Alkyl Derivatives of Urea in Crystalline State. J. Chem. Eng. Data 1996, 40, 371–393. [Google Scholar] [CrossRef]
- Ribeiro da Silva, M.M.C.; Ribeiro da Silva, M.A.V.; Freitas, V.L.S.; Roux, M.V.; Jimenez, P.; Davalos, J.Z.; Cabildo, P.; Claramunt, R.M.; Pinilla, E.; Torres, M.R.; et al. Energetic studies of urea derivatives: Standard molar enthalpy of formation of 3,4,4’-trichlorocarbanilide. J. Chem. Thermodyn. 2010, 42, 536–544. [Google Scholar] [CrossRef]
- Kong, L.-G.; Tan, Z.-C.; Mei, J.-T.; Sun, L.-X.; Bao, X.-H. Thermodynamic studies of monuron. Thermochim. Acta 2004, 414, 131–135. [Google Scholar] [CrossRef] [Green Version]
- Yu, P.; Tan, Z.C.; Meng, S.H.; Lu, S.W.; Lan, X.Z.; Sun, L.X.; Xu, F.; Zhang, T.; Hu, S.X. Low-temperature heat capacities and thermodynamic properties of crystalline isoproturon. J. Therm. Anal. Calorim. 2003, 74, 867–874. [Google Scholar] [CrossRef]
- Svärd, M.; Valavi, M.; Khamar, D.; Kuhs, M.; Rasmuson, A.C. Thermodynamic Stability Analysis of Tolbutamide Polymorphs and Solubility in Organic Solvents. J. Pharm. Sci. 2016, 105, 1901–1906. [Google Scholar] [CrossRef] [Green Version]
- Ramos, F.; Ledo, J.M.; Flores, H.; Camarillo, E.A.; Carvente, J.; Amador, M.P. Evaluation of sublimation enthalpy by thermogravimetry: Analysis of the diffusion effects in the case of methyl and phenyl substituted hydantoins. Thermochim. Acta 2017, 655, 181–193. [Google Scholar] [CrossRef]
- Ledo, J.M.; Camarillo, E.A.; Flores, H.; Ramos, F.; Rojas, A. Energies of combustion and enthalpies of formation of 5-methyl-5- phenylhydantoin and 5,5-diphenylhydantoin. J. Therm. Anal. Calorim. 2016, 123, 2391–2396. [Google Scholar] [CrossRef]
- Zeng, J.-L.; Yu, S.-B.; Tomg, B.; Sun, L.-X.; Tan, Z.-C.; Cao, Z.; Yang, D.-W.; Zhang, J.-N. Heat capacities and thermodynamic properties of (S)-tert-butyl 1-phenylethylcarbamate. J. Therm. Anal. Calorim. 2011, 103, 1087–1093. [Google Scholar] [CrossRef]
- Temprado, M.; Roux, M.V.; Parameswar, A.R.; Demchenko, A.V.; Chickos, J.S.; Liebman, J.F. Thermophysical properties in medium temperature range of several thio and dithiocarbamates. J. Therm. Anal. Calorim. 2008, 91, 471–475. [Google Scholar] [CrossRef]
- Smirnova, N.N.; Kandeev, K.V.; Bykova, T.A.; Kulagina, T.G. Thermodynamics of 1,4-diisocyanatobutane in the range from T ->(0 to 360) K at standard pressure. J. Chem. Thermodyn. 2006, 38, 376–382. [Google Scholar] [CrossRef]
- Good, W.D. Enthalpies of Combustion of 18 Organic Sulfur Compounds Related to Petroleum. J. Chem. Eng. Data 1972, 17, 158–162. [Google Scholar] [CrossRef]
- Roux, M.V.; Davalos, J.Z.; Jimenez, P.; Flores, H.; Saiz, J.-L.; Abboud, J.-L.M. Structural effects on the thermochemical properties of sulfur compounds: I. Enthalpy of combustion, vapour pressures, enthalpy of sublimation, and standard molar enthalpy of formation in the gaseous phase of 1,3-dithiane. J. Chem. Thermodyn. 1999, 31, 635–646. [Google Scholar] [CrossRef]
- Van Miltenburg, J.C.; van Ekeren, P.J. Thermodynamic properties of 1,3,5-trithiane derived from solid phase heat capacity measurements by adiabatic calorimetry and DSC measurements in the melting range. Thermochim. Acta 2002, 385, 11–17. [Google Scholar] [CrossRef] [Green Version]
- Ramos, F.; Flores, H.; Hernandez-Perez, J.M.; Sandoval-Lira, J.; Camarillo, E.A. The Intramolecular Hydrogen Bond N−H···S in 2,2′-Diaminodiphenyl Disulfide: Experimental and Computational Thermochemistry. J. Phys. Chem. A 2018, 122, 239–248. [Google Scholar] [CrossRef]
- Wang, S.-X.; Tan, Z.-C.; Li, Y.-S.; Li, Y.; Shi, Q.; Tong, B. Heat capacity and thermodynamic properties of benzyl disulfide (C14H14S2). Thermochim. Acta 2007, 463, 21–25. [Google Scholar] [CrossRef]
- Flores, H.; Camarillo, E.A.; Amador, P. Enthalpies of combustion and formation of benzenesulfonamide and some of its derivatives. J. Chem. Thermodyn. 2012, 47, 408–411. [Google Scholar] [CrossRef]
- Camarillo, E.A.; Flores, H. Determination of the energies of combustion and enthalpies of formation of nitrobenzenesulfonamides by rotating-bomb combustion calorimetry. J. Chem. Thermodyn. 2010, 42, 425–428. [Google Scholar] [CrossRef]
- Perlovich, G.L.; Volkova, T.V. Sublimation thermodynamics aspects of adamantane and memantine derivatives of sulfonamide molecular crystals. Phys. Chem. Chem. Phys. 2018, 20, 19784–19791. [Google Scholar] [CrossRef] [PubMed]
- Meng, Q.-F.; Zhang, J.-N.; Tan, Z.-C.; Dong, Y.-P.; Li, W.; Shi, Q. Heat Capacities and Thermodynamic Properties of (3,4-Dimethoxyphenyl) Acetonitrile (C10H11NO2). J. Chem. Eng. Data 2009, 54, 232–235. [Google Scholar] [CrossRef]
- Zherikova, K.V.; Verevkin, S.P. Ferrocene: Temperature adjustments of sublimation and vaporization enthalpies. Fluid Phase Equil. 2018, 472, 196–203. [Google Scholar] [CrossRef]
- Sorai, M.; Kaneko, Y.; Hashiguchi, T. Heat capacity of paramagnetic nickelocene: Comparison with diamagnetic ferrocene. J. Phys. Chem. Solids 2014, 75, 656–661. [Google Scholar] [CrossRef]
- Krol, O.V.; Druzhinina, A.I.; Varushchenko, R.M.; Dorofeeva, O.V.; Reshetova, M.D.; Borisova, N.E. The heat capacities and thermodynamic functions of some derivatives of ferrocene. J. Chem. Thermodyn. 2008, 40, 549–557. [Google Scholar] [CrossRef]
- Domracheva, I.G.; Karyakin, N.V.; Sheiman, M.S.; Kamelova, G.V.; Larina, V.N.; Suvorova, O.N.; Domrachev, G.A. Thermodynamics and molecular dynamics of some ferrocene derivatives. Russ. Chem. Bull. 1999, 48, 1647–1655. [Google Scholar] [CrossRef]
- Lebedev, B.; Smirnova, N.N.; Novosyolova, N.; Makovetskii, K.; Ostrovskaya, I. Calorimetric study of 5-trimethylsilyl-2-norbornene, of its polymerization process and of poly(5-trimethylsilyl-2-norbornene) from 5 to 600 K at standard pressure. Macromol. Chem. Phys. 1994, 195, 1807–1822. [Google Scholar] [CrossRef]
- Palczewska-Tulinska, M.; Oracz, P. Selected Physicochemical Properties of Hexamethylcyclotrisiloxane, Octamethylcyclotetrasiloxane, and Decamethylcyclopentasiloxane. J. Chem. Eng. Data 2005, 50, 1711–1719. [Google Scholar] [CrossRef]
- Bykova, T.A.; Lebedev, B.V. Thermodynamic Properties of Tetraphenyl-tetrahydroxycyclotetrasiloxane, Octaphenyltetrahydroxytricyclooctasiloxane, Octaphenyl-pentacyclosilsesquioxane, and Polyphenylsilsesquioxane in the Range 0–300 K. Russ. J. Gen. Chem. 2003, 73, 1077–1085. [Google Scholar] [CrossRef]
- Smirnova, N.N.; Tsvetkova, L.Y.; Lebedev, B.; Zavin, B.G.; Kotov, V.M. Thermodynamics of polymethylhydrosiloxane based on 1,3,5,7-tetramethyl-1,3,5,7-tetrahydrocyclotetrasiloxane. J. Therm. Anal. Calorim. 2007, 89, 217–222. [Google Scholar] [CrossRef]
- Abbas, R.; Schedemann, A.; Ihmels, C.; Enders, S.; Gmehling, J. Measurement of Thermophysical Pure Component Properties for a Few Siloxanes Used as Working Fluids for Organic Rankine Cycles. Ind. Eng. Chem. Res. 2011, 50, 9748–9757. [Google Scholar] [CrossRef]
- Emel’yanenko, V.N.; Zaitsau, D.H.; Shoifet, E.; Meurer, F.; Verevkin, S.P.; Schick, C.; Held, C. Benchmark Thermochemistry for Biologically Relevant Adenine and Cytosine. A Combined Experimental and Theoretical Study. J. Phys. Chem. A 2015, 119, 9680–9691. [Google Scholar] [CrossRef] [PubMed]
- Boerio-Goates, J.; Francis, M.R.; Goldberg, R.N.; Ribeiro da Silva, M.A.V.; Ribeiro da Silva, M.D.M.C.; Tewari, Y.B. Thermochemistry of adenosine. J. Chem. Thermodyn. 2001, 33, 929–994. [Google Scholar] [CrossRef]
- Boerio-Goates, J.; Hopkins, S.D.; Monteiro, R.A.R.; Ribeiro da Silva, M.D.M.C.; Ribeiro da Silva, M.A.V.; Goldberg, R.N. Thermochemistry of inosine. J. Chem. Thermodyn. 2005, 37, 1239–1249. [Google Scholar] [CrossRef]
- Lukyanova, V.A.; Druzhinina, A.I.; Pimenova, S.M.; Ioutsi, V.A.; Buyanovskaya, A.G.; Takazova, R.U.; Sagadeev, E.V.; Gimadeev, A.A. Thermodynamic properties of L-threonine. J. Chem. Thermodyn. 2018, 116, 248–252. [Google Scholar] [CrossRef]
- Di, Y.-Y.; Yang, W.-W.; Kong, Y.-X.; Shi, Q.; Tan, Z.-C. Low-Temperature Heat Capacities and Standard Molar Enthalpy of Formation of L-3-(3,4-Dihydroxyphenyl) Alanine (C9H11NO4). J. Chem. Eng. Data 2008, 53, 900–904. [Google Scholar] [CrossRef]
- Lukyanova, V.A.; Druzhinina, A.I.; Pimenova, S.M.; Ioutsi, V.A.; Buyanovskaya, A.G.; Takazova, R.U.; Sagadeyev, E.V.; Gimadeev, A.A. Thermodynamic properties of L-tryptophan. J. Chem. Thermodyn. 2017, 105, 44–49. [Google Scholar] [CrossRef]
- Knyazev, A.V.; Emel’yanenko, V.N.; Shipilova, A.S.; Zaitsau, D.H.; Smirnova, N.N.; Knyazeva, S.S.; Gulenova, M.V. Thermodynamic investigation of L-carnitine. J. Chem. Thermodyn. 2019, 131, 495–502. [Google Scholar] [CrossRef]
- Markin, A.V.; Markhasin, E.; Sologubov, S.S.; Smirnova, N.N.; Griffin, R.G. Standard Thermodynamic Functions of Tripeptides N-Formyl-L-methionyl-L-leucyl-L-phenylalaninol and N-Formyl-L-methionyl-L-leucyl-L-phenylalanine Methyl Ester. J. Chem. Eng. Data 2014, 59, 1240–1246. [Google Scholar] [CrossRef]
- Brunetti, B.; Lapi, A.; Ciprioti, S.V. Thermodynamic study on six tricyclic nitrogen heterocycliccompounds by thermal analysis and effusion techniques. Thermochim. Acta 2016, 636, 71–84. [Google Scholar] [CrossRef]
- Bonicelli, M.G.; Catalani, A.; Mariano, G.; Vecchio, S. Heat capacities and molar enthalpies and entropies of fusion for anhydrous 1,10-phenanthroline and 2,9-dimethyl-1,10-phenanthroline. Thermochim. Acta 2007, 466, 69–71. [Google Scholar] [CrossRef]
- Chirico, R.D.; Kazakov, A.F.; Steele, W.V. Thermodynamic properties of three-ring aza-aromatics. 2. Experimental results for 1,10-phenanthroline, phenanthridine, and 7,8-benzoquinoline, and mutual validation of experiments and computational methods. J. Chem. Thermodyn. 2010, 42, 581–590. [Google Scholar] [CrossRef]
- Chirico, W.V. Thermodynamic Properties of 2-Methylquinoline and 8-Methylquinoline. J. Chem. Eng. Data 2005, 50, 697–708. [Google Scholar] [CrossRef]
- Camarillo, E.A.; Mentado, J.; Flores, H.; Hernandez-Perez, J.M. Standard enthalpies of formation of 2-aminobenzothiazoles in the crystalline phase by rotating-bomb combustion calorimetry. J. Chem. Thermodyn. 2014, 73, 269–273. [Google Scholar] [CrossRef]
- Calvin, J.J.; Rosen, P.F.; Smith, S.J.; Woodfield, B.F. Heat capacities and thermodynamic functions of the ZIF organic linkers imidazole, 2-methylimidazole, and 2-ethylimidazole. J. Chem. Thermodyn. 2018, in press. [Google Scholar] [CrossRef]
- Mo, O.; Yanez, M.; Roux, M.V.; Jimenez, P.; Davalos, J.Z.; Ribeiro da Silva, M.A.V.; Ribeiro da Silva, M.M.C.; Matos, M.A.R.; Amaral, L.M.P.F.; Sanchez-Migallon, A.; et al. Enthalpies of Formation of N-Substituted Pyrazoles and Imidazoles. J. Phys. Chem. A 1999, 103, 9336–9344. [Google Scholar] [CrossRef]
- Perdomo, G.; Flores, H.; Ramos, F.; Notario, R.; Freitas, V.L.S.; Ribeiro da Silva, M.D.M.C.; Camarillo, E.A.; Davalos, J.Z. Thermochemistry of R-SH group in gaseous phase: Experimental and theoretical studies of three sulfur imidazole derivatives. J. Chem. Thermodyn. 2018, 122, 65–72. [Google Scholar] [CrossRef]
- Ramos, F.; Flores, H.; Rojas, A.; Hernandez-Perez, J.M.; Camarillo, E.A.; Amador, M.P. Experimental and computational thermochemical study of benzofuran, benzothiophen and indole derivatives. J. Chem. Thermodyn. 2016, 97, 297–306. [Google Scholar] [CrossRef]
- Mentado, J.; Flores, H.; Amador, P. Combustion energies and formation enthalpies of 2-SH-benzazoles. J. Chem. Thermodyn. 2008, 40, 1106–1109. [Google Scholar] [CrossRef]
- Flores, H.; Ledo, J.M.; Hernandez-Perez, J.M.; Camarillo, E.A.; Sandoval-Lira, J.; Amador, M.P. Thermochemical and theoretical study of 2-oxazolidinone and 3-acetyl-2-oxazolidinone. J. Chem. Thermodyn. 2016, 102, 386–391. [Google Scholar] [CrossRef]
- McCullough, J.P.; Sunner, S.; Finke, H.L.; Hubbard, W.N.; Gross, M.E.; Pennington, R.E.; Messerly, J.F.; Good, W.D.; Waddington, G. The Chemical Thermodynamic Properties of 3-Methylthiophene from 0 to 1O0O-K. J. Am. Chem. Soc. 1953, 75, 5075–5081. [Google Scholar] [CrossRef]
- Roux, M.V.; Temprado, M.; Jimenez, P.; Foces-Foces, C.; Notario, R.; Verevkin, S.P.; Liebman, J.F. Thermochemistry of 2,5-Thiophenedicarboxylic Acid. J. Phys. Chem. A 2006, 110, 12477–12483. [Google Scholar] [CrossRef]
- Temprado, M.; Roux, M.V.; Jimenez, P.; Davalos, J.Z.; Notario, R. Experimental and Computational Thermochemistry of 2- and 3-Thiophenecarboxylic Acids. J. Phys. Chem. A 2002, 106, 11173–11180. [Google Scholar] [CrossRef]
- Temprado, M.; Roux, M.V.; Jimenez, P.; Foces-Foces, C.; Notario, R. Thermochemistry of 2- and 3-Thiopheneacetic Acids: Calorimetric and Computational Study. J. Phys. Chem. A 2008, 112, 10378–10385. [Google Scholar] [CrossRef] [PubMed]
- Paus, R.; Hart, E.; Ji, Y.; Sadowski, G. Solubility and Caloric Properties of Cinnarizine. J. Chem. Eng. Data 2015, 60, 2256–2261. [Google Scholar] [CrossRef]
- Gudino, R.; Torres, L.A.; Campos, M.; Santillan, R.L.; Farfan, N. The standard molar enthalpies of combustion and sublimation of benzothiazino!benzothiazine and benzoxazino!benzoxazine. J. Chem. Thermodyn. 1997, 29, 565–574. [Google Scholar] [CrossRef]
- Verevkin, S.P.; Zaitsau, D.H.; Blokhin, A.V.; Bazyleva, A.B.; Emel’yanenko, G.J. Thermodynamics of Ionic Liquids Precursors: 1-Methylimidazole. J. Phys. Chem. B 2011, 115, 4404–4411. [Google Scholar] [CrossRef] [PubMed]
- Wang, M.-H.; Tan, Z.-C.; Sun, X.-H.; Zhang, H.-T.; Liu, B.-P.; Sun, L.-X.; Zhang, T. Determination of Heat Capacities and Thermodynamic Properties of 2-(Chloromethylthio)benzothiazole by an Adiabatic Calorimeter. J. Chem. Eng. Data 2005, 50, 270–273. [Google Scholar] [CrossRef] [Green Version]
- Shi, Q.; Tan, Z.-C.; Di, Y.-Y.; Lv, X.-C.; Tong, B.; Zhang, Z.-H.; Sun, L.-X.; Zhang, T. Heat capacity and standard molar enthalpy of formation of crystalline 2,6-dicarboxypyridine (C7H5NO4). J. Chem. Thermodyn. 2006, 38, 1701–1705. [Google Scholar] [CrossRef]
- Shi, Q.; Tan, Z.-C.; Di, Y.-Y.; Tong, B.; Wang, S.-X.; Li, Y.-S. Thermodynamic studies of crystalline 2-amino-5-nitropyridine (C5H5N3O2). Thermochim. Acta 2007, 463, 6–9. [Google Scholar] [CrossRef]
- Zhou, C.-S.; Chen, F.-Y.; Di, Y.-Q.; Liu, Y.-L.; Liu, Y.-F. Low-Temperature Heat Capacities and Thermodynamic Properties of 2-Aminopyridine. Asian J. Chem. 2016, 28, 529–534. [Google Scholar] [CrossRef]
- Kulagina, T.G.; Smirnova, N.N.; Bykova, T.A.; Lebedev, B.V. Thermodynamics of 4,4’-Bipyridine in the Range 0-330 K. Russ. J. Gen. Chem. 2000, 70, 841–845. [Google Scholar]
- Shi, Q.; Tan, Z.-C.; Di, Y.-Y.; Tong, B.; Li, Y.-S.; Wang, S.-X. Thermal Analysis and Calorimetric Study of 4-Dimethylaminopyridine. J. Chem. Eng. Data 2007, 52, 941–947. [Google Scholar] [CrossRef]
- Wang, S.-X.; Tan, Z.-C.; Li, Y.-S.; Tong, B.; Li, Y.; Shi, Q.; Zhang, J.-N. Thermodynamic Study of 8-Hydroxyquinoline by Adiabatic Calorimetry and Thermal Analysis. Chin. J. Chem. 2008, 26, 2016–2020. [Google Scholar] [CrossRef]
- Dong, J.-X.; Li, Q.; Tan, Z.-C.; Zhang, Z.-H.; Liu, Y. The standard molar enthalpy of formation, molar heat capacities, and thermal stability of anhydrous caffeine. J. Chem. Thermodyn. 2007, 39, 108–114. [Google Scholar] [CrossRef]
- Steele, W.V.; Chirico, R.D.; Nguyen, A.; Knipmeyer, S.E. The thermodynamic properties of 2-methylaniline and trans-(R,S)-decahydroquinoline. J. Chem. Thermodyn. 1994, 26, 515–544. [Google Scholar] [CrossRef]
- Ribeiro da Silva, M.A.V.; Ribeiro da Silva, M.M.C.; Matos, M.A.R.; Jimenez, P.; Roux, M.V.; Martin-Luengo, M.A.; Elguero, J.; Claramunt, R.; Cabildo, P. Enthalpies of combustion, heat capacities, and enthalpies of vaporisation of 1-phenylimidazole and 1-phenylpyrazole. J. Chem. Thermodyn. 2000, 32, 237–245. [Google Scholar] [CrossRef]
- Chirico, R.D.; Knipmeyer, S.E.; Steele, W.V. Heat capacities, enthalpy increments, and derived thermodynamic functions for pyrazine between the temperatures 5K and 380K. J. Chem. Thermodyn. 2003, 35, 1059–1072. [Google Scholar] [CrossRef]
- Flores, H.; Ramos, F.; Camarillo, E.A.; Santiago, O.; Perdomo, G.; Notario, R.; Cabrera, S. Isothermal Thermogravimetric Study for Determining Sublimation Enthalpies of Some Hydroxyflavones. J. Chem. Eng. Data 2018, 63, 1925–1936. [Google Scholar] [CrossRef]
- Ribeiro da Silva, M.A.V.; Ribeiro da Silva, M.M.C.; Amaral, L.M.P.F.; Elguero, J.; Jimenez, P.; Roux, M.V.; Davalos, J.Z.; Temprado, M.; Cabildo, P.; Claramunt, R.M.; et al. Thermochemical properties of two benzimidazole derivatives: 2-Phenyl- and 2-benzylbenzimidazole. J. Chem. Thermodyn. 2005, 37, 1168–1176. [Google Scholar] [CrossRef] [Green Version]
- Kazakov, A.I.; Dalinger, I.L.; Zyuzin, I.N.; Lempert, D.B.; Plishkin, N.A.; Sheremetev, A.B. Enthalpies of formation of 3,4- and 3,5-dinitro-1-trimethyl-1H-pyrazoles. Russ. Chem. Bull. Int. Ed. 2016, 65, 2783–2788. [Google Scholar] [CrossRef]
- Zhang, J.-Q.; Liu, R.; Ji, T.-Z.; Ren, J.-C.; Guo, Q.; Wang, B.-Z.; Hu, R.-Z. Thermal behavior and thermal safety of 6bnitrohexahydro-2H-1,3,5-trioxacyclopenta[cd]-pentalene-2,4,6-triyltrinitrate. R. Soc. Chem. Adv. 2017, 7, 30747–30754. [Google Scholar]
- Masuda, N.; Nagano, Y.; Kimura, T. Standard molar enthalpy of formation of CH3(CH3SCH2)SO, Methyl Methylthiomethyl sulfoxide. J. Therm. Anal. Calorim. 2005, 81, 533–535. [Google Scholar] [CrossRef]
- Rayer, A.V.; Henni, A.; Tontiwachwuthikul, P. Molar Heat Capacities of Solvents Used in CO2 Capture: A Group Additivity and Molecular Connectivity Analysis. Can. J. Chem. Eng. 2012, 90, 367–376. [Google Scholar] [CrossRef]
- Malik, S.; Gupta, H.; Sharma, V.K. Topological investigation of ternary mixtures: Excess heat capacities. J. Mol. Liq. 2017, 233, 319–325. [Google Scholar] [CrossRef]
- Yang, J.; Wu, H.; Wang, Y.; Luan, Q.; Zhang, J.; Wang, G.; Hao, H. Thermodynamics of 4’-bromomethyl-2-cyanobiphenyl in different solvents. J. Chem. Thermodyn. 2015, 83, 77–84. [Google Scholar] [CrossRef]
- Yan, B.; Li, J.; Gao, J.; Wang, A.-M.; Ren, G.-Y.; Ma, H.-X. Crystal structure and thermodynamic properties of myclobutanil. J. Chem. Thermodyn. 2016, 101, 44–48. [Google Scholar] [CrossRef]
- Sun, X.-H.; Liu, Y.-F.; Tan, Z.-C.; Jia, Y.-Q.; Yang, J.-W.; Wang, M.-H. Heat Capacity and Enthalpy of Fusion of Fenoxycarb. Chin. J. Chem. 2005, 23, 501–505. [Google Scholar]
- Sun, X.-H.; Liu, Y.-F.; Tan, Z.-C.; Di, Y.-Y.; Wang, H.-F.; Wang, M.-H. Heat capacity and enthalpy of fusion of pyrimethanil laurate (C24H37N3O2). J. Chem. Thermodyn. 2004, 36, 895–899. [Google Scholar] [CrossRef]
- Di, Y.-Y.; Ye, C.-T.; Tan, Z.-C.; Zhang, G.-D. Low-temperature heat capacity and standard molar enthalpy of formation of crystalline (S)-(+)-Ibuprofen (C13H18O2)(s). Ind. J. Chem. 2007, 46A, 947–951. [Google Scholar]
- Knyazev, A.V.; Emel’yanenko, V.N.; Smirnova, N.N.; Zaitsau, D.H.; Stepanova, O.V.; Shipilova, A.S.; Markin, A.V.; Gusarova, E.V.; Knyazeva, S.S.; Verevkin, S.P. Comprehensive thermodynamic study of methylprednisolone. J. Chem. Thermodyn. 2017, 107, 37–41. [Google Scholar] [CrossRef]
- Di, Y.-Y.; Wang, D.-Q.; Shi, Q.; Tan, Z.-C. Low-temperature heat capacities and standard molar enthalpy of formation of N-methylnorephedrine C11H17NO(s). Chin. Phys. B 2008, 17, 2859–2866. [Google Scholar]
- Di, Y.-Y.; Kong, Y.-X.; Yang, W.-W.; Wang, D.-Q.; Tan, Z.-C. Crystal Structure and Thermodynamic Properties of N, N-dimethylnorephedrine Hydrochloride (C11H18NOCl) (s). Acta Chim. Slov. 2009, 56, 392–398. [Google Scholar]
- Simoes, R.G.; Bernardes, C.E.S.; Diogo, H.P.; Agapito, F.; Minas de Piedade, M.E. Energetics and Structure of Simvastatin. Mol. Pharm. 2013, 10, 2713–2722. [Google Scholar] [CrossRef]
- Mealy, D.; Svärd, M.; Rasmuson, A. Thermodynamics of Risperidone and Solubility in Pure Organic Solvents. Fluid Phase Equil. 2014, 373, 73–79. [Google Scholar] [CrossRef]
- Knyazev, A.V.; Letyanina, I.A.; Plesovskikh, A.S.; Smirnova, N.N.; Knyazeva, S.S. Thermodynamic properties of vitamin B2. Thermochim. Acta 2014, 575, 12–16. [Google Scholar] [CrossRef]
- Becker, L.; Gmehling, J. Measurement of Heat Capacities for 12 Organic Substances by Tian-Calvet Calorimetry. J. Chem. Eng. Data 2001, 46, 1638–1642. [Google Scholar] [CrossRef]
- Paulechka, Y.U. Heat Capacity of Room-Temperature Ionic Liquids: A Critical Review. J. Phys. Chem. Ref. Data 2010, 39, 033108-1-23. [Google Scholar] [CrossRef]
- NIST National Institute of Standards and Technology Data Gateway. Available online: http://srdata.nist.gov/gateway/ (accessed on 1 May 2015).
- Hanaya, M.; Shibazaki, H.; Oguni, M.; Nemoto, T.; Ohashi, Y. Orientational ordering/disordering of ions accompanied by phase transitions in pyridinium tetrafluoroborate crystal. J. Phys. Chem. Solids 2000, 61, 651–657. [Google Scholar] [CrossRef]
- Anouti, M.; Caillon-Caravanier, M.; Dridi, Y.; Jacquemin, J.; Hardacre, C.; Lemordant, D. Liquid densities, heat capacities, refractive index and excess quantities for {protic ionic liquids + water} binary system. J. Chem. Thermodyn. 2009, 41, 799–808. [Google Scholar] [CrossRef]
- Smirnova, N.N.; Tsvetkova, L.Y.; Bykova, T.A.; Ruchenin, V.A.; Marcus, Y. Thermodynamic properties of tetrabutylammonium iodide and tetrabutylammonium tetraphenylborate. Thermochim. Acta 2009, 483, 15–20. [Google Scholar] [CrossRef]
- Tong, B.; Liu, Q.-S.; Tan, Z.-C.; Weiz-Biermann, U. Thermochemistry of Alkyl Pyridinium Bromide Ionic Liquids: Calorimetric Measurements and Calculations. J. Phys. Chem. A 2010, 114, 3782–3787. [Google Scholar] [CrossRef]
- Freire, M.G.; Teles, A.R.R.; Rocha, M.A.A.; Schröder, B.; Neves, C.M.S.S.; Carvalho, P.J.; Evtuguin, D.V.; Santos, L.M.N.B.F.; Coutinho, J.A.P. Thermophysical Characterization of Ionic Liquids Able To Dissolve Biomass. J. Chem. Eng. Data 2011, 56, 4813–4822. [Google Scholar] [CrossRef]
- Rocha, M.A.A.; Bastos, M.; Coutinho, J.A.P.; Santos, L.M.N.B.F. Heat capacities at 298.15 K of the extended [CnC1im][Ntf2] ionic liquid series. J. Chem. Thermodyn. 2012, 53, 140–143. [Google Scholar] [CrossRef]
- Ferreira, A.F.; Simoes, P.N.; Ferreira, A.G.M. Quaternary phosphonium-based ionic liquids: Thermal stability and heat capacity of the liquid phase. J. Chem. Thermodyn. 2012, 45, 16–27. [Google Scholar] [CrossRef]
- Domanska, U.; Skiba, K.; Zawadski, M.; Paduszynski, K.; Krolikowski, M. Synthesis, physical, and thermodynamic properties of 1-alkyl-cyanopyridinium bis{(trifluoromethyl)sulfonyl}imide ionic liquids. J. Chem. Thermodyn. 2013, 56, 153–161. [Google Scholar] [CrossRef]
- Liu, Q.-S.; Tan, Z.-C.; Weiz-Biermann, U.; Liu, X.-X. Molar heat capacity and thermodynamic properties of N-alklypyridinium hexafluorophosphate salts, [Cnpy][PF6] (n = 2, 3, 5). J. Chem. Thermodyn. 2014, 68, 82–89. [Google Scholar] [CrossRef]
- Zaitsau, D.H.; Yermalayeu, A.V.; Emel’yanenko, V.N.; Heintz, A.; Verevkin, S.P.; Schick, C.; Berdzinski, S.; Strehmel, V. Structure–property relationships in ILs: Vaporization enthalpies of pyrrolidinium based ionic liquids. J. Mol. Liq. 2014, 192, 171–176. [Google Scholar] [CrossRef]
- Yan, B.; Li, H.-Y.; Zhao, N.-N.; Ma, H.-X.; Song, J.-R.; Zhao, F.-Q.; Hu, R.-Z. Thermodynamic properties, detonation characterization and free radical of N-20,40-dinitrophenyl-3,3-dinitroazetidine. J. Chem. Thermodyn. 2014, 69, 152–156. [Google Scholar] [CrossRef]
- Talavera-Prieto, N.M.C.; Ferreira, A.G.M.; Simoes, P.N.; Carvalho, P.J.; Mattedi, S.; Coutinho, J.A.P. Thermophysical characterization of N-methyl-2-hydroxyethylammonium carboxilate ionic liquids. J. Chem. Thermodyn. 2014, 68, 221–234. [Google Scholar] [CrossRef] [Green Version]
- Paulechka, E.; Blokhin, A.V.; Rodrigues, A.S.M.C.; Rocha, M.A.A.; Santos, L.M.N.B.F. Thermodynamics of long-chain 1-alkyl-3-methylimidazolium bis(trifluoromethanesulfonyl)imide ionic liquids. J. Chem. Thermodyn. 2016, 97, 331–340. [Google Scholar] [CrossRef]
- Serra, P.B.P.; Ribeiro, F.M.S.; Rocha, M.A.A.; Fulem, M.; Ruzicka, K.; Santos, L.M.N.B.F. Phase Behavior and Heat Capacities of the 1-Benzyl-3-methylimidazolium Ionic Liquids. J. Chem. Thermodyn. 2016, 100, 124–130. [Google Scholar] [CrossRef]
- Rocha, M.A.A.; Vilas, M.; Rodrigues, A.S.M.C.; Tojo, E.; Santos, L.M.N.B.F. Physicochemical properties of 2-alkyl-1-ethylpyridinium based ionic liquids. Fluid Phase Equil. 2016, 428, 112–120. [Google Scholar] [CrossRef]
- Zaitsau, D.H.; Varfolomeev, M.A.; Verevkin, S.P.; Stanton, A.D.; Hindman, M.S.; Bara, J.E. Structure–property relationships in ionic liquids: Influence of branched and cyclic groups on vaporization enthalpies of imidazolium-based Ils. J. Chem. Thermodyn. 2016, 93, 151–156. [Google Scholar] [CrossRef]
- Yan, B.; Li, H.-Y.; Guan, Y.-L.; Ma, H.-X.; Song, J.-R.; Zhao, F.-Q. Thermodynamic properties of 3,3-dinitroazetidinium nitrate. J. Chem. Thermodyn. 2016, 103, 206–211. [Google Scholar] [CrossRef]
- Zheng, L.; Li, L.; Guo, Y.-F.; Guan, W.; Fang, D.-W. The isobaric heat capacities and thermodynamic properties of ionic liquid 1- ethylpyridinium bis(trifluoromethylsulfonyl)imide. J. Therm. Anal. Calorim. 2017, 131. [Google Scholar] [CrossRef]
- Tian, T.; Hu, X.; Guan, P.; Wang, S.; Ding, X. Density and thermodynamic performance of energetic ionic liquids based on 1-alkyl/esteryl-4-amino-1,2,4-triazolium. J. Mol. Liq. 2017, 248, 70–80. [Google Scholar] [CrossRef]
- Gupta, H.; Malik, S.; Chandrasekhar, M.; Sharma, V.K. Thermodynamic investigations of excess heat capacities of ternary liquid mixtures containing [Bmmim][BF4] + [Bmim][BF4] or [Emim][BF4] + cyclopentanone or cyclohexanone. J. Therm. Anal. Calorim. 2018, 131, 1653–1669. [Google Scholar] [CrossRef]
- Serra, P.B.P.; Ribeiro, F.M.S.; Rocha, M.A.A.; Fulem, M.; Ruzicka, K.; Coutinho, J.A.P.; Santos, L.M.N.B.F. Solid-liquid equilibrium and heat capacity trend in the alkylimidazolium PF6 series. J. Mol. Liq. 2017, 248, 678–687. [Google Scholar] [CrossRef]
- Dong, Y.; Shah, S.N.; Pranesh, M.; Prokkola, H.; Kärkkäinen, J.; Leveque, J.-M.; Lassi, U.; Lethesh, K.C. Azepanium based protic ionic liquids: Synthesis, thermophysical properties and COSMO-RS study. J. Mol. Liq. 2018, 264, 24–31. [Google Scholar] [CrossRef]
- Bendova, M.; Canji, M.; Wagner, Z.; Bogdanov, M.G. Ionic Liquids as Thermal Energy Storage Materials: On the Importance of Reliable Data Analysis in Assessing Thermodynamic Data. J. Solution Chem. 2018. [Google Scholar] [CrossRef]
- Oster, K.; Jacquemin, J.; Hardacre, C.; Ribeiro, A.P.C.; Elsinawi, A. Further development of the predictive models for physical properties of pure ionic liquids: Thermal conductivity and heat capacity. J. Chem. Thermodyn. 2018, 118, 1–15. [Google Scholar] [CrossRef]
- Gomez, E.; Calvar, N.; Dominguez, A.; Macedo, E.A. Thermal behavior and heat capacities of pyrrolidinium-based ionic liquids by DSC. Fluid Phase Equil. 2018, 470, 51–59. [Google Scholar] [CrossRef]
- Huelsekopf, M.; Ludwig, R. Temperature Dependence of Hydrogen Bonding. J. Mol. Liq. 2000, 85, 105–125. [Google Scholar] [CrossRef]
Sample Availability: Samples of the compounds are not available. |


| Molecule | Vm (Present Work) | Vm (ref. [41]) | Vm (ref. [35]) |
|---|---|---|---|
| Carbon dioxide | 34.1 | 30.61 | |
| Water | 19.2 | 16.82 | |
| Ammonia | 22.7 | 21.91 | |
| Methane | 28.1 | 28.01 | 28.42 |
| Ethane | 44.9 | 44.63 | 45.38 |
| Propane | 61.5 | 61.39 | 62.37 |
| Ethylene | 39.6 | 40.25 | 39.64 |
| Acetylene | 34.8 | 36.15 | 38.35 |
| Butadiyne | 58.3 | 59.74 | 64.31 |
| Benzene | 83.4 | 85.39 | 80.28 |
| Toluene | 100 | 101.8 | 98.79 |
| Biphenyl | 153.3 | 157.1 | 152.2 |
| Fluoroethane | 49.8 | 47.45 | 49.17 |
| Chloroethane | 59.1 | 59.45 | 58.96 |
| Bromobenzene | 101.8 | 106.6 | 100.3 |
| Iodobenzene | 108 | 114.7 | 108.7 |
| Cyclopropane | 54.6 | 42.7/50 | |
| Cyclohexane | 100.5 | 99.1 | 100 |
| Acetone | 64.6 | 62.86 | 64.81 |
| Methanol | 36.9 | 34.89 | 36.04 |
| Acetic acid | 56.7 | 51.18 | 55.1 |
| Cation | Vm (A3) | Anion | Vm (A3) |
|---|---|---|---|
| Methyltributylammonium | 237.06 | Nitrate | 40.26 |
| Pyrrolidinium | 81.56 | Acetate | 54.06 |
| 1-Methyl-1-propylpyrrolidinium | 145.36 | Propionate | 70.56 |
| 1-Butyl-1-methylpyrrolidinium | 161.36 | Butanoate | 87.26 |
| 1-Methyl-1-pentylpyrrolidinium | 178.76 | Pentanoate | 103.96 |
| 1-Hexyl-1-methylpyrrolidinium | 195.46 | Trifluoroacetate | 68.66 |
| 1-Methyl-1-octylpyrrolidinium | 228.86 | Hydrogen sulfate | 58.16 |
| 1-Butyl-1-methylpiperidinium | 177.16 | Methylsulfate | 75.56 |
| 1,3-Dimethylimidazolium | 97.76 | Ethylsulfate | 92.26 |
| 1-Ethyl-3-methylimidazolium | 112.36 | Octylsulfate | 192.46 |
| 1-Butyl-3-methylimidazolium | 146.2 | Methanesulfonate | 66.86 |
| 1-Hexyl-3-methylimidazolium | 178.7 | Trifluoromethanesulfonate | 81.66 |
| 2,3-Dimethyl-1-hexylimidazolium | 196.86 | Toluenesulfonate | 138.36 |
| 1-Octyl-3-methylimidazolium | 203.91 | Docusate | 401.86 |
| 1-Decyl-3-methylimidazolium | 248.36 | Thiocyanate | 54.76 |
| 1-Dodecyl-3-methylimidazolium | 281.46 | Tetrafluoroborate | 46.46 |
| 1-Ethylpyridinium | 114.16 | Tetracyanoborate | 100.26 |
| 1-Propylpyridinium | 129.36 | Dicyanoamide | 57.26 |
| 1-Butylpyridinium | 145.96 | Tricyanomethide | 76.26 |
| 1-Octylpyridinium | 212.36 | Dimethylphosphate | 96.86 |
| 1-Ethyl-3-methylpyridinium | 129.06 | Diethylphosphate | 130.36 |
| 1-Hexyl-3-methylpyridinium | 196.76 | Hexafluorophosphate | 78.36 |
| 1-Ethyl-2-heptylpyridinium | 227.96 | Tris(pentafluoroethyl)trifluorophosphate | 216.96 |
| 1-Ethyl-2-octylpyridinium | 244.56 | Bis(2,2,4-trimethylpentyl)phosphinate | 304.86 |
| 1-Ethyl-2-nonylpyridinium | 261.46 | Bis(trifluoromethylsulfonyl)amide | 156.46 |
| 4-Dimethylamino-1-hexylpyridinium | 224.56 | Saccharinate | 138.06 |
| Ethyl tributylphosphonium | 270.16 | Serinate | 91.26 |
| Tetrabutylphosphonium | 302.96 | L-Valinate | 114.66 |
| Tetradecyl trihexylphosphonium | 570.96 | L-Threoninate | 105.16 |
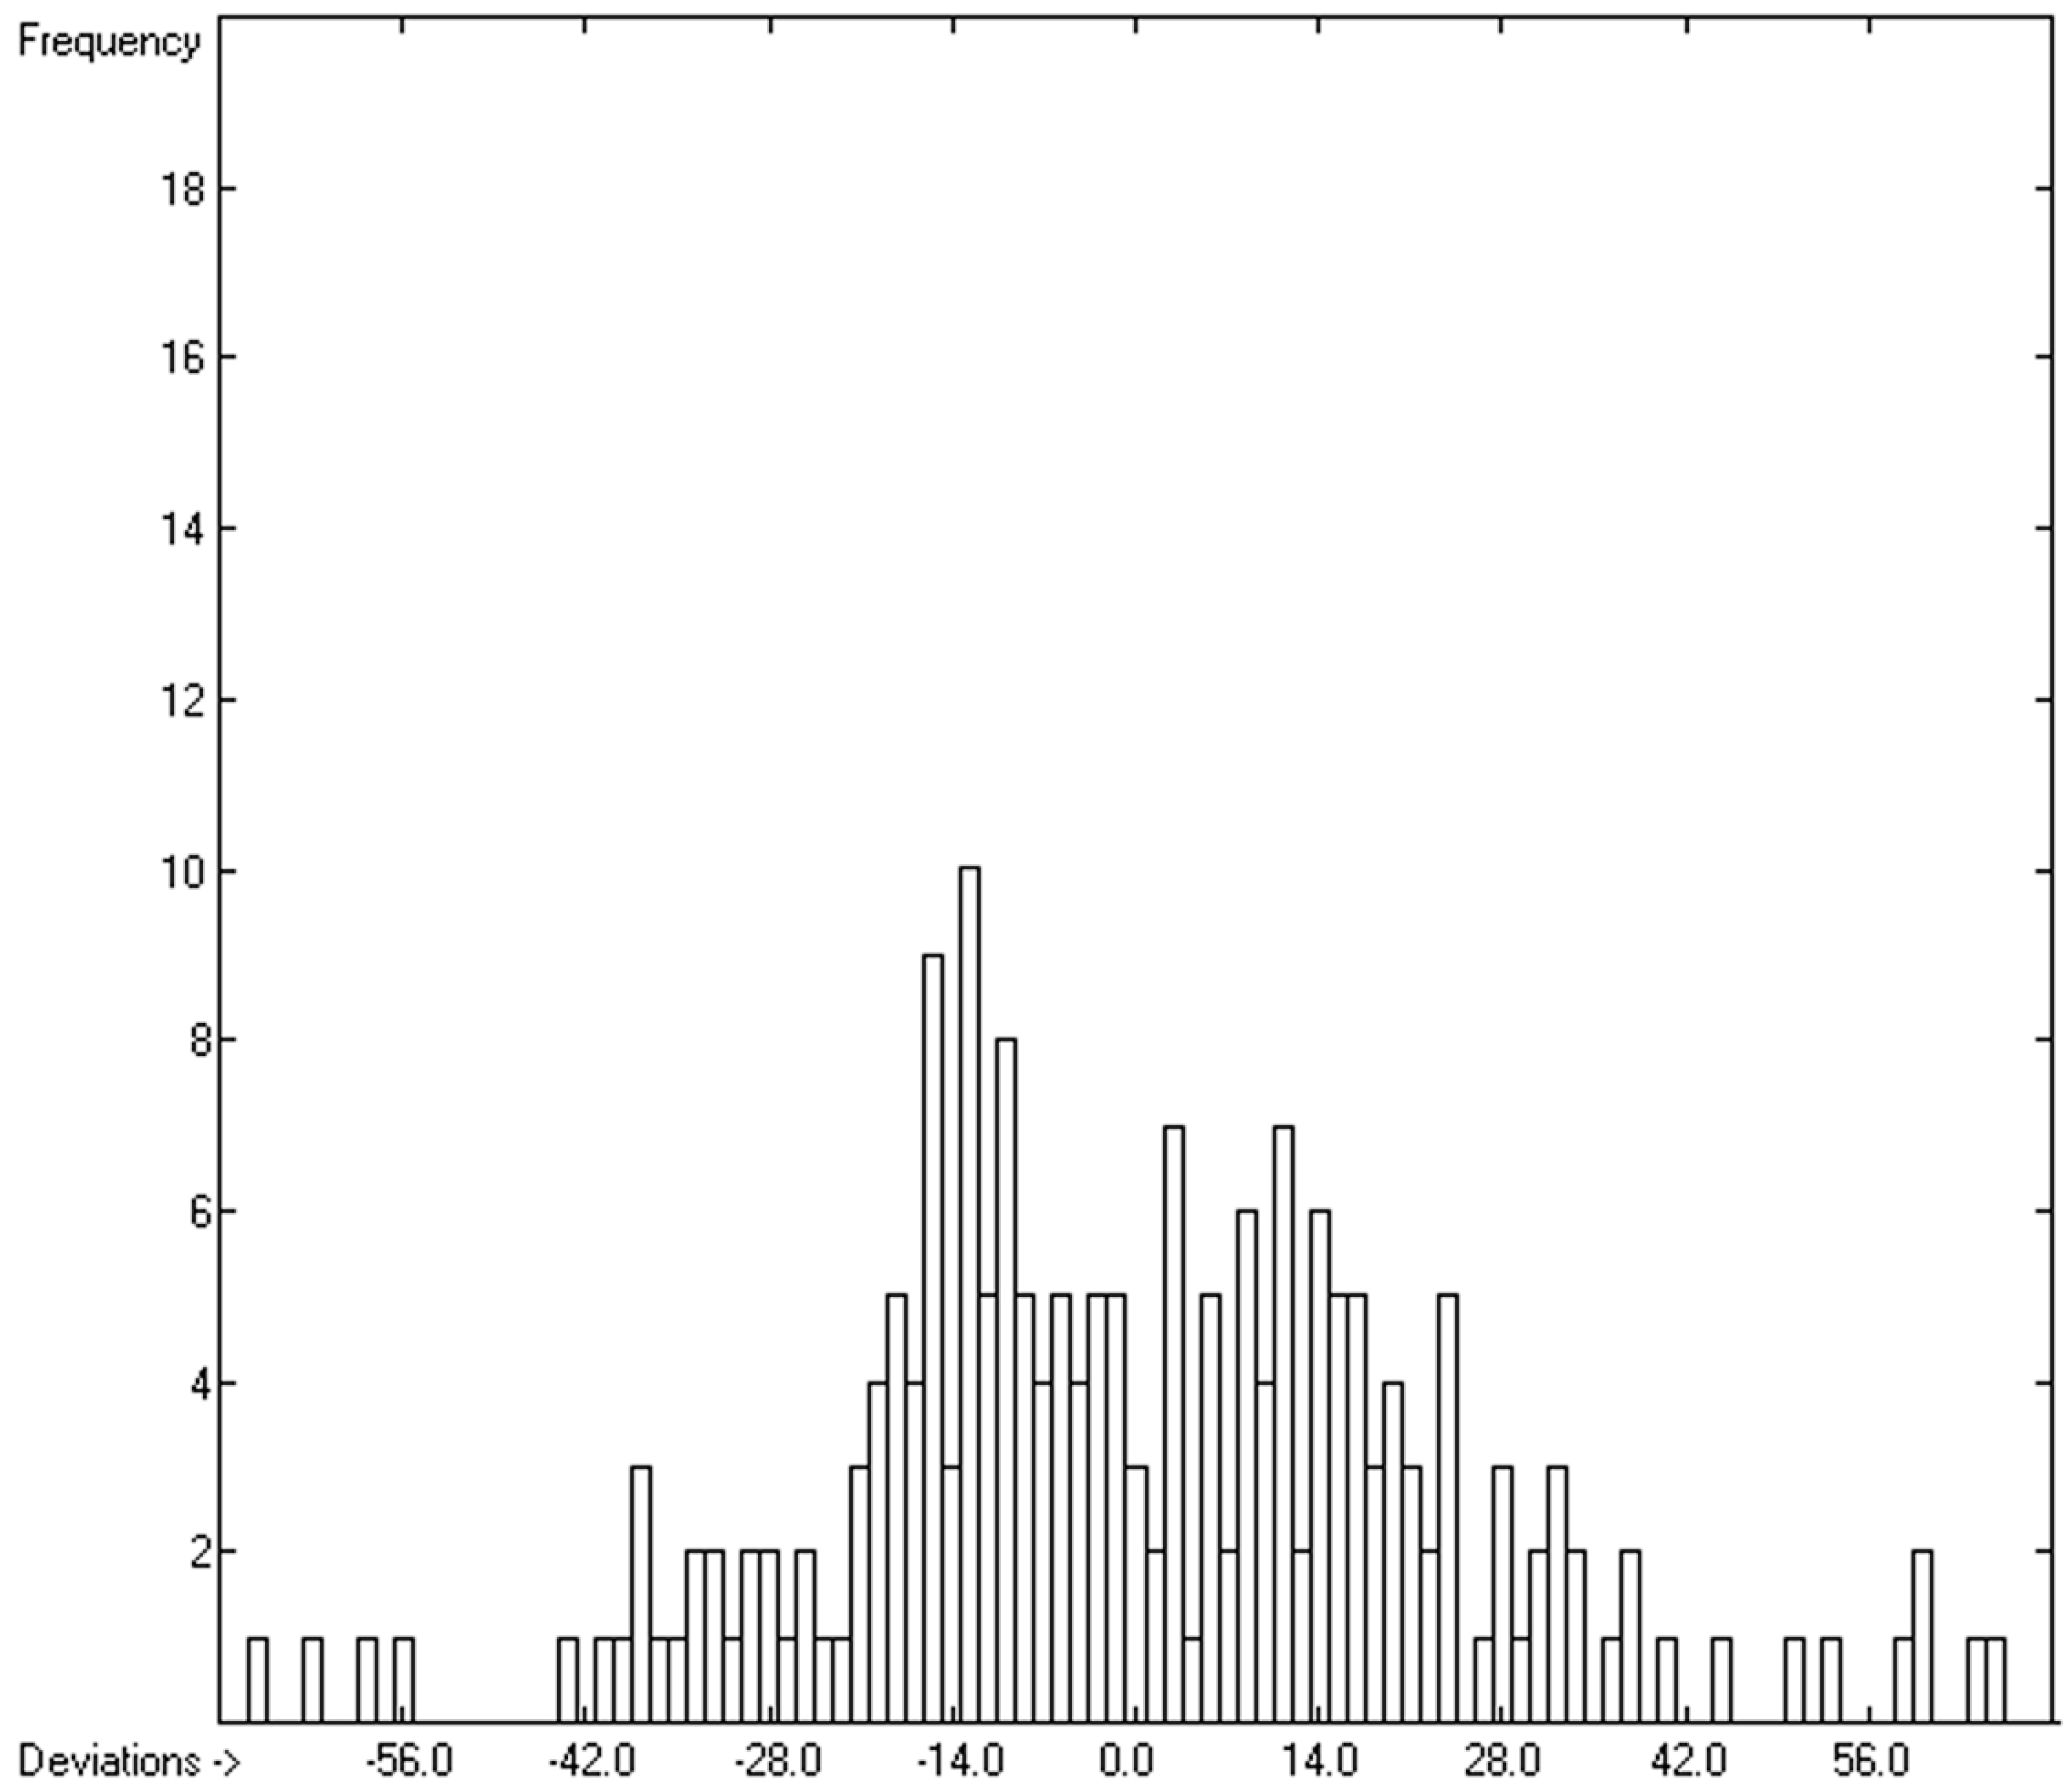
| Molecule Name | Cp(liq,298) exp | Cp(liq,298) calc | Deviation | Dev. in % |
|---|---|---|---|---|
| Pyrrolidinium nitrate | 228.00 | 215.40 | 12.60 | 5.53 |
| 1-Ethyl-3-methylimidazolium bromide | 264.80 | 256.10 | 8.70 | 3.29 |
| 3,3-Dinitroazetidinium nitrate | 272.95 | 270.60 | 2.35 | 0.86 |
| 1-Propyl-3-methylimidazolium bromide | 281.40 | 286.80 | −5.40 | −1.92 |
| 1-Ethyl-3-methylimidazolium thiocyanate | 281.45 | 295.40 | −13.95 | −4.96 |
| 1-Ethyl-3-methylimidazolium acetate | 321.90 | 296.60 | 25.30 | 7.86 |
| 1-Methyltetrahydrothiophenium dicyanamide | 338.50 | 300.80 | 37.70 | 11.14 |
| 1-Ethyl-3-methylimidazolium tetrafluoroborate | 305.00 | 302.10 | 2.90 | 0.95 |
| 1,3-Dimethylimidazolium methosulfate | 341.00 | 305.20 | 35.80 | 10.50 |
| 1-Butyl-3-methylimidazolium chloride | 317.00 | 305.90 | 11.10 | 3.50 |
| 1-Ethyl-3-methylimidazolium dicyanamide | 314.64 | 314.90 | −0.26 | −0.08 |
| 1-Butyl-3-methylimidazolium bromide | 317.00 | 317.90 | −0.90 | −0.28 |
| 1-Ethyl-3-methylimidazolium methanesulfonate | 345.50 | 322.00 | 23.50 | 6.80 |
| 1-Ethyl-3-methylimidazolium trifluoroacetate | 316.00 | 323.90 | −7.90 | −2.50 |
| 1-Ethyltetrahydrothiophenium dicyanamide | 335.38 | 330.90 | 4.48 | 1.34 |
| 1-Butyl-3-methylimidazolium nitrate | 353.50 | 333.30 | 20.20 | 5.71 |
| 1-Propylpyridinium tetrafluoroborate | 363.00 | 335.40 | 27.60 | 7.60 |
| 1-Ethyl-3-methylimidazolium methylsulfate | 341.00 | 338.70 | 2.30 | 0.67 |
| 1-Ethyl-3-methylimidazolium tricyanomethide | 358.70 | 340.10 | 18.60 | 5.19 |
| 1-Ethyl-3-methylimidazolium hexafluorophosphate | 343.60 | 341.30 | 2.30 | 0.67 |
| 1-Ethylpyridinium hexafluorophosphate | 293.00 | 341.60 | −48.60 | −16.59 |
| 1-Butyl-3-methylimidazolium iodide | 314.00 | 341.70 | −27.70 | −8.82 |
| 1-Benzyl-3-methylimidazolium chloride | 339.40 | 343.80 | −4.40 | −1.30 |
| 1-Ethyl-3-methylimidazolium trifluoromethylsulfonate | 362.80 | 349.60 | 13.20 | 3.64 |
| 1-Butyl-3-methylimidazolium thiocyanate | 385.00 | 356.00 | 29.00 | 7.53 |
| 1-Butyl-3-methylimidazolium acetate | 383.20 | 359.60 | 23.60 | 6.16 |
| 1-Butyl-3-methylimidazolium tetrafluoroborate | 363.00 | 362.50 | 0.50 | 0.14 |
| 1-Methylazepanium methosulfate | 332.08 | 364.90 | −32.82 | −9.88 |
| 1-Butylpyridinium tetrafluoroborate | 383.80 | 365.60 | 18.20 | 4.74 |
| 1-Ethyl-3-methylimidazolium ethosulfate | 378.00 | 366.70 | 11.30 | 2.99 |
| 1-Propylpyridinium hexafluorophosphate | 328.70 | 371.90 | −43.20 | −13.14 |
| 1-Propyl-3-methylimidazolium hexafluorophosphate | 374.40 | 372.00 | 2.40 | 0.64 |
| 1-Butyl-3-methylimidazolium dicyanoamide | 365.00 | 373.00 | −8.00 | −2.19 |
| 1-Ethyl-3-methylimidazolium dimethylphosphate | 411.78 | 375.20 | 36.58 | 8.88 |
| 1-Hexyl-3-methylimidazolium bromide | 344.00 | 376.90 | −32.90 | −9.56 |
| 1-(3-Cyanopropyl)-pyridinium dicyanamide | 422.00 | 379.40 | 42.60 | 10.09 |
| 1-Butyl-3-methylimidazolium trifluoroacetate | 408.20 | 385.10 | 23.10 | 5.66 |
| 1-Butyl-2-methylimidazolium trifluoroacetate | 407.90 | 388.90 | 19.00 | 4.66 |
| 1-Butyltetrahydrothiophenium dicyanamide | 395.19 | 391.40 | 3.79 | 0.96 |
| 1-Butyl-2,3-dimethylimidazolium tetrafluoroborate | 416.01 | 392.40 | 23.61 | 5.68 |
| 1-Butyl-3-methylpyridinium tetrafluoroborate | 388.00 | 392.90 | −4.90 | −1.26 |
| 1-Butyl-4-methylpyridinium tetrafluoroborate | 414.00 | 393.00 | 21.00 | 5.07 |
| 1-(3-Cyanopropyl)-2,3-dimethylimidazolium tetrafluoroborate | 339.00 | 396.70 | −57.70 | −17.02 |
| 1-Ethyl-3-methylpyridinium ethylsulfate | 389.00 | 397.10 | −8.10 | −2.08 |
| 1-Butyl-3-methylimidazolium methosulfate | 416.00 | 397.30 | 18.70 | 4.50 |
| 1-Benzyl-3-methylimidazolium tetrafluoroborate | 387.50 | 400.00 | −12.50 | −3.23 |
| 1-Butyl-3-methylimidazolium hexafluorophosphate | 407.70 | 402.10 | 5.60 | 1.37 |
| 1-Butyl-1-methylpyrrolidinium dicyanamide | 413.00 | 405.30 | 7.70 | 1.86 |
| 1-(3-Cyanopropyl)-2,3-dimethylimidazolium dicyanamide | 444.00 | 408.90 | 35.10 | 7.91 |
| 1-Butyl-3-methylimidazolium trifluoromethylsulfonate | 417.00 | 409.70 | 7.30 | 1.75 |
| 1-Hexyl-3-methylimidazolium tetrafluoroborate | 416.00 | 421.50 | −5.50 | −1.32 |
| 1,2-Diethylpyridinium ethylsulfate | 412.00 | 427.80 | −15.80 | −3.83 |
| 1-Butyl-2,3-dimethylimidazolium hexafluorophosphate | 433.60 | 432.40 | 1.20 | 0.28 |
| 1-Pentyl-3-methylimidazolium hexafluorophosphate | 437.40 | 432.90 | 4.50 | 1.03 |
| 1-Butyl-1-methylpyrrolidinium trifluoromethanesulfonate | 435.00 | 437.40 | −2.40 | −0.55 |
| 1-Octyl-3-methylimidazolium bromide | 392.00 | 438.00 | −46.00 | −11.73 |
| 1-Ethyl-3-methylimidazolium toluenesulfonate | 484.20 | 451.10 | 33.10 | 6.84 |
| 1-Methyl-3-propylimidazolium 2-amino-4-carboxybutanoate | 517.10 | 456.80 | 60.30 | 11.66 |
| 1-Hexyl-3-methylimidazolium hexafluorophosphate | 424.00 | 461.50 | −37.50 | −8.84 |
| 1-Hexyl-3-methylimidazolium trifluoromethylsulfonate | 502.30 | 470.00 | 32.30 | 6.43 |
| Ethyl 1-ethylnicotinate ethosulfate | 513.00 | 476.70 | 36.30 | 7.08 |
| 1-Butyl-1-methylpyrrolidinium tetracyanoborate | 524.00 | 482.50 | 41.50 | 7.92 |
| 1-Octyl-3-methylimidazolium tetrafluoroborate | 498.00 | 483.10 | 14.90 | 2.99 |
| 1-Ethyl-3-methylimidazolium bis(trifluoromethanesulfonyl) amide | 500.00 | 483.20 | 16.80 | 3.36 |
| 1-Benzyl-3-methylimidazolium tetrafluoroethanesulfonate | 502.80 | 485.10 | 17.70 | 3.52 |
| 1-Butyl-3-methylpyridinium tetracyanoborate | 495.00 | 487.00 | 8.00 | 1.62 |
| N-Ethylpyridinium bis(trifluoromethylsulfonyl)amide | 502.15 | 487.20 | 14.95 | 2.98 |
| 1-Ethyl-3-methylimidazolium 2-(2-methoxyethoxy)ethylsulfate | 526.00 | 492.90 | 33.10 | 6.29 |
| 1-Heptyl-3-methylimidazolium hexafluorophosphate | 500.60 | 493.90 | 6.70 | 1.34 |
| 1-Ethyl-2,3-dimethylimidazolium bis(trifluoromethanesulfonyl) amide | 493.00 | 508.50 | −15.50 | −3.14 |
| 1-Methyl-3-butylimidazolium saccharinate | 565.66 | 509.30 | 56.36 | 9.96 |
| 1-Isopropyl-3-methylimidazolium bis(trifluoromethanesulfonyl) amide | 529.90 | 512.70 | 17.20 | 3.25 |
| 1-Propyl-3-methylimidazolium bis(trifluoromethanesulfonyl) amide | 534.90 | 513.10 | 21.80 | 4.08 |
| 1-Butyl-3-methylimidazolium toluenesulfonate | 548.40 | 514.40 | 34.00 | 6.20 |
| N-Ethyl-2-methylpyridinium bis(trifluoromethylsulfonyl)amide | 534.50 | 515.50 | 19.00 | 3.55 |
| 1-Octyl-3-methylimidazolium hexafluorophosphate | 536.10 | 524.50 | 11.60 | 2.16 |
| 1-Octyl-3-methylimidazolium trifluoromethylsulfonate | 577.70 | 530.70 | 47.00 | 8.14 |
| 1-Cyclopropylmethyl-3-methylimidazolium bis(trifluoromethanesulfonyl) amide | 539.10 | 532.60 | 6.50 | 1.21 |
| Trimethyl butylammonium bis(trifluoromethylsulfonyl)amide | 559.20 | 536.70 | 22.50 | 4.02 |
| 1,2-Diethylpyridinium bis(trifluoromethanesulfonyl) amide | 566.10 | 538.80 | 27.30 | 4.82 |
| 1-Butyl-3-methylimidazolium bis(trifluoromethanesulfonyl) amide | 536.00 | 542.00 | −6.00 | −1.12 |
| 1-sec-Butyl-3-methylimidazolium bis(trifluoromethanesulfonyl) amide | 557.10 | 542.40 | 14.70 | 2.64 |
| 1-Isobutyl-3-methylimidazolium bis(trifluoromethanesulfonyl) amide | 557.10 | 543.30 | 13.80 | 2.48 |
| 1-Methyl-1-propylpyrrolidinium bis(trifluoromethanesulfonyl) amide | 554.00 | 543.30 | 10.70 | 1.93 |
| 1-Propyl-2,3-dimethylimidazolium bis(trifluoromethanesulfonyl) amide | 554.50 | 543.60 | 10.90 | 1.97 |
| N-Propyl-2-methylpyridinium bis(trifluoromethylsulfonyl)amide | 557.96 | 545.80 | 12.16 | 2.18 |
| N-Butylpyridinium bis(trifluoromethanesulfonyl) amide | 566.52 | 546.70 | 19.82 | 3.50 |
| N-Propyl-3-methylpyridinium bis(trifluoromethylsulfonyl)amide | 517.00 | 547.20 | −30.20 | −5.84 |
| 1-Nonyl-3-methylimidazolium hexafluorophosphate | 569.40 | 553.50 | 15.90 | 2.79 |
| N-Octylisoquinolinium thiocyanate | 522.00 | 557.90 | −35.90 | −6.88 |
| N-Ethyl-4-dimethylaminopyridinium bis(trifluoromethanesulfonyl) amide | 594.30 | 568.30 | 26.00 | 4.37 |
| 1-Pentyl-3-methylimidazolium bis(trifluoromethanesulfonyl) amide | 595.60 | 571.30 | 24.30 | 4.08 |
| 1-Ethyl-2-propylpyridinium bis(trifluoromethanesulfonyl) amide | 593.90 | 574.60 | 19.30 | 3.25 |
| 1-Isobutyl-1-methylpyrrolidinium bis(trifluoromethylsulfonyl)amide | 582.20 | 576.20 | 6.00 | 1.03 |
| 1-Isobutyl-3-methylpyridinium bis(trifluoromethylsulfonyl)amide | 579.00 | 576.70 | 2.30 | 0.40 |
| N-Butyl-3-methylpyridinium bis(trifluoromethylsulfonyl)amide | 578.10 | 577.30 | 0.80 | 0.14 |
| 1-Butyl-1-methylpyrrolidinium bis(trifluoromethylsulfonyl)amide | 572.00 | 578.00 | −6.00 | −1.05 |
| 1-Butyl-3-cyanopyridinium bis(trifluoromethylsulfonyl)amide | 586.00 | 579.50 | 6.50 | 1.11 |
| 1-Benzyl-3-methylimidazolium bis(trifluoromethylsulfonyl) amide | 607.80 | 581.40 | 26.40 | 4.34 |
| 1-Decyl-3-methylimidazolium hexafluorophosphate | 603.30 | 585.00 | 18.30 | 3.03 |
| 1-Cyclopentylmethyl-3-methylimidazolium bis(trifluoromethanesulfonyl) amide | 560.60 | 586.30 | −25.70 | −4.58 |
| Tri(butyl) methylphosphonium methylsulfate | 617.80 | 592.70 | 25.10 | 4.06 |
| 1-Hexyl-3-methylimidazolium bis(trifluoromethanesulfonyl) amide | 629.20 | 603.80 | 25.40 | 4.04 |
| 1-Butyl-1-methylpiperidinium bis(trifluoromethylsulfonyl)amide | 607.50 | 606.10 | 1.40 | 0.23 |
| 1-Ethyl-2-butylpyridinium bis(trifluoromethanesulfonyl) amide | 623.60 | 606.20 | 17.40 | 2.79 |
| N-Hexylpyridinium bis(trifluoromethanesulfonyl) amide | 612.00 | 606.90 | 5.10 | 0.83 |
| 1-Methyl-1-pentylpyrrolidinium bis(trifluoromethanesulfonyl) amide | 622.60 | 608.40 | 14.20 | 2.28 |
| 1-Butyl-3-methylimidazolium octylsulfate | 635.00 | 610.10 | 24.90 | 3.92 |
| 1-Cyclohexylmethyl-3-methylimidazolium bis(trifluoromethanesulfonyl) amide | 617.10 | 615.50 | 1.60 | 0.26 |
| N-Butyl-4-dimethylaminopyridinium bis(trifluoromethanesulfonyl) amide | 657.71 | 626.70 | 31.01 | 4.71 |
| 1-Heptyl-3-methylimidazolium bis(trifluoromethanesulfonyl) amide | 659.20 | 630.80 | 28.40 | 4.31 |
| 2,3-Dimethyl-1-Hexylimidazolium bis(trifluoromethanesulfonyl) amide | 686.00 | 632.30 | 53.70 | 7.83 |
| 1-Ethyl-2-pentylpyridinium bis(trifluoromethanesulfonyl) amide | 652.70 | 636.60 | 16.10 | 2.47 |
| 1-Hexyl-3-methylpyridinium bis(trifluoromethylsulfonyl)amide | 624.00 | 637.70 | −13.70 | −2.20 |
| 1-Hexyl-1-methylpyrrolidinium bis(trifluoromethanesulfonyl) amide | 655.10 | 638.80 | 16.30 | 2.49 |
| 1-Hexyl-4-cyanopyridinium bis(trifluoromethylsulfonyl)amide | 633.00 | 639.60 | −6.60 | −1.04 |
| 1-Hexyl-3-cyanopyridinium bis(trifluoromethylsulfonyl)amide | 658.00 | 639.70 | 18.30 | 2.78 |
| 1-Dodecyl-3-methylimidazolium hexafluorophosphate | 666.30 | 646.50 | 19.80 | 2.97 |
| 1-Octyl-3-methylimidazolium bis(trifluoromethanesulfonyl) amide | 654.00 | 664.00 | −10.00 | −1.53 |
| 1-Methyl-1-heptylpyrrolidinium bis(trifluoromethanesulfonyl) amide | 685.10 | 664.80 | 20.30 | 2.96 |
| 1-Octylpyridinium bis(trifluoromethylsulfonyl)amide | 686.00 | 665.90 | 20.10 | 2.93 |
| 1-Ethyl-2-hexylpyridinium bis(trifluoromethanesulfonyl) amide | 685.50 | 667.10 | 18.40 | 2.68 |
| 1-Hexyl-3,5-dimethylpyridinium bis(trifluoromethylsulfonyl)amide | 620.00 | 667.80 | −47.80 | −7.71 |
| 1-(3,4,5,6-Perfluorohexyl)-3-methylimidazolium-3-methylimidazolium bis(trifluoromethanesulfonyl) amide | 725.00 | 678.60 | 46.40 | 6.40 |
| 4-Dimethylamino-1-hexylpyridinium bis(trifluoromethanesulfonyl) amide | 731.00 | 687.20 | 43.80 | 5.99 |
| N-Octyl-3-methylpyridinium bis(trifluoromethanesulfonyl) amide | 669.00 | 697.10 | −28.10 | −4.20 |
| 1-Ethyl-2-heptylpyridinium bis(trifluoromethanesulfonyl) amide | 717.50 | 697.40 | 20.10 | 2.80 |
| 1-Methyl-1-octylpyrrolidinium bis(trifluoromethanesulfonyl) amide | 716.30 | 699.40 | 16.90 | 2.36 |
| 1-Octyl-3-cyanopyridinium bis(trifluoromethylsulfonyl)amide | 709.00 | 700.10 | 8.90 | 1.26 |
| 1-Hexyl-3-methylimidazolium tris(pentafluoroethyl)trifluorophosphate | 730.00 | 710.60 | 19.40 | 2.66 |
| N-Hexyl-3-methyl-4-dimethylaminopyridinium bis(trifluoromethanesulfonyl) amide | 725.00 | 710.90 | 14.10 | 1.94 |
| Butyl 1-butylnicotinate bis(trifluoromethylsulfonyl)amide | 707.00 | 713.40 | −6.40 | −0.91 |
| Ethyl tri(butyl)phosphonium diethylphosphate | 711.00 | 723.00 | −12.00 | −1.69 |
| 1-Decyl-3-methylimidazolium bis(trifluoromethanesulfonyl) amide | 754.80 | 724.40 | 30.40 | 4.03 |
| 1-Ethyl-2-octylpyridinium bis(trifluoromethanesulfonyl) amide | 749.40 | 725.00 | 24.40 | 3.26 |
| 1-Ethyl-2-nonylpyridinium bis(trifluoromethanesulfonyl) amide | 778.50 | 751.40 | 27.10 | 3.48 |
| Tetrabutylphosphonium L-valinate | 747.00 | 753.40 | −6.40 | −0.86 |
| 1-Methyl-1-decylpyrrolidinium bis(trifluoromethanesulfonyl) amide | 778.90 | 760.20 | 18.70 | 2.40 |
| 1-Dodecyl-3-methylimidazolium bis(trifluoromethanesulfonyl) amide | 820.20 | 787.10 | 33.10 | 4.04 |
| 1-Ethyl-2-decylpyridinium bis(trifluoromethanesulfonyl) amide | 811.20 | 788.60 | 22.60 | 2.79 |
| 1-Hexyl-2-propyl-3,5-diethylpyridinium bis(trifluoromethylsulfonyl)amide | 766.00 | 809.50 | −43.50 | −5.68 |
| Trihexyl tetradecyl phosphonium acetate | 1078.20 | 1129.60 | −51.40 | −4.77 |
| Tetradecyl trihexylphosphonium bis(trifluoromethylsulfonyl)amide | 1298.80 | 1316.30 | −17.50 | −1.35 |
| Trihexyltetradecylphosphonium tris(pentafluoroethyl)trifluorophosphate | 1441.40 | 1435.80 | 5.60 | 0.39 |
| Trihexyltetradecylphosphonium bis(2,2,4-trimethylpentyl)phosphinate | 1635.00 | 1587.20 | 47.80 | 2.92 |
| Mean | 9.30 | 1.60 | ||
| Standard deviation | 24.49 | 5.14 |
| Molecule Name | Cp(liq,298) exp | Cp(liq,298) calc | Deviation | Dev. in % |
|---|---|---|---|---|
| Tetramethyoxysilane | 240.50 | 239.40 | 1.10 | 0.46 |
| Hexamethyldisiloxane | 309.09 | 300.80 | 8.29 | 2.68 |
| 2,4,6,8-Tetramethylcyclotetrasiloxane | 354.40 | 348.80 | 5.60 | 1.58 |
| Hexamethylcyclotrisiloxane | 360.00 | 350.90 | 9.10 | 2.53 |
| Tetraethoxysilane | 364.40 | 361.30 | 3.10 | 0.85 |
| Octamethyltrisiloxane | 420.64 | 416.20 | 4.44 | 1.06 |
| Octamethylcyclotetrasiloxane | 495.94 | 459.90 | 36.04 | 7.27 |
| 1,1,3,3-Tetraethyl-5,5-dimethylcyclotrisiloxane | 502.90 | 471.10 | 31.80 | 6.32 |
| Octamethyltetrasiloxane | 509.60 | 474.50 | 35.10 | 6.89 |
| Tetrapropoxysilane | 460.10 | 482.70 | −22.60 | −4.91 |
| 1,1,3,3-Tetramethyl-1,3-diphenyldisiloxane | 508.10 | 499.40 | 8.70 | 1.71 |
| 1,1,1,3,5,5,5-Heptamethyl-3-phenyltrisiloxane | 519.60 | 517.10 | 2.50 | 0.48 |
| Decamethyltetrasiloxane | 538.77 | 529.60 | 9.17 | 1.70 |
| Hexaethylcyclotrisiloxane | 535.10 | 531.60 | 3.50 | 0.65 |
| Decamethylcyclopentasiloxane | 634.63 | 574.20 | 60.43 | 9.52 |
| 1,1,1,5,5,5-Hexamethyl-3,3-diphenyltrisiloxane | 648.00 | 601.30 | 46.70 | 7.21 |
| Tetrabutoxysilane | 580.20 | 604.20 | −24.00 | −4.14 |
| 1,1-Diphenyl-3,3,5,5,7,7-hexamethylcyclotetrasiloxane | 633.00 | 664.30 | −31.30 | −4.94 |
| 1,1,3,3-Tetraethyl-5,5-diphenylcylotrisiloxane | 629.60 | 667.60 | −38.00 | −6.04 |
| Octaethylcyclotetrasiloxane | 746.00 | 695.50 | 50.50 | 6.77 |
| Tetraheptoxysilane | 909.40 | 968.50 | −59.10 | −6.50 |
| Tetraoctoxysilane | 1095.40 | 1089.90 | 5.50 | 0.50 |
| Tetradecoxysilane | 1373.50 | 1332.90 | 40.60 | 2.96 |
| Mean | 8.14 | 1.50 | ||
| Standard deviation | 30.22 | 4.69 |
| Molecule Name | Cp(liq,298) exp | Cp(liq,298) calc | Deviation | Dev. in % |
|---|---|---|---|---|
| Cyclopropane | 81.20 | 94.00 | −12.80 | −15.76 |
| Propylene | 102.00 | 96.40 | 5.60 | 5.49 |
| s-trans-1,3-Butadiene | 123.65 | 116.90 | 6.75 | 5.46 |
| 1,2-Butadiene | 123.00 | 117.30 | 5.70 | 4.63 |
| 1-Butyne | 132.60 | 118.90 | 13.70 | 10.33 |
| 2-Butyne | 124.30 | 119.10 | 5.20 | 4.18 |
| Cyclobutane | 106.30 | 120.40 | −14.10 | −13.26 |
| Cyclopentadiene | 115.30 | 122.50 | −7.20 | −6.24 |
| cis-2-Butene | 127.00 | 124.90 | 2.10 | 1.65 |
| Isobutylene | 121.30 | 126.00 | −4.70 | −3.87 |
| trans-2-Butene | 124.30 | 126.10 | −1.80 | −1.45 |
| 1-Butene | 128.96 | 126.80 | 2.16 | 1.67 |
| Cyclopentene | 122.38 | 135.30 | −12.92 | −10.56 |
| Butane | 140.90 | 136.90 | 4.00 | 2.84 |
| Methylenecyclobutane | 133.60 | 138.20 | −4.60 | −3.44 |
| Spiro[2.2]pentane | 134.52 | 142.60 | −8.08 | −6.01 |
| Isoprene | 151.08 | 145.20 | 5.88 | 3.89 |
| cis-1,3-Pentadiene | 146.57 | 146.20 | 0.37 | 0.25 |
| Benzene | 136.80 | 146.30 | −9.50 | −6.94 |
| 1,4-Pentadiene | 146.82 | 146.70 | 0.12 | 0.08 |
| 3-Methyl-1,2-butadiene | 152.42 | 146.90 | 5.52 | 3.62 |
| 2,3-Pentadiene | 152.34 | 147.00 | 5.34 | 3.51 |
| trans-1,3-Pentadiene | 149.33 | 147.00 | 2.33 | 1.56 |
| 1,2-Pentadiene | 150.83 | 147.70 | 3.13 | 2.08 |
| Cyclopentane | 128.80 | 148.50 | −19.70 | −15.30 |
| Trimethylethylene | 152.80 | 154.50 | −1.70 | −1.11 |
| Isopentene | 157.30 | 155.70 | 1.60 | 1.02 |
| cis-2-Pentene | 151.80 | 156.10 | −4.30 | −2.83 |
| 1,3-Cyclohexadiene | 141.30 | 156.30 | −15.00 | −10.62 |
| trans-2-Pentene | 157.00 | 156.40 | 0.60 | 0.38 |
| 3-Methyl-1-butene | 156.10 | 156.80 | −0.70 | −0.45 |
| 1-Pentene | 155.30 | 157.10 | −1.80 | −1.16 |
| 2,5-Norbornadiene | 161.20 | 157.50 | 3.70 | 2.30 |
| 1,4-Cyclohexadiene | 142.20 | 158.30 | −16.10 | −11.32 |
| 3-Methylcyclopentene | 152.30 | 165.40 | −13.10 | −8.60 |
| 1-Methylcyclopentene | 153.10 | 166.00 | −12.90 | −8.43 |
| Isopentane | 164.85 | 166.50 | −1.65 | −1.00 |
| 2,2-Dimethylpropane | 153.10 | 166.90 | −13.80 | −9.01 |
| Pentane | 167.19 | 167.20 | −0.01 | −0.01 |
| Cyclohexene | 152.90 | 167.40 | −14.50 | −9.48 |
| Quadricyclane | 157.60 | 168.10 | −10.50 | −6.66 |
| Methylbenzene | 158.70 | 176.60 | −17.90 | −11.28 |
| 1,5-Hexadiene | 133.10 | 177.20 | −44.10 | −33.13 |
| Cyclohexane | 158.10 | 177.30 | −19.20 | −12.14 |
| Methylcyclopentane | 158.70 | 178.40 | −19.70 | −12.41 |
| Tetramethylethene | 174.68 | 183.00 | −8.32 | −4.76 |
| cis-2-Hexene | 178.36 | 186.00 | −7.64 | −4.28 |
| 3,3-Dimethyl-1-butene | 188.30 | 186.50 | 1.80 | 0.96 |
| 1-Hexene | 183.30 | 187.50 | −4.20 | −2.29 |
| Ethynylbenzene | 180.10 | 188.20 | −8.10 | −4.50 |
| 1,3,5-Cycloheptatriene | 162.76 | 189.30 | −26.54 | −16.31 |
| Cyclooctatetraene | 185.18 | 194.20 | −9.02 | −4.87 |
| Norcarane | 187.90 | 194.80 | −6.90 | −3.67 |
| Styrene | 201.90 | 195.50 | 6.40 | 3.17 |
| Cycloheptene | 171.70 | 195.50 | −23.80 | −13.86 |
| Neohexane | 189.67 | 196.50 | −6.83 | −3.60 |
| 2,3-Dimethylbutane | 188.80 | 196.60 | −7.80 | −4.13 |
| 4-Methylcyclohexene | 180.42 | 196.60 | −16.18 | −8.97 |
| 1-Ethylcyclopentene | 188.30 | 196.90 | −8.60 | −4.57 |
| Methylenecyclohexane | 177.40 | 196.90 | −19.50 | −10.99 |
| Ethylidenecyclopentane | 181.20 | 197.00 | −15.80 | −8.72 |
| 3-Methylpentane | 190.83 | 197.20 | −6.37 | −3.34 |
| 2-Methylpentane | 193.96 | 197.40 | −3.44 | −1.77 |
| Hexane | 197.66 | 197.50 | 0.16 | 0.08 |
| Cycloheptane | 180.61 | 204.50 | −23.89 | −13.23 |
| Ethylbenzene | 185.78 | 205.70 | −19.92 | −10.72 |
| Bicyclo[2.2.2]oct-2-ene | 156.73 | 205.90 | −49.17 | −31.37 |
| 1,2-Dimethylbenzene | 187.65 | 206.10 | −18.45 | −9.83 |
| 1,3-Dimethylbenzene | 183.18 | 207.00 | −23.82 | −13.00 |
| 1,4-Dimethylbenzene | 183.65 | 207.10 | −23.45 | −12.77 |
| Indene | 186.94 | 207.10 | −20.16 | −10.78 |
| Methylcyclohexane | 184.96 | 207.50 | −22.54 | −12.19 |
| cis-1,2-Dimethylcyclopentane | 190.80 | 207.80 | −17.00 | −8.91 |
| Ethylcyclopentane | 187.40 | 208.20 | −20.80 | −11.10 |
| trans-1,3-Dimethylcyclopentane | 190.80 | 208.50 | −17.70 | −9.28 |
| 1,1-Dimethylcyclopentane | 187.40 | 208.70 | −21.30 | −11.37 |
| 1,5-Cyclooctadiene | 208.10 | 209.10 | −1.00 | −0.48 |
| Indane | 190.25 | 215.80 | −25.55 | −13.43 |
| 1-Heptene | 211.79 | 217.80 | −6.01 | −2.84 |
| endo-2-Methylnorbornane | 184.30 | 218.90 | −34.60 | −18.77 |
| exo-2-Methylnorbornane | 185.80 | 219.30 | −33.50 | −18.03 |
| trans-Bicyclo[3.3.0]octane | 180.30 | 220.30 | −40.00 | −22.19 |
| cis-Bicyclo[3.3.0]octane | 213.40 | 220.30 | −6.90 | −3.23 |
| cis-Bicyclo[4,2,0]octane | 258.60 | 221.20 | 37.40 | 14.46 |
| cis- Cyclooctene | 207.80 | 222.90 | −15.10 | −7.27 |
| Naphthalene | 196.06 | 224.70 | −28.64 | −14.61 |
| alpha-Methylstyrene | 202.10 | 224.70 | −22.60 | −11.18 |
| Ethylidenecyclohexane | 203.80 | 225.40 | −21.60 | −10.60 |
| Triptane | 213.51 | 225.90 | −12.39 | −5.80 |
| 3,3-Dimethylpentane | 214.80 | 226.40 | −11.60 | −5.40 |
| 2,2-Dimethylpentane | 221.12 | 226.80 | −5.68 | −2.57 |
| 3-Ethylpentane | 219.58 | 227.00 | −7.42 | −3.38 |
| 2,3-Dimethylpentane | 218.30 | 227.20 | −8.90 | −4.08 |
| 2,4-Dimethylpentane | 224.22 | 227.40 | −3.18 | −1.42 |
| Heptane | 225.33 | 227.80 | −2.47 | −1.10 |
| 2-Methylhexane | 222.92 | 227.90 | −4.98 | −2.23 |
| Allylcyclopentane | 202.90 | 228.40 | −25.50 | −12.57 |
| Hemimellitene | 216.44 | 233.90 | −17.46 | −8.07 |
| 1,2,4-Trimethylbenzene | 213.11 | 234.50 | −21.39 | −10.04 |
| Isocumene | 214.72 | 235.10 | −20.38 | −9.49 |
| Cumene | 215.40 | 235.10 | −19.70 | −9.15 |
| 1,1-Dimethylcyclohexane | 209.24 | 236.50 | −27.26 | −13.03 |
| cis-1,4-Dimethylcyclohexane | 212.09 | 236.70 | −24.61 | −11.60 |
| trans-1,3-Dimethylcyclohexane | 212.84 | 236.70 | −23.86 | −11.21 |
| trans-1,2-Dimethylcyclohexane | 209.41 | 237.30 | −27.89 | −13.32 |
| 1,3,5-Trimethylbenzene | 207.85 | 237.50 | −29.65 | −14.27 |
| Ethylcyclohexane | 211.79 | 237.60 | −25.81 | −12.19 |
| Cyclooctane | 215.53 | 237.70 | −22.17 | −10.29 |
| Diisobutylene | 240.20 | 237.80 | 2.40 | 1.00 |
| trans-1,4-Dimethylcyclohexane | 210.25 | 238.00 | −27.75 | −13.20 |
| cis-1,3-Dimethylcyclohexane | 209.37 | 238.10 | −28.73 | −13.72 |
| Propylcyclopentane | 216.27 | 238.50 | −22.23 | −10.28 |
| 1-Octyne | 242.14 | 240.40 | 1.74 | 0.72 |
| 4-Octyne | 233.60 | 240.60 | −7.00 | −3.00 |
| 1,2,3,4-Tetrahydronaphthalene | 217.44 | 246.50 | −29.06 | −13.36 |
| trans-2-Octene | 239.30 | 247.50 | −8.20 | −3.43 |
| Caprylene | 241.21 | 248.20 | −6.99 | −2.90 |
| cis-Hydrindan | 214.18 | 249.20 | −35.02 | −16.35 |
| trans-Hydrindan | 209.70 | 249.50 | −39.80 | −18.98 |
| cis-Bicyclo[6.1.0]nonane | 235.10 | 252.90 | −17.80 | −7.57 |
| 1-Methylnaphthalene | 224.39 | 253.90 | −29.51 | −13.15 |
| 2-Methylnaphthalene | 228.00 | 254.50 | −26.50 | −11.62 |
| Isooctane | 242.49 | 254.50 | −12.01 | −4.95 |
| 2,3,4-Trimethylpentane | 247.32 | 255.10 | −7.78 | −3.15 |
| 2,3,3-Trimethylpentane | 245.56 | 256.30 | −10.74 | −4.37 |
| 3,3-Dimethylhexane | 246.60 | 256.60 | −10.00 | −4.06 |
| 2,2,3-Trimethylpentane | 245.60 | 256.70 | −11.10 | −4.52 |
| 3-Methylheptane | 250.20 | 257.00 | −6.80 | −2.72 |
| 2,5-Dimethylhexane | 249.20 | 257.00 | −7.80 | −3.13 |
| 2-Methylheptane | 252.00 | 257.10 | −5.10 | −2.02 |
| Allylcyclohexane | 233.50 | 257.40 | −23.90 | −10.24 |
| 4-Methylheptane | 251.08 | 258.10 | −7.02 | −2.80 |
| Octane | 255.68 | 258.20 | −2.52 | −0.99 |
| Tetrahydrodicyclopentadiene | 236.50 | 261.10 | −24.60 | −10.40 |
| Prehnitene | 244.30 | 262.50 | −18.20 | −7.45 |
| t-Butylbenzene | 241.59 | 264.90 | −23.31 | −9.65 |
| p-Cymene | 242.30 | 264.90 | −22.60 | −9.33 |
| Butylbenzene | 243.50 | 265.50 | −22.00 | −9.03 |
| 1,2,4,5-Tetramethylbenzene | 220.10 | 266.60 | −46.50 | −21.13 |
| Propylcyclohexane | 242.04 | 267.90 | −25.86 | −10.68 |
| Butylcyclopentane | 245.35 | 268.80 | −23.45 | −9.56 |
| 3-Carene | 254.26 | 271.40 | −17.14 | −6.74 |
| Biphenyl | 259.54 | 273.40 | −13.86 | −5.34 |
| 4,7-Dimethylindane | 241.50 | 275.30 | −33.80 | −14.00 |
| 1,1-Dimethylindane | 249.40 | 275.50 | −26.10 | −10.47 |
| 4,6-Dimethylindane | 240.90 | 275.60 | −34.70 | −14.40 |
| Dihydropinene | 251.26 | 277.10 | −25.84 | −10.28 |
| trans-Decalin | 229.17 | 278.60 | −49.43 | −21.57 |
| 1-Nonene | 270.36 | 278.60 | −8.24 | −3.05 |
| Bicyclopentyl | 238.90 | 279.20 | −40.30 | −16.87 |
| Tetraethylmethane | 278.20 | 281.40 | −3.20 | −1.15 |
| 2,2,4,4-Tetramethylpentane | 266.30 | 283.10 | −16.80 | −6.31 |
| 2,7-Dimethylnaphthalene | 251.85 | 284.20 | −32.35 | −12.84 |
| 2,2,3,3-Tetramethylpentane | 271.50 | 285.40 | −13.90 | −5.12 |
| 1-Methyl-4-isopropylcyclohexene | 257.80 | 286.00 | −28.20 | −10.94 |
| Nonane | 284.43 | 288.40 | −3.97 | −1.40 |
| Neopentylbenzene | 271.90 | 295.10 | −23.20 | −8.53 |
| t-Butylcyclohexane | 264.80 | 295.60 | −30.80 | −11.63 |
| Butylcyclohexane | 271.04 | 298.30 | −27.26 | −10.06 |
| Diphenylmethane | 266.10 | 304.80 | −38.70 | −14.54 |
| 2-Phenyltoluene | 275.77 | 304.80 | −29.03 | −10.53 |
| 1-Decene | 300.83 | 308.90 | −8.07 | −2.68 |
| 5-Methylnonane | 314.43 | 317.00 | −2.57 | −0.82 |
| 1-Ethyladamantane | 258.45 | 317.70 | −59.25 | −22.93 |
| 4-Methylnonane | 317.36 | 317.70 | −0.34 | −0.11 |
| 3-Methylnonane | 308.99 | 317.70 | −8.71 | −2.82 |
| Tolan | 297.50 | 318.30 | −20.80 | −6.99 |
| 2-Methylnonane | 313.30 | 318.40 | −5.10 | −1.63 |
| 1,3-Dimethyladamantane | 258.31 | 318.80 | −60.49 | −23.42 |
| Decane | 316.32 | 318.80 | −2.48 | −0.78 |
| cis,trans,trans-1,5,9-Cyclododecatriene | 287.76 | 319.10 | −31.34 | −10.89 |
| Hexamethylbenzene | 370.70 | 322.00 | 48.70 | 13.14 |
| 1,1-Diphenylethylene | 299.20 | 323.20 | −24.00 | −8.02 |
| trans-Stilbene | 343.10 | 323.40 | 19.70 | 5.74 |
| 1,2,3,4-Tetrahydrophenanthrene | 278.26 | 324.00 | −45.74 | −16.44 |
| 1,1,4,7-Tetramethylindane | 302.50 | 331.20 | −28.70 | −9.49 |
| 2-Ethylbiphenyl | 302.73 | 331.50 | −28.77 | −9.50 |
| 1,2-Diphenylethane | 320.10 | 333.10 | −13.00 | −4.06 |
| 3,3′-Bitolyl | 295.45 | 333.20 | −37.75 | −12.78 |
| 2-Methyldiphenylmethane | 296.58 | 334.00 | −37.42 | −12.62 |
| 2,2′-Dimethylbiphenyl | 298.06 | 334.00 | −35.94 | −12.06 |
| 1,1-Diphenylethane | 295.00 | 334.30 | −39.30 | −13.32 |
| 2,3-Dihydro-1,1,4,6-tetramethyl-1H-indene | 299.60 | 335.60 | −36.00 | −12.02 |
| Bicyclohexyl | 283.00 | 337.80 | −54.80 | −19.36 |
| 1-Undecene | 329.95 | 339.30 | −9.35 | −2.83 |
| 2-Methyldecane | 341.21 | 348.80 | −7.59 | −2.22 |
| Undecane | 345.05 | 349.10 | −4.05 | −1.17 |
| 4-Isopropylbiphenyl | 343.90 | 363.30 | −19.40 | −5.64 |
| 1-Dodecene | 360.66 | 369.70 | −9.04 | −2.51 |
| 2,2,4,6,6-Pentamethylheptane | 350.98 | 372.20 | −21.22 | −6.05 |
| Dodecane | 376.10 | 379.40 | −3.30 | −0.88 |
| 1,4-Di-t-butylbenzene | 347.84 | 383.10 | −35.26 | −10.14 |
| Heptylcyclohexane | 363.20 | 389.40 | −26.20 | −7.21 |
| 4-t-Butylbiphenyl | 383.60 | 391.40 | −7.80 | −2.03 |
| 1-Tridecene | 391.80 | 400.00 | −8.20 | −2.09 |
| m-Terphenyl | 417.10 | 401.60 | 15.50 | 3.72 |
| o-Terphenyl | 369.05 | 402.10 | −33.05 | −8.96 |
| Tridecane | 407.10 | 410.40 | −3.30 | −0.81 |
| Tetradecane | 438.90 | 440.00 | −1.10 | −0.25 |
| Decylcyclopentane | 426.52 | 450.20 | −23.68 | −5.55 |
| Pentadecane | 469.90 | 470.30 | −0.40 | −0.09 |
| Decylcyclohexane | 455.60 | 479.70 | −24.10 | −5.29 |
| 2,2,4,4,6,8,8-Heptamethylnonane | 458.80 | 488.00 | −29.20 | −6.36 |
| Cetene | 485.83 | 491.10 | −5.27 | −1.08 |
| Cetane | 501.61 | 500.60 | 1.01 | 0.20 |
| Hexaethylcyclohexane | 530.10 | 528.10 | 2.00 | 0.38 |
| Heptadecane | 534.34 | 531.00 | 3.34 | 0.63 |
| Octadecane | 564.40 | 561.30 | 3.10 | 0.55 |
| Pristane | 569.76 | 586.20 | −16.44 | −2.89 |
| Nonadecane | 604.00 | 591.60 | 12.40 | 2.05 |
| Eicosane | 663.60 | 622.90 | 40.70 | 6.13 |
| 1,1-Diphenyldodecane | 593.70 | 636.60 | −42.90 | −7.23 |
| 1-Phenyl-1-cyclohexyldodecane | 611.10 | 669.70 | −58.60 | −9.59 |
| Docosane | 698.00 | 683.70 | 14.30 | 2.05 |
| 4′-Heptyl-p-tercyclohexyl | 752.70 | 709.60 | 43.10 | 5.73 |
| 4′-Heptyl-m-tercyclohexyl | 668.60 | 709.60 | −41.00 | −6.13 |
| Pentacosane | 769.00 | 774.80 | −5.80 | −0.75 |
| 11-Cyclohexyleicosane | 787.40 | 781.00 | 6.40 | 0.81 |
| Heptacosane | 828.40 | 835.50 | −7.10 | −0.86 |
| Dodecahydrosqualene | 886.36 | 915.70 | −29.34 | −3.31 |
| 11-Decylheneicosane | 949.80 | 953.90 | −4.10 | −0.43 |
| Unatriacontane | 912.10 | 956.90 | −44.80 | −4.91 |
| Mean | −14.38 | −6.34 | ||
| Standard deviation | 22.10 | 9.42 |
| Molecule Name | Vm | Cp(liq,298) exp | Cp(liq,298) calc | Deviation | Dev. in % |
|---|---|---|---|---|---|
| Methanol | 36.90 | 81.92 | 94.46 | −12.54 | −15.31 |
| Formic acid | 39.90 | 99.04 | 100.25 | −1.21 | −1.22 |
| Ethanol | 53.60 | 115.90 | 126.66 | −10.76 | −9.28 |
| Acetic acid | 56.70 | 123.10 | 132.64 | −9.54 | −7.75 |
| Allyl alcohol | 65.10 | 146.30 | 148.84 | −2.54 | −1.74 |
| Colamine | 65.60 | 137.70 | 149.80 | −12.10 | −8.79 |
| Acrylic acid | 67.40 | 144.20 | 153.27 | −9.07 | −6.29 |
| 1-Propanol | 70.30 | 146.88 | 158.86 | −11.98 | −8.16 |
| 2-Propanol | 70.30 | 154.43 | 158.86 | −4.43 | −2.87 |
| Chloroacetic acid | 70.40 | 179.90 | 159.06 | 20.84 | 11.58 |
| Propanoic acid | 73.30 | 158.60 | 164.65 | −6.05 | −3.81 |
| Cyclobutanol | 78.10 | 153.70 | 173.90 | −20.20 | −13.14 |
| Methyl cellosolve | 80.10 | 176.40 | 177.76 | −1.36 | −0.77 |
| Hydroxymethyl acetate | 82.40 | 214.00 | 182.19 | 31.81 | 14.86 |
| Methacrylic acid | 84.00 | 161.10 | 185.28 | −24.18 | −15.01 |
| Dichloroacetic acid | 84.50 | 188.00 | 186.24 | 1.76 | 0.94 |
| 2-Methyl-1-propanol | 86.50 | 181.05 | 190.10 | −9.05 | −5.00 |
| 2-Butanol | 86.50 | 196.67 | 190.10 | 6.57 | 3.34 |
| 2-Methyl-2-propanol | 86.80 | 218.60 | 190.68 | 27.92 | 12.77 |
| 1-Butanol | 87.00 | 177.16 | 191.06 | −13.90 | −7.85 |
| 2-Methylpropanoic acid | 89.80 | 181.70 | 196.46 | −14.76 | −8.12 |
| Furfuranol | 89.80 | 204.01 | 196.46 | 7.55 | 3.70 |
| Butanoic acid | 89.90 | 177.70 | 196.66 | −18.96 | −10.67 |
| Phenol | 92.30 | 200.00 | 201.28 | −1.28 | −0.64 |
| Cyclopentanol | 93.40 | 185.40 | 203.40 | −18.00 | −9.71 |
| 2-Ethoxyethanol | 96.90 | 210.30 | 210.15 | 0.15 | 0.07 |
| Dimethylvinylcarbinol | 97.80 | 208.40 | 211.89 | −3.49 | −1.67 |
| Acetylacetone (enol form) | 98.60 | 208.40 | 213.43 | −5.03 | −2.41 |
| Cellosolve acetate | 98.70 | 203.00 | 213.62 | −10.62 | −5.23 |
| 2-Aminoisobutanol | 98.70 | 229.50 | 213.62 | 15.88 | 6.92 |
| 2-(Ethylamino)ethanol | 99.40 | 227.00 | 214.97 | 12.03 | 5.30 |
| Tetrahydrofurfuryl alcohol | 102.40 | 190.00 | 220.76 | −30.76 | −16.19 |
| 2-Methyl-2-butanol | 102.90 | 247.30 | 221.72 | 25.58 | 10.34 |
| Isopentyl alcohol | 103.00 | 209.60 | 221.91 | −12.31 | −5.87 |
| 3-Methyl-2-butanol | 103.10 | 245.90 | 222.11 | 23.79 | 9.67 |
| Neopentyl alcohol | 103.50 | 244.30 | 222.88 | 21.42 | 8.77 |
| 1-Pentanol | 103.60 | 208.14 | 223.07 | −14.93 | −7.17 |
| 3-Pentanol | 103.80 | 239.70 | 223.46 | 16.24 | 6.78 |
| 3-Methylbutanoic acid | 106.20 | 197.10 | 228.08 | −30.98 | −15.72 |
| Pentanoic acid | 106.60 | 210.00 | 228.86 | −18.86 | −8.98 |
| o-Cresol | 108.50 | 229.75 | 232.52 | −2.77 | −1.21 |
| Benzyl alcohol | 108.60 | 215.90 | 232.71 | −16.81 | −7.79 |
| p-Cresol | 108.80 | 221.03 | 233.10 | −12.07 | −5.46 |
| m-Cresol | 109.00 | 224.93 | 233.48 | −8.55 | −3.80 |
| Cyclohexanol | 109.50 | 213.40 | 234.45 | −21.05 | −9.86 |
| 2-Hydroxybenzaldehyde | 109.90 | 222.00 | 235.22 | −13.22 | −5.95 |
| 2-Isopropoxyethanol | 113.20 | 238.80 | 241.58 | −2.78 | −1.16 |
| 2-Propoxyethanol | 113.60 | 241.60 | 242.35 | −0.75 | −0.31 |
| cis-3-Hexen-1-ol | 114.30 | 234.00 | 243.70 | −9.70 | −4.15 |
| trans-3-Hexen-1-ol | 114.60 | 237.20 | 244.28 | −7.08 | −2.98 |
| 1-Hexen-3-ol | 114.60 | 269.30 | 244.28 | 25.02 | 9.29 |
| 2-(Isopropylamino)ethanol | 115.50 | 258.82 | 246.02 | 12.80 | 4.95 |
| Ethyl lactate | 115.80 | 254.00 | 246.60 | 7.40 | 2.91 |
| 2-Methoxyphenol | 118.10 | 240.00 | 251.03 | −11.03 | −4.60 |
| Tetrahydro-2H-pyran-2-methanol | 119.00 | 222.00 | 252.77 | −30.77 | −13.86 |
| 2-Ethyl-1-butanol | 119.30 | 246.65 | 253.34 | −6.69 | −2.71 |
| 3-Methyl-3-pentanol | 119.40 | 293.30 | 253.54 | 39.76 | 13.56 |
| 3,3-Dimethyl-1-butanol | 119.60 | 236.08 | 253.92 | −17.84 | −7.56 |
| 4-Methyl-2-pentanol | 119.70 | 272.34 | 254.12 | 18.22 | 6.69 |
| 3-Methyl-2-pentanol | 119.70 | 275.89 | 254.12 | 21.77 | 7.89 |
| 3-Hexanol | 119.90 | 269.27 | 254.50 | 14.77 | 5.49 |
| 2-Methyl-2-pentanol | 120.00 | 289.03 | 254.69 | 34.34 | 11.88 |
| 2-Methyl-1-pentanol | 120.10 | 248.40 | 254.89 | −6.49 | −2.61 |
| 4-Hydroxy-4-methyl-2-pentanone | 120.50 | 221.30 | 255.66 | −34.36 | −15.53 |
| 1-Hexanol | 120.60 | 242.70 | 255.85 | −13.15 | −5.42 |
| 2-Hexanol | 120.60 | 256.31 | 255.85 | 0.46 | 0.18 |
| n-Hexanoic acid | 123.30 | 225.10 | 261.06 | −35.96 | −15.98 |
| s-Phenethyl alcohol | 124.20 | 257.45 | 262.79 | −5.34 | −2.07 |
| Phenethyl alcohol | 124.50 | 252.64 | 263.37 | −10.73 | −4.25 |
| Cyclohexanemethanol | 125.30 | 236.50 | 264.91 | −28.41 | −12.01 |
| cis-2-Methylcyclohexanol | 125.30 | 268.95 | 264.91 | 4.04 | 1.50 |
| 1-Methylcyclohexanol | 125.30 | 279.05 | 264.91 | 14.14 | 5.07 |
| Cycloheptanol | 125.50 | 250.22 | 265.30 | −15.08 | −6.03 |
| trans-2-Methylcyclohexanol | 126.10 | 262.98 | 266.46 | −3.48 | −1.32 |
| 2,4-Dibromophenol | 129.10 | 259.40 | 272.24 | −12.84 | −4.95 |
| 2-t-Butoxyethanol | 129.40 | 273.45 | 272.82 | 0.63 | 0.23 |
| Butylcellosolve | 130.20 | 271.66 | 274.36 | −2.70 | −0.99 |
| 2-Diethylaminoethanol | 130.80 | 281.20 | 275.52 | 5.68 | 2.02 |
| 2-Phenoxyethanol | 134.80 | 294.63 | 283.23 | 11.40 | 3.87 |
| 1-Naphthol | 135.40 | 284.50 | 284.39 | 0.11 | 0.04 |
| Triethylmethanol | 135.50 | 353.90 | 284.58 | 69.32 | 19.59 |
| 2,4-Dimethyl-3-pentanol | 135.90 | 312.00 | 285.35 | 26.65 | 8.54 |
| 2,2-Dimethyl-3-pentanol | 135.90 | 349.00 | 285.35 | 63.65 | 18.24 |
| 2-Methyl-2-hexanol | 136.70 | 313.54 | 286.89 | 26.65 | 8.50 |
| 2-Methyl-3-hexanol | 136.70 | 324.00 | 286.89 | 37.11 | 11.45 |
| 5-Methyl-2-hexanol | 136.80 | 295.20 | 287.09 | 8.11 | 2.75 |
| 2-Heptanol | 137.20 | 298.63 | 287.86 | 10.77 | 3.61 |
| 4-Heptanol | 137.20 | 306.77 | 287.86 | 18.91 | 6.16 |
| 3-Heptanol | 137.20 | 314.20 | 287.86 | 26.34 | 8.38 |
| 1-Heptanol | 137.30 | 274.81 | 288.05 | −13.24 | −4.82 |
| Enanthic acid | 139.80 | 267.31 | 292.87 | −25.56 | −9.56 |
| Hydrocinnamyl alcohol | 141.10 | 280.74 | 295.38 | −14.64 | −5.21 |
| Cyclohexaneethanol | 142.50 | 266.00 | 298.08 | −32.08 | −12.06 |
| 2-Hydroxyethyl-2′,2′-dimethylpropionate | 148.90 | 308.00 | 310.42 | −2.42 | −0.79 |
| 4-Ethyl-3-hexanol | 152.20 | 361.30 | 316.78 | 44.52 | 12.32 |
| Ethyl salicylate | 152.70 | 283.07 | 317.75 | −34.68 | −12.25 |
| 4-Methyl-2-heptanol | 152.70 | 312.50 | 317.75 | −5.25 | −1.68 |
| 3-Methyl-2-heptanol | 152.80 | 297.50 | 317.94 | −20.44 | −6.87 |
| 4-Methyl-3-heptanol | 152.80 | 309.20 | 317.94 | −8.74 | −2.83 |
| 3-Methyl-4-heptanol | 152.80 | 355.80 | 317.94 | 37.86 | 10.64 |
| 2,5-Dimethyl-3-hexanol | 152.90 | 339.40 | 318.13 | 21.27 | 6.27 |
| 2-Ethyl-1-hexanol | 153.00 | 317.50 | 318.32 | −0.82 | −0.26 |
| 4-Methyl-4-heptanol | 153.00 | 366.90 | 318.32 | 48.58 | 13.24 |
| 5-Methyl-2-heptanol | 153.10 | 296.20 | 318.52 | −22.32 | −7.54 |
| 2-Methyl-4-heptanol | 153.10 | 331.80 | 318.52 | 13.28 | 4.00 |
| 5-Methyl-1-heptanol | 153.20 | 304.20 | 318.71 | −14.51 | −4.77 |
| 6-Methyl-3-heptanol | 153.40 | 310.50 | 319.10 | −8.60 | −2.77 |
| 2-Methyl-2-heptanol | 153.40 | 337.60 | 319.10 | 18.50 | 5.48 |
| 2-Methyl-1-heptanol | 153.50 | 313.00 | 319.29 | −6.29 | −2.01 |
| 6-Methyl-2-heptanol | 153.50 | 315.10 | 319.29 | −4.19 | −1.33 |
| 1-Octanol | 153.70 | 312.10 | 319.67 | −7.57 | −2.43 |
| 4-Octanol | 153.90 | 332.09 | 320.06 | 12.03 | 3.62 |
| 3-Octanol | 153.90 | 338.50 | 320.06 | 18.44 | 5.45 |
| 2-Octanol | 154.00 | 330.10 | 320.25 | 9.85 | 2.98 |
| N-Methyl-2-hydroxyethylammonium propionate | 154.40 | 328.00 | 321.02 | 6.98 | 2.13 |
| n-Octanoic acid | 156.60 | 304.00 | 325.27 | −21.27 | −7.00 |
| Cyclohexanepropanol | 159.20 | 293.00 | 330.28 | −37.28 | −12.72 |
| 4-Allyl-2-methoxyphenol | 161.80 | 343.10 | 335.29 | 7.81 | 2.28 |
| 2-(2-(2-Methoxyethoxy)ethoxy)ethanol | 166.10 | 357.05 | 343.58 | 13.47 | 3.77 |
| 1-Ethyl-3-methylimidazolium hydrogen sulfate | 169.60 | 295.50 | 350.33 | −54.83 | −18.55 |
| 3,7-Dimethyl-6-octen-1-yn-3-ol | 170.00 | 385.30 | 351.10 | 34.20 | 8.88 |
| 4-Nonanol | 170.60 | 367.86 | 352.26 | 15.60 | 4.24 |
| 5-Nonanol | 170.60 | 370.75 | 352.26 | 18.49 | 4.99 |
| 3-Nonanol | 170.60 | 373.63 | 352.26 | 21.37 | 5.72 |
| 1-Nonanol | 170.70 | 341.00 | 352.45 | −11.45 | −3.36 |
| 2-Nonanol | 170.70 | 356.32 | 352.45 | 3.87 | 1.09 |
| N-Methyl-2-hydroxyethylammonium butanoate | 171.10 | 361.00 | 353.22 | 7.78 | 2.16 |
| trans-Geraniol | 172.60 | 346.10 | 356.12 | −10.02 | −2.90 |
| Pelargonic acid | 173.20 | 362.37 | 357.27 | 5.10 | 1.41 |
| Diethyleneglycol monobutyl ether | 173.30 | 354.89 | 357.47 | −2.58 | −0.73 |
| Linalool | 174.20 | 372.40 | 359.20 | 13.20 | 3.54 |
| beta-Citronellol | 179.30 | 357.90 | 369.04 | −11.14 | −3.11 |
| 1-Ethyl-3-methylimidazolium methylphosphonate | 183.60 | 354.64 | 377.33 | −22.69 | −6.40 |
| 4-Propyl-4-heptanol | 185.70 | 446.60 | 381.38 | 65.22 | 14.60 |
| 3,7-Dimethyl-1-octanol | 186.10 | 367.21 | 382.15 | −14.94 | −4.07 |
| n-Decyl alcohol | 187.00 | 377.00 | 383.88 | −6.88 | −1.82 |
| 5-Decanol | 187.30 | 405.77 | 384.46 | 21.31 | 5.25 |
| N-Methyl-2-hydroxyethylammonium pentanoate | 187.80 | 401.00 | 385.43 | 15.57 | 3.88 |
| n-Decanoic acid | 189.90 | 361.10 | 389.48 | −28.38 | −7.86 |
| 2-(2′-Hydroxyethoxy)ethyl pivalate | 191.90 | 368.83 | 393.33 | −24.50 | −6.64 |
| 1-(2-Hydroxyethyl)-3-methyl-1H-imidazolium 2,2,2-trifluoroacetate | 192.20 | 369.00 | 393.91 | −24.91 | −6.75 |
| 1-Undecanol | 204.10 | 406.34 | 416.86 | −10.52 | −2.59 |
| n-Undecanoic acid | 206.50 | 415.10 | 421.48 | −6.38 | −1.54 |
| 1-Dodecanol | 220.80 | 438.42 | 449.06 | −10.64 | −2.43 |
| 1H,1H-Perfluorooctan-1-ol | 222.70 | 468.60 | 452.72 | 15.88 | 3.39 |
| Lauric acid | 223.20 | 404.28 | 453.68 | −49.40 | −12.22 |
| Tributylmethanol | 235.70 | 548.60 | 477.79 | 70.81 | 12.91 |
| 1-Tridecanol | 237.50 | 476.00 | 481.26 | −5.26 | −1.11 |
| 1H,1H-Perfluorononan-1-ol | 250.30 | 515.90 | 505.94 | 9.96 | 1.93 |
| Pentaethylene glycol monomethyl ether | 252.10 | 537.12 | 509.41 | 27.71 | 5.16 |
| Myristyl alcohol | 254.20 | 505.80 | 513.46 | −7.66 | −1.51 |
| 3,7,11-Trimethyl-1-dodecen-3-ol | 262.20 | 574.50 | 528.88 | 45.62 | 7.94 |
| 1-Pentadecanol | 270.90 | 535.10 | 545.66 | −10.56 | −1.97 |
| 1H,1H-Perfluorodecan-1-ol | 274.50 | 563.90 | 552.60 | 11.30 | 2.00 |
| 1-Hexadecanol | 287.60 | 523.80 | 577.86 | −54.06 | −10.32 |
| 1H,1H-Perfluoroundecan-1-ol | 302.10 | 602.40 | 605.82 | −3.42 | −0.57 |
| (9Z)-Octadecenoic acid | 317.00 | 577.00 | 634.55 | −57.55 | −9.97 |
| 1H,1H-Perfluorododecan-1-ol | 328.00 | 645.20 | 655.76 | −10.56 | −1.64 |
| Methyltributylammonium serinate | 331.10 | 635.00 | 661.74 | −26.74 | −4.21 |
| 3,7,11,15-Tetramethyl-1-hexadecyn-3-ol | 340.80 | 712.50 | 680.44 | 32.06 | 4.50 |
| Isophytol | 344.10 | 729.70 | 686.80 | 42.90 | 5.88 |
| Heptylpentaoxyethylene | 352.40 | 722.90 | 702.81 | 20.09 | 2.78 |
| 1H,1H-Perfluorotetradecan-1-ol | 379.80 | 725.30 | 755.64 | −30.34 | −4.18 |
| Tetrabutylphosphonium L-serinate | 389.50 | 748.00 | 774.34 | −26.34 | −3.52 |
| Molecule Name | Vm | Cp(liq,298) exp | Cp(liq,298) calc | Deviation | Dev. in % |
|---|---|---|---|---|---|
| Ethan-1,2-diol | 62.7 | 149.80 | 151.62 | −1.82 | −1.21 |
| 1,2-Propanediol | 79.4 | 180.30 | 185.73 | −5.43 | −3.01 |
| Propan-1,3-diol | 79.4 | 175.78 | 185.73 | −9.95 | −5.66 |
| DL-Lactic acid | 81.8 | 210.50 | 190.63 | 19.87 | 9.44 |
| Lactic acid | 81.8 | 210.50 | 190.63 | 19.87 | 9.44 |
| 1,2,3-Propanetriol | 88.2 | 218.90 | 203.70 | 15.20 | 6.94 |
| 2,3-Butyleneglycol | 96.0 | 213.00 | 219.63 | −6.63 | −3.11 |
| 1,2-Butanediol | 96.0 | 230.82 | 219.63 | 11.19 | 4.85 |
| 1,3-Butyleneglycol | 96.1 | 218.89 | 219.83 | −0.94 | −0.43 |
| Tetramethylene glycol | 96.1 | 203.79 | 219.83 | −16.04 | −7.87 |
| Butanedioic acid | 100.9 | 238.60 | 229.64 | 8.96 | 3.76 |
| Diethyleneglycol | 105.8 | 243.90 | 239.64 | 4.26 | 1.75 |
| 1,5-Pentanediol | 112.8 | 232.49 | 253.94 | −21.45 | −9.23 |
| Pentanedioic acid | 117.6 | 270.50 | 263.74 | 6.76 | 2.50 |
| Hexyleneglycol | 126.6 | 263.10 | 282.12 | −19.02 | −7.23 |
| 1,2-Hexanediol | 129.4 | 293.10 | 287.84 | 5.26 | 1.79 |
| Dipropylene glycol | 138.8 | 322.10 | 307.04 | 15.06 | 4.68 |
| 1,7-Heptanediol | 146.2 | 297.00 | 322.15 | −25.15 | −8.47 |
| Triethyleneglycol | 148.8 | 327.60 | 327.46 | 0.14 | 0.04 |
| Heptanedioic acid | 151.0 | 334.30 | 331.95 | 2.35 | 0.70 |
| Octanedioic acid | 167.2 | 366.20 | 365.03 | 1.17 | 0.32 |
| Nonanedioic acid | 184.4 | 398.10 | 400.16 | −2.06 | −0.52 |
| Tetraglycol | 191.8 | 428.90 | 415.27 | 13.63 | 3.18 |
| Decanedioic acid | 201.1 | 430.00 | 434.27 | −4.27 | −0.99 |
| Tripropylene glycol | 214.3 | 440.60 | 461.22 | −20.62 | −4.68 |
| Undecanedioic acid | 217.8 | 461.90 | 468.37 | −6.47 | −1.40 |
| Dodecanedioic acid | 234.5 | 493.80 | 502.48 | −8.68 | −1.76 |
| Pentaglycol | 234.8 | 515.50 | 503.09 | 12.41 | 2.41 |
| 1,13-Tridecanedioic acid | 251.2 | 525.70 | 536.58 | −10.88 | −2.07 |
| Tetrapropylene glycol | 255.3 | 559.80 | 544.95 | 14.85 | 2.65 |
| 1,14-Tetradecanedioic acid | 267.9 | 557.60 | 570.68 | −13.08 | −2.35 |
| Hexaethylene glycol | 277.8 | 620.10 | 590.90 | 29.20 | 4.71 |
| Hexadecanedioic acid | 301.3 | 621.40 | 638.89 | −17.49 | −2.81 |
| Pentapropylene glycol | 312.4 | 685.80 | 661.56 | 24.24 | 3.53 |
| Ricinelaidic acid | 325.8 | 646.00 | 688.93 | −42.93 | −6.65 |
| Hexapropylene glycol | 369.9 | 807.50 | 778.99 | 28.51 | 3.53 |
| Molecules Class | N | Corr. coeff. R2 | σ (J/mol/K) | Intercept | Slope |
|---|---|---|---|---|---|
| OH-free compounds | 1102 | 0.9890 | 20.70 | −5.3055 | 1.8183 |
| All alcohols/acids | 201 | 0.9724 | 23.24 | 20.9141 | 1.9676 |
| Monoalcohols/-acids | 164 | 0. 9685 | 22.91 | 23.3101 | 1.9282 |
| Polyalcohols/-acids | 36 | 0.9910 | 16.03 | 23.5782 | 2.0422 |
| Molecule Name | Vm | Cp(sol,298) exp | Cp(sol,298) calc | Deviation | Dev. in % |
|---|---|---|---|---|---|
| 2-Methyl-2-propanol | 86.80 | 146.11 | 119.41 | 26.70 | 18.27 |
| Serine | 91.30 | 135.60 | 126.18 | 9.42 | 6.94 |
| Phenol | 92.30 | 127.44 | 127.69 | −0.25 | −0.20 |
| Dibromoacetic acid | 92.80 | 124.70 | 128.44 | −3.74 | −3.00 |
| 2-Furoic acid | 92.90 | 132.26 | 128.59 | 3.67 | 2.77 |
| cis-3-Chloro-2-butenoic acid | 96.20 | 140.20 | 133.56 | 6.64 | 4.74 |
| 4-Fluorophenol | 97.20 | 144.60 | 135.06 | 9.54 | 6.59 |
| trans-3-Chloro-2-butenoic acid | 97.20 | 159.80 | 135.06 | 24.74 | 15.48 |
| 3-Thiophenecarboxylic acid | 99.70 | 134.17 | 138.83 | −4.66 | −3.47 |
| 2-Thiophenecarboxylic acid | 100.00 | 153.78 | 139.28 | 14.50 | 9.43 |
| 2-Pyrazinecarboxylic acid | 102.50 | 143.50 | 143.04 | 0.46 | 0.32 |
| 5-Methylisoxazole-3-carboxylic acid | 105.30 | 146.20 | 147.25 | −1.05 | −0.72 |
| Trimethylacetic acid | 106.20 | 177.80 | 148.61 | 29.19 | 16.42 |
| Nicotinic acid | 107.00 | 151.30 | 149.81 | 1.49 | 0.98 |
| 2-Pyridinealdoxime | 108.00 | 151.93 | 151.32 | 0.61 | 0.40 |
| o-Cresol | 108.50 | 154.56 | 152.07 | 2.49 | 1.61 |
| p-Cresol | 108.80 | 150.20 | 152.52 | −2.32 | −1.55 |
| Threonine | 109.30 | 155.31 | 153.27 | 2.04 | 1.31 |
| 4-Amino-3-furazanecarboxamidoxime | 109.70 | 180.40 | 153.88 | 26.52 | 14.70 |
| Aspartic acid | 110.50 | 155.18 | 155.08 | 0.10 | 0.06 |
| Benzoic acid | 111.10 | 147.07 | 155.98 | −8.91 | −6.06 |
| 4-Hydroxybenzaldehyde | 111.50 | 149.90 | 156.59 | −6.69 | −4.46 |
| Cyclohexanone oxime | 114.90 | 199.38 | 161.70 | 37.68 | 18.90 |
| 4-Nitrophenol | 115.40 | 143.90 | 162.45 | −18.55 | −12.89 |
| 3-Thiopheneacetic acid | 115.70 | 167.76 | 162.91 | 4.85 | 2.89 |
| 2-Thiopheneacetic acid | 116.50 | 159.23 | 164.11 | −4.88 | −3.06 |
| Pentafluorophenol | 116.80 | 201.30 | 164.56 | 36.74 | 18.25 |
| 3,5-Dimethylisoxazole-4-carboxylic acid | 120.40 | 177.80 | 169.98 | 7.82 | 4.40 |
| o-Anthranilic acid | 121.00 | 165.30 | 170.88 | −5.58 | −3.38 |
| m-Anthranilic acid | 123.50 | 162.80 | 174.64 | −11.84 | −7.28 |
| p-Anthranilic acid | 123.60 | 177.80 | 174.80 | 3.00 | 1.69 |
| 4-Ethylphenol | 124.50 | 206.90 | 176.15 | 30.75 | 14.86 |
| 2-Chlorobenzoic acid | 124.70 | 163.20 | 176.45 | −13.25 | −8.12 |
| 2-Methylbenzoic acid | 125.70 | 174.90 | 177.96 | −3.06 | −1.75 |
| 3-Chlorobenzoic acid | 125.70 | 163.60 | 177.96 | −14.36 | −8.77 |
| 4-Chlorobenzoic acid | 125.70 | 167.80 | 177.96 | −10.16 | −6.05 |
| 3-Methylbenzoic acid | 127.80 | 163.60 | 181.12 | −17.52 | −10.71 |
| 4-Methylbenzoic acid | 127.80 | 169.00 | 181.12 | −12.12 | −7.17 |
| 2-Bromobenzoic acid | 128.60 | 154.00 | 182.32 | −28.32 | −18.39 |
| Glutamic acid | 128.70 | 175.06 | 182.47 | −7.41 | −4.23 |
| Benzoylformic acid | 129.60 | 192.90 | 183.82 | 9.08 | 4.70 |
| 3-Bromobenzoic acid | 129.90 | 151.40 | 184.28 | −32.88 | −21.71 |
| 4-Bromobenzoic acid | 129.90 | 151.40 | 184.28 | −32.88 | −21.71 |
| 2-Nitrobenzoic acid | 130.70 | 191.60 | 185.48 | 6.12 | 3.19 |
| 8-Quinolinol | 130.90 | 180.42 | 185.78 | −5.36 | −2.97 |
| 3-Phenylpropiolic acid | 134.60 | 180.00 | 191.35 | −11.35 | −6.31 |
| 3-Nitrobenzoic acid | 134.70 | 179.90 | 191.50 | −11.60 | −6.45 |
| Benzofuran-2-carboxylic acid | 134.70 | 184.80 | 191.50 | −6.70 | −3.63 |
| 4-Nitrobenzoic acid | 134.80 | 180.30 | 191.65 | −11.35 | −6.30 |
| 2-Naphthol | 135.30 | 172.80 | 192.40 | −19.60 | −11.34 |
| 1-Naphthol | 135.40 | 166.90 | 192.55 | −25.65 | −15.37 |
| Methylsalicylate | 136.00 | 244.30 | 193.46 | 50.84 | 20.81 |
| Tyramine | 136.30 | 213.75 | 193.91 | 19.84 | 9.28 |
| 4-Hydroxy-3-methoxybenzaldehyde | 137.10 | 187.60 | 195.11 | −7.51 | −4.00 |
| 4-Methoxybenzoic acid | 137.20 | 207.50 | 195.26 | 12.24 | 5.90 |
| 2-Hydroxyacetanilide | 137.60 | 182.40 | 195.86 | −13.46 | −7.38 |
| Methyl 3-hydroxybenzoate | 137.60 | 205.00 | 195.86 | 9.14 | 4.46 |
| Methyl 4-hydroxybenzoate | 137.70 | 214.41 | 196.01 | 18.40 | 8.58 |
| trans-Cinnamic acid | 138.60 | 197.50 | 197.37 | 0.13 | 0.07 |
| Indole-2-carboxylic acid | 138.90 | 178.40 | 197.82 | −19.42 | −10.89 |
| N-Phenylglycine | 139.40 | 177.40 | 198.57 | −21.17 | −11.94 |
| Mesitol | 140.20 | 189.60 | 199.78 | −10.18 | −5.37 |
| 3-Trifluoromethylbenzoic acid | 142.20 | 223.60 | 202.79 | 20.81 | 9.31 |
| Homocubane-4-carboxylic acid | 143.50 | 207.00 | 204.74 | 2.26 | 1.09 |
| Thionaphthene-2-carboxylic acid | 143.60 | 179.00 | 204.89 | −25.89 | −14.47 |
| 2,5-Dibromobenzoic acid | 147.00 | 223.00 | 210.01 | 12.99 | 5.82 |
| 2,4,6-Tribromophenol | 147.20 | 172.00 | 210.31 | −38.31 | −22.27 |
| Trimellitic anhydride | 147.30 | 248.90 | 210.46 | 38.44 | 15.44 |
| 3,5-Dibromobenzoic acid | 148.30 | 223.10 | 211.97 | 11.13 | 4.99 |
| 3-Aminocinnamic acid | 150.00 | 227.60 | 214.53 | 13.07 | 5.74 |
| 2-Adamantanol | 153.60 | 207.20 | 219.94 | −12.74 | −6.15 |
| Ethyl vanillin | 153.90 | 212.20 | 220.40 | −8.20 | −3.86 |
| 1-Adamantanol | 154.00 | 196.70 | 220.55 | −23.85 | −12.12 |
| Ethyl 3-hydroxybenzoate | 154.40 | 217.22 | 221.15 | −3.93 | −1.81 |
| Ethyl 4-hydroxybenzoate | 154.40 | 233.93 | 221.15 | 12.78 | 5.46 |
| D(+)-Carnitine | 155.40 | 224.70 | 222.65 | 2.05 | 0.91 |
| Hippuric acid | 158.40 | 217.00 | 227.17 | −10.17 | −4.69 |
| 2,4,6-Trinitrophenol | 160.00 | 239.70 | 229.58 | 10.12 | 4.22 |
| 2-Nitrocinnamic acid | 160.10 | 240.60 | 229.73 | 10.87 | 4.52 |
| 2-Hydroxybiphenyl | 161.50 | 227.61 | 231.83 | −4.22 | −1.86 |
| Pentachlorophenol | 161.80 | 201.96 | 232.28 | −30.32 | −15.02 |
| 3-Nitrocinnamic acid | 161.90 | 240.20 | 232.43 | 7.77 | 3.23 |
| 4-Nitrocinnamic acid | 161.90 | 238.10 | 232.43 | 5.67 | 2.38 |
| Isoborneol | 163.20 | 261.06 | 234.39 | 26.67 | 10.22 |
| Tyrosine | 164.40 | 216.44 | 236.20 | −19.76 | −9.13 |
| 2,3,5,6-Tetramethylbenzoic acid | 172.80 | 231.70 | 248.84 | −17.14 | −7.40 |
| 2,3,4,5-Tetramethylbenzoic acid | 174.40 | 249.50 | 251.25 | −1.75 | −0.70 |
| Menthol | 174.80 | 250.10 | 251.85 | −1.75 | −0.70 |
| Diphenylmethanol | 179.30 | 236.80 | 258.62 | −21.82 | −9.22 |
| p-Methacryloyloxybenzoic acid | 182.30 | 257.90 | 263.14 | −5.24 | −2.03 |
| 3-Cyano-4-methoxymethyl-5-nitro-6-methyl-(2-pyridone) | 183.90 | 275.80 | 265.54 | 10.26 | 3.72 |
| N-Methylephedrine | 184.70 | 298.89 | 266.75 | 32.14 | 10.75 |
| 9-Hydroxy-1,4-anthraquinone | 188.80 | 237.67 | 272.92 | −35.25 | −14.83 |
| Pentamethylbenzoic acid | 190.00 | 249.90 | 274.72 | −24.82 | −9.93 |
| Benzoylglycylglycine | 206.00 | 277.40 | 298.80 | −21.40 | −7.72 |
| 5-Hydroxyflavone | 206.70 | 279.80 | 299.86 | −20.06 | −7.17 |
| 3-Hydroxyflavone | 207.00 | 270.10 | 300.31 | −30.21 | −11.18 |
| Ibuprofen | 208.20 | 328.01 | 302.11 | 25.90 | 7.89 |
| 6-Hydroxyflavone | 208.80 | 250.30 | 303.02 | −52.72 | −21.06 |
| 7-Hydroxyflavone | 208.80 | 253.10 | 303.02 | −49.92 | −19.72 |
| N-Methylephedrine hydrochloride | 210.80 | 282.29 | 306.03 | −23.74 | −8.41 |
| 2-(6-Methoxynaphthalen-2-yl)propanoic acid | 211.90 | 296.30 | 307.68 | −11.38 | −3.84 |
| PMC | 220.10 | 315.30 | 320.02 | −4.72 | −1.50 |
| 4-(Phenylmethoxy)benzeneacetic acid | 224.60 | 340.00 | 326.80 | 13.20 | 3.88 |
| Tri-t-butylmethanol | 225.60 | 350.60 | 328.30 | 22.30 | 6.36 |
| 1-Tridecanol | 237.50 | 378.00 | 346.21 | 31.79 | 8.41 |
| Tridecanoic acid | 239.90 | 387.60 | 349.82 | 37.78 | 9.75 |
| Triphenylmethanol | 248.60 | 318.80 | 362.91 | −44.11 | −13.84 |
| Myristyl alcohol | 254.20 | 388.00 | 371.34 | 16.66 | 4.29 |
| Tetradecanoic acid | 256.60 | 432.01 | 374.95 | 57.06 | 13.21 |
| 1-Pentadecanol | 270.90 | 400.00 | 396.48 | 3.52 | 0.88 |
| 1-Pentadecanoic acid | 273.30 | 443.28 | 400.09 | 43.19 | 9.74 |
| N-(2-Hydroxy-4-methoxybenzylidene)-4-butylaniline | 275.20 | 451.00 | 402.95 | 48.05 | 10.65 |
| 1-Hexadecanol | 287.60 | 422.00 | 421.61 | 0.39 | 0.09 |
| Palmitic acid | 290.00 | 460.70 | 425.22 | 35.48 | 7.70 |
| Margaric acid | 306.70 | 475.70 | 450.35 | 25.35 | 5.33 |
| Stearic acid | 323.40 | 501.60 | 475.49 | 26.11 | 5.21 |
| 1-Nonadecanoic acid | 340.10 | 525.40 | 500.62 | 24.78 | 4.72 |
| Arachidic acid | 356.80 | 545.10 | 525.75 | 19.35 | 3.55 |
| N-Formylmethionine-leucyl-phenylalanine | 403.70 | 567.60 | 596.33 | −28.73 | −5.06 |
| Simvastatin | 408.40 | 577.00 | 603.41 | −26.41 | −4.58 |
| Pyrimethanil laurate | 411.70 | 584.50 | 608.37 | −23.87 | −4.08 |
| Methylprednisolone aceponate | 426.90 | 604.80 | 631.25 | −26.45 | −4.37 |
| Molecule Name | Vm | Cp(sol,298) exp | Cp(sol,298) calc | Deviation | Dev. in % |
|---|---|---|---|---|---|
| Oxalic acid | 67.90 | 91.00 | 90.02 | 0.98 | 1.07 |
| Squaric acid | 80.00 | 121.80 | 108.73 | 13.07 | 10.73 |
| Malonic acid | 81.70 | 127.63 | 111.36 | 16.27 | 12.75 |
| Lactic acid | 81.80 | 127.60 | 111.52 | 16.08 | 12.60 |
| Maleic acid | 94.10 | 135.60 | 130.54 | 5.06 | 3.73 |
| Fumaric acid | 96.00 | 141.80 | 133.47 | 8.33 | 5.87 |
| Butanedioic acid | 100.90 | 152.93 | 141.05 | 11.88 | 7.77 |
| 1,3-Dihydroxybenzene | 101.00 | 135.53 | 141.20 | −5.67 | −4.19 |
| 1,4-Dihydroxybenzene | 101.00 | 136.40 | 141.20 | −4.80 | −3.52 |
| 1,2-Dihydroxybenzene | 101.10 | 144.30 | 141.36 | 2.94 | 2.04 |
| Diethanolamine | 108.30 | 137.00 | 152.49 | −15.49 | −11.31 |
| 2,2-Dimethyl-1,3-propanediol | 112.30 | 183.18 | 158.68 | 24.50 | 13.38 |
| Erythritol | 113.40 | 161.90 | 160.38 | 1.52 | 0.94 |
| Tartaric acid | 114.40 | 184.50 | 161.92 | 22.58 | 12.24 |
| TRIS | 116.40 | 171.27 | 165.02 | 6.25 | 3.65 |
| 2,5-Dihydroxytoluene | 117.30 | 174.90 | 166.41 | 8.49 | 4.86 |
| 2-Methylbutanedioic acid | 117.50 | 199.60 | 166.72 | 32.88 | 16.47 |
| Pentanedioic acid | 117.60 | 186.90 | 166.87 | 20.03 | 10.72 |
| cis-1,2-Cyclohexanediol | 118.30 | 160.40 | 167.95 | −7.55 | −4.71 |
| trans-1,2-Cyclohexanediol | 118.40 | 163.20 | 168.11 | −4.91 | −3.01 |
| Salicylic acid | 118.50 | 160.90 | 168.26 | −7.36 | −4.58 |
| 4-Carboxyphenol | 120.10 | 155.20 | 170.74 | −15.54 | −10.01 |
| 3,4-Dihydroxybenzaldehyde | 120.30 | 205.90 | 171.05 | 34.85 | 16.93 |
| 3-Carboxyphenol | 120.40 | 157.30 | 171.20 | −13.90 | −8.84 |
| Pentaerythritol | 127.60 | 188.40 | 182.33 | 6.07 | 3.22 |
| Xylose | 128.50 | 180.40 | 183.73 | −3.33 | −1.84 |
| D-Ribose | 128.50 | 183.20 | 183.73 | −0.53 | −0.29 |
| Arabinose | 128.90 | 184.10 | 184.34 | −0.24 | −0.13 |
| Hexamethyleneglycol | 129.50 | 190.00 | 185.27 | 4.73 | 2.49 |
| Xylitol | 130.00 | 207.00 | 186.05 | 20.95 | 10.12 |
| Thiophenedicarboxylic acid | 130.10 | 204.87 | 186.20 | 18.67 | 9.11 |
| 1,6-Anhydro-beta-D-glucopyranose | 130.70 | 187.20 | 187.13 | 0.07 | 0.04 |
| 1,6-Hexanedioic acid | 134.30 | 196.60 | 192.69 | 3.91 | 1.99 |
| 2,6-Pyridinedicarboxylic acid | 134.60 | 166.31 | 193.16 | −26.85 | −16.14 |
| Mandelic acid | 136.00 | 199.20 | 195.32 | 3.88 | 1.95 |
| Ethriol | 137.10 | 213.80 | 197.02 | 16.78 | 7.85 |
| Gallic acid | 138.00 | 199.55 | 198.42 | 1.13 | 0.57 |
| Phthalic acid | 138.20 | 188.11 | 198.72 | −10.61 | −5.64 |
| Isophthalic acid | 138.30 | 201.70 | 198.88 | 2.82 | 1.40 |
| Arabitol | 138.90 | 201.35 | 199.81 | 1.54 | 0.77 |
| Terephthalic acid | 139.50 | 199.60 | 200.74 | −1.14 | −0.57 |
| 2-Deoxy-d-glucose | 143.70 | 200.20 | 207.23 | −7.03 | −3.51 |
| 4,5-Dihydroxy-2-(dinitromethylene)imidazolidine | 147.10 | 217.76 | 212.49 | 5.27 | 2.42 |
| trans-4-Coumaric acid | 147.60 | 193.00 | 213.26 | −20.26 | −10.50 |
| Trimethylhydroquinone | 148.30 | 217.60 | 214.34 | 3.26 | 1.50 |
| Inositol | 149.90 | 218.00 | 216.82 | 1.18 | 0.54 |
| 3-Chloromandelic acid | 150.10 | 211.10 | 217.13 | −6.03 | −2.85 |
| beta-D-Fructose | 150.90 | 227.70 | 218.36 | 9.34 | 4.10 |
| Heptanedioic acid | 151.00 | 240.70 | 218.52 | 22.18 | 9.22 |
| Vitamin B6 | 151.20 | 244.46 | 218.83 | 25.63 | 10.49 |
| Citric acid | 151.60 | 226.40 | 219.44 | 6.96 | 3.07 |
| D-Psicose | 151.60 | 221.30 | 219.44 | 1.86 | 0.84 |
| D-Tagatose | 152.40 | 228.00 | 220.68 | 7.32 | 3.21 |
| alpha-D-Glucose | 153.60 | 219.19 | 222.54 | −3.35 | −1.53 |
| D-Galactose | 153.80 | 213.70 | 222.85 | −9.15 | −4.28 |
| D-Mannose | 153.80 | 215.90 | 222.85 | −6.95 | −3.22 |
| 2,4-Dihydroxycinnamic acid | 155.80 | 178.36 | 225.94 | −47.58 | −26.68 |
| Caffeic acid | 156.40 | 181.96 | 226.87 | −44.91 | −24.68 |
| Dulcose | 158.80 | 238.50 | 230.58 | 7.92 | 3.32 |
| 3-Nitrophthalic acid | 159.80 | 247.02 | 232.12 | 14.90 | 6.03 |
| 4-Nitrophthalic acid | 160.60 | 232.24 | 233.36 | −1.12 | −0.48 |
| 3,4-Dihydroxyhydrocinnamic acid | 161.30 | 218.62 | 234.44 | −15.82 | −7.24 |
| 1,8-Octanediol | 162.90 | 236.36 | 236.92 | −0.56 | −0.24 |
| Sorbitol | 163.50 | 239.00 | 237.84 | 1.16 | 0.48 |
| Octanedioic acid | 167.20 | 267.60 | 243.57 | 24.03 | 8.98 |
| 1-Methoxy-a-d-glucopyranoside | 167.30 | 233.70 | 243.72 | −10.02 | −4.29 |
| 4,4′-Dihydroxybiphenyl | 171.40 | 224.31 | 250.06 | −25.75 | −11.48 |
| Ferulic acid | 173.20 | 235.94 | 252.84 | −16.90 | −7.16 |
| Dopa | 173.30 | 260.60 | 253.00 | 7.60 | 2.92 |
| 1,4-Bis-(2-hydroxyethyl)piperazine | 175.10 | 250.68 | 255.78 | −5.10 | −2.03 |
| Glyceryl-2-benzoate | 179.30 | 236.40 | 262.28 | −25.88 | −10.95 |
| 1,9-Nonanediol | 179.60 | 256.74 | 262.74 | −6.00 | −2.34 |
| 1-Benzoylglycerol | 179.80 | 238.90 | 263.05 | −24.15 | −10.11 |
| 2,6-Naphthalenedicarboxylic acid | 182.80 | 230.30 | 267.69 | −37.39 | −16.23 |
| Nonanedioic acid | 184.40 | 294.50 | 270.16 | 24.34 | 8.26 |
| Bisphenol F | 188.50 | 246.30 | 276.50 | −30.20 | −12.26 |
| N-Acetyl-d-glucosamine | 189.30 | 276.90 | 277.74 | −0.84 | −0.30 |
| 1,10-Decanediol | 196.30 | 279.26 | 288.56 | −9.30 | −3.33 |
| Decanedioic acid | 201.10 | 321.40 | 295.98 | 25.42 | 7.91 |
| Bisphenol E | 204.60 | 276.41 | 301.40 | −24.99 | −9.04 |
| Bisphenol S | 206.20 | 280.30 | 303.87 | −23.57 | −8.41 |
| Arabinosylhypoxanthine | 208.90 | 283.30 | 308.04 | −24.74 | −8.73 |
| 3,3′-Dihydroxy-4,4′-diaminodiphenylmethane | 210.90 | 281.20 | 311.14 | −29.94 | −10.65 |
| 1,11-Undecanediol | 213.00 | 297.79 | 314.38 | −16.59 | −5.57 |
| Undecanedioic acid | 217.80 | 348.30 | 321.81 | 26.49 | 7.61 |
| Vidarabine | 218.70 | 290.10 | 323.20 | −33.10 | −11.41 |
| Bisphenol A | 219.00 | 301.34 | 323.66 | −22.32 | −7.41 |
| 1-(2,2,3-Trimethyl-1,3-oxazolidin-5-yl)-butane-1,2,3,4-tetrol | 219.90 | 331.46 | 325.05 | 6.41 | 1.93 |
| Ellagic acid | 226.60 | 328.85 | 335.41 | −6.56 | −2.00 |
| 1,12-Dodecanediol | 229.70 | 330.23 | 340.21 | −9.98 | −3.02 |
| Trolox | 231.40 | 332.00 | 342.83 | −10.83 | −3.26 |
| Dodecanedioic acid | 234.50 | 375.20 | 347.63 | 27.57 | 7.35 |
| 1,13-Tridecanediol | 246.40 | 366.88 | 366.03 | 0.85 | 0.23 |
| 3,5-Di-t-butylsalicylic acid | 247.00 | 383.00 | 366.96 | 16.04 | 4.19 |
| 1,13-Tridecanedioic acid | 251.20 | 402.10 | 373.45 | 28.65 | 7.13 |
| 1-Monocaprin | 258.20 | 410.00 | 384.27 | 25.73 | 6.27 |
| 1,14-Tetradecanediol | 263.10 | 379.61 | 391.85 | −12.24 | −3.22 |
| 1,14-Tetradecanedioic acid | 267.90 | 429.00 | 399.27 | 29.73 | 6.93 |
| Bisphenol AP | 274.00 | 365.85 | 408.70 | −42.85 | −11.71 |
| Cellobiose | 277.50 | 436.10 | 414.12 | 21.98 | 5.04 |
| Maltose | 277.90 | 434.70 | 414.73 | 19.97 | 4.59 |
| 1,15-Pentadecanediol | 279.80 | 377.45 | 417.67 | −40.22 | −10.66 |
| Saccharose | 281.50 | 424.30 | 420.30 | 4.00 | 0.94 |
| Lactose | 283.60 | 412.50 | 423.55 | −11.05 | −2.68 |
| Glyceryl-2-laurate | 290.30 | 436.40 | 433.91 | 2.49 | 0.57 |
| 1-Glyceryl laurate | 291.30 | 447.70 | 435.45 | 12.25 | 2.74 |
| 1,16-Hexadecanediol | 296.50 | 426.18 | 443.49 | −17.31 | −4.06 |
| Hexadecanedioic acid | 301.30 | 482.80 | 450.92 | 31.88 | 6.60 |
| Vitamin B2 | 321.30 | 442.20 | 481.84 | −39.64 | −8.96 |
| 2-Monomyristin | 323.50 | 506.30 | 485.24 | 21.06 | 4.16 |
| Methylprednisolone | 338.50 | 472.10 | 508.44 | −36.34 | −7.70 |
| 2-Monopalmitin | 357.80 | 558.60 | 538.28 | 20.32 | 3.64 |
| 1-Palmitoylglycerol | 358.10 | 566.90 | 538.74 | 28.16 | 4.97 |
| 2-Stearoylglycerol | 391.10 | 610.40 | 589.77 | 20.63 | 3.38 |
| 1-Glyceryl stearate | 391.70 | 610.40 | 590.70 | 19.70 | 3.23 |
| Maltotriose | 406.70 | 662.50 | 613.89 | 48.61 | 7.34 |
| Tetraphenyltetrahydroxycyclotetrasiloxane | 432.00 | 626.50 | 653.01 | −26.51 | −4.23 |
| Cyclodextrin | 776.30 | 1153.00 | 1185.38 | −32.38 | −2.81 |
| Octaphenyltetrahydroxytricyclooctasiloxane | 816.00 | 1273.00 | 1246.77 | 26.23 | 2.06 |
| Molecule Name | Cp(sol,298) exp | Cp(sol,298) calc | Deviation | Dev. in % |
|---|---|---|---|---|
| Azaferrocene | 183.40 | 196.40 | −13.00 | −7.09 |
| Nickelocene | 202.39 | 200.70 | 1.69 | 0.84 |
| Ferrocene | 195.90 | 201.10 | −5.20 | −2.65 |
| Manganocene | 208.15 | 207.20 | 0.95 | 0.46 |
| Acetylferrocene | 246.00 | 253.40 | −7.40 | −3.01 |
| 1,1′-Diacetylferrocene | 293.90 | 301.60 | −7.70 | −2.62 |
| Benzylferrocene | 312.60 | 320.70 | −8.10 | −2.59 |
| Benzoylferrocene | 313.60 | 323.80 | −10.20 | −3.25 |
| 1,1′-Dibenzoylferrocene | 466.10 | 450.70 | 15.40 | 3.30 |
| Mean | −3.73 | −1.85 | ||
| Standar deviation | 8.95 | 3.37 |
| Molecule Name | Cp(sol,298) exp | Cp(sol,298) calc | Deviation | Dev. in % |
|---|---|---|---|---|
| Tetraisopropoxysilane | 359.48 | 365.90 | −6.42 | −1.79 |
| Tetrapropyl silicate | 363.39 | 369.80 | −6.41 | −1.76 |
| Tetra-2-butoxysilane | 487.27 | 453.50 | 33.77 | 6.93 |
| Tetra-2-methyl-1-propoxysilane | 477.59 | 459.90 | 17.69 | 3.70 |
| Tetrabutoxysilane | 493.68 | 461.10 | 32.58 | 6.60 |
| 2,4,6-Trimethyl-2,4,6-triphenylcyclotrisiloxane | 506.70 | 490.20 | 16.50 | 3.26 |
| 1,1,3,3-Tetraphenyl-1,3-dimethyldisiloxane | 503.20 | 530.50 | −27.30 | −5.43 |
| Tetra-3-methyl-1-butoxysilane | 591.28 | 549.50 | 41.78 | 7.07 |
| Tetramethyltetraphenylcyclotetrasiloxane | 615.00 | 639.60 | −24.60 | −4.00 |
| Hexaphenyldisiloxane | 681.00 | 680.90 | 0.10 | 0.01 |
| Hexaphenylcyclotrisiloxane | 683.70 | 722.00 | −38.30 | −5.60 |
| 1,1,3,3,5,5-Hexaphenyl-7,7-dimethylcyclotetrasiloxane | 815.50 | 801.20 | 14.30 | 1.75 |
| Tetra-2-ethyl-1-hexoxysilane | 870.88 | 816.50 | 54.38 | 6.24 |
| Octaphenyltetracyclosiloxane | 932.50 | 939.60 | −7.10 | −0.76 |
| Octaphenylpentacyclosilsesquioxane | 1129.00 | 1086.00 | 43.00 | 3.81 |
| Octaphenyltetrahydroxytricyclooctasiloxane | 1273.00 | 1246.80 | 26.20 | 2.06 |
| Mean | 10.64 | 1.38 | ||
| Standard deviation | 28.70 | 4.40 |
| Molecule Name | Cp(sol,298) exp | Cp(sol,298) calc | Deviation | Dev. in % |
|---|---|---|---|---|
| Benzene | 97.90 | 116.90 | −19.00 | −19.41 |
| 2,4-Hexadiyne | 133.57 | 128.60 | 4.97 | 3.72 |
| Norbornene | 129.90 | 138.10 | −8.20 | −6.31 |
| Nortricyclene | 129.00 | 140.80 | −11.80 | −9.15 |
| Norbornane | 151.00 | 149.60 | 1.40 | 0.93 |
| Bicyclo[2.2.2]octane | 157.69 | 171.00 | −13.31 | −8.44 |
| Naphthalene | 168.20 | 175.80 | −7.60 | −4.52 |
| exo-Dicyclopentadiene | 188.70 | 179.80 | 8.90 | 4.72 |
| Bullvalene | 190.38 | 189.30 | 1.08 | 0.57 |
| Acenaphthylene | 183.59 | 195.70 | −12.11 | −6.60 |
| 2-Methylnaphthalene | 195.80 | 198.20 | −2.40 | −1.23 |
| 2,2,3,3-Tetramethylbutane | 232.20 | 198.60 | 33.60 | 14.47 |
| Adamantane | 190.00 | 201.30 | −11.30 | −5.95 |
| Acenaphthene | 191.38 | 203.90 | −12.52 | −6.54 |
| Camphene | 235.13 | 205.70 | 29.43 | 12.52 |
| 1,2,4,5-Tetramethylbenzene | 215.10 | 207.30 | 7.80 | 3.63 |
| Biphenyl | 198.17 | 212.40 | −14.23 | −7.18 |
| 1,8-Dimethylnaphthalene | 242.80 | 215.10 | 27.70 | 11.41 |
| Fluorene | 203.13 | 219.20 | −16.07 | −7.91 |
| Guajen | 216.47 | 219.80 | −3.33 | −1.54 |
| 2,7-Dimethylnaphthalene | 204.39 | 220.50 | −16.11 | −7.88 |
| 2,6-Dimethylnaphthalene | 204.20 | 220.50 | −16.30 | −7.98 |
| Pentamethylbenzene | 210.50 | 225.80 | −15.30 | −7.27 |
| Bicyclo[3.3.3]undecane | 213.20 | 232.80 | −19.60 | −9.19 |
| Phenanthrene | 220.30 | 233.80 | −13.50 | −6.13 |
| Anthracene | 210.50 | 234.90 | −24.40 | −11.59 |
| 4-Phenyltoluene | 238.74 | 235.10 | 3.64 | 1.52 |
| Cyclohexylbenzene | 263.17 | 235.90 | 27.27 | 10.36 |
| Diphenylmethane | 233.50 | 236.00 | −2.50 | −1.07 |
| 9,10-Dihydrophenanthrene | 243.80 | 243.30 | 0.50 | 0.21 |
| 9,10-Dihydroanthracene | 219.06 | 244.70 | −25.64 | −11.70 |
| Tolan | 225.90 | 246.10 | −20.20 | −8.94 |
| Hexamethylbenzene | 245.60 | 248.90 | −3.30 | −1.34 |
| trans-Stilbene | 235.00 | 250.00 | −15.00 | −6.38 |
| Tetrahydroanthracene | 247.02 | 251.10 | −4.08 | −1.65 |
| 4-Methylphenanthrene | 262.80 | 251.90 | 10.90 | 4.15 |
| Fluoranthene | 230.25 | 253.50 | −23.25 | −10.10 |
| Pyrene | 229.70 | 256.40 | −26.70 | −11.62 |
| 1,2-Diphenylethane | 253.76 | 257.30 | −3.54 | −1.40 |
| 4,4′-Dimethylbiphenyl | 242.26 | 257.30 | −15.04 | −6.21 |
| [2.2]Paracyclophane | 252.70 | 261.40 | −8.70 | −3.44 |
| Diamantane | 223.40 | 262.10 | −38.70 | −17.32 |
| [2,2]Metaparacyclophane | 261.50 | 266.80 | −5.30 | −2.03 |
| 1,2,3,4,5,6,7,8-Octahydroanthracene | 277.96 | 266.80 | 11.16 | 4.01 |
| 4,5,9,10-Tetrahydropyrene | 257.12 | 273.20 | −16.08 | −6.25 |
| 1,2,3,6,7,8-Hexahydropyrene | 255.54 | 280.50 | −24.96 | −9.77 |
| [2,2]Metacyclophane | 240.60 | 280.60 | −40.00 | −16.63 |
| Triphenylene | 259.20 | 290.70 | −31.50 | −12.15 |
| Perhydrophenanthrene | 289.50 | 291.60 | −2.10 | −0.73 |
| Benz[a]anthracene | 273.60 | 293.00 | −19.40 | −7.09 |
| Tetracene | 260.50 | 294.00 | −33.50 | −12.86 |
| 1,4-Di-t-butylbenzene | 323.15 | 294.90 | 28.25 | 8.74 |
| Tri-t-butylmethane | 354.80 | 300.50 | 54.30 | 15.30 |
| 4-t-Butylbiphenyl | 304.73 | 301.10 | 3.63 | 1.19 |
| anti-trans-Truxane | 275.30 | 303.50 | −28.20 | −10.24 |
| p-Terphenyl | 279.60 | 308.00 | −28.40 | −10.16 |
| m-Terphenyl | 281.00 | 308.70 | −27.70 | −9.86 |
| o-Terphenyl | 274.75 | 309.10 | −34.35 | −12.50 |
| 2,2′-Diindanyl | 332.60 | 313.10 | 19.50 | 5.86 |
| Perylene | 274.90 | 313.20 | −38.30 | −13.93 |
| Triptycene | 283.10 | 319.90 | −36.80 | −13.00 |
| 1-Methyl-7-isopropylphenanthrene | 294.60 | 321.90 | −27.30 | −9.27 |
| [3,3]Paracyclophane | 324.30 | 322.00 | 2.30 | 0.71 |
| Tritane | 308.80 | 332.60 | −23.80 | −7.71 |
| Dicumyl | 321.10 | 341.60 | −20.50 | −6.38 |
| Triphenylethylene | 309.20 | 347.30 | −38.10 | −12.32 |
| 1,1,1-Triphenylethane | 316.70 | 351.80 | −35.10 | −11.08 |
| 1,1,2-Triphenylethane | 319.70 | 352.80 | −33.10 | −10.35 |
| 1,2′-Dinaphthylmethane | 314.60 | 352.90 | −38.30 | −12.17 |
| Pentacene | 311.50 | 353.20 | −41.70 | −13.39 |
| Coronene | 317.17 | 358.00 | −40.83 | −12.87 |
| Cetane | 441.80 | 383.20 | 58.60 | 13.26 |
| 4,4′-Di-t-butylbiphenyl | 412.41 | 389.40 | 23.01 | 5.58 |
| Hexacyclopropylethane | 396.10 | 401.20 | −5.10 | −1.29 |
| 1,1′-Diphenyl-1,1′-bicyclopentyl | 375.50 | 401.80 | −26.30 | −7.00 |
| 1,2,3-Triphenylbenzene | 352.37 | 403.10 | −50.73 | −14.40 |
| p-Quaterphenyl | 363.50 | 404.70 | −41.20 | −11.33 |
| 1,3,5-Triphenylbenzene | 361.00 | 404.70 | −43.70 | −12.11 |
| m-Quaterphenyl | 359.50 | 404.70 | −45.20 | −12.57 |
| o-Quaterphenyl | 359.10 | 406.40 | −47.30 | −13.17 |
| Tetraphenylmethane | 368.20 | 423.30 | −55.10 | −14.96 |
| Octadecane | 485.64 | 428.80 | 56.84 | 11.70 |
| 1,1,1,2-Tetraphenylethane | 395.40 | 440.00 | −44.60 | −11.28 |
| 1,1′-Diphenyl-1,1′-bicyclohexyl | 403.80 | 442.30 | −38.50 | −9.53 |
| 1,1,2,2-Tetraphenylethane | 399.60 | 444.10 | −44.50 | −11.14 |
| Tetraphenylethylene | 388.70 | 445.00 | −56.30 | −14.48 |
| Eicosane | 479.90 | 475.10 | 4.80 | 1.00 |
| o-Quinquephenyl | 444.30 | 500.30 | −56.00 | −12.60 |
| p-Quinquephenyl | 455.50 | 500.60 | −45.10 | −9.90 |
| m-Quinquephenyl | 443.70 | 500.70 | −57.00 | −12.85 |
| 2,3-Dimethyl-2,3-bis(4-t-butylphenyl)butane | 529.50 | 518.20 | 11.30 | 2.13 |
| Docosane | 563.60 | 520.80 | 42.80 | 7.59 |
| 2,11-Dicyclohexyldodecane | 557.30 | 531.40 | 25.90 | 4.65 |
| 1,1-Dicyclohexyldodecane | 562.60 | 532.00 | 30.60 | 5.44 |
| Pentaphenylethane | 473.60 | 534.50 | −60.90 | −12.86 |
| 3,4-Dimethyl-3,4-bis(4-t-butylphenyl)hexane | 587.90 | 561.80 | 26.10 | 4.44 |
| 3,4-Diethyl-3,4-bis(4-t-butylphenyl)-hexane | 631.30 | 600.70 | 30.60 | 4.85 |
| Hexacosane | 661.20 | 612.10 | 49.10 | 7.43 |
| 4,5-Diethyl-4,5-bis-(4-tert-butylphenyl)-octane | 618.50 | 651.50 | −33.00 | −5.34 |
| 2,4,5,7-Tetramethyl-4,5-bis(4-t-butylphenyl)octane | 683.90 | 651.90 | 32.00 | 4.68 |
| Fullerene C70 | 664.21 | 685.90 | −21.69 | −3.27 |
| 4,5-Dipropyl-4,5-bis-(4-t-butylphenyl)octane | 724.20 | 689.60 | 34.60 | 4.78 |
| Dotriacontane | 806.00 | 749.00 | 57.00 | 7.07 |
| 5,6-Dibutyl-5,6-bis(4-t-butylphenyl)decane | 805.50 | 776.90 | 28.60 | 3.55 |
| Hexatriacontane | 881.00 | 840.40 | 40.60 | 4.61 |
| Tetratetracontane | 1049.60 | 1023.00 | 26.60 | 2.53 |
| Pentacontane | 1220.90 | 1159.90 | 61.00 | 5.00 |
| Mean | −8.83 | −4.06 | ||
| Standard deviation | 38.20 | 9.60 |
| Molecules Class | N | Corr. coeff. R2 | σ (J/mol/K) | Intercept | Slope |
|---|---|---|---|---|---|
| OH-free compounds | 555 | 0.9766 | 23.14 | 2.8899 | 1.3669 |
| All alcohols/acids, sugars | 242 | 0.9792 | 20.87 | −14.7861 | 1.5364 |
| Monoalcohols/-acids | 123 | 0.9613 | 21.62 | −11.2179 | 1.5050 |
| Polyalcohols/-acids, sugars | 119 | 0.9866 | 19.75 | −14.9656 | 1.5462 |
| Cp at Various K | N | Corr. coeff. R2 | σ (J/mol/K) | Intercept | Slope |
|---|---|---|---|---|---|
| Cp(liq,250) | 29 | 0.9588 | 16.08 | −10.8602 | 1.7137 |
| Cp(liq,275) | 43 | 0.9765 | 13.58 | −14.8530 | 1.7887 |
| Cp(liq,298) | 1100 | 0.9893 | 20.55 | −6.8820 | 1.8302 |
| Cp(liq,325) | 94 | 0.9860 | 19.56 | −12.6937 | 1.9223 |
| Cp(liq,350) | 87 | 0.9842 | 20.29 | −4.3295 | 1.9458 |
| Cp at Various K | N | Corr. coeff. R2 | σ (J/mol/K) | Intercept | Slope |
|---|---|---|---|---|---|
| Cp(liq,250) | 10 | 0.9702 | 11.04 | 7.4825 | 1.7070 |
| Cp(liq,275) | 36 | 0.8988 | 21.70 | 0.0897 | 1.9866 |
| Cp(liq,298) | 203 | 0.9696 | 24.79 | 17.7056 | 1.9911 |
| Cp(liq,325) | 59 | 0.9337 | 27.08 | 35.6984 | 2.0297 |
| Cp(liq,350) | 56 | 0.9605 | 21.51 | 39.5214 | 2.1639 |
| Cp at Various K | N | Corr. coeff. R2 | σ (J/mol/K) | Intercept | Slope |
|---|---|---|---|---|---|
| Cp(sol,250) | 81 | 0.9873 | 19.37 | 8.8062 | 1.1569 |
| Cp(sol,275) | 83 | 0.9883 | 17.71 | 5.5180 | 1.2659 |
| Cp(sol,298) | 559 | 0.9760 | 23.66 | 2.6919 | 1.3694 |
| Cp(sol,325) | 60 | 0.9721 | 23.48 | −1.7976 | 1.4837 |
| Cp(sol,350) | 43 | 0.9711 | 25.59 | −5.6718 | 1.5794 |
| Cp at Various K | N | Corr. coeff. R2 | σ (J/mol/K) | Intercept | Slope |
|---|---|---|---|---|---|
| Cp(sol,250) | 43 | 0.9916 | 15.50 | −12.6827 | 1.2778 |
| Cp(sol,275) | 42 | 0.9846 | 15.10 | −1.1741 | 1.3387 |
| Cp(sol,298) | 241 | 0.9743 | 20.77 | −12.6463 | 1.5236 |
| Cp(sol,325) | 55 | 0.9859 | 21.94 | −11.7895 | 1.6305 |
| Cp(sol,350) | 36 | 0.9846 | 28.61 | −26.4116 | 1.8402 |
| Example | T/K | Cp(liq,T) exp | Cp(liq,T) calc | Deviation | Dev in % |
|---|---|---|---|---|---|
| 1-Phenylpyrazole [219] | 275.00 | 222.35 | 223.04 | −0.69 | −0.31 |
| 288.20 | 227.50 | 230.51 | −3.01 | −1.32 | |
| 298.15 | 231.60 | 236.50 | −4.90 | −2.12 | |
| 308.20 | 235.70 | 238.92 | −3.22 | −1.37 | |
| 325.00 | 236.19 | 242.97 | −6.78 | −2.87 | |
| 1-Octanol [44] | 250.00 | 251.00 | 269.85 | −18.85 | −7.51 |
| 260.00 | 268.00 | 284.08 | −16.08 | −6.00 | |
| 275.00 | 285.00 | 305.43 | −20.43 | −7.17 | |
| 290.00 | 298.00 | 315.00 | −17.00 | −5.70 | |
| 298.15 | 312.10 | 319.6 | −8.10 | −2.60 | |
| 310.00 | 317.50 | 332.32 | −14.82 | −4.67 | |
| 325.00 | 336.00 | 347.66 | −11.66 | −3.47 | |
| 340.00 | 355.60 | 362.33 | −6.73 | −1.89 | |
| 350.00 | 368.30 | 372.11 | −3.81 | −1.04 |
| Example | T/K | Cp(sol,T) exp | Cp(sol,T) calc | Deviation | Dev in % |
|---|---|---|---|---|---|
| 3,4-Dimethoxyphenylacetonitrile [195] | 250.00 | 208.4 | 204.2 | 4.2 | 2.01 |
| 265.00 | 218.2 | 213.3 | 4.9 | 2.26 | |
| 275.00 | 225.2 | 219.3 | 5.9 | 2.61 | |
| 280.00 | 228.8 | 222.5 | 6.3 | 2.77 | |
| 290.00 | 236.6 | 228.8 | 7.8 | 3.31 | |
| 298.15 | 243.5 | 233.9 | 9.6 | 3.94 | |
| 310.00 | 254.8 | 240.5 | 14.3 | 5.62 | |
| 320.00 | 265.6 | 246.0 | 19.6 | 7.37 | |
| 325.00 | * | 248.8 | |||
| 2-Pyrazinecarboxylic acid [116] | 250.00 | 125.2 | 118.3 | 6.9 | 5.52 |
| 260.00 | 129.0 | 125.4 | 3.6 | 2.81 | |
| 275.00 | 134.3 | 136.0 | −1.7 | −1.30 | |
| 290.00 | 140.2 | 140.5 | −0.3 | −0.24 | |
| 298.15 | 143.2 | 143.0 | 0.2 | 0.14 | |
| 310.00 | 147.5 | 148.4 | −0.9 | −0.63 | |
| 325.00 | 153.1 | 155.3 | −2.2 | −1.46 | |
| 340.00 | 158.2 | 159.4 | −1.2 | −0.78 | |
| 350.00 | 161.7 | 162.2 | −0.5 | −0.31 |
© 2019 by the author. Licensee MDPI, Basel, Switzerland. This article is an open access article distributed under the terms and conditions of the Creative Commons Attribution (CC BY) license (http://creativecommons.org/licenses/by/4.0/).
Share and Cite
Naef, R. Calculation of the Isobaric Heat Capacities of the Liquid and Solid Phase of Organic Compounds at and around 298.15 K Based on Their “True” Molecular Volume. Molecules 2019, 24, 1626. https://doi.org/10.3390/molecules24081626
Naef R. Calculation of the Isobaric Heat Capacities of the Liquid and Solid Phase of Organic Compounds at and around 298.15 K Based on Their “True” Molecular Volume. Molecules. 2019; 24(8):1626. https://doi.org/10.3390/molecules24081626
Chicago/Turabian StyleNaef, Rudolf. 2019. "Calculation of the Isobaric Heat Capacities of the Liquid and Solid Phase of Organic Compounds at and around 298.15 K Based on Their “True” Molecular Volume" Molecules 24, no. 8: 1626. https://doi.org/10.3390/molecules24081626
APA StyleNaef, R. (2019). Calculation of the Isobaric Heat Capacities of the Liquid and Solid Phase of Organic Compounds at and around 298.15 K Based on Their “True” Molecular Volume. Molecules, 24(8), 1626. https://doi.org/10.3390/molecules24081626