Search for New Aggregable Fragments of Human Insulin

 , ,
, ,  ,
,  and
and
Abstract
1. Introduction
2. Results and Discussion
3. Materials and Methods
3.1. Synthesis of Peptides
3.1.1. Loading of the 2-Chlorotrityl Chloride Resin (GP1)
3.1.2. Standard Coupling Procedure (GP 2)
3.1.3. Fmoc- Deprotection (GP 3)
3.1.4. Cleavage from the Resin (GP 4)
3.2. Peptides 1–18 Analysis
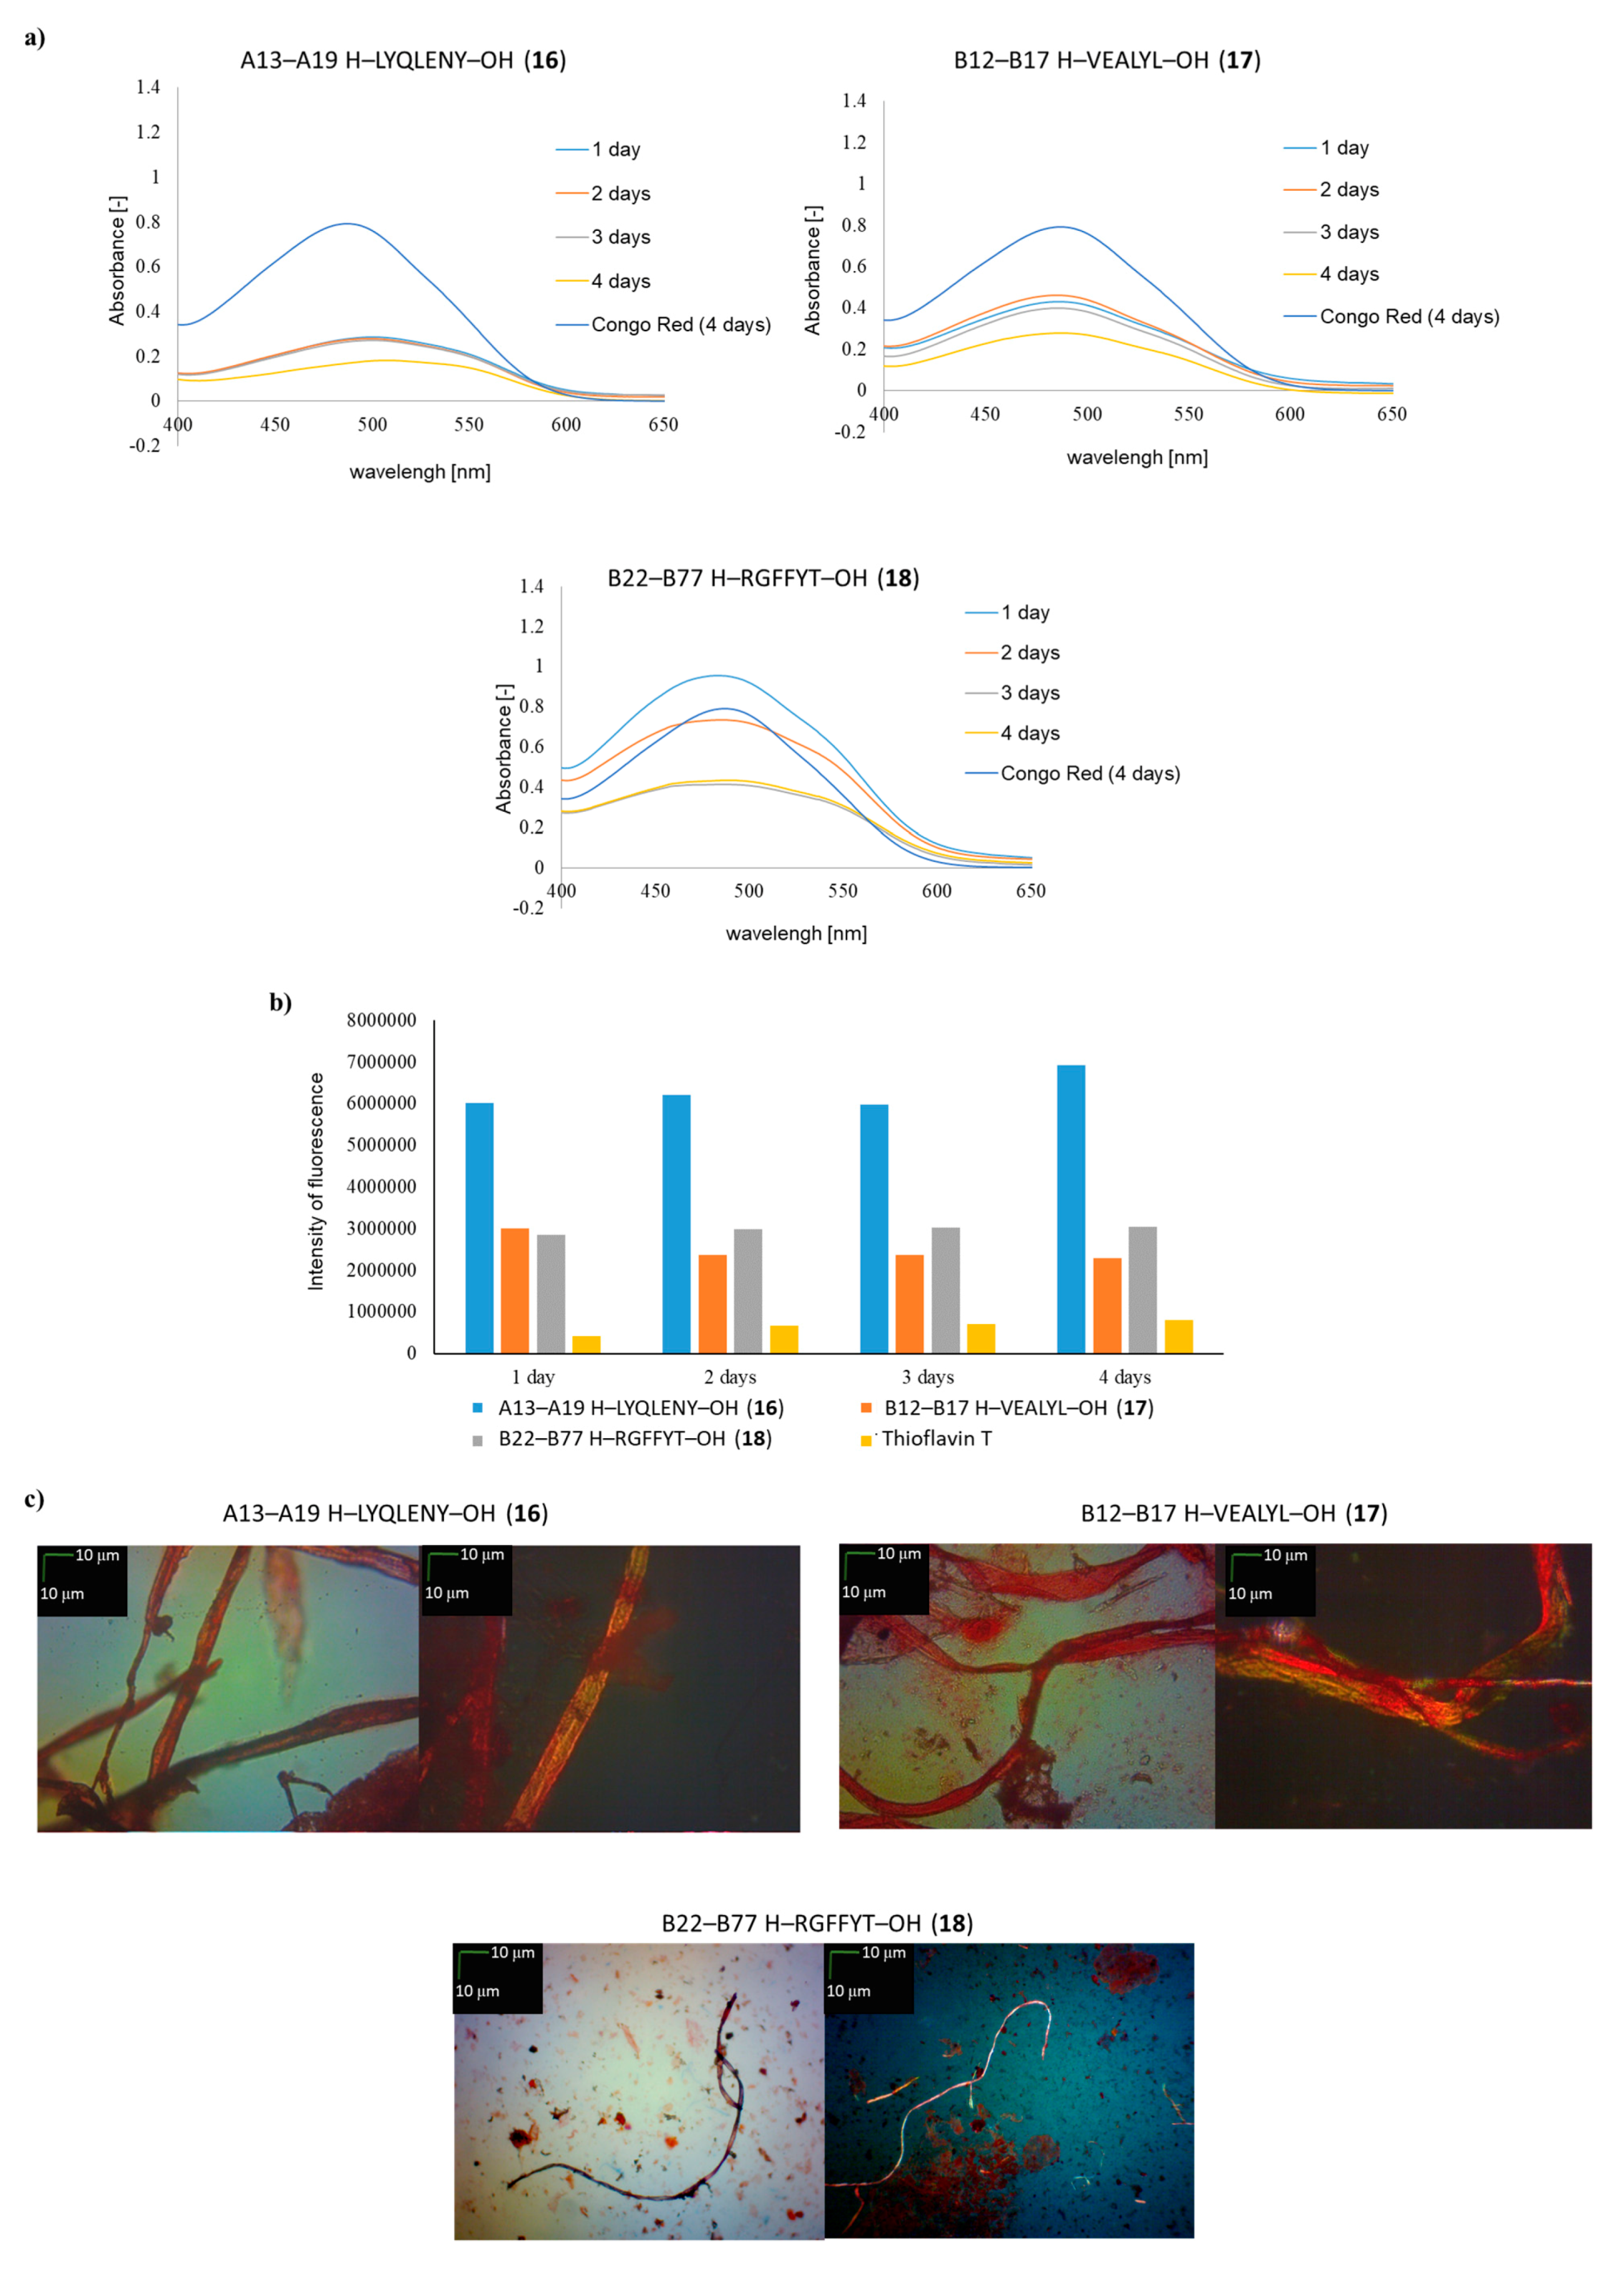
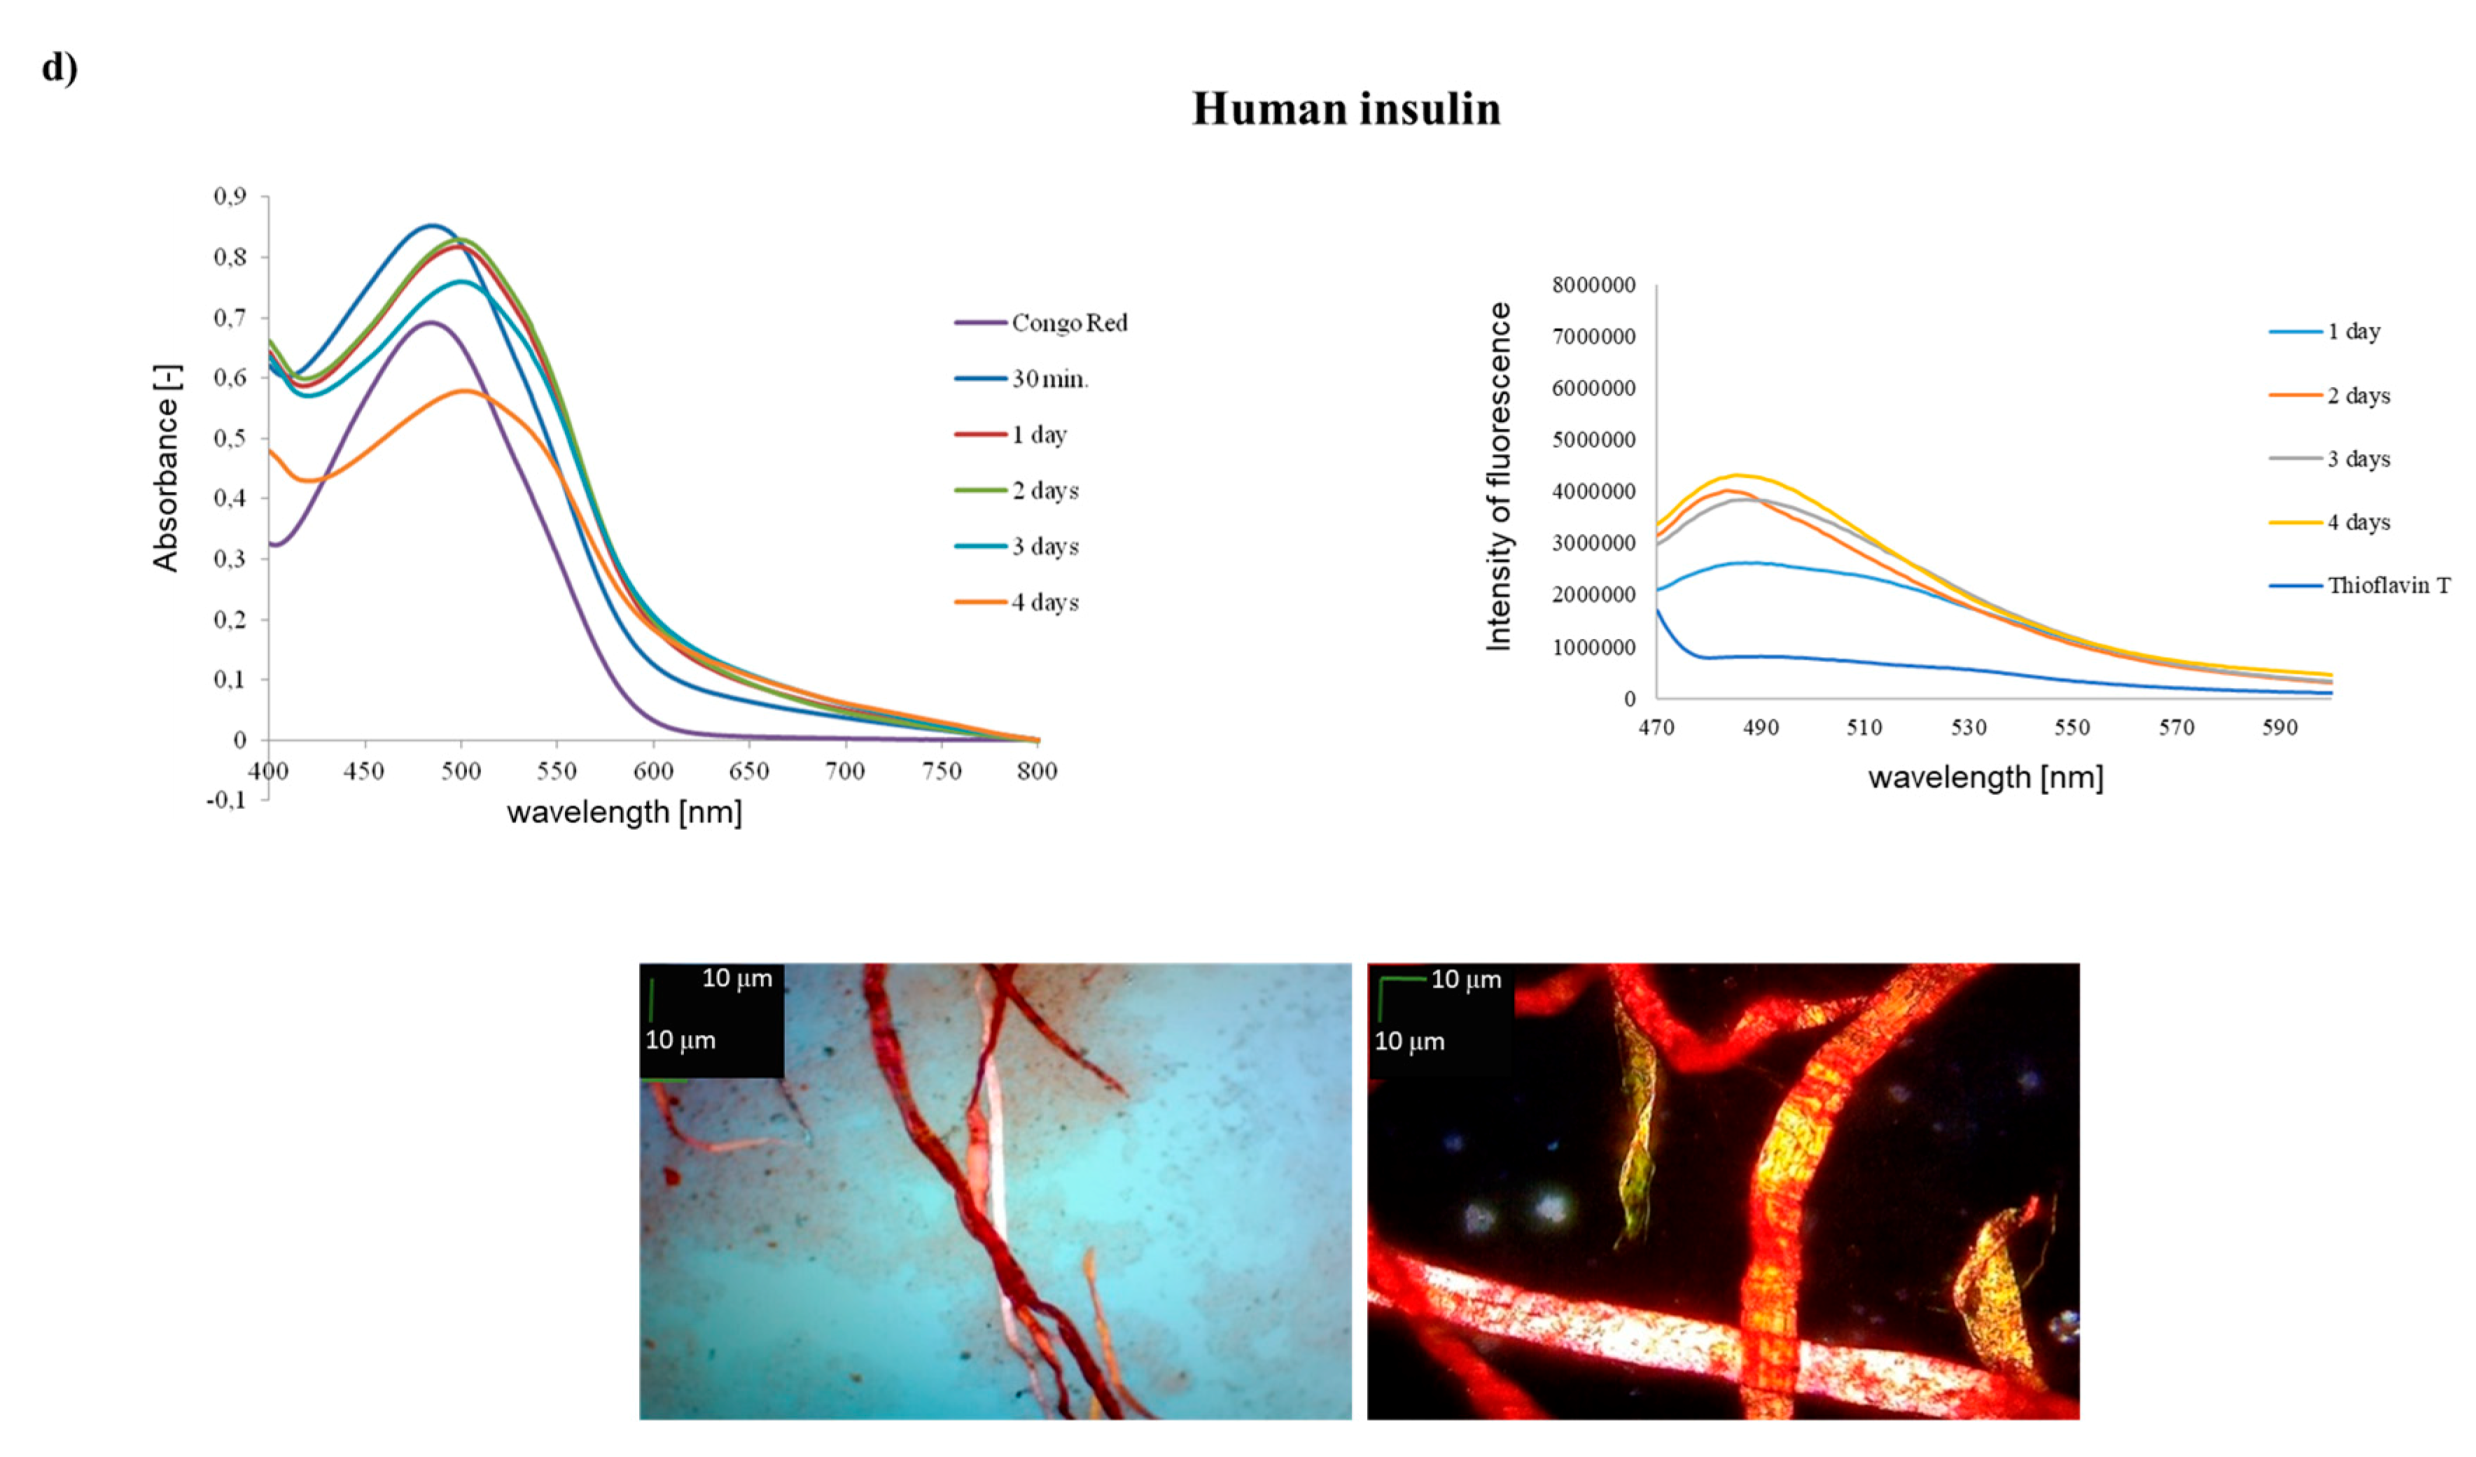
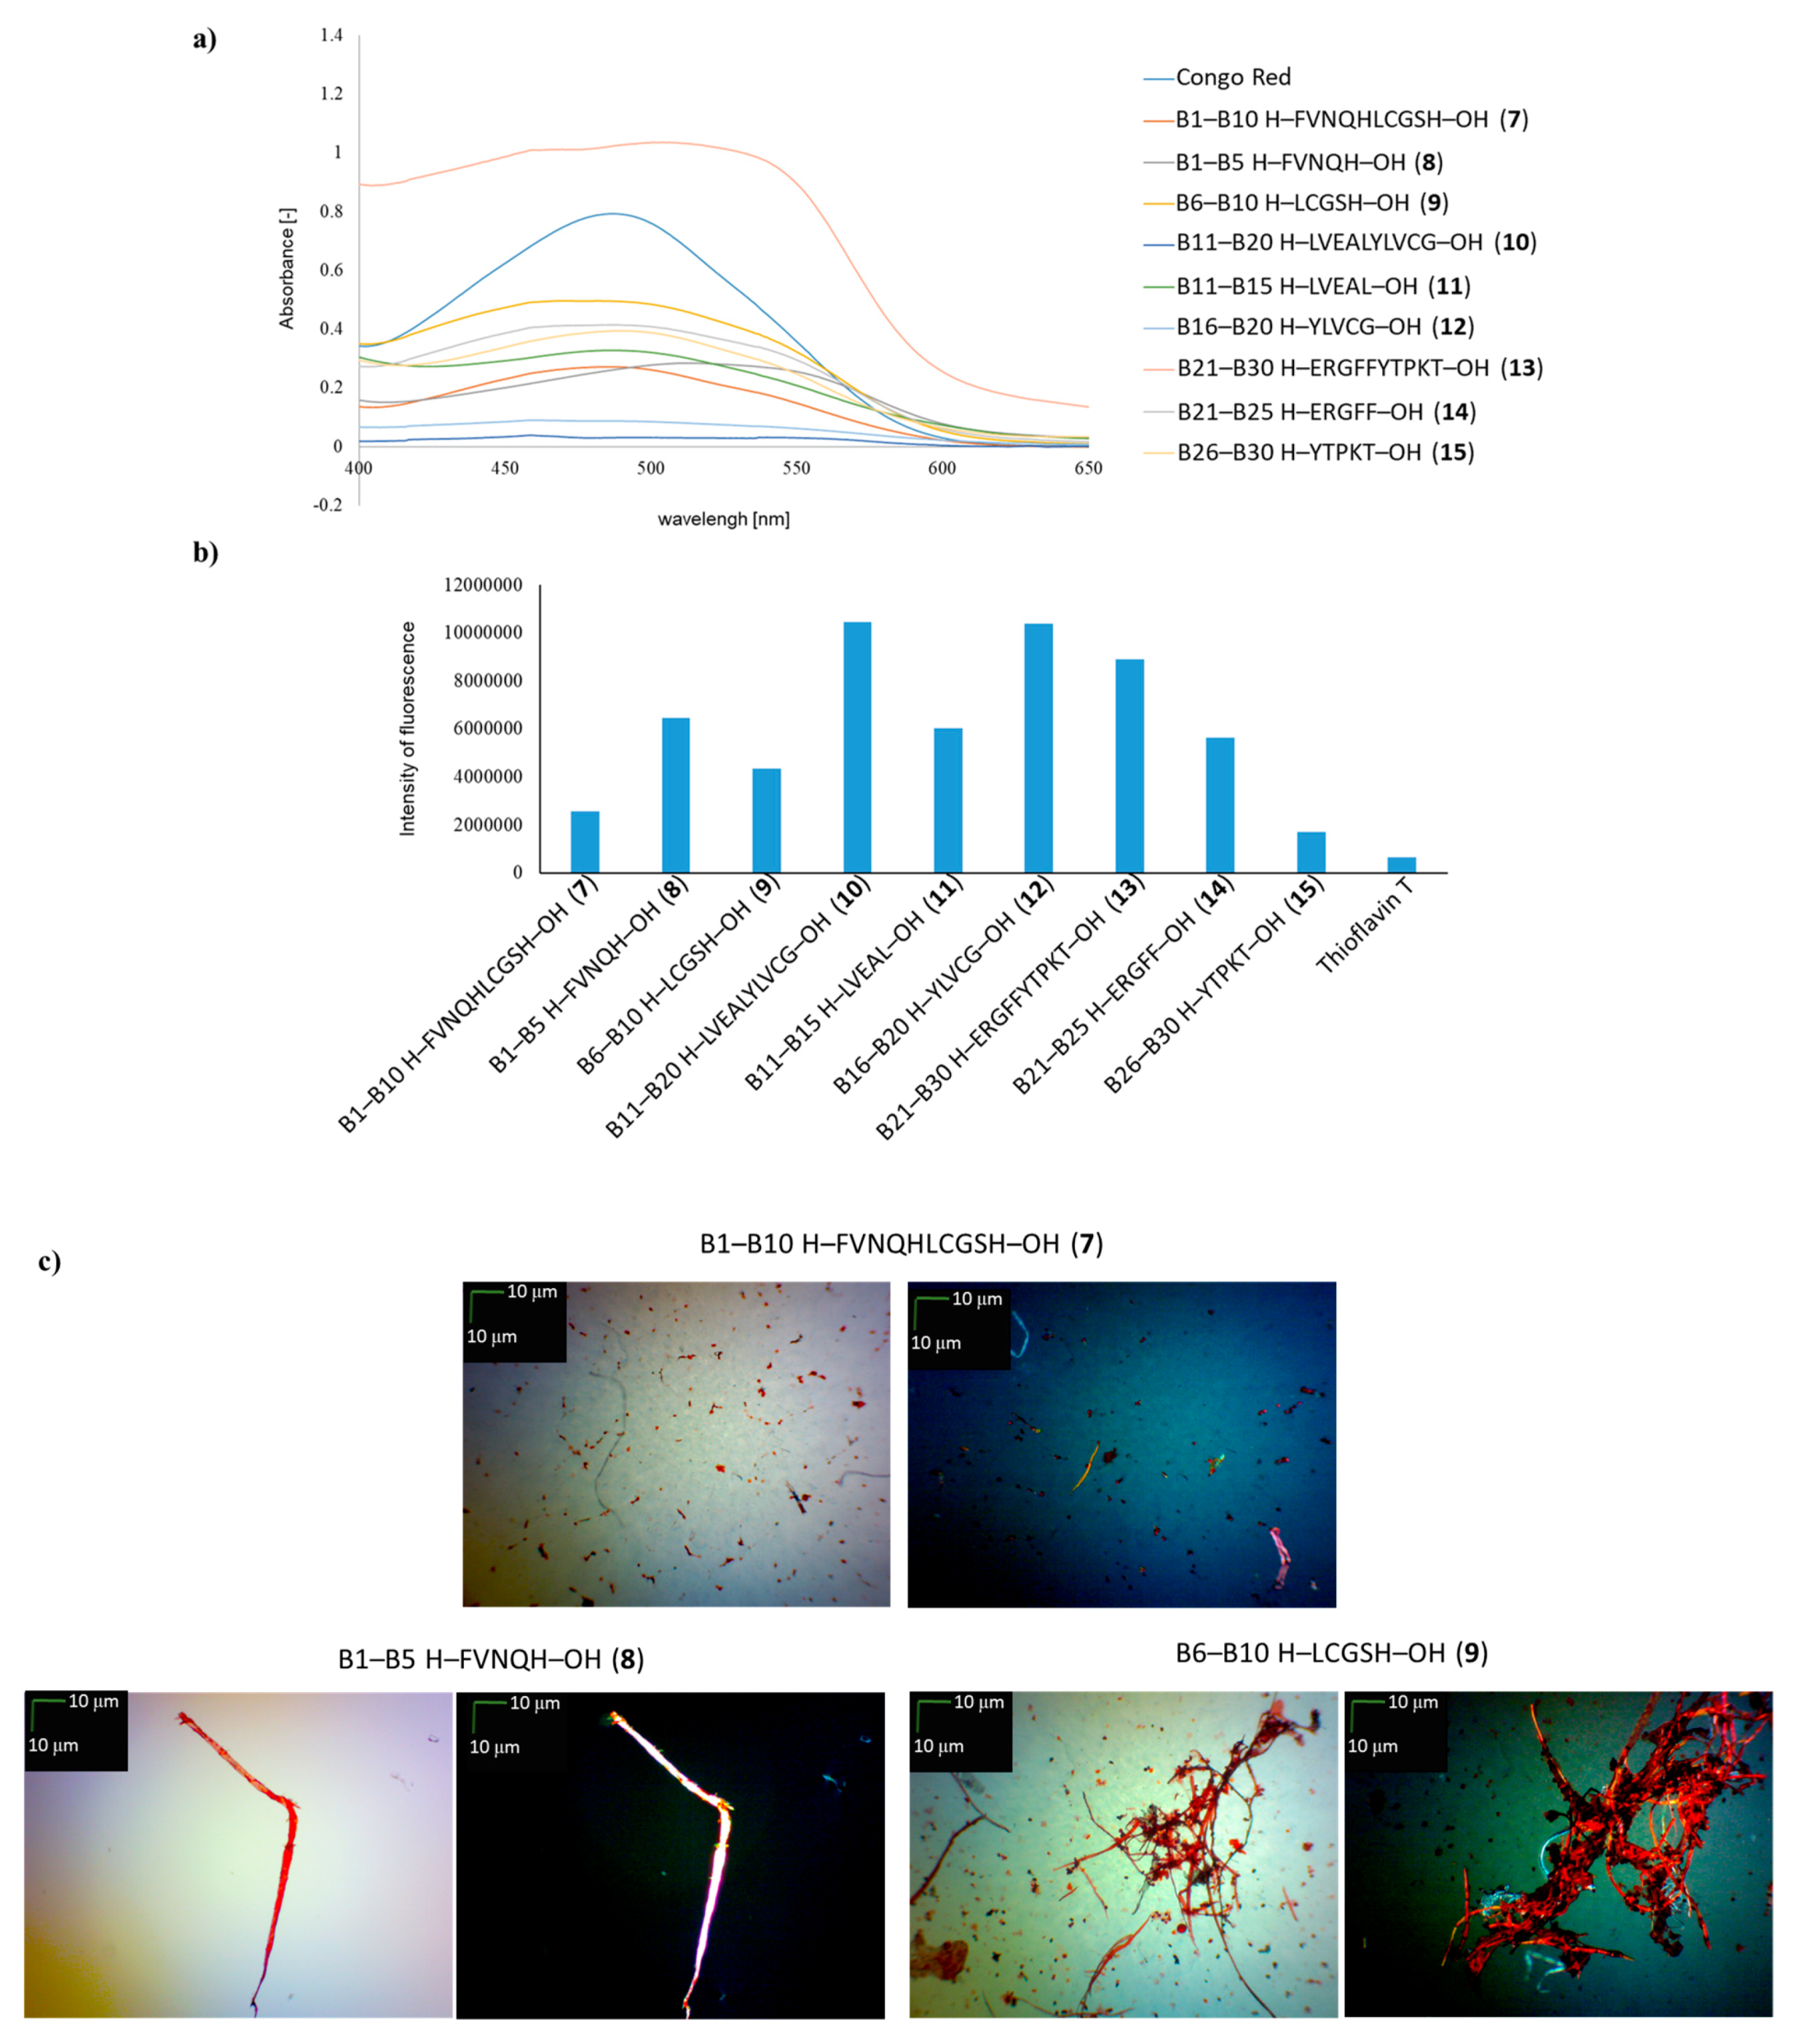
3.3. Spectroscopic Measurements with Congo Red (GP 5)
3.4. Spectroscopic Measurements with Thioflavin T (GP 6)
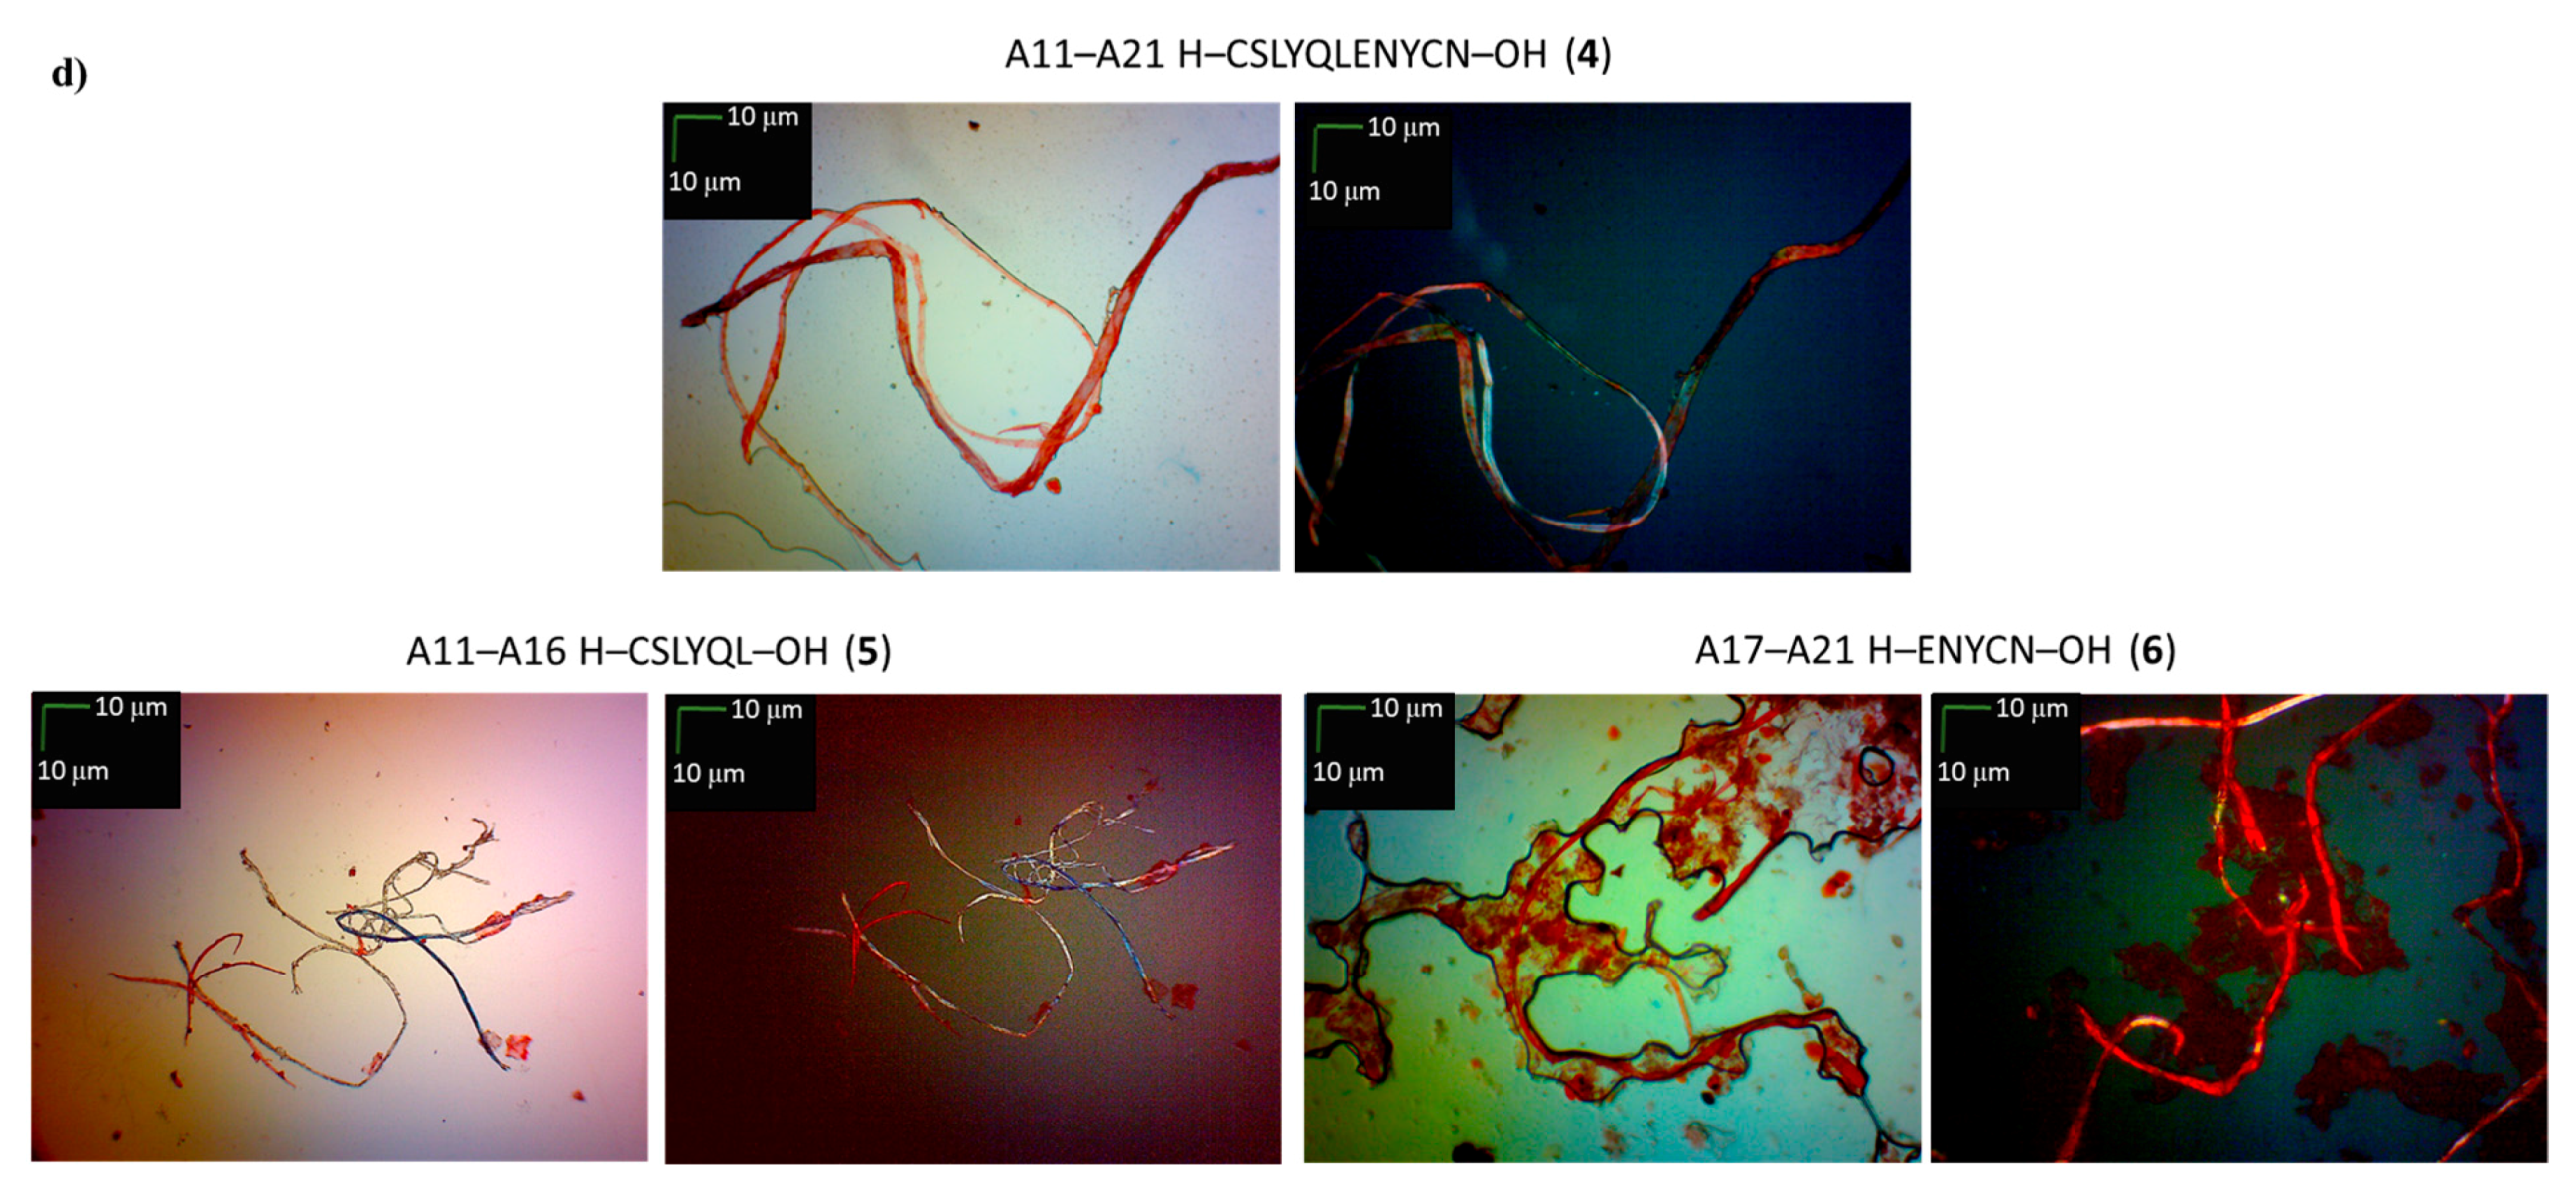
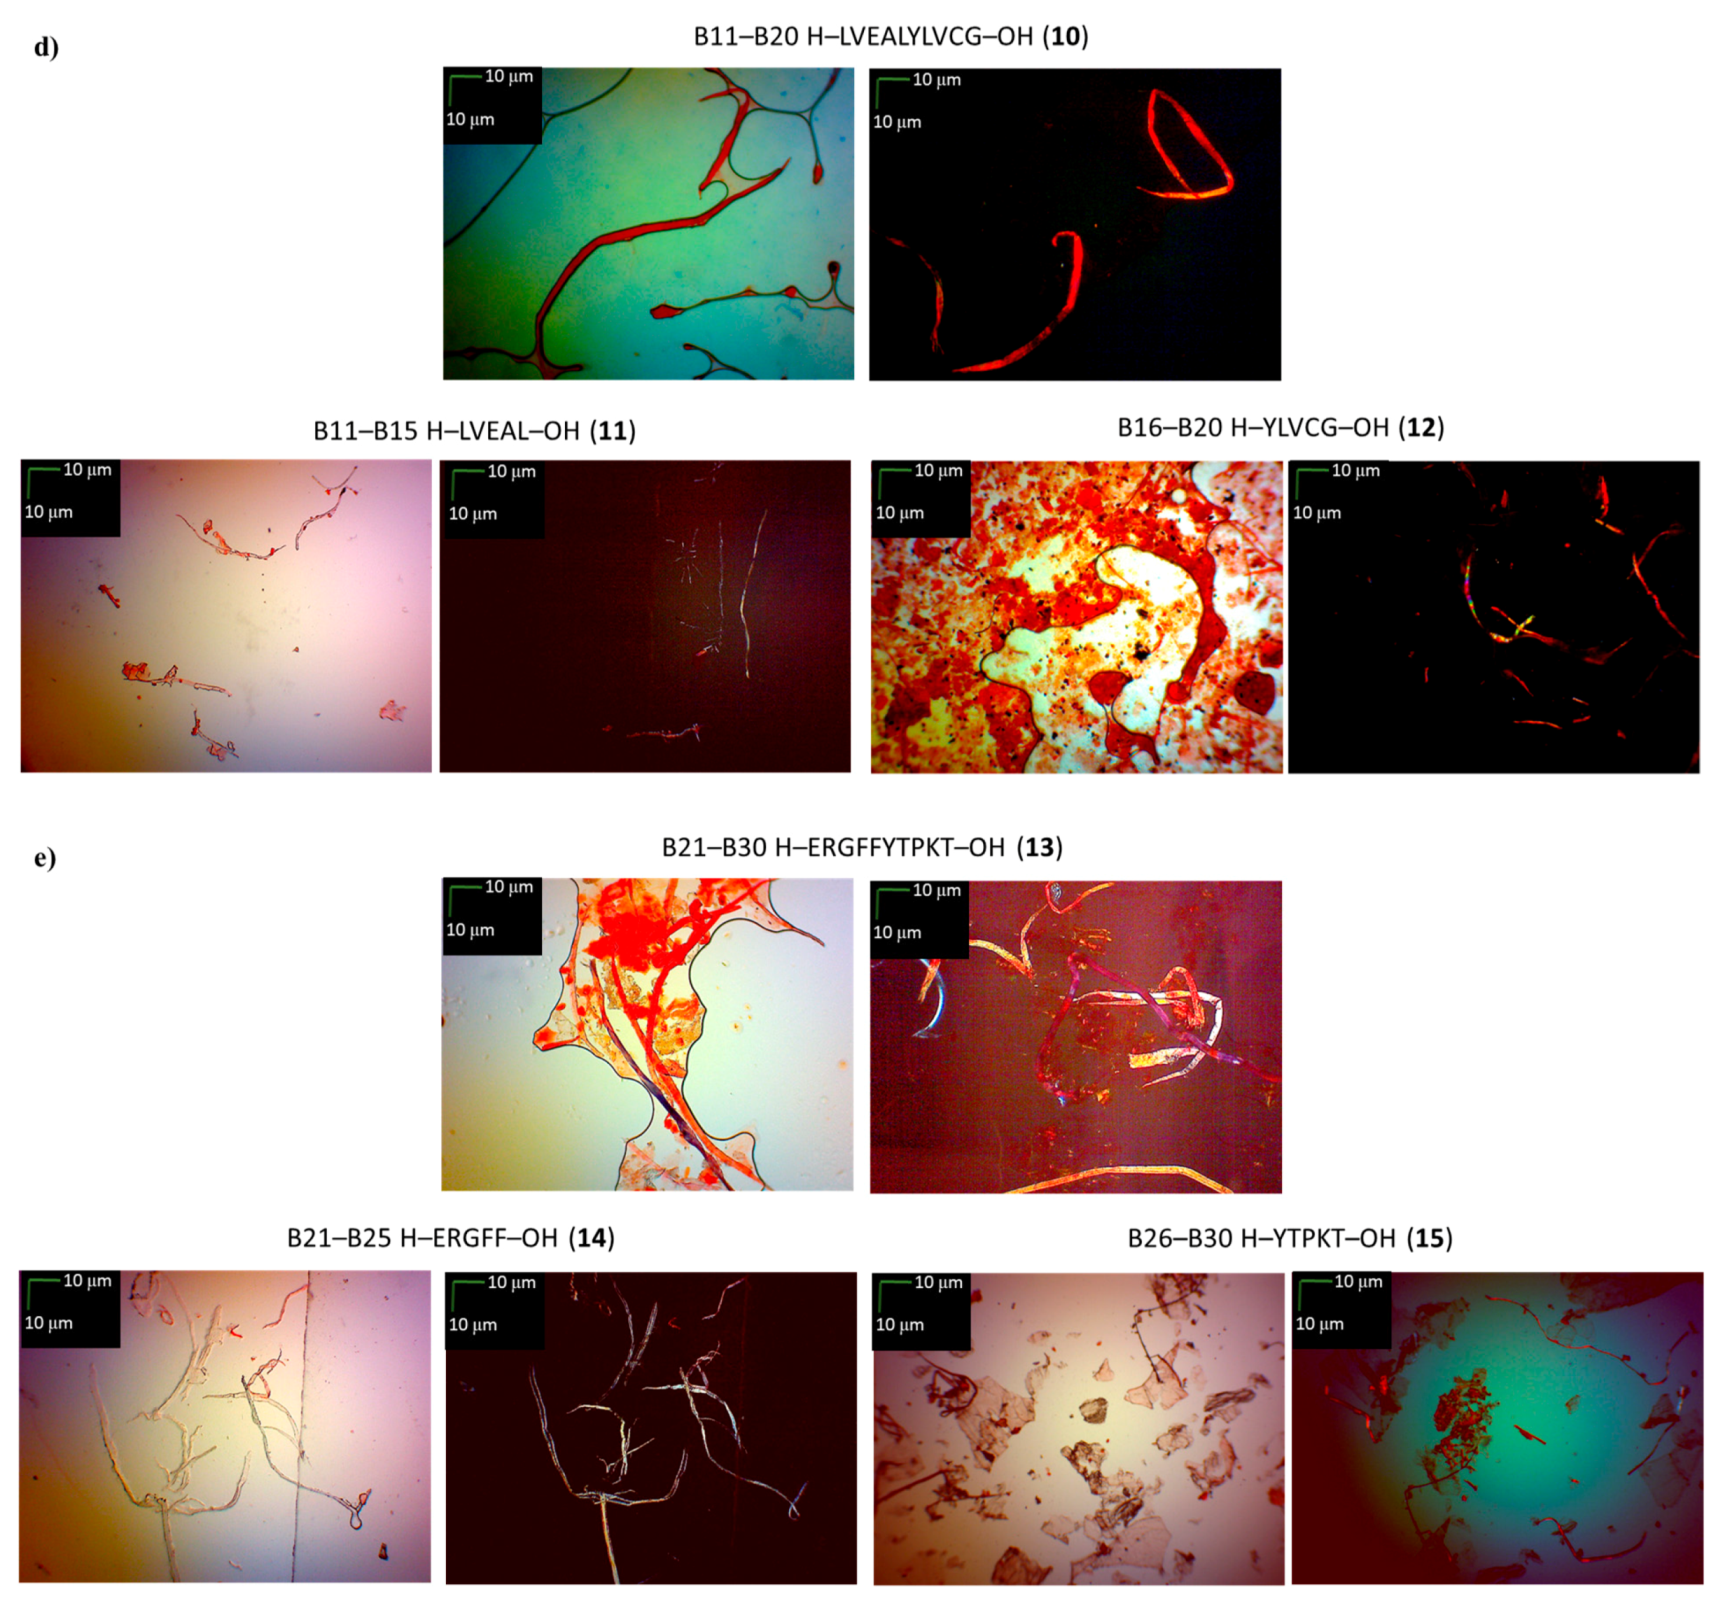
3.5. Microscopic Measurements (GP 7)
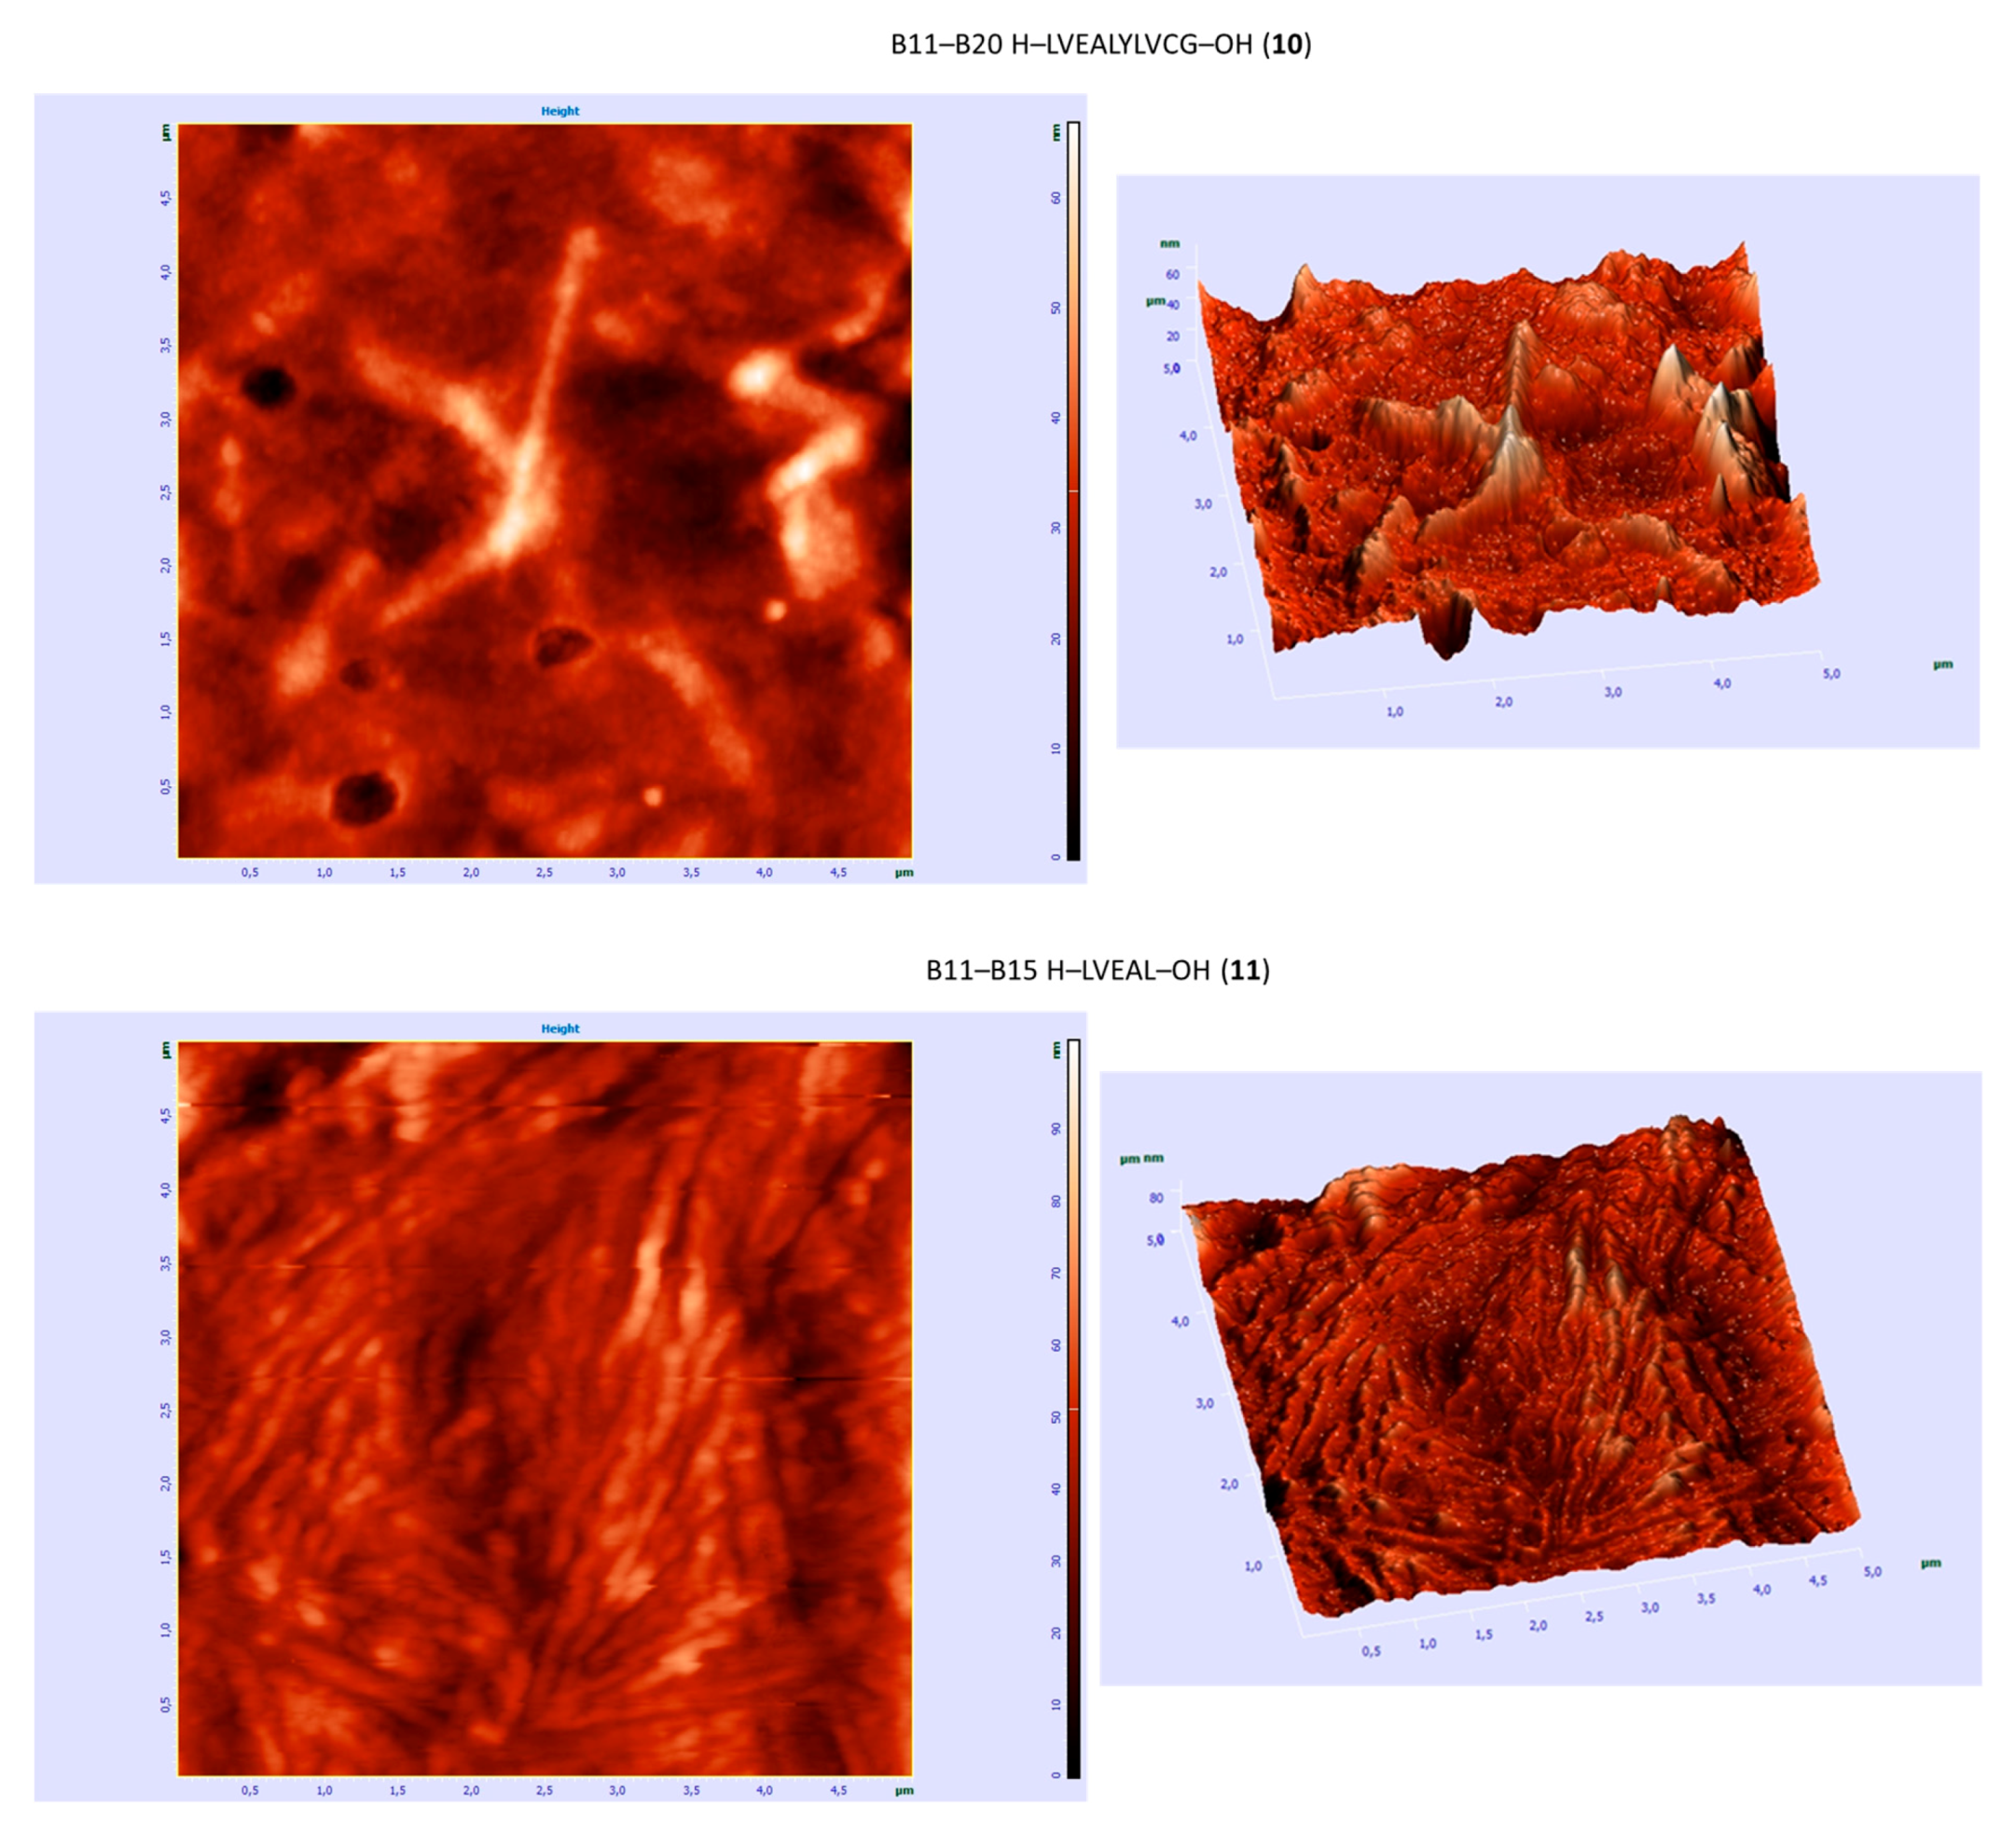
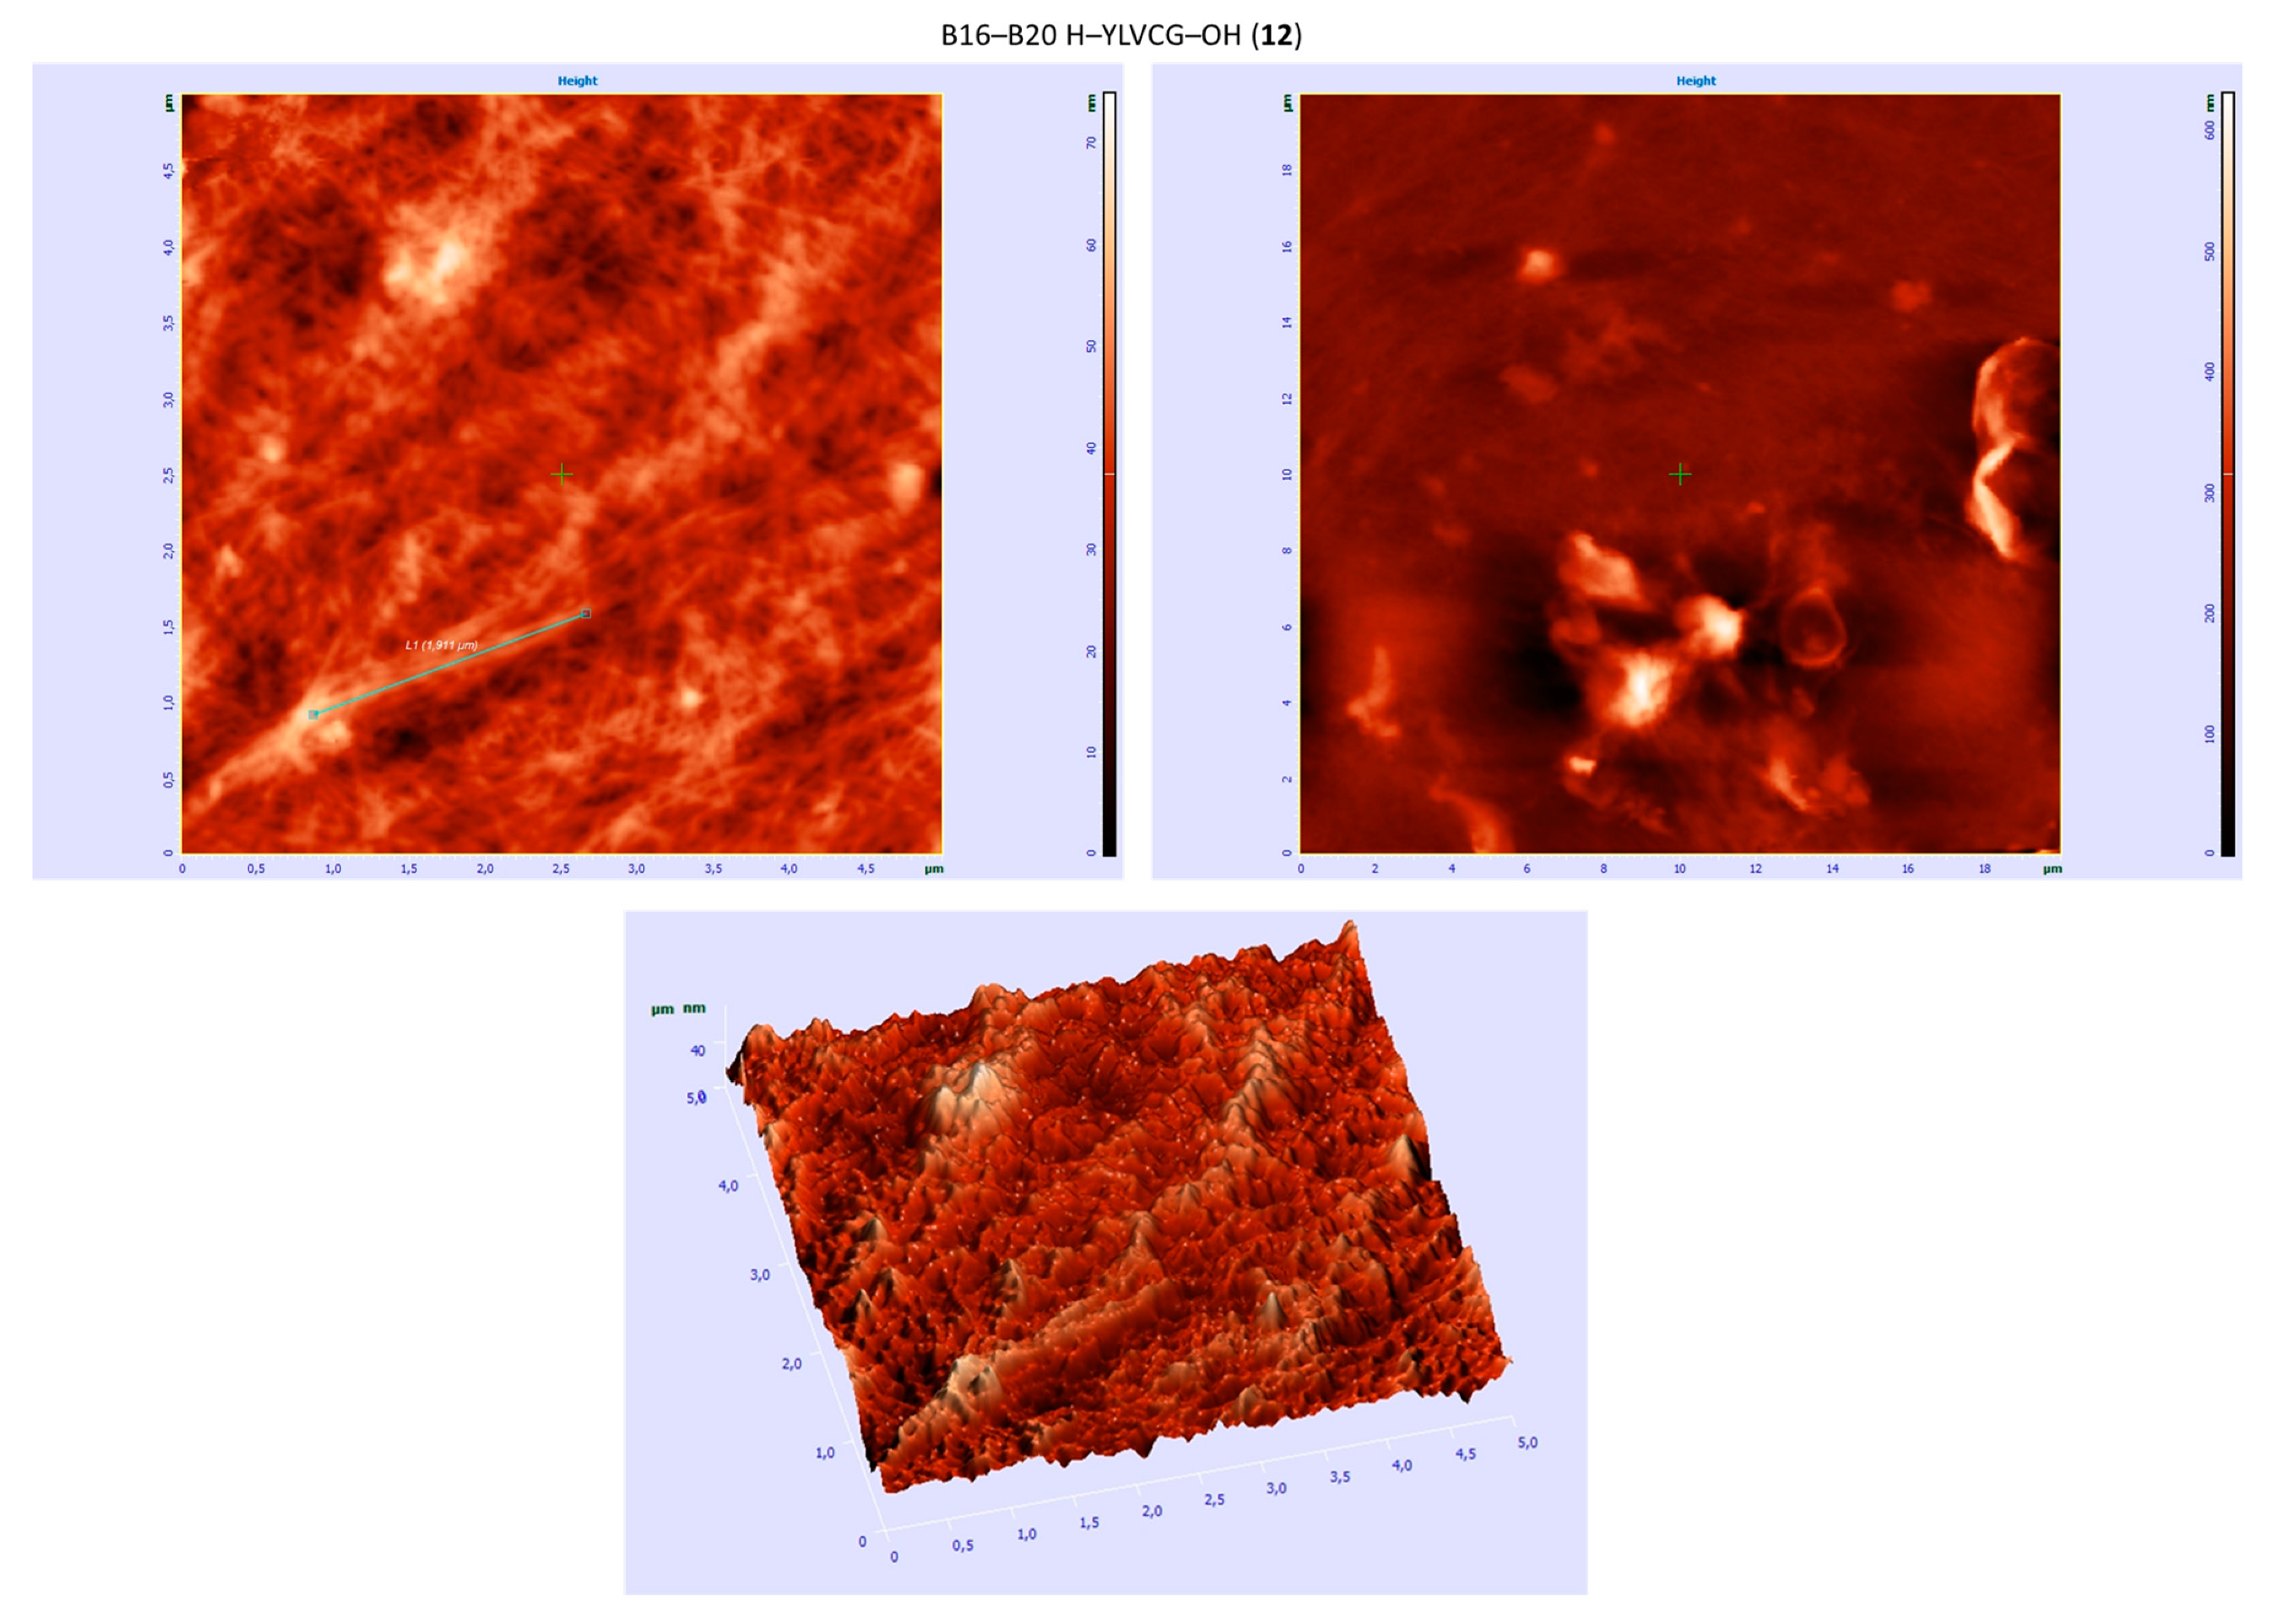
3.6. AFM Studies
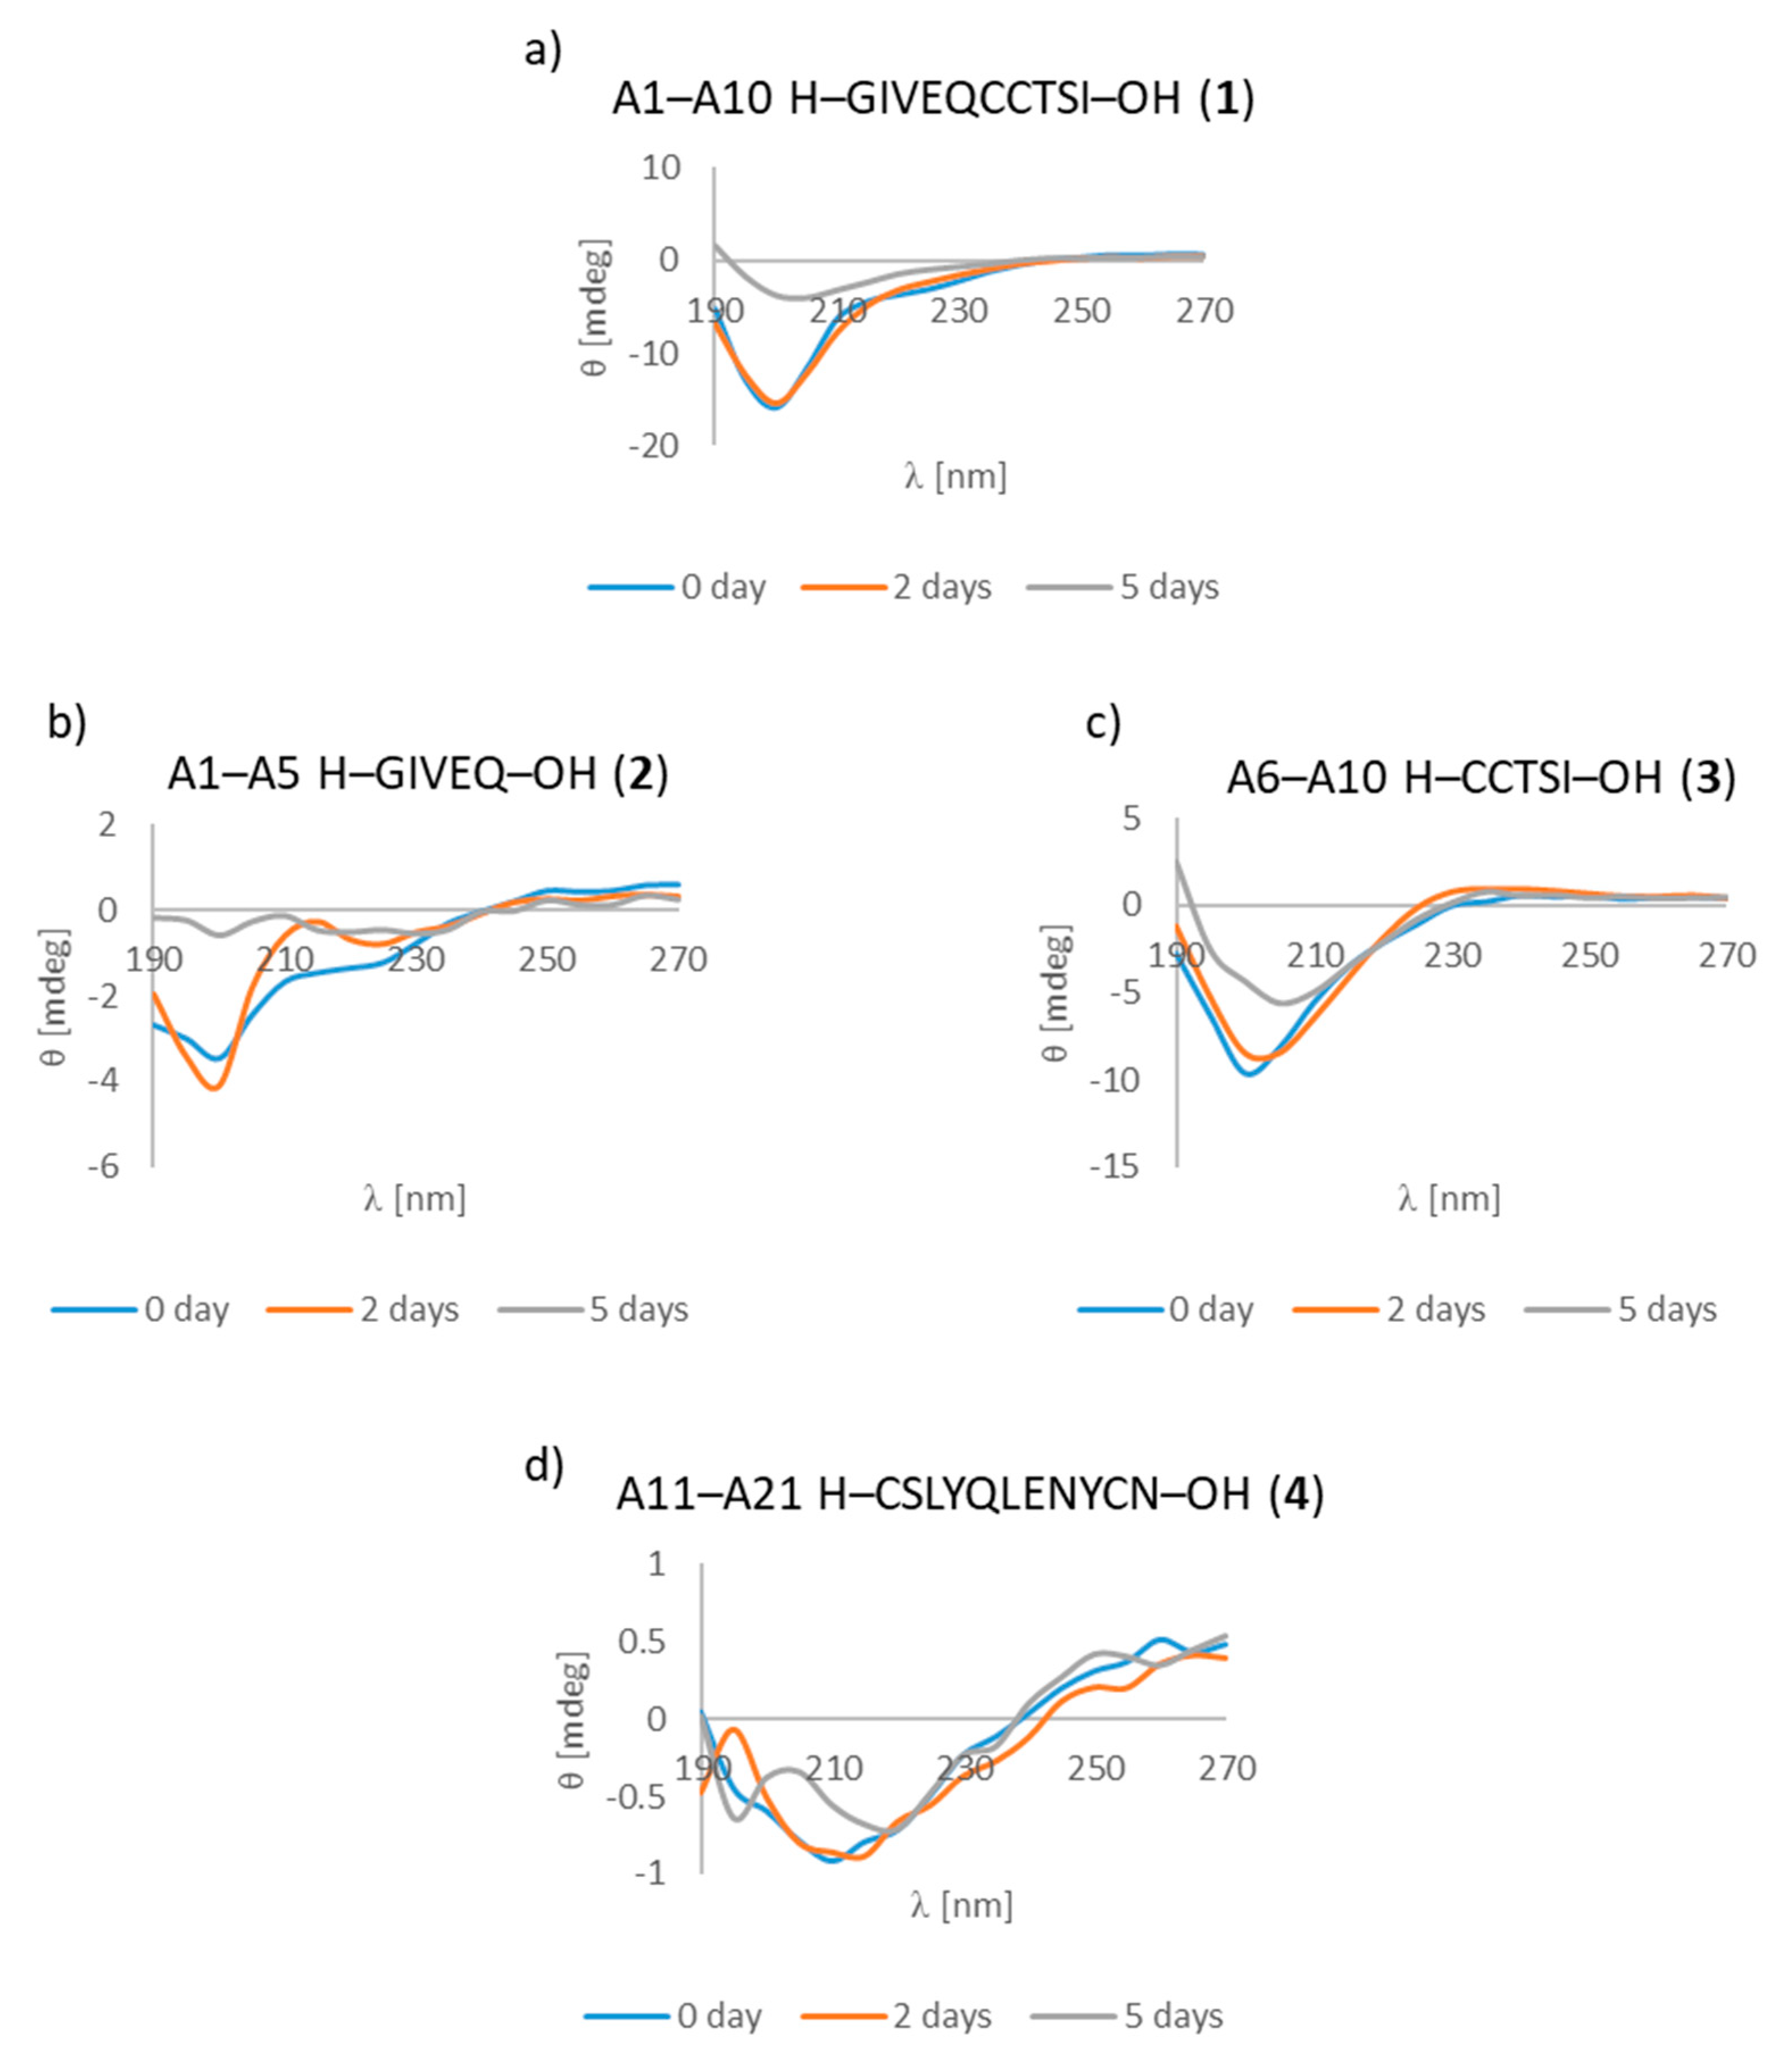
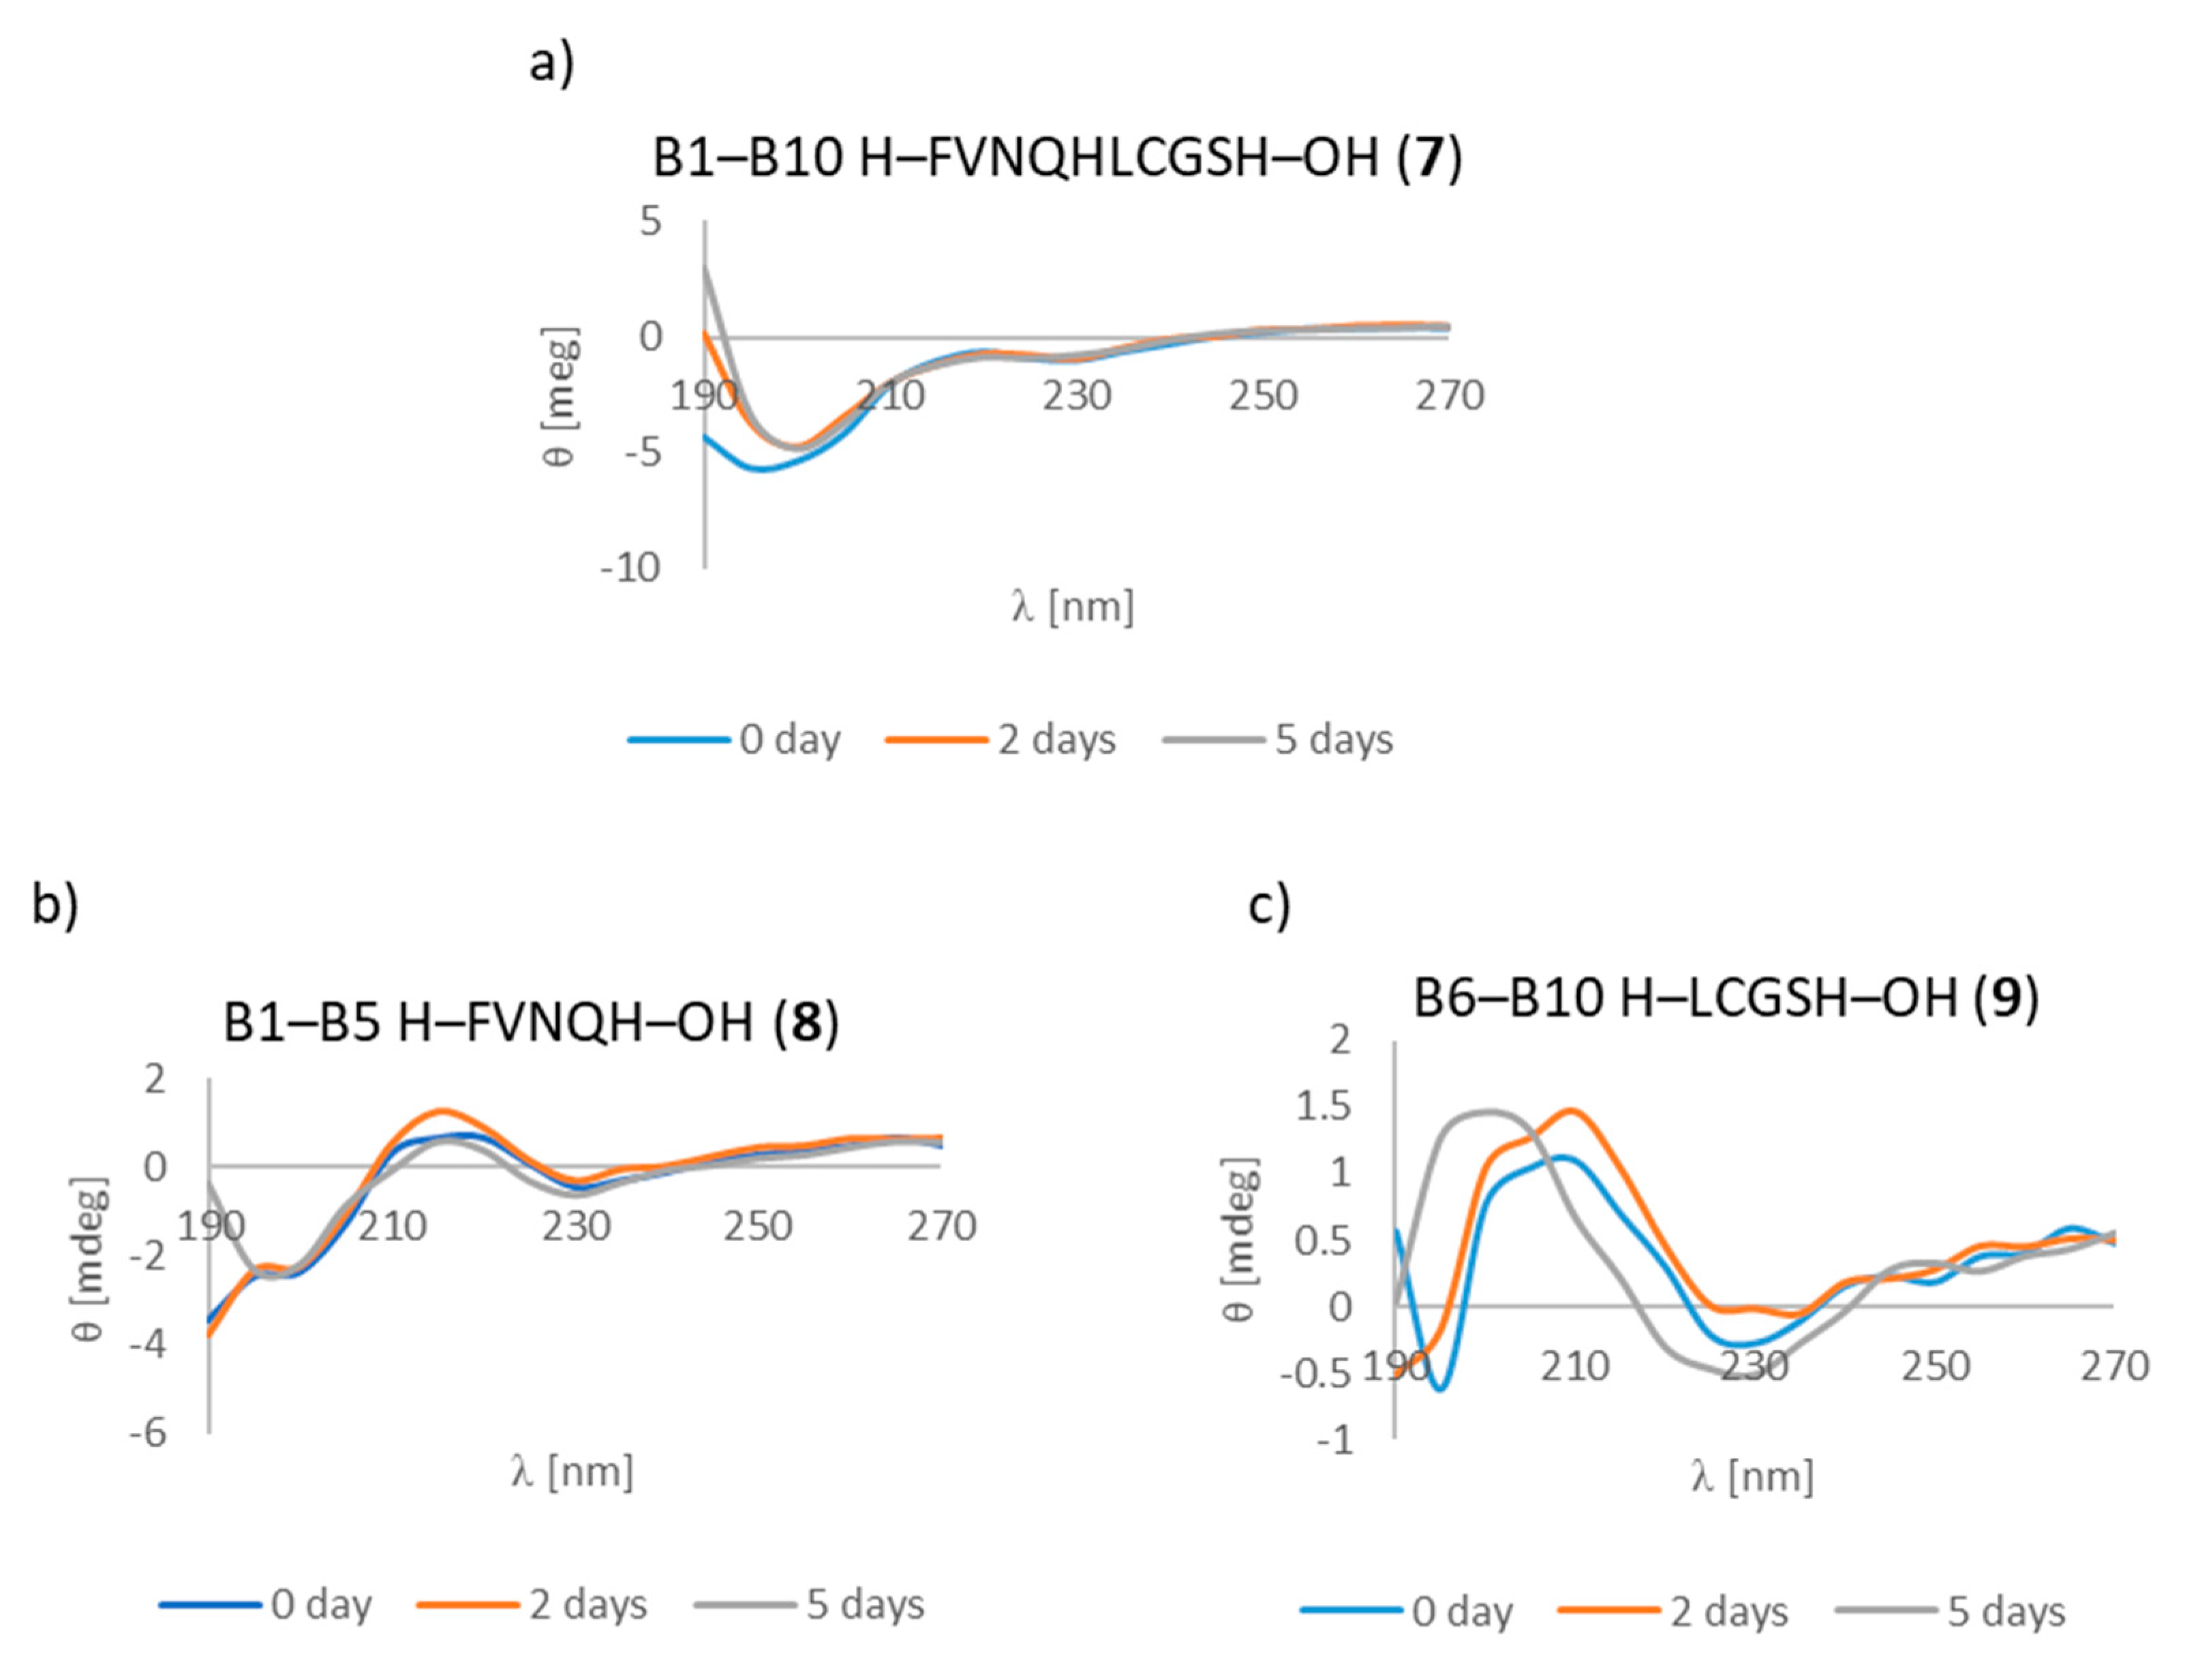
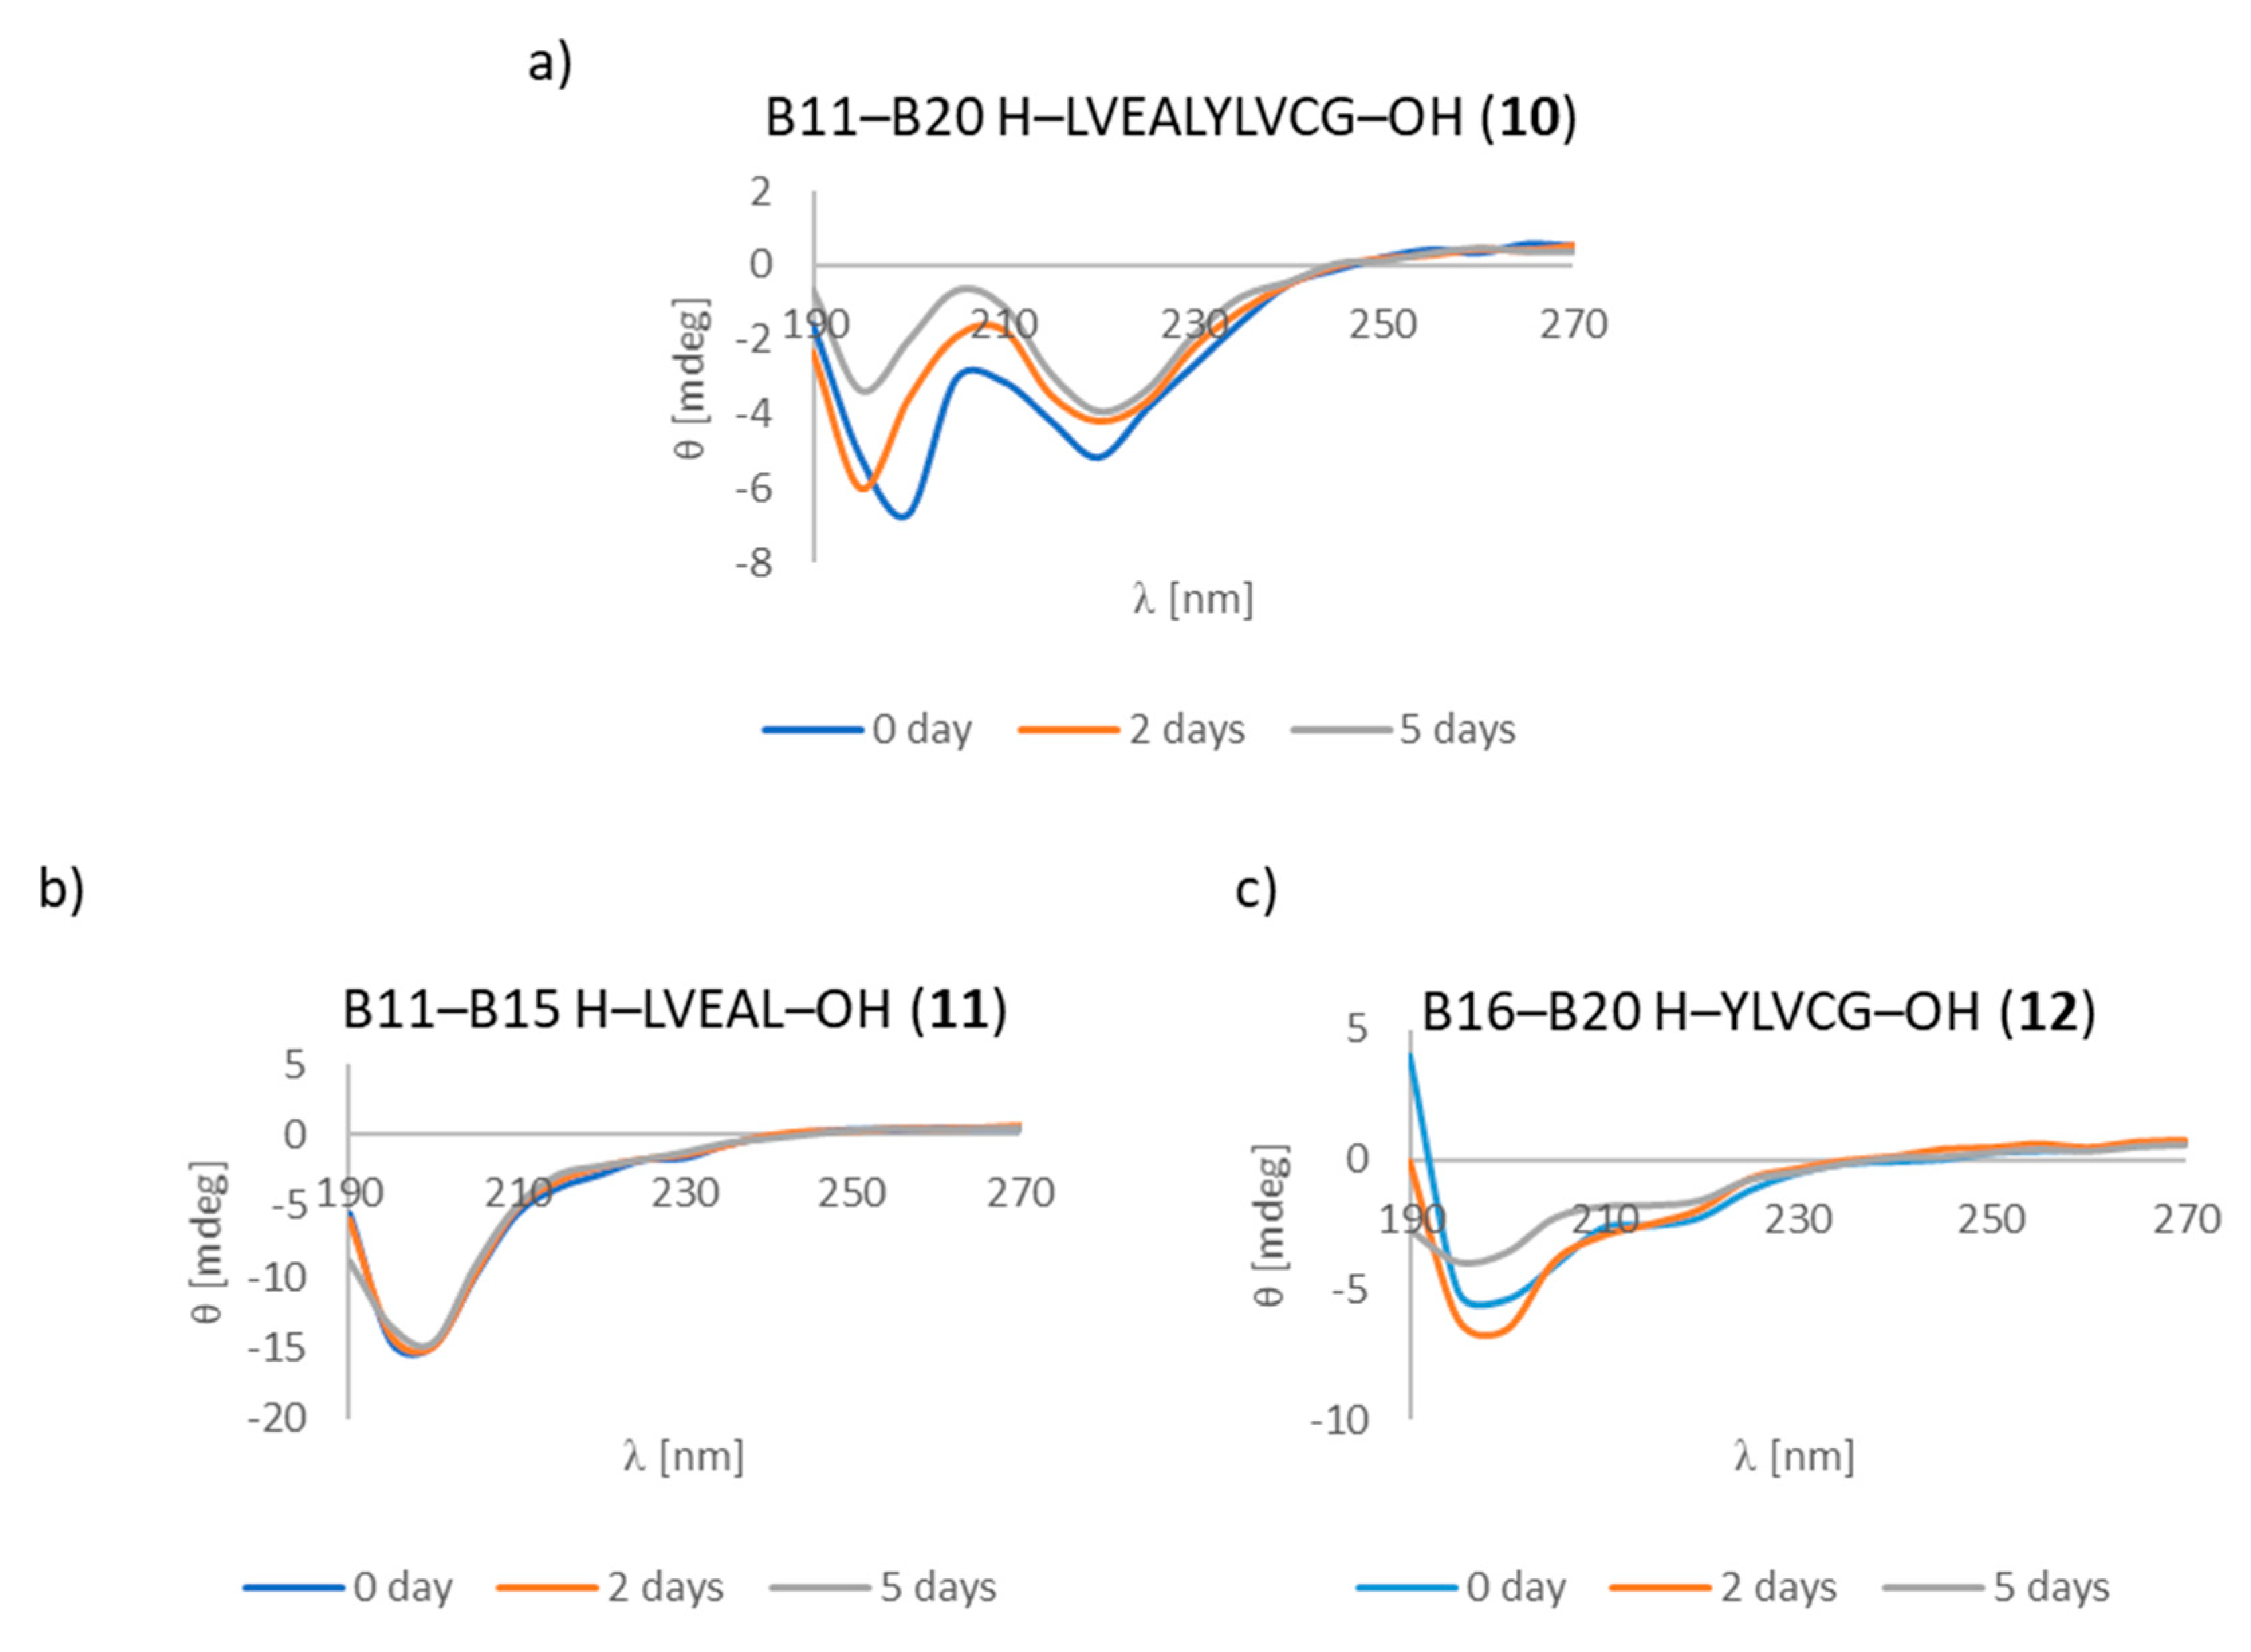
3.7. CD Studies
4. Conclusions
Supplementary Materials
Author Contributions
Funding
Conflicts of Interest
References
- Mandarino, L.J.; Printz, R.L.; Cusi, K.A.; Kinchington, P.; O’Doherty, R.M.; Osawa, H.; Sewell, C.; Consoli, A.; Granner, D.K.; DeFronzo, R.A.; et al. Regulation of hexokinase II and glycogen synthase mRNA protein, and activity in human muscle. Am. J. Physiol. 1995, 269, 701–708. [Google Scholar] [CrossRef] [PubMed]
- Hong, D.P.; Ahmad, A.; Fink, A.L. Fibrillation of Human Insulin A and B Chains. Biochemistry 2006, 45, 9342–9353. [Google Scholar] [CrossRef]
- Tycko, R. Progress towards a molecular-level structural understanding of amyloid fibrils. Struct. Biol. 2004, 14, 96–103. [Google Scholar] [CrossRef]
- Nielsen, L.; Frokjaer, S.; Brange, J.; Uversky, V.N.; Fink, A.L. Probing the mechanism of insulin fibril formation with insulin mutants. Biochemistry 2001, 40, 8397–8409. [Google Scholar] [CrossRef] [PubMed]
- Luca, S.; Yau, W.; Leapman, R.; Tycko, R. Peptide conformation and supramolecular organization in amylin fibrils: Constraints from solid-state NMR. Biochemistry 2007, 46, 13505–13522. [Google Scholar] [CrossRef]
- Herczenik, E.; Gebbink, M.F.B.G. Review: Molecular and cellular aspects of protein misfolding and disease. FASEB J. 2008, 22, 2115–2133. [Google Scholar] [CrossRef] [PubMed]
- Westmark, P.; Benson, M.D.; Buxbaum, J.N.; Cohen, A.S.; Frangione, B.; Ikeda, S.; Masters, C.L.; Merlini, G.; Saraiva, M.J.; Sipe, J.D. Amyloid: Toward terminology clarification. Report from the Nomenclature Committee of the International Society of Amyloidosis. Amyloid 2005, 12, 1–4. [Google Scholar] [CrossRef]
- Dathe, M.; Gast, K.; Zirwer, D.; Welfle, H.; Mahlis, B. Insulin aggregation in solution. Int. J. Pept. Protein Res. 1990, 36, 344–349. [Google Scholar] [CrossRef]
- Störkel, S.; Schneider, H.M.; Müntefering, H.; Kashiwagi, S. Iatrogenic, insulin-dependent, local amyloidosis. Lab. Invest. 1983, 48, 108–111. [Google Scholar]
- Swift, B.; Hawkins, P.N.; Richards, C.; Gregory, R. Examination of insulin injection sites: An unexpected finding of localized amyloidosis. Diabetic Med. 2002, 19, 881–886. [Google Scholar] [CrossRef]
- Sunde, M.; Blake, C.C.F. From the globular to the fibrous state: Protein structure and structural conversion in amyloid formation. Q. Rev. Biophys. 1998, 31, 1–39. [Google Scholar] [CrossRef]
- Whittingham, J.L.; Scott, D.J.; Wilson, K.C.A.; Finch, J.; Brange, J.; Dodson, G.G. Insulin at pH 2: Structural Analysis of the Conditions Promoting Insulin Fibre Formation. J. Mol. Biol. 2002, 318, 479–490. [Google Scholar] [CrossRef]
- Cohen, A.S.; Calkins, E. Electron microscopic observations on fibrous component in amyloid of diverse origins. Nature 1959, 183, 1202–1203. [Google Scholar] [CrossRef]
- Gibson, T.J.; Murphy, R.M. Inhibition of insulin fibrillogenesis with targeted peptides. Protein Sci. 2006, 15, 1133–1141. [Google Scholar] [CrossRef]
- Ivanova, M.I.; Thompson, M.J.; Eisenberg, D. A systematic screen of beta(2)- microglobulin and insulin for amyloid-like segments. PNAS 2006, 103, 4079–4082. [Google Scholar] [CrossRef]
- Swiontek, M.; Kaminski, Z.J.; Kolesinska, B.; Seebach, D. Visible-Light Microscopic Discovery of up to 150 μm Long Helical Amyloid Fibrils built of the Dodecapeptide H-(Val-Ala-Leu)4-OH and of Decapeptides Derived from Insulin. Chem. Biodiv. 2016, 13, 1111–1117. [Google Scholar] [CrossRef]
- Swiontek, M.; Rozniakowski, K.; Fraczyk, J.; Lipinski, W.; Galecki, K.; Wysocki, S.; Dupont, B.G.R.; Kaminski, Z.J.; Kolesinska, B. The quest for the shortest fragments of A (13-19) and B (12-17) responsible for the aggregation of human insulin. Nanomedicine 2016, 11, 2083–2101. [Google Scholar] [CrossRef]
- Ivanova, M.J.; Sievers, S.A.; Sawaya, M.R.; Wall, J.S.; Eisenberg, D. Molecular basis for insulin fibril assembly. Proc. Natl. Acad. Sci. USA 2009, 106, 18990–18995. [Google Scholar] [CrossRef] [PubMed]
- Sawaya, M.R.; Sambashivan, S.; Nelson, R.; Ivanova, M.I.; Sievers, S.A.; Apostol, M.I.; Thompson, M.J.; Balbirnie, M.; Wiltzius, J.J.; McFarlane, H.T.; et al. Atomic structures of amyloid cross-beta spines reveal varied steric zippers. Nature 2007, 447, 453–457. [Google Scholar] [CrossRef]
- Sambashivan, S.; Liu, Y.; Sawaya, M.R.; Gingery, M.; Eisenberg, D. Amyloid-like fibrils of ribonuclease A with three-dimensional domain-swapped and native-like structure. Nature 2005, 437, 266–269. [Google Scholar] [CrossRef]
- Berhanv, W.M.; Masunow, A. Controlling the aggregation and rate of release in order to improve insulin formulation, MD study of full-length insulin amyloid models. J. Mol. Model. 2012, 18, 1129–1142. [Google Scholar] [CrossRef]
- Chiang, H.L.; Tungo Ngo, S.; Chen, C.J.; Hu, C.K.; Suan Li, M. Oligomerization of peptides LVEALYL and RGFFYT and their binding affinity to insulin. PLoS ONE 2013, 8, e65358. [Google Scholar] [CrossRef] [PubMed]
- Kolesinska, B.; Rozniakowski, K.K.; Fraczyk, J.; Relich, I.; Papini, A.M.; Kaminski, Z.J. The effect of counterion and tertiary amine on the efficiency of N-triazinylammonium sulfonates in solution and solid-phase peptide synthesis. Eur. J. Org. Chem. 2015, 401–408. [Google Scholar] [CrossRef]
- Yokoyama, K.; Fisher, A.D.; Amori, A.R.; Welchons, D.P.; McKnight, R.E. Spectroscopic and calorimetric studies of congo red dye-amyloid β peptide complexes. JBPC 2010, 1, 153–163. [Google Scholar] [CrossRef]
- Wolfe, L.S.; Calabrese, M.F.; Nath, A.; Blaho, D.V.; Miranker, A.D.; Xiong, Y. Protein-induced photophysical changes to the amyloid indicator dye thioflavin T. Proc. Natl. Acad. Sci. USA 2010, 107, 16863–16868. [Google Scholar] [CrossRef]
- Klunk, W.E.; Pettegrew, J.W.; Abraham, D.J. Quantitative evaluation of congo red binding to amyloid-like proteins with a beta-pleated sheet conformation. J. Histochem. Cytochem. 1989, 37, 1273–1281. [Google Scholar] [CrossRef]
- Klunk, W.E.; Jacob, R.F.; Mason, R.P. Quantifying amyloid by congo red spectral shift assay. Methods Enzymol. 1999, 309, 285–305. [Google Scholar] [PubMed]
- Klunk, W.E.; Jacob, R.F.; Mason, R.P. Quantifying amyloid beta-peptide (Abeta) aggregation using the Congo red-Abeta (CR-abeta) spectrophotometric assay. Anal. Biochem. J. 1999, 266, 66–76. [Google Scholar] [CrossRef] [PubMed]
- O’Nuallain, B.; Shivaprasad, S.; Kheterpal, I.; Wetzel, R. Thermodynamics of A beta(1-40) amyloid fibril elongation. Biochemistry 2005, 44, 12709–12718. [Google Scholar] [CrossRef] [PubMed]
- Shivaprasad, S.; Wetzel, R. Scanning cysteine mutagenesis analysis of Abeta-(1-40) amyloid fibrils. J. Biol. Chem. 2006, 281, 993–1000. [Google Scholar] [CrossRef] [PubMed]
- Groenning, M. Binding mode of Thioflavin T and other molecular probes in the context of amyloid fibrils-current status. J. Chem. Biol. 2010, 3, 1–18. [Google Scholar] [CrossRef]
- Reinke, A.A.; Gestwicki, J.E. Insight into Amyloid Structure Using Chemical Probes. Chem. Biol. Drug Des. 2011, 77, 399–411. [Google Scholar] [CrossRef] [PubMed]
- Clemens, A.; Allsop, D.; Walsh, D.M.; Williams, C.H. Aggregation and metal-binding properties of mutant forms of the amyloid A beta peptide of Alzheimer’s disease. J. Neurochem. 1996, 19, 740–747. [Google Scholar]
- Soto, C.; Castano, E.M. The conformation of Alzheimer’s beta peptide determines the rate of amyloid formation and its resistance to proteolysis. Biochem. J. 1996, 314, 701–707. [Google Scholar] [CrossRef]
- Walsh, D.M.; Hartley, D.M.; Kusumoto, Y.; Fezoui, Y.; Condron, M.M.; Lomakin, A.; Benedek, G.B.; Selkoe, D.J.; Teplow, D.B. Amyloid beta-protein fibrillogenesis. Structure and biological activity of protofibrillar intermediates. J. Biol. Chem. 1999, 274, 25945–25952. [Google Scholar]
- Dunstan, D.E.; Hamilton-Brown, P.; Asimakis, P.; Ducker, W.; Bertolini, J. Shear flow promotes amyloid-β fibrilization. Protein Eng. Des. Sel. 2009, 22, 741–746. [Google Scholar] [CrossRef] [PubMed]
- Micsonai, A.; Wien, F.; Kernya, L.; Lee, Y.H.; Goto, Y.; Refregiers, M.; Kardos, J. Accurate secondary structure prediction and fold recognition for circular dichroism spectroscopy. Proc. Natl. Acad. Sci. USA 2015, 112, 3095–3103. [Google Scholar] [CrossRef]
- Greenfield, N.J. Using circular dichroism spectra to estimate protein secondary structure. Nat. Protoc. 2006, 1, 2876–2890. [Google Scholar] [CrossRef] [PubMed]
Sample Availability: Samples of the compounds 1–18 are available from the authors. |


| Chain A | Chain B |
|---|---|
| A1–A10 H–GIVEQCCTSI–OH (1) | B1–B10 H–FVNQHLCGSH–OH (7) |
| A1–A5 H–GIVEQ–OH (2) | B1–B5 H–FVNQH–OH (8) |
| A6–A10 H–CCTSI–OH (3) | B6–B10 H–LCGSH–OH (9) |
| A11–A21 H–CSLYQLENYCN–OH (4) | B11–B20 H–LVEALYLVCG–OH (10) |
| A11–A16 H–CSLYQL–OH (5) | B11–B15 H–LVEAL–OH (11) |
| A17–A21 H–ENYCN–OH (6) | B16–B20 H–YLVCG–OH (12) |
| B21–B30 H–ERGFFYTPKT–OH (13) | |
| B21–B25 H–ERGFF–OH (14) | |
| B26–B30 H–YTPKT–OH (15) |
| Insulin Fragments | CR Assay | ThT Assay | Microscopic Examination, Morphology |
|---|---|---|---|
| Known Hot Spots of Insulin or Fragment Suspected of Having Amyloidogenic Properties | |||
| A13–A19 H–LYQLENY–OH (16) | ++ | ++ | ++ |
| B12–B17 H–VEALYL–OH (17) | ++ | + | ++ |
| B22–B27 H–RGFFYT–OH (18) | ++ | + | + fibrous structure |
| Chain A | |||
| A1–A10 H–GIVEQCCTSI–OH (1) | + | ++ | +/- cluster of fibrous and amorphous structures |
| A1–A5 H–GIVEQ–OH (2) | + | + | + fibrous structure |
| A6–A10 H–CCTSI–OH (3) | + | + | + fibrous structure |
| A11–A21 H–CSLYQLENYCN–OH (4) | + | ++ | + fibrous structure |
| A11–A16 H–CSLYQL–OH (5) | +/- almost flat spectrum | + | + fibrous structure |
| A17–A21 H–ENYCN–OH (6) | +/- almost flat spectrum | + | +/- cluster of fibrous and amorphous structures |
| Chain B | |||
| B1–B10 H–FVNQHLCGSH–OH (7) | + | +/- | + fibrous structure |
| B1–B5 H–FVNQH–OH (8) | + | + | +/- cluster of fibrous and amorphous structures |
| B6–B10 H–LCGSH–OH (9) | + | +/- | +/- cluster of fibrous and amorphous structures |
| B11–B20 H–LVEALYLVCG–OH (10) | +/- almost flat spectrum | + | + fibrous structure |
| B11–B15 H–LVEAL–OH (11) | + | + | + fibrous structure |
| B16–B20 H–YLVCG–OH (12) | +/- almost flat spectrum | + | +/- cluster of fibrous and amorphous structures |
| B21–B30 H–ERGFFYTPKT–OH (13) | +/- an absorbance higher than CR, a characteristic shift of the maximum absorbance | + | +/- cluster of fibrous and amorphous structures |
| B21–B25 H–ERGFF–OH (14) | + | + | + fibrous structure |
| B26–B30 H–YTPKT–OH (15) | + | +/- | +/- cluster of fibrous and amorphous structures |
© 2019 by the authors. Licensee MDPI, Basel, Switzerland. This article is an open access article distributed under the terms and conditions of the Creative Commons Attribution (CC BY) license (http://creativecommons.org/licenses/by/4.0/).
Share and Cite
Swiontek, M.; Fraczyk, J.; Wasko, J.; Chaberska, A.; Pietrzak, L.; Kaminski, Z.J.; Szymanski, L.; Wiak, S.; Kolesinska, B. Search for New Aggregable Fragments of Human Insulin. Molecules 2019, 24, 1600. https://doi.org/10.3390/molecules24081600
Swiontek M, Fraczyk J, Wasko J, Chaberska A, Pietrzak L, Kaminski ZJ, Szymanski L, Wiak S, Kolesinska B. Search for New Aggregable Fragments of Human Insulin. Molecules. 2019; 24(8):1600. https://doi.org/10.3390/molecules24081600
Chicago/Turabian StyleSwiontek, Monika, Justyna Fraczyk, Joanna Wasko, Agata Chaberska, Lukasz Pietrzak, Zbigniew J. Kaminski, Lukasz Szymanski, Slawomir Wiak, and Beata Kolesinska. 2019. "Search for New Aggregable Fragments of Human Insulin" Molecules 24, no. 8: 1600. https://doi.org/10.3390/molecules24081600
APA StyleSwiontek, M., Fraczyk, J., Wasko, J., Chaberska, A., Pietrzak, L., Kaminski, Z. J., Szymanski, L., Wiak, S., & Kolesinska, B. (2019). Search for New Aggregable Fragments of Human Insulin. Molecules, 24(8), 1600. https://doi.org/10.3390/molecules24081600