Investigation on Spectrum-Effect Correlation between Constituents Absorbed into Blood and Bioactivities of Baizhu Shaoyao San before and after Processing on Ulcerative Colitis Rats by UHPLC/Q-TOF-MS/MS Coupled with Gray Correlation Analysis

 ,
,
Abstract
:
1. Introduction
2. Results and Discussion
2.1. UHPLC/Q-TOF-MS/MS Analysis of Constituents Absorbed into Blood
2.2. Results of Anti-Ulcerative Colitis Effects
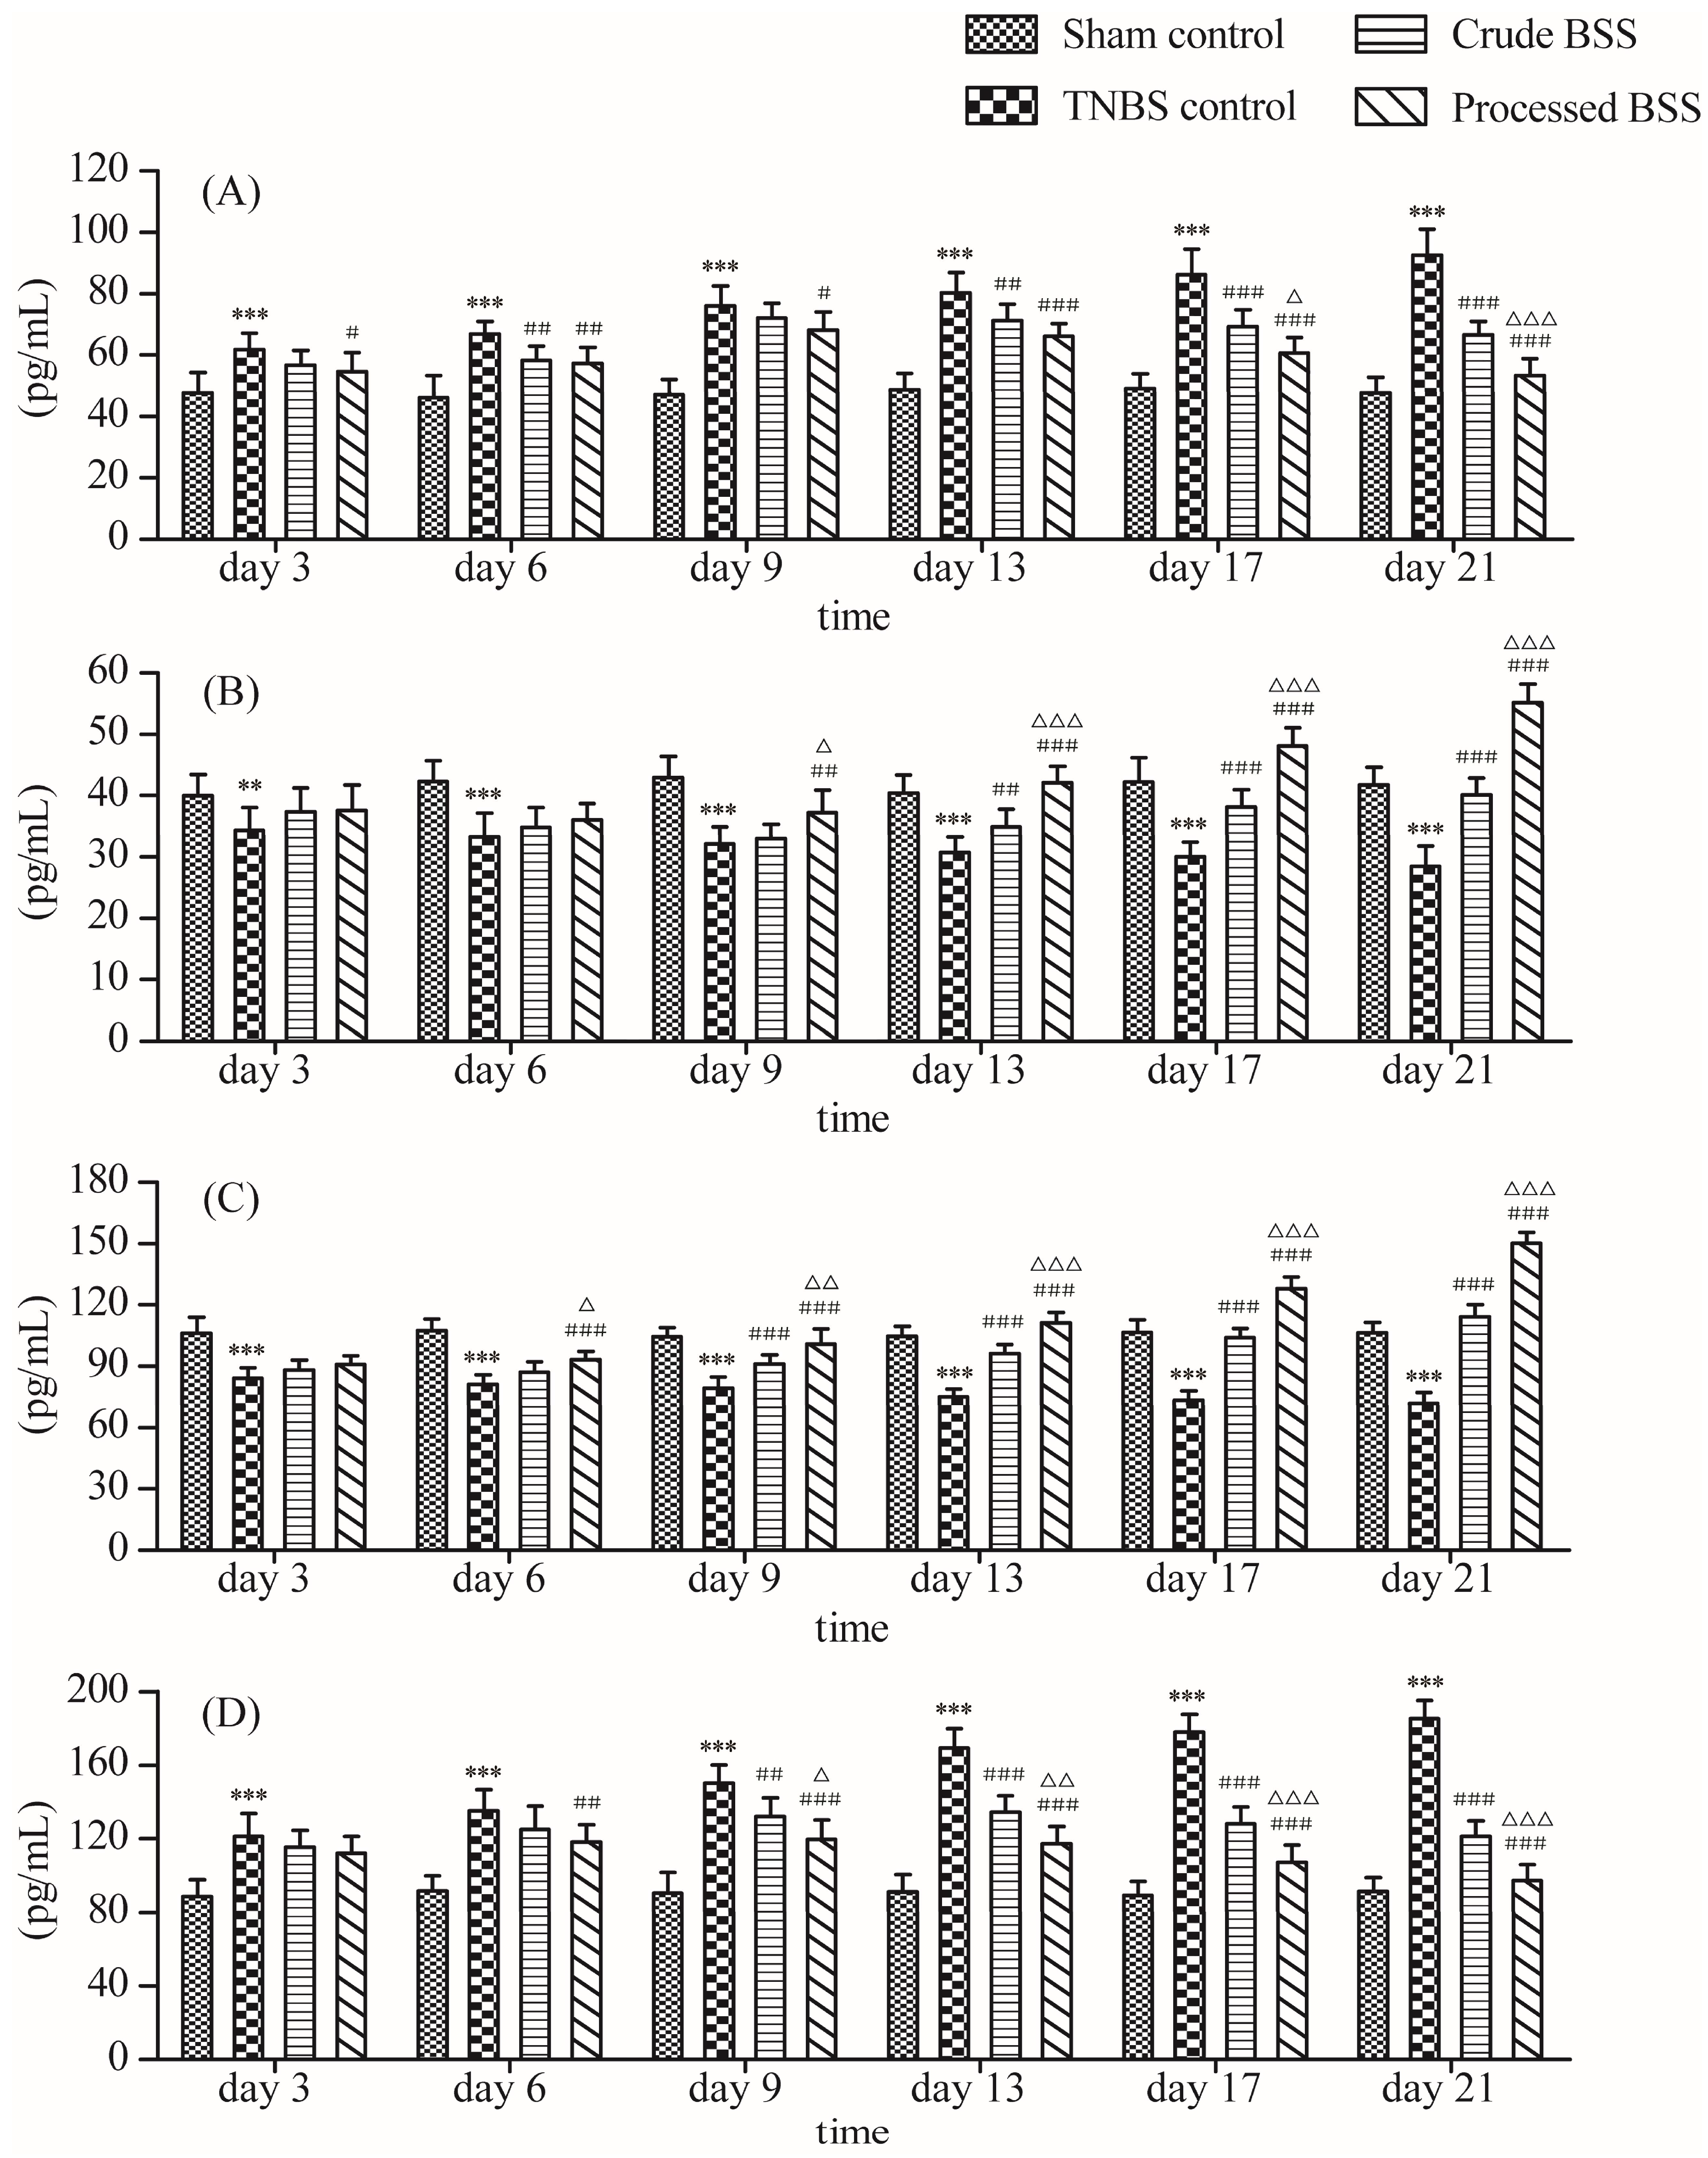
2.2.1. Effects of BSS on Serum Cytokines before and after Processing
2.2.2. Effects of BSS on Disease Activity Index (DAI) before and after Processing
2.2.3. Effects of BSS on Macroscopic and Histopathological Alterations before and after Processing
2.2.4. Effects of BSS on Protein Expression in TLR4 Signaling Pathway before and after Processing
2.3. Results of Gray Correlation Analysis
3. Materials and Methods
3.1. Materials and Reagents
3.2. Preparation of Sample Solutions
3.3. Animals
3.4. Induction of Ulcerative Colitis and Experimental Design
3.5. UHPLC/Q-TOF-MS/MS Analysis
3.5.1. Instruments
3.5.2. Chromatographic Separation
3.5.3. Mass Spectrometry
3.5.4. Preparation of Rat Serum Samples
3.5.5. Identification of Constituents Absorbed into Blood
3.6. Evaluation of Anti-Ulcerative Colitis Effects
3.6.1. Determination of TNF-α, IL-6, IL-10, and TGF-β1 Levels in Rat Serums
3.6.2. Assessment of Disease Activity Index
3.6.3. Assessment of Colon Damage by Macroscopic and Histopathological Study
3.6.4. Western Blot Analysis
3.6.5. Statistical Analysis
3.7. Gray Correlation Analysis
4. Conclusions
Supplementary Materials
Author Contributions
Funding
Conflicts of Interest
References
- Xu, Y.Y.; Cai, H.; Duan, Y.; Pei, K.; Fan, K.L.; Liu, X.; Cao, G. Research progress of Baizhu Shaoyao powder in treating ulcerative colitis. China J. Chin. Mater. Med. 2017, 42, 856–862. [Google Scholar]
- Hu, X.G.; Zhang, X.J.; Han, B.; Bei, W.J. The inhibitory effect of tongxieyaofang on rats with post infectious irritable bowel syndrome through regulating colonic par-2 receptor. BMC Complement. Altern. Med. 2013, 13, 246. [Google Scholar] [CrossRef] [PubMed]
- Wang, F.Y.; Su, M.; Zheng, Y.Q.; Wang, X.G.; Kang, N.; Chen, T.; Zhu, E.L.; Bian, Z.X.; Tang, X.D. Herbal prescription Chang’an II repairs intestinal mucosal barrier in rats with post-inflammation irritable bowel syndrome. Acta Pharmacol. Sin. 2015, 36, 708–715. [Google Scholar] [CrossRef] [PubMed]
- Zhao, X.F.; Zheng, X.H.; Fan, T.P.; Li, Z.J.; Zhang, Y.Y.; Zheng, J.B. A novel drug discovery strategy inspired by traditional medicine philosophies. Science 2015, 347, S38–S40. [Google Scholar]
- He, B.; Lu, C.; Wang, M.L.; Zheng, G.; Chen, G.; Jiang, M.; He, X.J.; Bian, Z.X.; Zhang, G.; Lu, A.P. Drug discovery in traditional Chinese medicine: From herbal fufang to combinatory drugs. Science 2015, 350, S74–S76. [Google Scholar]
- Han, Y.Q.; Li, Y.X.; Wang, Y.Z.; Gao, J.R.; Xia, L.Z.; Hong, Y. Comparison of fresh, dried and stir-frying gingers in decoction with blood stasis syndrome in rats based on a GC-TOF/MS metabolomics approach. J. Pharm. Biomed. 2016, 129, 339–349. [Google Scholar] [CrossRef] [PubMed]
- Wang, M.; Fu, J.F.; Lv, M.Y.; Tian, Y.; Xu, F.G.; Song, R.; Zhang, Z.J. Effect of wine processing and acute blood stasis on the serum pharmacochemistry of rhubarb: A possible explanation for processing mechanism. J. Sep. Sci. 2014, 37, 2499–2503. [Google Scholar] [CrossRef] [PubMed]
- Sun, H.; Ni, B.; Zhang, A.H.; Wang, M.; Dong, H.; Wang, X.J. Metabolomics study on Fuzi and its processed products using ultra-performance liquid-chromatography/electrospray-ionization synapt high-definition mass spectrometry coupled with pattern recognition analysis. Analyst 2012, 137, 170–185. [Google Scholar] [CrossRef] [PubMed]
- Li, S.L.; Song, J.Z.; Qiao, C.F.; Zhou, Y.; Qian, K.D.; Lee, K.H.; Xu, H.X. A novel strategy to rapidly explore potential chemical markers for the discrimination between raw and processed Radix Rehmanniae by UHPLC-TOFMS with multivariate statistical analysis. J. Pharm. Biomed. 2010, 51, 812–823. [Google Scholar] [CrossRef] [PubMed]
- Cao, G.; Cai, H.; Jiang, J.P.; Yao, L.J.; Tu, S.C.; Wang, L.; Ma, X.Q.; Cai, B.C. Chemical differentiation of volatile compounds in crude and processed Atractylodis Macrocephalae Rhizoma by using comprehensive two-dimensional gas chromatography with time-of-flight mass spectrometry combined with multivariate data analysis. J. Sep. Sci. 2014, 37, 1194–1198. [Google Scholar] [CrossRef] [PubMed]
- Zhao, W.L.; Wu, H.; Shan, G.S.; Jia, T.Z. Verification of processing theory of “reducing ketone and dryness, and increasing ester and effect” for bran-fried atractylodes. China J. Chin. Mater. Med. 2013, 38, 3493–3497. [Google Scholar]
- Jiang, Y.; Zhang, L.; Xiong, X.B.; Liu, H.J. Effect of different Paeony processed products on primary dysmenorrhea. Lishizhen Med. Mat. Med. 2011, 22, 1317–1318. [Google Scholar]
- Xu, Y.Y.; Cai, H.; Cao, G.; Duan, Y.; Pei, K.; Zhou, J.; Xie, L.; Zhao, J.Y.; Liu, J.; Wang, X.Q.; et al. Discrimination of volatiles in herbal formula Baizhu Shaoyao San before and after processing using needle trap device with multivariate data analysis. R. Soc. Open Sci. 2018, 5, 171987. [Google Scholar] [CrossRef] [PubMed]
- Xu, Y.Y.; Cai, H.; Cao, G.; Duan, Y.; Pei, K.; Tu, S.C.; Zhou, J.; Xie, L.; Sun, D.D.; Zhao, J.Y.; et al. Profiling and analysis of multiple constituents in Baizhu Shaoyao San before and after processing by stir-frying using UHPLC/Q-TOF-MS/MS coupled with multivariate statistical analysis. J. Chromatogr. B 2018, 1083, 110–123. [Google Scholar] [CrossRef] [PubMed]
- Wang, X.J.; Zhang, A.H.; Yan, G.L.; Han, Y.; Sun, H. UHPLC-MS for the analytical characterization of traditional Chinese medicines. TrAC Trend. Anal. Chem. 2014, 63, 180–187. [Google Scholar] [CrossRef]
- Yao, W.F.; Gu, H.W.; Zhu, J.J.; Barding, G.; Cheng, H.B.; Bao, B.H.; Zhang, L.; Ding, A.W.; Li, W. Integrated plasma and urine metabolomics coupled with HPLC/QTOF-MS and chemometric analysis on potential biomarkers in liver injury and hepatoprotective effects of Er-Zhi-Wan. Anal. Bioanal. Chem. 2014, 406, 7367–7378. [Google Scholar] [CrossRef] [PubMed]
- Wan, J.B.; Bai, X.; Cai, X.J.; Rao, Y.; Wang, Y.S.; Wang, Y.T. Chemical differentiation of Da-Cheng-Qi-Tang, a Chinese medicine formula, prepared by traditional and modern decoction methods using UPLC/Q-TOFMS-based metabolomics approach. J. Pharm. Biomed. 2013, 83, 34–42. [Google Scholar] [CrossRef] [PubMed]
- Xu, G.L.; Xie, M.; Yang, X.Y.; Song, Y.; Yan, C.; Yang, Y.; Zhang, X.; Liu, Z.Z.; Tian, Y.X.; Wang, Y.; et al. Spectrum-effect relationships as a systematic approach to traditional Chinese medicine research: Current status and future perspectives. Molecules 2014, 19, 17897–17925. [Google Scholar] [CrossRef] [PubMed]
- Shi, M.J.; Zhang, Y.; Song, M.M.; Sun, Y.; Li, C.Q.; Kang, W.Y. Screening the marker components in Psoralea corylifolia L. with the aids of spectrum-effect relationship and component knock-out by UPLC-MS. Int. J. Mol. Sci. 2018, 19, 3439. [Google Scholar] [CrossRef] [PubMed]
- Zhu, W.T.; Duan, L.Z.; Zhang, J.P.; Shi, Y.Y.; Qiao, Y.J. Constructing a competitiveness evaluation system of listed Chinese medicine enterprises based on grey correlation. J. Grey Syst. 2015, 27, 40–51. [Google Scholar]
- Dong, H.Y.; He, L.C.; Huang, M.; Dong, Y.L. Anti-inflammatory components isolated from Atractylodes macrocephala Koidz. Nat. Prod. Res. 2008, 22, 1418–1427. [Google Scholar] [CrossRef] [PubMed]
- Bose, S.; Kim, H. Evaluation of In vitro anti-inflammatory activities and protective effect of fermented preparations of Rhizoma Atractylodis Macrocephalae on intestinal barrier function against lipopolysaccharide insult. Evid-Based Complement. Altern. Med. 2013, 2013, 363076. [Google Scholar] [CrossRef] [PubMed]
- Li, R.L.; Sakwiwatkul, K.; Li, Y.T.; Hu, S.H. Enhancement of the immune responses to vaccination against foot-and-mouth disease in mice by oral administration of an extract made from Rhizoma Atractylodis Macrocephalae (RAM). Vaccine 2009, 27, 2094–2098. [Google Scholar] [CrossRef] [PubMed]
- Chen, J.; Liu, X.; Dou, D.Q. Bidirectional effective components of Atractylodis Macrocephalae Rhizoma on gastrointestinal peristalsis. Int. J. Pharmacol. 2016, 12, 108–115. [Google Scholar] [CrossRef]
- Yan, H.; Sun, Y.Y.; Zhang, Q.L.; Yang, M.J.; Wang, X.R.; Wang, Y.; Yu, Z.G.; Zhao, Y.L. Simultaneous determination and pharmacokinetic study of atractylenolide I, II and III in rat plasma after intragastric administration of Baizhufuling extract and Atractylodis extract by UPLC-MS/MS. J. Chromatogr. B 2015, 993–994, 86–92. [Google Scholar] [CrossRef] [PubMed]
- Li, Y.J.; Zhang, Y.S.; Wang, Z.M.; Zhu, J.J.; Tian, Y.; Chen, B. Quantitative analysis of atractylenolide I in rat plasma by LC-MS/MS method and its application to pharmacokinetic study. J. Pharm. Biomed. 2012, 58, 172–176. [Google Scholar] [CrossRef] [PubMed]
- Fang, X.H.; Wu, X.; Zhu, X.M.; Cai, H.; Cao, G. Albiflorin attenuates inflammatory injury by regulating the TLR4 signaling pathway and its negative regulating factor Tollip in experimental models of ulcerative colitis. J. Chin. Pharm. Sci. 2016, 25, 366–372. [Google Scholar]
- Xu, L.; Yang, Z.L.; Li, P.; Zhou, Y.Q. Modulating effect of hesperidin on experimental murine colitis induced by dextran sulfate sodium. Phytomedicine 2009, 16, 989–995. [Google Scholar] [CrossRef] [PubMed]
- Xiong, Y.J.; Chen, D.P.; Yu, C.C.; Lv, B.C.; Peng, J.Y.; Wang, J.Y.; Lin, Y. Citrus nobiletin ameliorates experimental colitis by reducing inflammation and restoring impaired intestinal barrier function. Mol. Nutr. Food Res. 2015, 59, 829–842. [Google Scholar] [CrossRef] [PubMed]
- Eun, S.H.; Woo, J.T.; Kim, D.H. Tangeretin inhibits IL-12 expression and NF-kappa B activation in dendritic cells and attenuates colitis in mice. Planta Med. 2017, 83, 527–533. [Google Scholar] [PubMed]
- Xu, L.; Cai, J.Y.; Tian, A.F.; Qian, K.; Qin, R.N.; Qi, S.Y.; Tan, X.P.; Qiu, Y.Q.; Gong, M.J.; Han, B.; et al. The effect of prim-O-glucosylcimifugin on tryptase-induced intestinal barrier dysfunction in Caco-2 cells. Biol. Pharm. Bull. 2018, 41, 1355–1361. [Google Scholar] [CrossRef] [PubMed]
- Sun, J.; Zhang, Y.L.; Gu, H.; Wang, Y. Theoretical model for compatibility of medicinal property combination of traditional Chinese medicines. China J. Chin. Mater. Med. 2015, 40, 3327–3330. [Google Scholar]
- Chen, Y.; Xiao, P.; Ou Yang, D.S.; Fan, L.; Guo, D.; Wang, Y.N.; Han, Y.; Tu, J.H.; Zhou, G.; Huang, Y.F.; et al. Simultaneous action of the flavonoid quercetin on cytochrome P450 (CYP) 1A2, CYP2A6, N-acetyltransferase and xanthine oxidase activity in healthy volunteers. Clin. Exp. Pharmacol. Physiol. 2009, 36, 828–833. [Google Scholar] [CrossRef] [PubMed]
- Zhou, W.; Wang, F.; Wang, C.J.; Xie, J.Y. Mining core herbs and their combination rules using effect degree. J. Front. Comp. Sci. Technol. 2013, 7, 994–1001. [Google Scholar]
- Zhao, Y.; Hellum, B.H.; Liang, A.H.; Nilsen, O.G. Inhibitory mechanisms of human CYPs by three alkaloids isolated from traditional Chinese herbs. Phytother. Res. 2015, 29, 825–834. [Google Scholar] [CrossRef] [PubMed]
- Duan, Y.; Pei, K.; Cai, H.; Tu, S.C.; Zhang, Z.W.; Cheng, X.W.; Qiao, F.X.; Fan, K.L.; Qin, K.M.; Liu, X.; et al. Bioactivity evaluation-based ultra high-performance liquid chromatography coupled with electrospray ionization tandem quadrupole-time-of-flight mass spectrometry and novel distinction of multi-subchemome compatibility recognition strategy with Astragali Radix-Fructus Corni herb-pair as a case study. J. Pharm. Biomed. 2016, 129, 514–534. [Google Scholar]
- Cai, B.C.; Qin, K.M.; Wu, H.; Cai, H.; Lu, T.L.; Zhang, X.D. Chemical mechanism during Chinese medicine processing. Prog. Chem. 2012, 24, 637–649. [Google Scholar] [CrossRef]
- Zheng, L.J.; Qin, K.M.; Cai, H.; Cao, G.; Cai, B.C. Optimization of extraction process for Baizhu Shaoyao San by multi-index orthogonal experiment. China J. Chin. Mater. Med. 2013, 38, 1504–1509. [Google Scholar]
- Bjerrum, J.T.; Nielsen, O.H.; Hao, F.H.; Tang, H.R.; Nicholson, J.K.; Wang, Y.L.; Olsen, J. Metabonomics in ulcerative colitis: Diagnostics, biomarker identification, and insight into the pathophysiology. J. Proteome Res. 2010, 9, 954–962. [Google Scholar] [CrossRef] [PubMed]
- Cao, G.; Li, Q.L.; Cai, H.; Tu, S.C.; Cai, B.C. Investigation of the chemical changes from crude and processed Paeoniae Radix Alba-Atractylodis Macrocephalae Rhizoma herbal pair extracts by using Q exactive high-performance benchtop quadrupole-orbitrap LC-MS/MS. Evid-Based Complement. Altern. Med. 2014, 2014, 170959. [Google Scholar] [CrossRef] [PubMed]
- Li, S.L.; Song, J.Z.; Choi, F.F.K.; Qiao, C.F.; Zhou, Y.; Han, Q.B.; Xu, H.X. Chemical profiling of Radix Paeoniae evaluated by ultra-performance liquid chromatography/photo-diode-array/quadrupole time-of-flight mass spectrometry. J. Pharm. Biomed. 2009, 49, 253–266. [Google Scholar] [CrossRef] [PubMed]
- Liu, J.; Chen, L.; Fan, C.R.; Li, H.; Huang, M.Q.; Xiang, Q.; Xu, W.; Xu, W.; Chu, K.D.; Lin, Y. Qualitative and quantitative analysis of major constituents of Paeoniae Radix Alba and Paeoniae Radix Rubra by HPLC-DAD-Q-TOF-MS/MS. China J. Chin. Mater. Med. 2015, 40, 1762–1770. [Google Scholar]
- Ke, Z.L.; Yang, Y.; Tan, S.; Zhou, Z.Q. Characterization of polymethoxylated flavonoids in the peels of Chinese wild mandarin (Citrus reticulata Blanco) by UPLC-Q-TOF-MS/MS. Food Anal. Method 2017, 10, 1328–1338. [Google Scholar] [CrossRef]
- Zheng, G.D.; Zhou, P.; Yang, H.; Li, Y.s.; Li, P.; Liu, E.H. Rapid resolution liquid chromatography-electrospray ionisation tandem mass spectrometry method for identification of chemical constituents in Citri Reticulatae Pericarpium. Food Chem. 2013, 136, 604–611. [Google Scholar] [CrossRef] [PubMed]
- Kreiner, J.; Pang, E.; Lenon, G.B.; Yang, A.W.H. Saposhnikoviae divaricata: A phytochemical, pharmacological, and pharmacokinetic review. Chin. J. Nat. Med. 2017, 15, 255–264. [Google Scholar] [CrossRef]
- Li, Y.Y.; Wang, X.X.; Zhao, L.; Zhang, H.; Lv, L.; Zhou, G.C.; Chai, Y.F.; Zhang, G.Q. High-performance liquid chromatography-electrospray Ionization time-of-flight mass spectrometry analysis of Radix Saposhnikoviae for metabolomic research. J. Chromatogr. Sci. 2013, 51, 99–106. [Google Scholar] [CrossRef] [PubMed]
- Murano, M.; Maemura, K.; Hirata, I.; Toshina, K.; Nishikawa, T.; Hamamoto, N.; Sasaki, S.; Saitoh, O.; Katsu, K. Therapeutic effect of intracolonically administered nuclear factor kappa B (p65) antisense oligonucleotide on mouse dextran sulphate sodium (DSS)-induced colitis. Clin. Exp. Immunol. 2000, 120, 51–58. [Google Scholar] [CrossRef] [PubMed]
- Liu, X.; Wang, J.M. Anti-inflammatory effects of iridoid glycosides fraction of Folium syringae leaves on TNBS-induced colitis in rats. J. Ethnopharmacol. 2011, 133, 780–787. [Google Scholar] [CrossRef] [PubMed]
- Qing, Y.J.; Liu, W.; Du, P.; Jin, Y.; Yao, X.Y. Spectrum-effect relationship for inhibitory action of Wuji Pills on pepsin based on grey incidence degree method. Chin. Tradit. Herb. Drugs 2017, 48, 3390–3395. [Google Scholar]
Sample Availability: Samples of Atractylodis Macrocephalae Rhizoma, Paeoniae Radix Alba, Citri Reticulatae Pericarpium, and Saposhnikoviae Radix are available from the authors. |


| No. | TR (min) | Compound Name | Pathway | Formula | Ion Type | Found Mass | Mass Error (ppm) | MS/MS (m/z) |
|---|---|---|---|---|---|---|---|---|
| 1 | 0.71 | D-Mannose | parent | C6H12O6 | [M − H]− | 179.0559 | 4.9 | 113.0289, 75.0092, 71.0159, 59.0148 |
| 2 | 0.99 | Narirutin-M1 | loss of rutinose + ring opening | C9H10O3 | [M − H]− | 165.0550 | 2.1 | 119.0508, 106.0425, 72.9962, 117.0341 |
| 3 | 0.99 | Narirutin-M2 | loss of rutinose + ring opening + deethylation | C7H6O3 | [M − H]− | 137.0244 | 7.6 | 93.0389, 65.0463, 75.0297, 65.0131 |
| 4 | 1.01 | Paeoniflorin-M1 | loss of benzoyl | C16H24O10 | [M − H]− | 375.1281 | −1.3 | 165.0556, 177.0550, 121.0307, 195.0665 |
| 5 | 1.01 | Paeoniflorin-M2 | loss of C16H22O9 + glycine conjugation | C9H9NO3 | [M − H]− | 178.0507 | 4.9 | 77.0416, 132.0442, 93.0352, 79.9587 |
| 6 | 1.05 | Paeoniflorin-M3 | loss of C16H22O9 + glutamine conjugation | C12H14N2O4 | [M − H]− | 249.0870 | −0.1 | 144.0449, 131.0388, 118.0661, 128.0503 |
| 7 | 1.49 | Dimethyl anthranilate | parent | C9H11NO2 | [M + H]+ | 166.0860 | −1.3 | 103.0548, 120.0813, 77.0397, 91.0547 |
| 8 | 1.92 | Ethyl gallate-M1 | dehydroxylation + sulfate conjugation | C9H10O7S | [M − H]− | 261.0067 | 1.3 | 166.0269, 151.0031, 181.0494, 116.0515 |
| 9 | 2.14 | Paeoniflorin-M4 | loss of benzoyl + methylation | C17H26O10 | [M − H]− | 389.1440 | −0.7 | 177.0541, 149.0600, 165.0552, 134.0367 |
| 10 | 2.18 | Ethyl gallate-M2 | sulfate conjugation | C9H10O8S | [M − H]− | 277.0017 | 1.4 | 197.0444, 169.0137, 125.0242, 140.0096 |
| 11 | 2.76 | Paeoniflorin-M5 | loss of glucose and benzoyloxy + hydrogenation | C10H16O4 | [M − H]− | 199.0969 | 2.2 | 121.0627, 137.0987, 59.0272, 109.0680 |
| 12 | 3.16 | Hesperidin-M1 | loss of methoxyl and rhamnopyranosyl | C21H22O10 | [M − H]− | 433.1116 | −3.0 | 257.0780, 113.0236, 85.0289, 109.0282 |
| 13 | 4.01 | Synephrine-M1 | N-acetylation | C11H15NO3 | [M + H]+ | 210.1125 | −0.1 | 121.0648, 149.0816, 77.0407, 91.0554 |
| 14 | 4.31 | Tangeretin-M1 | di-demethylation | C18H16O7 | [M + H]+ | 345.0954 | −4.3 | 345.1044, 128.9559, 144.9268, 176.8732 |
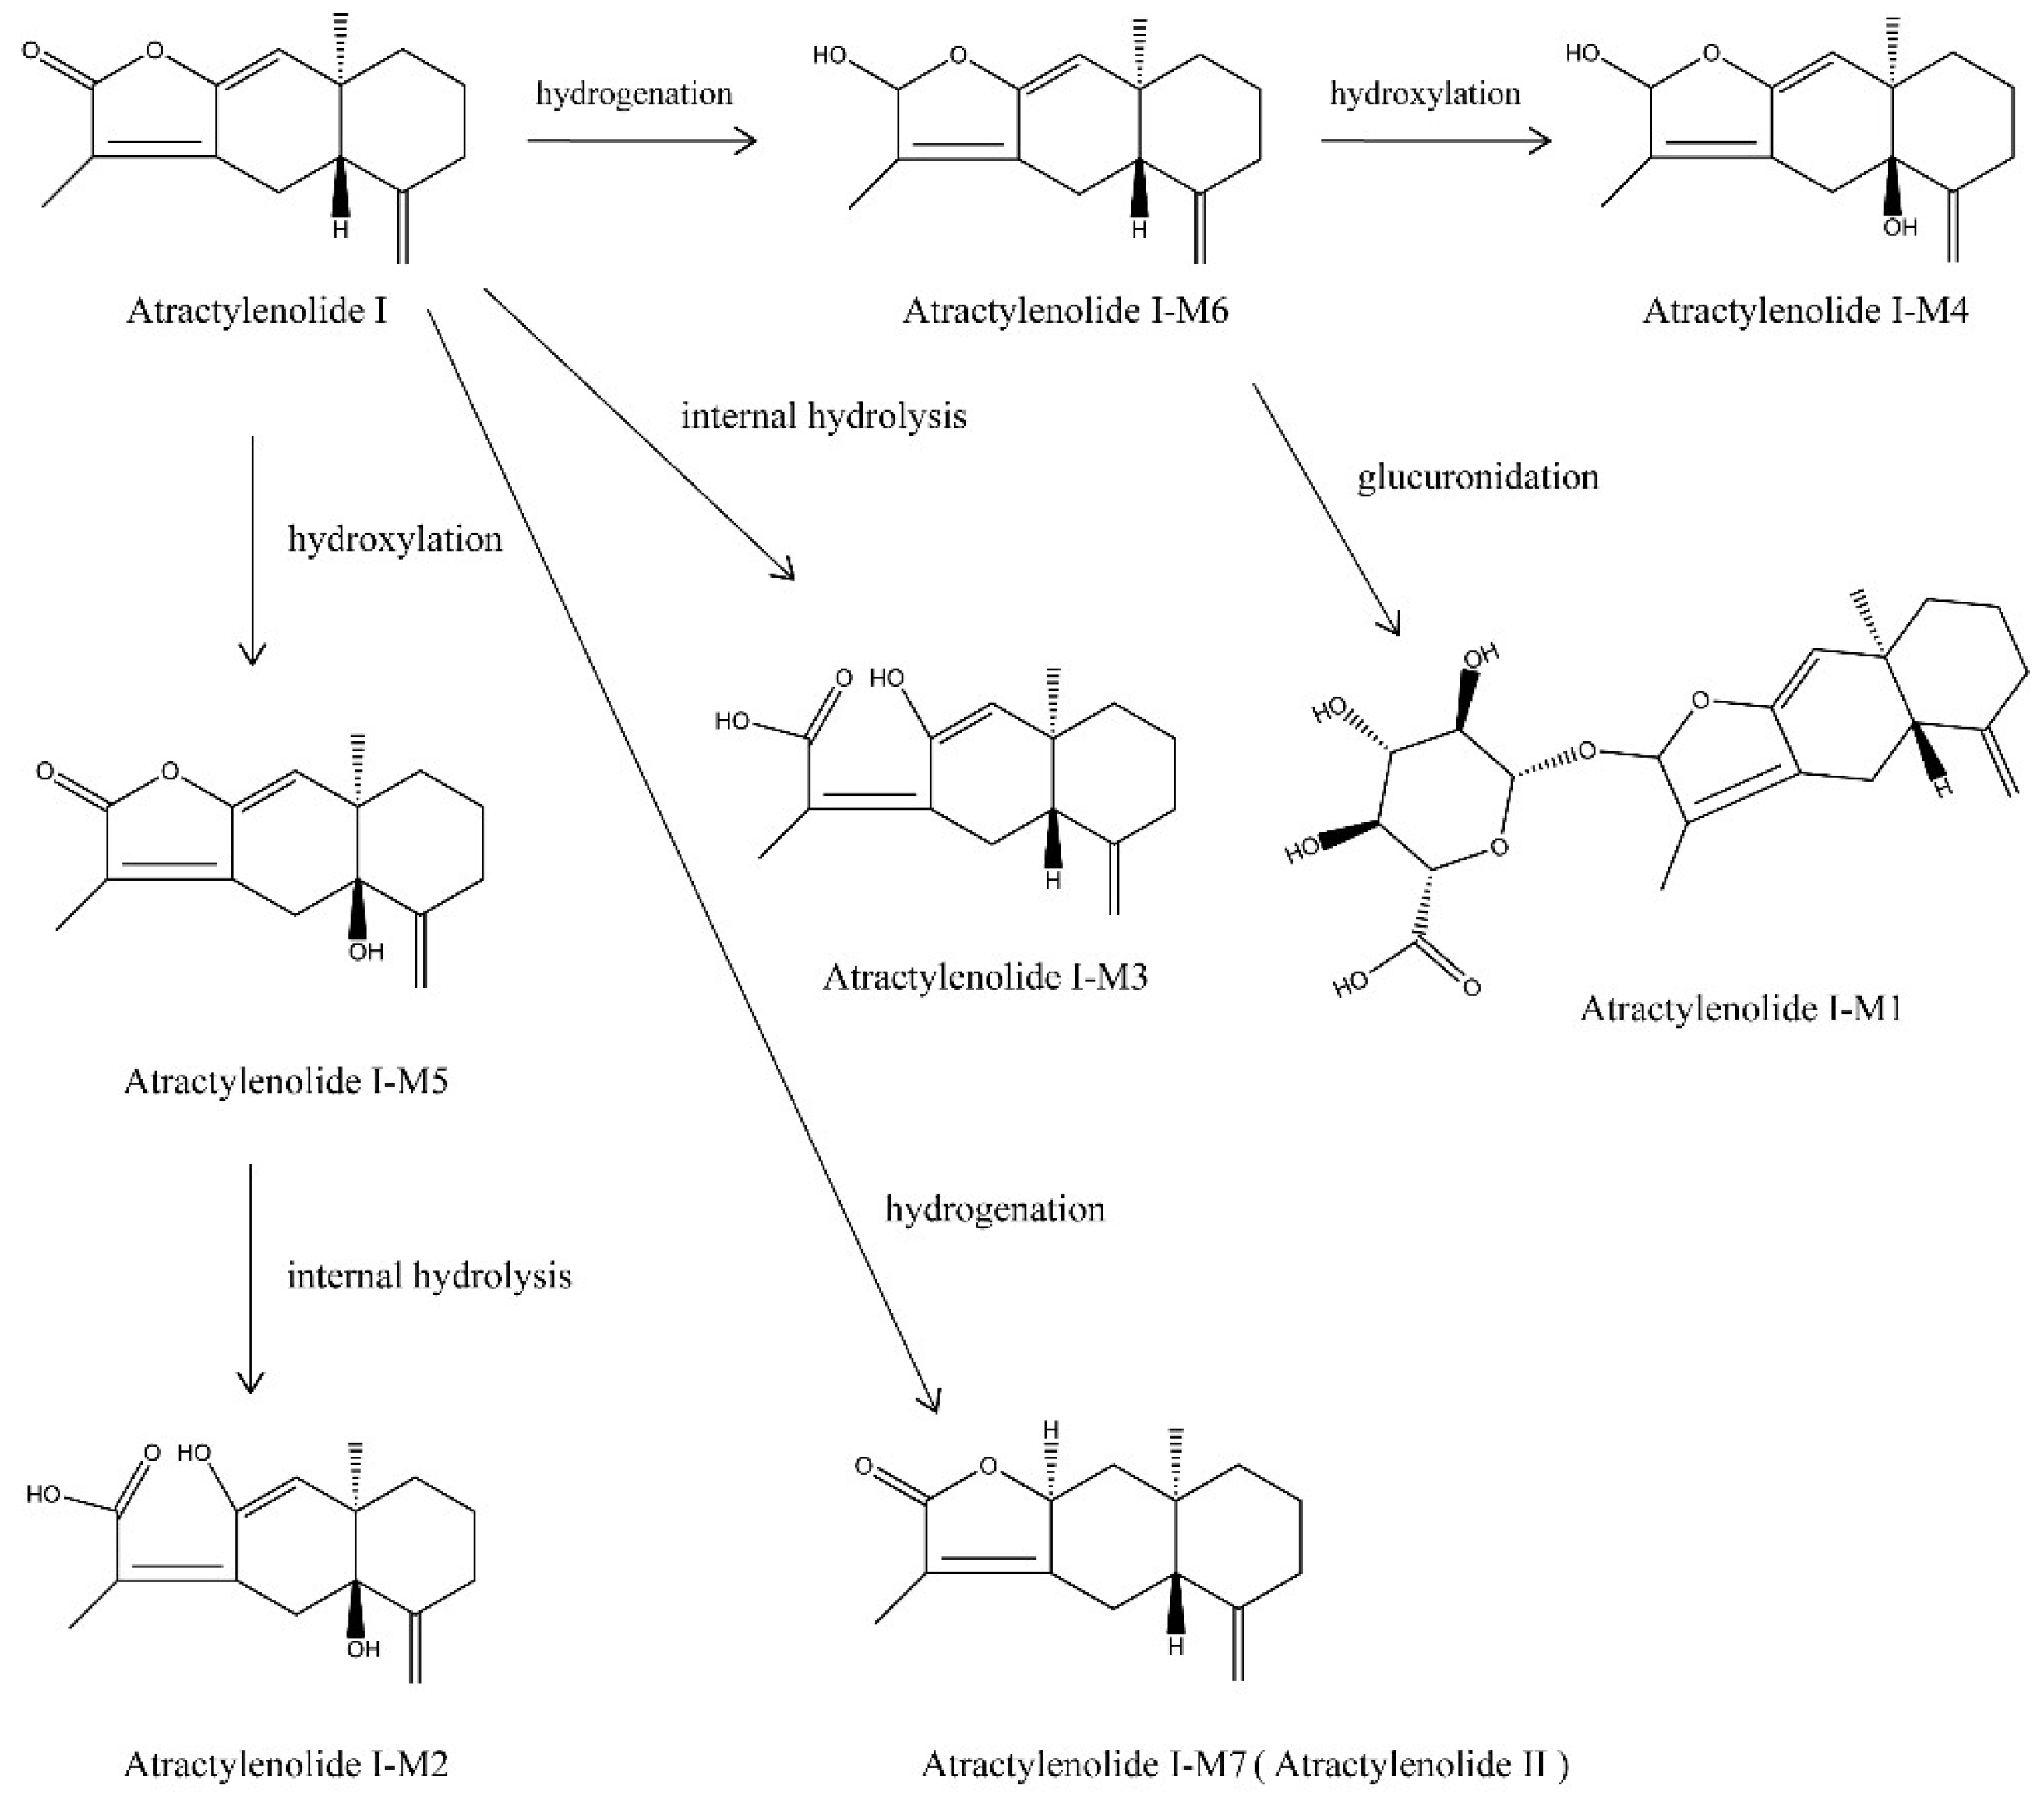
| 15 | 4.55 | Atractylenolide I-M1 | glucuronidation + hydrogenation | C21H28O8 | [M + H]+ | 409.1841 | −3.9 | 128.9538, 409.1823, 144.9273, 234.9163 |
| 16 | 4.74 | Tangeretin-M2 | di-demethylation | C18H16O7 | [M + H]+ | 345.0958 | −3.2 | 345.1003, 128.9549, 144.9214, 176.8738 |
| 17 | 4.75 | Cimifugin-M1 | hydroxylation | C16H18O7 | [M + H]+ | 323.1135 | 2.8 | 232.0362, 247.0576, 59.0510, 323.1131 |
| 18 | 5.01 | Albiflorin | parent | C23H28O11 | [M + Na]+ | 503.1538 | 2.7 | 503.1514, 341.0949, 219.0608, 133.0624 |
| 19 | 5.30 | Paeoniflorin-M6 | internal hydrolysis | C23H30O12 | [M − H]− | 497.1632 | −4.3 | 121.0259, 195.0692, 224.8966, 310.8794 |
| 20 | 5.30 | Tangeretin-M3 | demethylation + glucuronidation | C25H26O13 | [M + H]+ | 535.1456 | 1.8 | 359.1125, 344.0907, 329.0667, 535.1495 |
| 21 | 5.31 | Paeoniflorin-M7 | methylation | C24H30O11 | [M + COOH]− | 539.1748 | −2.1 | 121.0303, 294.9025, 165.0565, 416.8496 |
| 22 | 5.34 | Paeoniflorin-M8 | loss of hydroxymethylene | C22H26O10 | [M − H]− | 449.1433 | −2.1 | 121.0300, 165.0579, 77.0410, 113.0266 |
| 23 | 5.36 | Prim-O-glucosyl-cimifugin | parent | C22H28O11 | [M + H]+ | 469.1711 | 1.3 | 261.1128, 290.1159, 307.1182, 469.1671 |
| 24 | 5.36 | 4-Methoxycinnamic acid-M1 | ketone formation | C10H8O4 | [M + H]+ | 193.0496 | 0.3 | 133.0279, 178.0267, 122.0359, 150.0318 |
| 25 | 5.38 | Paeoniflorin | parent | C23H28O11 | [M − H]− | 479.1534 | −2.8 | 179.0702, 151.0744, 133.0641, 449.1466 |
| 26 | 5.38 | sec-O-Glucosyl-hamaudol-M1 | phosphorylation | C21H27O13P | [M + H]+ | 519.1264 | 0.3 | 201.0063, 519.1267, 235.0274, 323.0431 |
| 27 | 5.40 | Atractylenolide III-M1 | hydroxylation + internal hydrolysis | C15H22O5 | [M + H]+ | 283.1548 | 2.9 | 131.0834, 201.1246, 143.0798, 157.1025 |
| 28 | 5.40 | Atractylenolide II-M1 | di-hydroxylation + internal hydrolysis | C15H22O5 | [M + H]+ | 283.1548 | 2.9 | 131.0834, 201.1246, 143.0798, 157.1025 |
| 29 | 5.49 | Tangeretin-M4 | di-demethylation | C18H16O7 | [M + H]+ | 345.0956 | −3.9 | 345.0958, 110.9771, 345.1186, 91.0523 |
| 30 | 5.49 | Cimifugin-M2 | hydroxylation | C16H18O7 | [M + H]+ | 323.1135 | 3.0 | 232.0369, 247.0607, 59.0514, 203.0337 |
| 31 | 5.64 | Nobiletin-M1 | demethylation + glucuronidation | C26H28O14 | [M + H]+ | 565.1559 | 1.3 | 389.1243, 359.0826, 565.1626, 124.0898 |
| 32 | 5.72 | Dimethyl anthranilate-M1 | methylation | C10H13NO2 | [M + H]+ | 180.1019 | −0.1 | 56.9678, 120.0807, 162.0895, 69.0347 |
| 33 | 5.84 | 3,5,6,7,8,3′,4′-Hepta-methoxyflavone-M1 | demethylation + glucuronidation | C27H30O15 | [M + H]+ | 595.1671 | 2.3 | 419.1340, 389.0892, 404.1141, 595.1714 |
| 34 | 5.85 | Atractylenolide I-M2 | hydroxylation + internal hydrolysis | C15H20O4 | [M + H]+ | 265.1434 | 2.5 | 153.0705, 128.0599, 131.0845, 159.0790 |
| 35 | 5.99 | Nobiletin-M2 | demethylation + glucuronidation | C26H28O14 | [M + H]+ | 565.1558 | 1.1 | 389.1251, 359.0829, 374.1053, 565.1465 |
| 36 | 6.10 | Nodakenetin-M1 | hydroxylation | C14H14O5 | [M + H]+ | 263.0916 | 0.8 | 203.0707, 245.0771, 175.0378, 128.0632 |
| 37 | 6.14 | Atractylenolide II-M2 | di-hydroxylation | C15H20O4 | [M + H]+ | 265.1439 | 1.7 | 143.0855, 91.0562, 117.0658, 122.0720 |
| 38 | 6.20 | Scopoletin | parent | C10H8O4 | [M + H]+ | 193.0496 | 0.2 | 178.0260, 150.0313, 133.0292, 94.0423 |
| 39 | 6.35 | Albiflorin-M1 | loss of glucose and benzoyloxy | C10H14O3 | [M + H]+ | 183.1014 | −0.9 | 56.9661, 109.0640, 119.0856, 91.0536 |
| 40 | 6.43 | Prim-O-glucosyl-cimifugin-M1 | loss of glucose | C16H18O6 | [M + H]+ | 307.1185 | 3.0 | 259.0611, 235.0609, 221.0453, 307.1191 |
| 41 | 6.43 | Cimifugin | parent | C16H18O6 | [M + H]+ | 307.1185 | 3.0 | 259.0611, 235.0609, 221.0453, 307.1191 |
| 42 | 6.44 | Tangeretin-M5 | loss of methoxyl + demethylation | C18H16O6 | [M + H]+ | 329.1005 | −4.6 | 329.1011, 314.0763, 98.9837, 255.0262 |
| 43 | 6.44 | Tetramethyl-O-scutellarin-M1 | demethylation | C18H16O6 | [M + H]+ | 329.1005 | −4.6 | 329.1011, 314.0763, 98.9837, 255.0262 |
| 44 | 6.66 | 5-O-Methyl-visamminol-M1 | hydroxylation | C16H18O6 | [M + H]+ | 307.1188 | 4.0 | 259.0603, 235.0603, 307.1185, 221.0447 |
| 45 | 6.66 | 4′-O-β-D-Glucosyl-5-O-methylvisamminol-M1 | loss of glucose + hydroxylation | C16H18O6 | [M + H]+ | 307.1188 | 4.0 | 259.0603, 235.0603, 307.1185, 221.0447 |
| 46 | 6.74 | Prim-O-glucosyl-cimifugin-M2 | dehydroxylation | C22H28O10 | [M + H]+ | 453.1764 | 1.9 | 291.1236, 273.1130, 231.0647, 453.1768 |
| 47 | 6.74 | 4′-O-β-D-Glucosyl-5-O-methyl-visamminol | parent | C22H28O10 | [M + H]+ | 453.1764 | 1.9 | 291.1236, 273.1130, 231.0647, 453.1768 |
| 48 | 6.78 | Atractylenolide III-M2 | internal hydrolysis | C15H22O4 | [M + H]+ | 267.1597 | 2.2 | 131.0848, 157.1008, 185.1323, 143.0858 |
| 49 | 6.78 | Atractylenolide II-M3 | hydroxylation + internal hydrolysis | C15H22O4 | [M + H]+ | 267.1597 | 2.2 | 131.0848, 157.1008, 185.1323, 143.0858 |
| 50 | 6.78 | Albiflorin-M2 | loss of glucose and benzoyloxy + methylation | C11H16O3 | [M + H]+ | 197.1170 | −0.9 | 91.0542, 105.0681, 105.0768, 114.9465 |
| 51 | 6.87 | Atractylenolide III-M3 | hydroxylation | C15H20O4 | [M + H]+ | 265.1437 | 1.1 | 143.0843, 119.0928, 105.0698, 201.1283 |
| 52 | 6.87 | Atractylenolide II-M4 | dihydroxylation | C15H20O4 | [M + H]+ | 265.1437 | 1.1 | 143.0843, 119.0928, 105.0698, 201.1283 |
| 53 | 6.97 | Hesperidin-M2 | loss of rutinose + internal hydrolysis | C16H16O6 | [M + H]+ | 305.1026 | 2.2 | 275.0558, 233.0442, 305.0996, 247.0611 |
| 54 | 7.02 | Nodakenetin-M2 | hydroxylation | C14H14O5 | [M + H]+ | 263.0921 | 2.7 | 191.0328, 203.0700, 217.0873, 91.0550 |
| 55 | 7.14 | 5-O-methyl-visamminol-M2 | hydroxylation | C16H18O6 | [M + H]+ | 307.1191 | 4.8 | 259.0610, 307.1203, 136.9283, 221.0436 |
| 56 | 7.14 | 4′-O-β-D-glucosyl-5-O-methylvisamminol-M2 | loss of glucose + hydroxylation | C16H18O6 | [M + H]+ | 307.1191 | 4.8 | 259.0610, 307.1203, 136.9283, 221.0436 |
| 57 | 7.15 | Hesperidin | parent | C28H34O15 | [M − H]− | 609.1792 | −3.7 | 301.0707, 609.1770, 325.0707, 242.0497 |
| 58 | 7.63 | Atractylenolide III-M4 | hydroxylation | C15H20O4 | [M + H]+ | 265.1439 | 1.7 | 91.0561, 128.0621, 141.0754, 155.0899 |
| 59 | 7.63 | Atractylenolide II-M5 | di-hydroxylation | C15H20O4 | [M + H]+ | 265.1439 | 1.7 | 91.0561, 128.0621, 141.0754, 155.0899 |
| 60 | 7.93 | Scopoletin-M1 | methylation | C11H10O4 | [M + H]+ | 207.0654 | 1.2 | 191.0331, 151.0734, 163.0391, 107.0499 |
| 61 | 7.93 | Scoparone | parent | C11H10O4 | [M + H]+ | 207.0654 | 1.2 | 191.0331, 151.0734, 163.0391, 107.0499 |
| 62 | 8.03 | Cimifugin-M3 | loss of methoxyl + dehydroxylation | C15H16O4 | [M + H]+ | 261.1129 | 2.7 | 131.0501, 189.0505, 77.0424, 128.8958 |
| 63 | 8.04 | 5-O-Methyl-visamminol-M3 | demethylation and hydroxylation | C15H16O6 | [M + H]+ | 293.1026 | 2.1 | 221.0443, 205.0473, 293.1043, 233.0462 |
| 64 | 8.45 | Hesperidin-M3 | loss of rutinose + deme-thylation + di-hydrogenation | C15H16O6 | [M − H]− | 291.0863 | −0.1 | 273.0748, 233.0443, 247.1694, 175.0364 |
| 65 | 8.52 | Nodakenetin | parent | C14H14O4 | [M + H]+ | 247.0972 | 3.0 | 247.0958, 229.0855, 175.0374, 147.0439 |
| 66 | 8.52 | 5-O-Methyl-visamminol | parent | C16H18O5 | [M + H]+ | 291.1238 | 3.7 | 243.0657, 219.0650, 217.0504, 205.0488 |
| 67 | 8.52 | 4′-O-β-D-glucosyl-5-O-methyl-visamminol-M3 | loss of glucose | C16H18O5 | [M + H]+ | 291.1238 | 3.7 | 243.0657, 219.0650, 217.0504, 205.0488 |
| 68 | 8.85 | sec-O-Glucosyl-hamaudol | parent | C21H26O10 | [M + H]+ | 439.1599 | −0.1 | 277.1064, 259.0971, 217.0497, 205.0498 |
| 69 | 8.96 | Nodakenetin-M3 | isomerization | C14H14O4 | [M + H]+ | 247.0969 | 1.7 | 213.0561, 175.0361, 229.0861, 171.0444 |
| 70 | 9.08 | 3,5,7,3′,4′-Penta-methoxyflavone-M1 | di-demethylation | C18H16O7 | [M + H]+ | 345.0987 | 5.1 | 297.0465, 315.0535, 98.9818, 130.9360 |
| 71 | 9.21 | Sinensetin-M1 | demethylation | C19H18O7 | [M + H]+ | 359.1133 | 2.0 | 329.0663, 359.1366, 301.0538, 163.0718 |
| 72 | 9.35 | Nobiletin-M3 | di-demethylation | C19H18O8 | [M + H]+ | 375.1078 | 1.0 | 345.0597, 197.0133, 327.0633, 375.1007 |
| 73 | 9.36 | Nobiletin-M4 | loss of methoxyl and methoxyl + demethylation | C18H16O6 | [M + H]+ | 329.1030 | 3.1 | 299.0562, 329.1027, 271.0589, 153.0170 |
| 74 | 9.36 | Sinensetin-M2 | loss of methoxyl + demethylation | C18H16O6 | [M + H]+ | 329.1030 | 3.1 | 299.0562, 329.1027, 271.0589, 153.0170 |
| 75 | 9.36 | Tangeretin-M6 | loss of methoxyl + demethylation | C18H16O6 | [M + H]+ | 329.1030 | 3.1 | 299.0562, 329.1027, 271.0589, 153.0170 |
| 76 | 9.36 | Tetramethyl-O-scutellarin-M2 | demethylation | C18H16O6 | [M + H]+ | 329.1030 | 3.1 | 299.0562, 329.1027, 271.0589, 153.0170 |
| 77 | 9.61 | Nobiletin-M5 | loss of methoxyl + demethylation | C19H18O7 | [M + H]+ | 359.1137 | 3.3 | 329.0647, 359.1146, 314.0405, 149.0582 |
| 78 | 9.61 | Tangeretin-M7 | demethylation | C19H18O7 | [M + H]+ | 359.1137 | 3.3 | 329.0647, 359.1146, 314.0405, 149.0582 |
| 79 | 9.79 | Nobiletin-M6 | demethylation | C20H20O8 | [M + H]+ | 389.1238 | 1.8 | 359.0756, 389.1259, 313.0711, 301.1398 |
| 80 | 9.85 | Atractylenolide I-M3 | internal hydrolysis | C15H20O3 | [M + H]+ | 249.1489 | 1.7 | 142.0767, 128.0643, 157.1014, 185.1333 |
| 81 | 10.03 | 3,5,7,3′,4′-Penta-methoxyflavone-M2 | demethylation | C19H18O7 | [M + H]+ | 359.1136 | 2.8 | 326.0808, 298.0865, 162.0665, 344.0917 |
| 82 | 10.15 | Nobiletin-M7 | loss of methoxyl and methoxyl + demethylation | C18H16O6 | [M + H]+ | 329.1025 | 1.7 | 299.0528, 271.0596, 329.1016, 314.0764 |
| 83 | 10.15 | Sinensetin-M3 | loss of methoxyl + demethylation | C18H16O6 | [M + H]+ | 329.1025 | 1.7 | 299.0528, 271.0596, 329.1016, 314.0764 |
| 84 | 10.15 | Tangeretin-M8 | loss of methoxyl + demethylation | C18H16O6 | [M + H]+ | 329.1025 | 1.7 | 299.0528, 271.0596, 329.1016, 314.0764 |
| 85 | 10.15 | Tetramethyl-O-scutellarin-M3 | demethylation | C18H16O6 | [M + H]+ | 329.1025 | 1.7 | 299.0528, 271.0596, 329.1016, 314.0764 |
| 86 | 10.25 | Nobiletin-M8 | demethylation | C20H20O8 | [M + H]+ | 389.1238 | 1.7 | 359.0764, 331.0804, 389.1241, 356.0851 |
| 87 | 10.25 | Tangeretin-M9 | hydroxylation | C20H20O8 | [M + H]+ | 389.1238 | 1.7 | 359.0764, 331.0804, 389.1241, 356.0851 |
| 88 | 10.64 | Xanthotoxin-M1 | hydrogenation | C12H10O4 | [M + H]+ | 219.0655 | 1.4 | 203.0339, 204.0417, 147.0448, 115.0538 |
| 89 | 10.71 | Atractylenolide I-M4 | hydroxylation + hydrogenation | C15H20O3 | [M + H]+ | 249.1485 | −0.2 | 119.0870, 185.1335, 109.0634, 128.0597 |
| 90 | 10.94 | Xanthotoxin | parent | C12H8O4 | [M + H]+ | 217.0493 | −1.1 | 202.0254, 174.0301, 161.0594, 118.0428 |
| 91 | 10.96 | 3,5,6,7,8,3′,4′-Hepta-methoxyflavone-M2 | demethylation | C21H22O9 | [M + H]+ | 419.1346 | 2.3 | 389.0868, 419.1337 371.0762, 404.1100 |
| 92 | 11.03 | Nobiletin-M9 | demethylation | C20H20O8 | [M + H]+ | 389.1232 | 0.3 | 359.0775, 341.0667, 389.1229, 374.1010 |
| 93 | 11.03 | Sinensetin-M4 | hydroxylation | C20H20O8 | [M + H]+ | 389.1232 | 0.3 | 359.0775, 341.0667, 389.1229, 374.1010 |
| 94 | 11.03 | 3,5,6,7,8,3′,4′-Hepta-methoxyflavone-M3 | loss of methoxyl + demethylation | C20H20O8 | [M + H]+ | 389.1232 | 0.3 | 359.0775, 341.0667, 389.1229, 374.1010 |
| 95 | 11.19 | Sinensetin | parent | C20H20O7 | [M + H]+ | 373.1293 | 3.1 | 373.1293, 358.1059, 343.0841, 181.0142 |
| 96 | 11.21 | Nobiletin-M10 | demethylation | C20H20O8 | [M + H]+ | 389.1238 | 1.8 | 359.0775, 341.0667, 389.1229, 374.1010 |
| 97 | 11.30 | Nobiletin-M11 | loss of methoxyl + demethylation | C19H18O7 | [M + H]+ | 359.1138 | 3.5 | 329.0674, 283.0608, 359.1128, 311.0561 |
| 98 | 11.30 | Tangeretin-M10 | demethylation | C19H18O7 | [M + H]+ | 359.1138 | 3.5 | 329.0674, 283.0608, 359.1128, 311.0561 |
| 99 | 11.30 | 3,5,6,7,8,3′,4′-Hepta-methoxyflavone-M4 | loss of methoxyl and methoxyl + demethylation | C19H18O7 | [M + H]+ | 359.1138 | 3.5 | 329.0674, 283.0608, 359.1128, 311.0561 |
| 100 | 11.32 | 3,5,6,7,8,3′,4′-Hepta-methoxyflavone-M5 | demethylation | C21H22O9 | [M + H]+ | 419.1340 | 0.9 | 389.0873, 419.1316, 371.0760, 403.1038 |
| 101 | 11.56 | Nobiletin-M12 | demethylation | C20H20O8 | [M + H]+ | 389.1241 | 2.7 | 359.0777, 389.1247, 374.1014, 344.0542 |
| 102 | 11.56 | Tangeretin-M11 | hydroxylation | C20H20O8 | [M + H]+ | 389.1241 | 2.7 | 359.0777, 389.1247, 374.1014, 344.0542 |
| 103 | 11.56 | 3,5,6,7,8,3′,4′-Hepta-methoxyflavone-M6 | loss of methoxyl + demethylation | C20H20O8 | [M + H]+ | 389.1241 | 2.7 | 359.0777, 389.1247, 374.1014, 344.0542 |
| 104 | 11.58 | Nobiletin-M13 | hydroxylation | C21H22O9 | [M + H]+ | 419.1340 | 0.9 | 389.0882, 419.1355, 371.0750, 404.1151 |
| 105 | 11.58 | 3,5,6,7,8,3′,4′-Hepta-methoxyflavone-M7 | demethylation | C21H22O9 | [M+H]+ | 419.1340 | 0.9 | 389.0882, 419.1355, 371.0750, 404.1151 |
| 106 | 11.81 | Hesperidin-M4 | dehydroxylation + loss of rhamnopyranose and hydroxymethylene | C21H22O8 | [M + H]+ | 403.1397 | 2.3 | 373.0922, 403.1395, 327.0848, 342.1096 |
| 107 | 11.87 | Atractylenolide II-M6 | hydroxylation | C15H20O3 | [M + H]+ | 249.1491 | 2.2 | 131.0866, 142.0778, 157.1045, 117.0668 |
| 108 | 11.89 | sec-O-Glucosyl-hamaudol-M2 | loss of glucose | C15H16O5 | [M + H]+ | 277.1078 | 2.7 | 205.0492, 259.0972, 277.1067, 177.0539 |
| 109 | 11.89 | Hamaudol | parent | C15H16O5 | [M + H]+ | 277.1078 | 2.7 | 205.0492, 259.0972, 277.1067, 177.0539 |
| 110 | 11.89 | 3′-O-Angeloyl-hamaudol-M1 | loss of angeloyl | C15H16O5 | [M + H]+ | 277.1078 | 2.7 | 205.0492, 259.0972, 277.1067, 177.0539 |
| 111 | 11.89 | 3′-O-Acetyl-hamaudol-M1 | deacetylation | C15H16O5 | [M + H]+ | 277.1078 | 2.7 | 205.0492, 259.0972, 277.1067, 177.0539 |
| 112 | 12.19 | Narirutin-M3 | loss of rhamnopyranose | C21H22O9 | [M + H]+ | 419.1346 | 2.1 | 389.0873, 419.1336, 404.1104, 371.0772 |
| 113 | 12.36 | Nobiletin-M14 | loss of methoxyl and methoxyl | C19H18O6 | [M + H]+ | 343.1182 | 1.8 | 313.0700, 181.0148, 285.0767, 343.1192 |
| 114 | 12.36 | Sinensetin-M5 | loss of methoxyl | C19H18O6 | [M + H]+ | 343.1182 | 1.8 | 313.0700, 181.0148, 285.0767, 343.1192 |
| 115 | 12.36 | Tetramethyl-O-scutellarin | parent | C19H18O6 | [M + H]+ | 343.1182 | 1.8 | 313.0700, 181.0148, 285.0767, 343.1192 |
| 116 | 12.68 | Atractylenolide I-M5 | hydroxylation | C15H18O3 | [M + H]+ | 247.1330 | 0.5 | 153.0664, 183.1194, 56.9667, 81.0702 |
| 117 | 13.22 | Tetramethyl-O-scutellarin-M4 | hydroxylation + methylation | C20H20O7 | [M+H]+ | 373.1290 | 2.3 | 343.0819, 297.0812, 312.1013, 373.1312 |
| 118 | 13.37 | Nobiletin | parent | C21H22O8 | [M + H]+ | 403.1397 | 2.3 | 373.0926, 403.1388, 388.1167, 358.0683 |
| 119 | 13.37 | 3,5,6,7,8,3′,4′-Hepta-methoxyflavone-M8 | loss of methoxyl | C21H22O8 | [M + H]+ | 403.1397 | 2.3 | 373.0926, 403.1388, 388.1167, 358.0683 |
| 120 | 13.50 | Atractylenolide III-M5 | hydrogenation | C15H22O3 | [M + H]+ | 251.1640 | −0.7 | 121.1001, 93.0710, 131.0860, 149.0220 |
| 121 | 13.51 | 3,5,6,7,8,3′,4′-Hepta-methoxyflavone-M9 | demethylation | C21H22O9 | [M + H]+ | 419.1338 | 0.4 | 226.0487, 419.1274, 178.0606, 183.0312 |
| 122 | 13.52 | Atractylenolide I-M6 | hydrogenation | C15H20O2 | [M + H]+ | 233.1536 | 0.1 | 79.0557, 131.0837, 93.0706, 105.0720 |
| 123 | 14.14 | 3,5,6,7,8,3′,4′-Heptamethoxyflavone | parent | C22H24O9 | [M + H]+ | 433.1503 | 2.4 | 403.1034, 433.1499, 418.1256, 385.0923 |
| 124 | 14.14 | 3,5,7,8,3′,4′-Hexa-methoxyflavone-M1 | hydroxylation + methylation | C22H24O9 | [M + H]+ | 433.1503 | 2.4 | 403.1034, 433.1499, 418.1256, 385.0923 |
| 125 | 14.69 | Nobiletin-M15 | loss of methoxyl | C20H20O7 | [M + H]+ | 373.1292 | 2.6 | 343.0819, 373.1303, 358.1058, 211.0243 |
| 126 | 14.69 | Tangeretin | parent | C20H20O7 | [M + H]+ | 373.1292 | 2.6 | 343.0819, 373.1303, 358.1058, 211.0243 |
| 127 | 14.69 | 3,5,6,7,8,3′,4′-Hepta-methoxyflavone-M10 | loss of methoxyl and methoxyl | C20H20O7 | [M+H]+ | 373.1292 | 2.6 | 343.0819, 373.1303, 358.1058, 211.0243 |
| 128 | 14.71 | 3β-Hydroxy-atractylone-M1 | desaturation | C15H18O2 | [M + H]+ | 231.1383 | 1.3 | 91.0534, 128.0616, 105.0706, 143.0840 |
| 129 | 14.73 | Atractylenolide III | parent | C15H20O3 | [M − H]− | 247.1332 | 1.1 | 203.1438, 187.1119, 172.0872, 147.0811 |
| 130 | 14.73 | Atractylenolide II-M7 | hydroxylation | C15H20O3 | [M − H]− | 247.1332 | 1.1 | 203.1438, 187.1119, 172.0872, 147.0811 |
| 131 | 16.59 | 7-OH-3,5,6,8,3′,4′-Hexamethoxy-flavone | parent | C21H22O9 | [M + H]+ | 419.1339 | 0.6 | 419.1346, 404.1085, 389.0879, 371.0763 |
| 132 | 17.55 | Atractylenolide I-M7 | hydrogenation | C15H20O2 | [M + H]+ | 233.1537 | 0.5 | 159.0813, 131.0867, 105.0711, 91.0555 |
| 133 | 17.55 | Atractylenolide II | parent | C15H20O2 | [M + H]+ | 233.1537 | 0.5 | 159.0813, 131.0867, 105.0711, 91.0555 |
| 134 | 19.60 | Atractylenolide I | parent | C15H18O2 | [M + H]+ | 231.1381 | 0.7 | 231.1392, 185.1334, 143.0849, 128.0633 |
| Group | Weight/g | DAI | Macroscopic Damage Score |
|---|---|---|---|
| Sham control | 390.4 ± 16.1 | 0.00 ± 0.00 | 0.00 ± 0.00 |
| TNBS control | 295.2 ± 18.0 *** | 3.50 ± 0.57*** | 3.80 ± 0.63 *** |
| Crude BSS | 336.6 ± 17.9 ### | 2.27 ± 0.38 ΔΔΔ | 2.30 ± 0.68 ### |
| Processed BSS | 371.1 ± 17.3 ###ΔΔΔ | 1.33 ± 0.61 ###ΔΔΔ | 1.50 ± 0.53 ###ΔΔ |
| SASP | 374.2 ± 21.2 ### | 1.13 ± 0.55 ### | 1.30 ± 0.48 ### |
| Cytokine | Crude BSS Group | Processed BSS Group | ||||||||||
|---|---|---|---|---|---|---|---|---|---|---|---|---|
| 3 d | 6 d | 9 d | 13 d | 17 d | 21 d | 3 d | 6 d | 9 d | 13 d | 17 d | 21 d | |
| IL-6 | 0.369 | 0.450 | 0.140 | 0.277 | 0.439 | 0.579 | 0.512 | 0.497 | 0.284 | 0.436 | 0.666 | 0.876 |
| IL-10 | 0.419 | 0.191 | 0.092 | 0.384 | 0.706 | 0.888 | 0.453 | 0.331 | 0.541 | 1.043 | 1.564 | 2.036 |
| TGF-β1 | 0.187 | 0.233 | 0.443 | 0.683 | 0.941 | 1.246 | 0.307 | 0.487 | 0.809 | 1.171 | 1.677 | 2.292 |
| TNF-α | 0.195 | 0.222 | 0.303 | 0.443 | 0.569 | 0.674 | 0.298 | 0.377 | 0.511 | 0.659 | 0.822 | 0.928 |
| Rank Order | Gray Correlation Grade | |||||||
|---|---|---|---|---|---|---|---|---|
| IL-6 | IL-10 | TGF-β1 | TNF-α | |||||
| Compound | Correlation | Compound | Correlation | Compound | Correlation | Compound | Correlation | |
| 1 | Atractylenolide I-M5 | 0.9665 | Nobiletin-M3 | 0.9170 | 3,5,6,7,8,3′,4′-Hepta-methoxyflavone-M9 | 0.9312 | Atractylenolide I-M5 | 0.9339 |
| 2 | Hesperidin-M2 | 0.9539 | 3,5,6,7,8,3′,4′-Hepta-methoxyflavone-M9 | 0.9129 | Nobiletin-M3 | 0.9135 | 3,5,6,7,8,3′,4′-Hepta-methoxyflavone-M9 | 0.9301 |
| 3 | Cimifugin | 0.9534 | Sinensetin-M1 | 0.9019 | Dimethyl anthranilate-M1 | 0.9042 | Tangeretin-M4 | 0.9286 |
| 4 | Albiflorin-M2 | 0.9525 | Atractylenolide I-M5 | 0.8962 | Prim-O-glucosyl-cimifugin | 0.9026 | D-Mannose | 0.9191 |
| 5 | Cimifugin-M3 | 0.9505 | Cimifugin-M1 | 0.8864 | Atractylenolide I-M5 | 0.9004 | Nobiletin-M3 | 0.9173 |
| 6 | 5-O-Methylvisamminol-M2 | 0.9491 | Atractylenolide III-M3 | 0.8859 | Tangeretin-M4 | 0.8998 | Albiflorin-M1 | 0.9165 |
| 7 | sec-O-Glucosyl-hamaudol | 0.9443 | 3,5,7,3′,4′-Penta-methoxyflavone-M2 | 0.8813 | Albiflorin-M1 | 0.8971 | Cimifugin-M3 | 0.9151 |
| 8 | Atractylenolide II | 0.9422 | Dimethyl anthranilate-M1 | 0.8799 | Cimifugin-M1 | 0.8960 | Atractylenolide II | 0.9133 |
| 9 | Atractylenolide III-M5 | 0.9353 | Atractylenolide III | 0.8781 | Atractylenolide II-M2 | 0.8930 | Nobiletin-M1 | 0.9086 |
| 10 | Atractylenolide III-M4 | 0.9343 | Tangeretin-M4 | 0.8756 | Atractylenolide I-M2 | 0.8918 | Dimethyl anthranilate-M1 | 0.9084 |
| Score | Weight Loss (%) | Stool Consistency | Blood in Stool |
|---|---|---|---|
| 0 | (−) | Normal | Hemoccult (−) |
| 1 | 1–5 | ||
| 2 | 5–10 | Loose | Hemoccult (+) |
| 3 | 10–15 | ||
| 4 | >15 | Diarrhoea | Gross bleeding |
© 2019 by the authors. Licensee MDPI, Basel, Switzerland. This article is an open access article distributed under the terms and conditions of the Creative Commons Attribution (CC BY) license (http://creativecommons.org/licenses/by/4.0/).
Share and Cite
Cai, H.; Xu, Y.; Xie, L.; Duan, Y.; Zhou, J.; Liu, J.; Niu, M.; Zhang, Y.; Shen, L.; Pei, K.; et al. Investigation on Spectrum-Effect Correlation between Constituents Absorbed into Blood and Bioactivities of Baizhu Shaoyao San before and after Processing on Ulcerative Colitis Rats by UHPLC/Q-TOF-MS/MS Coupled with Gray Correlation Analysis. Molecules 2019, 24, 940. https://doi.org/10.3390/molecules24050940
Cai H, Xu Y, Xie L, Duan Y, Zhou J, Liu J, Niu M, Zhang Y, Shen L, Pei K, et al. Investigation on Spectrum-Effect Correlation between Constituents Absorbed into Blood and Bioactivities of Baizhu Shaoyao San before and after Processing on Ulcerative Colitis Rats by UHPLC/Q-TOF-MS/MS Coupled with Gray Correlation Analysis. Molecules. 2019; 24(5):940. https://doi.org/10.3390/molecules24050940
Chicago/Turabian StyleCai, Hao, Yangyang Xu, Li Xie, Yu Duan, Jia Zhou, Jing Liu, Minjie Niu, Yating Zhang, Lin Shen, Ke Pei, and et al. 2019. "Investigation on Spectrum-Effect Correlation between Constituents Absorbed into Blood and Bioactivities of Baizhu Shaoyao San before and after Processing on Ulcerative Colitis Rats by UHPLC/Q-TOF-MS/MS Coupled with Gray Correlation Analysis" Molecules 24, no. 5: 940. https://doi.org/10.3390/molecules24050940
APA StyleCai, H., Xu, Y., Xie, L., Duan, Y., Zhou, J., Liu, J., Niu, M., Zhang, Y., Shen, L., Pei, K., & Cao, G. (2019). Investigation on Spectrum-Effect Correlation between Constituents Absorbed into Blood and Bioactivities of Baizhu Shaoyao San before and after Processing on Ulcerative Colitis Rats by UHPLC/Q-TOF-MS/MS Coupled with Gray Correlation Analysis. Molecules, 24(5), 940. https://doi.org/10.3390/molecules24050940