Article

Temperature-Dependent Evolution of Raman Spectra of Methylammonium Lead Halide Perovskites, CH3NH3PbX3 (X = I, Br)

1
Department of Chemistry and Biochemistry, School of Advanced Science and Engineering, Waseda University, Shinjuku, Tokyo 169-8555, Japan
2
Research Center for Computational Design of Advanced Functional Materials (CD-FMat), National Institute of Advanced Industrial Science and Technology (AIST), 1-1-1 Umezono, Tsukuba, Ibaraki 305-8568, Japan
3
College of Industrial Technology, Nihon University, Izumi-cho 1-2-1, Narashino, Chiba 27-8575, Japan
*
Author to whom correspondence should be addressed.
Present address: Technical Research Center, Mazda Motor Corporation, 3-1 Shinchi, Fuchu-cho, Aki-gun, Hiroshima 730-8670, Japan.
Molecules 2019, 24(3), 626; https://doi.org/10.3390/molecules24030626
Submission received: 5 January 2019 / Revised: 2 February 2019 / Accepted: 8 February 2019 / Published: 11 February 2019
(This article belongs to the Special Issue Raman Spectroscopy: A Spectroscopic 'Swiss-Army Knife')

Abstract

:
We present a Raman study on the phase transitions of organic/inorganic hybrid perovskite materials, CH3NH3PbX3 (X = I, Br), which are used as solar cells with high power conversion efficiency. The temperature dependence of the Raman bands of CH3NH3PbX3 (X = I, Br) was measured in the temperature ranges of 290 to 100 K for CH3NH3PbBr3 and 340 to 110 K for CH3NH3PbI3. Broad ν1 bands at ~326 cm−1 for MAPbBr3 and at ~240 cm−1 for MAPbI3 were assigned to the MA–PbX3 cage vibrations. These bands exhibited anomalous temperature dependence, which was attributable to motional narrowing originating from fast changes between the orientational states of CH3NH3+ in the cage. Phase transitions were characterized by changes in the bandwidths and peak positions of the MA–cage vibration and some bands associated with the NH3+ group.

Graphical Abstract

1. Introduction

Organic/inorganic hybrid perovskite materials, CH3NH3PbX3 (X = I, Br), have attracted much research interest for their use in solar cells over the past few years because solar cells fabricated with perovskite show high power conversion efficiencies of more than 20% [1,2,3]. Although perovskites form a large family of compounds with ABX3 stoichiometry, the peculiar structure of the materials is a combination of organic and inorganic groups with a unique interplay, which influences their optical and electronic properties. CH3NH3PbI3 exhibits a broad absorption from visible to near-infrared [1,4]; its band gap is 1.52 eV [5]. The electron-hole diffusion length is ~100 nm [6,7]. Charge carriers exhibit high mobilities [5,8]. The excellent power conversion efficiencies of the organic/inorganic hybrid perovskite solar dells originate from these properties.
The crystal structures and phase transitions of CH3NH3PbX3 (X = I, Br) were determined by X-ray and neutron diffraction [9,10,11,12], calorimetric measurements [12,13], and nuclear quadrupole resonance spectroscopy [14]. The crystal structures and transition temperatures are listed in Table 1. There are four and three crystal phases in CH3NH3PbBr3 and CH3NH3PbI3, respectively. In one study [9], the space group of the orthorhombic phases was found to be Pna21. Later reinvestigations of the space group [10,11] indicated that the space group is Pnma. In these crystal structures, there exists a methylammonium (MA) CH3NH3+ cation at the center of a cube formed by corner-sharing PbX6 octahedra, i.e., an anionic PbX3 network. All the phase transitions are of the order-disorder type [13] and of the first order, although the highest-temperature transitions are close to the second order [13]. In diffraction studies, the position, orientation, and rotation around the C−N bond of the MA cation within the inorganic network were not determined completely [9,10,11,12,13,14]. MA cations have dynamically disordered states in orientation of the C−N axis and around the C−N axis [13,15,16,17,18]. The reorientational dynamics of MA cations were investigated [15,16,17,18]. The characteristic reorientation time was less than a few ps [16,17]. The electrostatic interaction between positive MA cations and the anionic PbX3 network, which is governed by hydrogen-bonding interactions between the NH3+ group in the MA cation and the electronegative halide atoms [17,18], will play an important role in the dynamics of MA cations. The electronic structures of organic/inorganic hybrid perovskites were calculated [19,20,21,22,23,24,25]. The optical band gap originates from a direct transition between Pb(6s)–I(5p) valence bands and Pb(6p) conduction bands. The optical band gap strongly correlates with the bond angles through the steric size of the molecular cation existing in the inorganic PbX3 network [23]. The interaction of the organic cation with the PbX3 network also has an impact on photoluminescence [26,27,28], exciton binding energy [29], and charge carrier lifetime [30].
Infrared and Raman spectroscopies are very useful for studying phase transitions, lattice dynamics, and interactions between the organic and inorganic counterparts of hybrid perovskite materials. In particular, Raman spectroscopy can be used for in situ studies of devices fabricated on a glass substrate, i.e., buried layers. Onoda-Yamamuro [13] reported that an infrared band assigned to MA rocking at ~910 cm−1 is sensitive to the phase transitions of MAPbX3 (X = I, Br, Cl) and determined the correlation times and activation energies for the hindered rotational motion of MA from the widths of the band. After the report of high-performance solar cells fabricated with MAPbI3 [1], many infrared [31,32,33,34,35] and Raman [36,37,38,39,40,41,42,43] studies were performed. Low-wavenumber lattice vibrations can be detected by Raman spectroscopy. However, it should be noted that MAPbI3 compounds are damaged under strong laser irradiation, even in vacuum, although these compounds are unstable in ambient air [37]. The observed infrared and Raman bands were assigned on the basis of the results of theoretical calculations [33,36,38,40,41,43,44]. The observed bands can be attributed to lattice vibrations and intramolecular vibrations of MA. The lattice vibrations were analyzed [41,43]. The reorientation dynamics of MA ions in MAPbI3 was studied by two-dimensional (2D) infrared spectroscopy and molecular dynamics [32]. The characteristic reorientation time was ~300 fs and ~3 ps [32]. The temperature evolution of infrared spectra [35] and Raman spectra [39,40,41] was investigated in order to characterize phase transitions and vibrational relaxation. However, detailed temperature dependence of Raman bands was necessary in order to further understand the phase transitions and the interaction between the organic cation and the PbX3 network.
In this study, we investigated the temperature-dependent evolution of almost of all the Raman bands for MAPbI3 and MAPbBr3 in a wide range of temperature. We analyzed the changes in Raman bandwidths and peak positions across the phase transition temperatures in detail, focusing our attention on the intramolecular vibrations of MA. We proposed motional narrowing for broad bands at ~326 cm−1 for MAPbBr3 and at ~240 cm−1 for MAPbI3. We here discuss the rotational dynamics of MA cations, which is closely related to the optical properties of the perovskites.

2. Results and Discussion

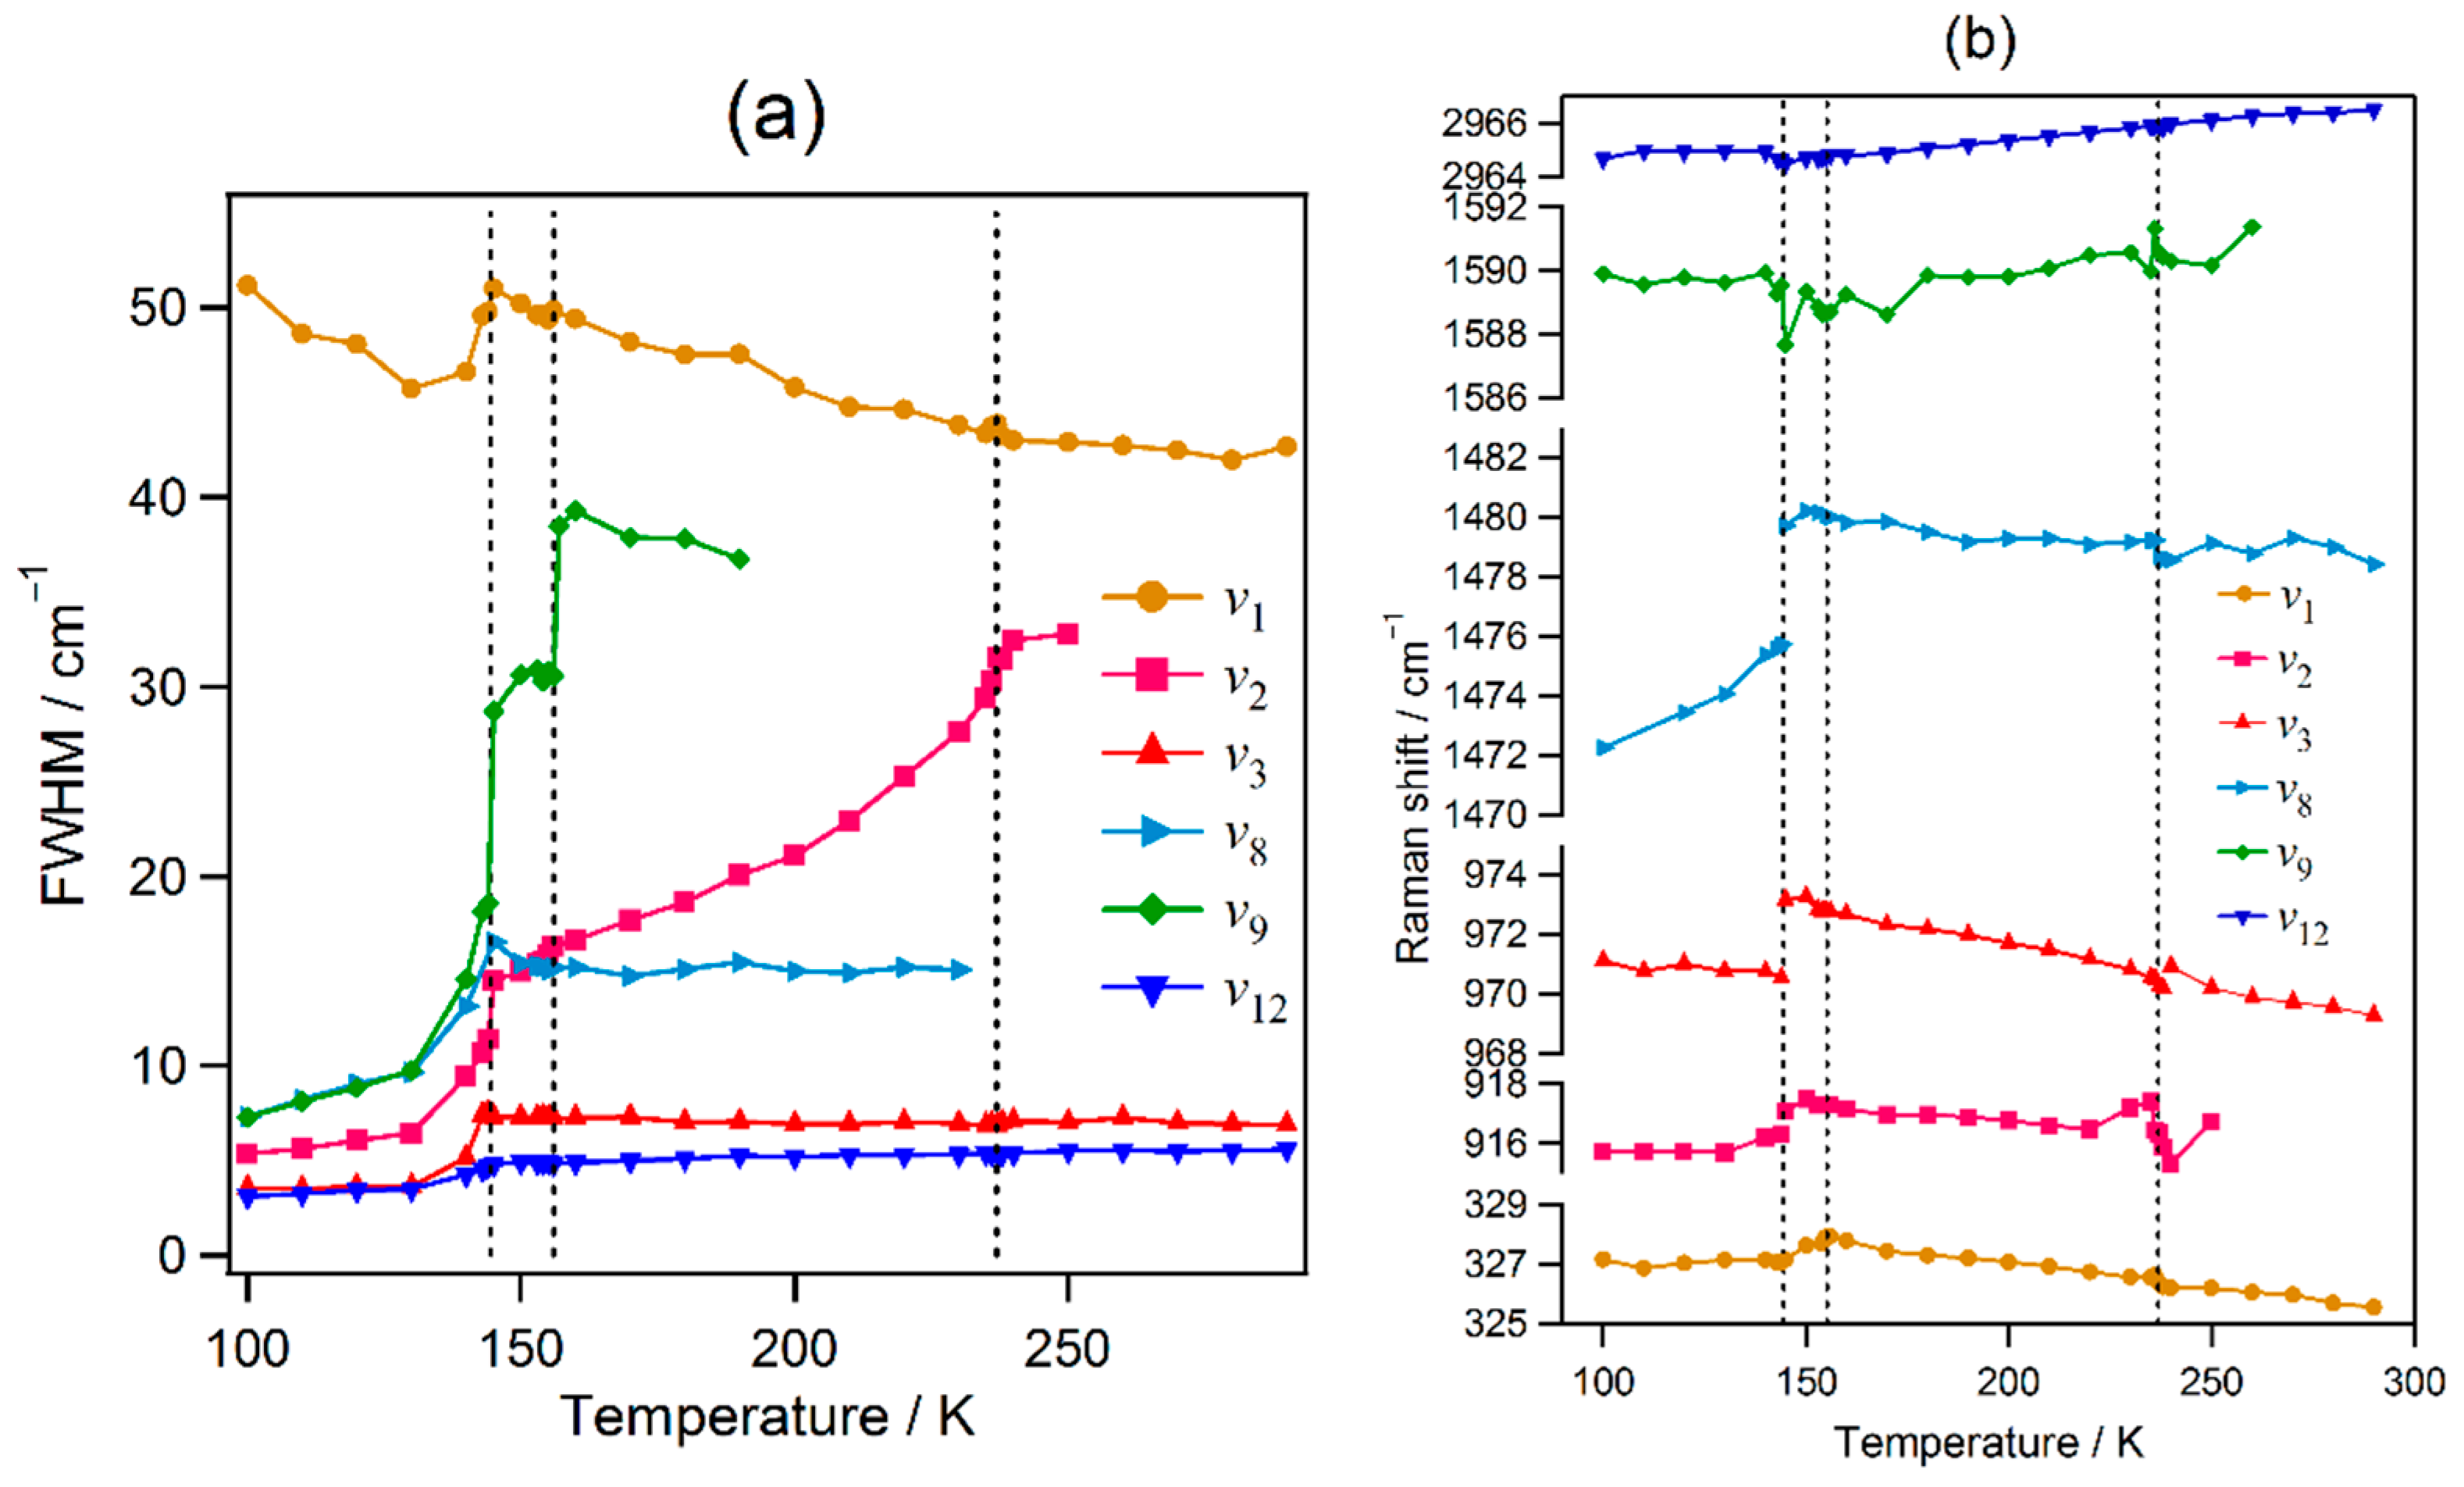
2.1. Temperature-Dependent Evolution of the Raman Spectrum of MAPbBr3

The Raman spectra of an MAPbBr3 pellet at 100, 150, 200, and 290 K with an excitation wavelength of 633 nm are shown in Figure 1. The Raman spectra at 100, 150, 200, and 290 K originate from the orthorhombic, tetragonal I, tetragonal II, and cubic phases, respectively.
Observed Raman bands below 200 cm−1 are attributed to lattice vibrations [40,41]. The lattice vibrations of the orthorhombic phase were assigned [41]. The bands above 400 cm−1 are attributed to intramolecular vibrations of MA. The assignments of the observed MA bands made on the basis of those reported in previous papers [41,43,44,45] are listed in Table S1.
A band observed at 328–325 cm−1 is called ν1. Spectral features of the ν1 band are peculiar. This band is very broad compared with other bands. This band is attributed to the torsional vibration of MA [40,41], and the motion is coupled with the inorganic cage through NH···Br hydrogen bonds [41]. Similar modes were observed at 240–249 cm−1 for MAPbI3 [38,41] and at 488 cm−1 for MAPbCl3 [41,46]; the observed peak position depends largely on X, which is consistent with the coupling through the NH···X hydrogen bonds. The intensity of the band is stronger than those of the intramolecular vibrations at 150, 200, and 290 K. For a free MA molecule, the torsional band should be much less intense than those attributed to intramolecular vibrations. Recently, Mattoni et al. [44] reported the theoretical temperature evolution of vibrational spectra of MAPbI3 using density functional theory calculations and classical molecular dynamics. They found that the thermally induced weakening of the H···I interactions and the anharmonic mixing of modes give two vibrational peaks at 200–250 cm−1 (X band) that are not present below 10 K. The X band is not a pure torsion (twisting), but mixed with breathing or rocking motions of hydrogen atoms. The observed ν1 band is attributable to the theoretical X band. We call this band the MA–cage vibration. The assignments of other main bands are as follows: ν2, ~917 cm−1, CH3 rocking and NH3+ rocking; ν3, ~971 cm−1, C−N+ stretching; ν8, ~1478 cm−1, NH3+ symmetric deformation; ν9, ~1592 cm−1, NH3+ degenerate deformation; ν12, ~2965 cm−1, CH3 symmetric stretching. The ν2, ν8, and ν9 bands are associated with the NH3+ group.
The widths (full width at half maximum, FWHM) and the peak positions of the ν1, ν2, ν3, ν8, ν9, and ν12 bands are shown in Figure 2. Across the orthorhombic-to-tetragonal I phase transition at 149 K, the FWHMs of the bands show large changes—the ν2 and ν9 bands exhibit abrupt increases, whereas the ν1, ν3, ν8, and ν12 bands exhibit sharp bends. The peak positions of the ν2, ν3, and ν8 bands show apparent abrupt increases. These bandwidth and peak position results are consistent with a first-order phase transition. The ordering of MA cations is associated with this transition.
Across the transition from the tetragonal I phase to tetragonal II phase at 154 K, the FWHM of the ν9 band exhibits an apparent abrupt increase, although the other bands exhibit no apparent changes. The peak position of the ν1 band exhibits a small deflection. This abrupt change is consistent with a first-order phase transition. It is interesting that only the ν9 band assigned to NH3+ degenerate deformation exhibits a large FWHM change.
Across the transition from the tetragonal II phase to the cubic phase at 236 K, the FWHM of the ν2 band shows a significant deflection. The peak positions of the ν1 and ν8 bands exhibit small but abrupt decreases, whereas the peak position of the ν3 band exhibits a small but abrupt increase. The peak position of the ν2 band exhibits a dispersion-like feature. The observed changes across the tetragonal II-to-cubic transition are small. These small changes indicate that this transition is close to the second order.
The FWHM of the ν1 band decreases noticeably at the orthorhombic, tetragonal I, and tetragonal II phases except at 130–150 K, whereas the widths of other bands exhibit increases or plateaus. This is an anomalous temperature dependence, which is attributable to the motional narrowing phenomenon in the nuclear magnetic resonance theory [47]. The MA ion in the PbX3 cage can take several orientations [13,16,17,18]. Each orientation gives rise to a different vibrational state, i.e., peak position in the Raman spectrum. If the reorientation change of MA cations is fast, motional narrowing can be observed. The change in the width of the ν1 band is attributable to rapid exchanges among these orientational states.

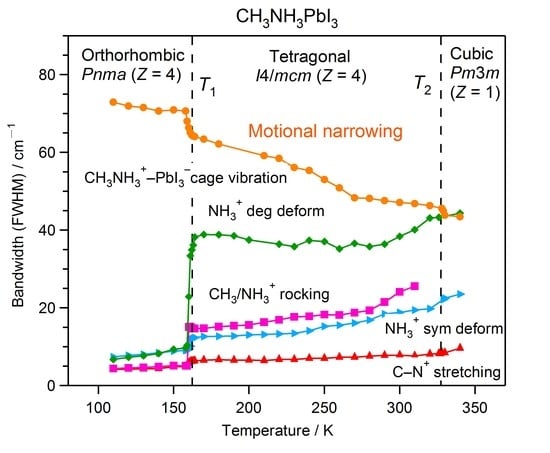
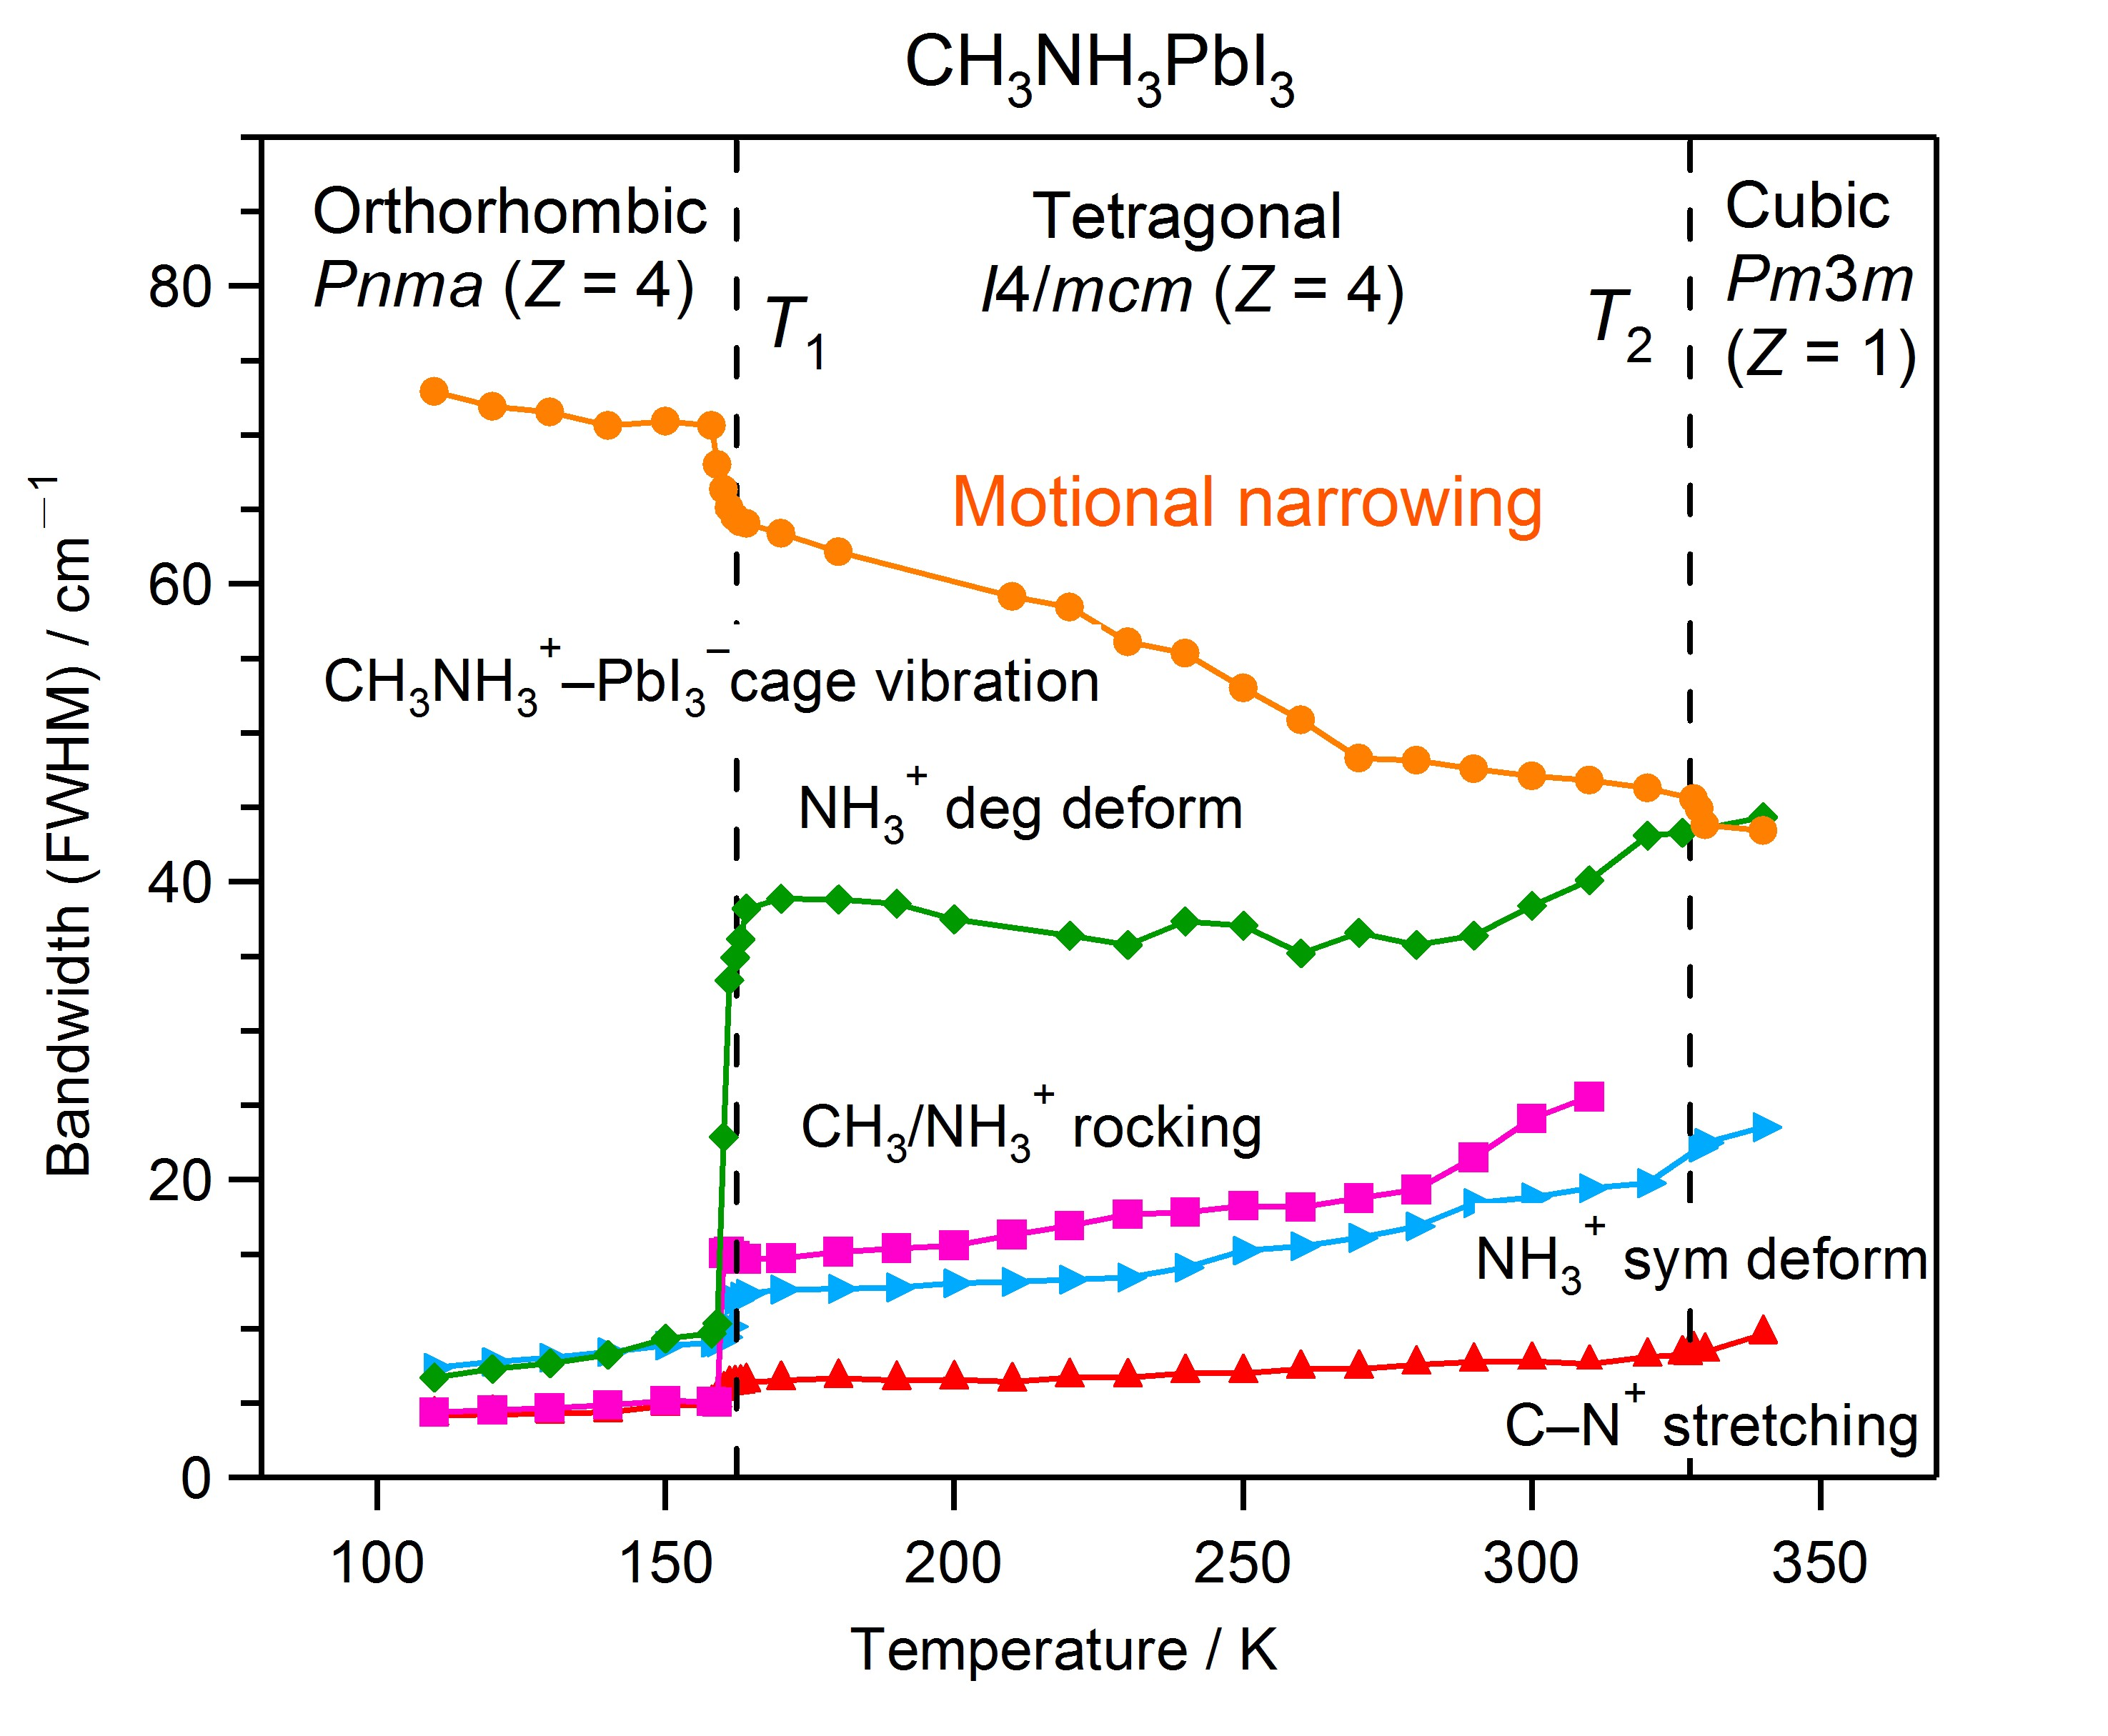
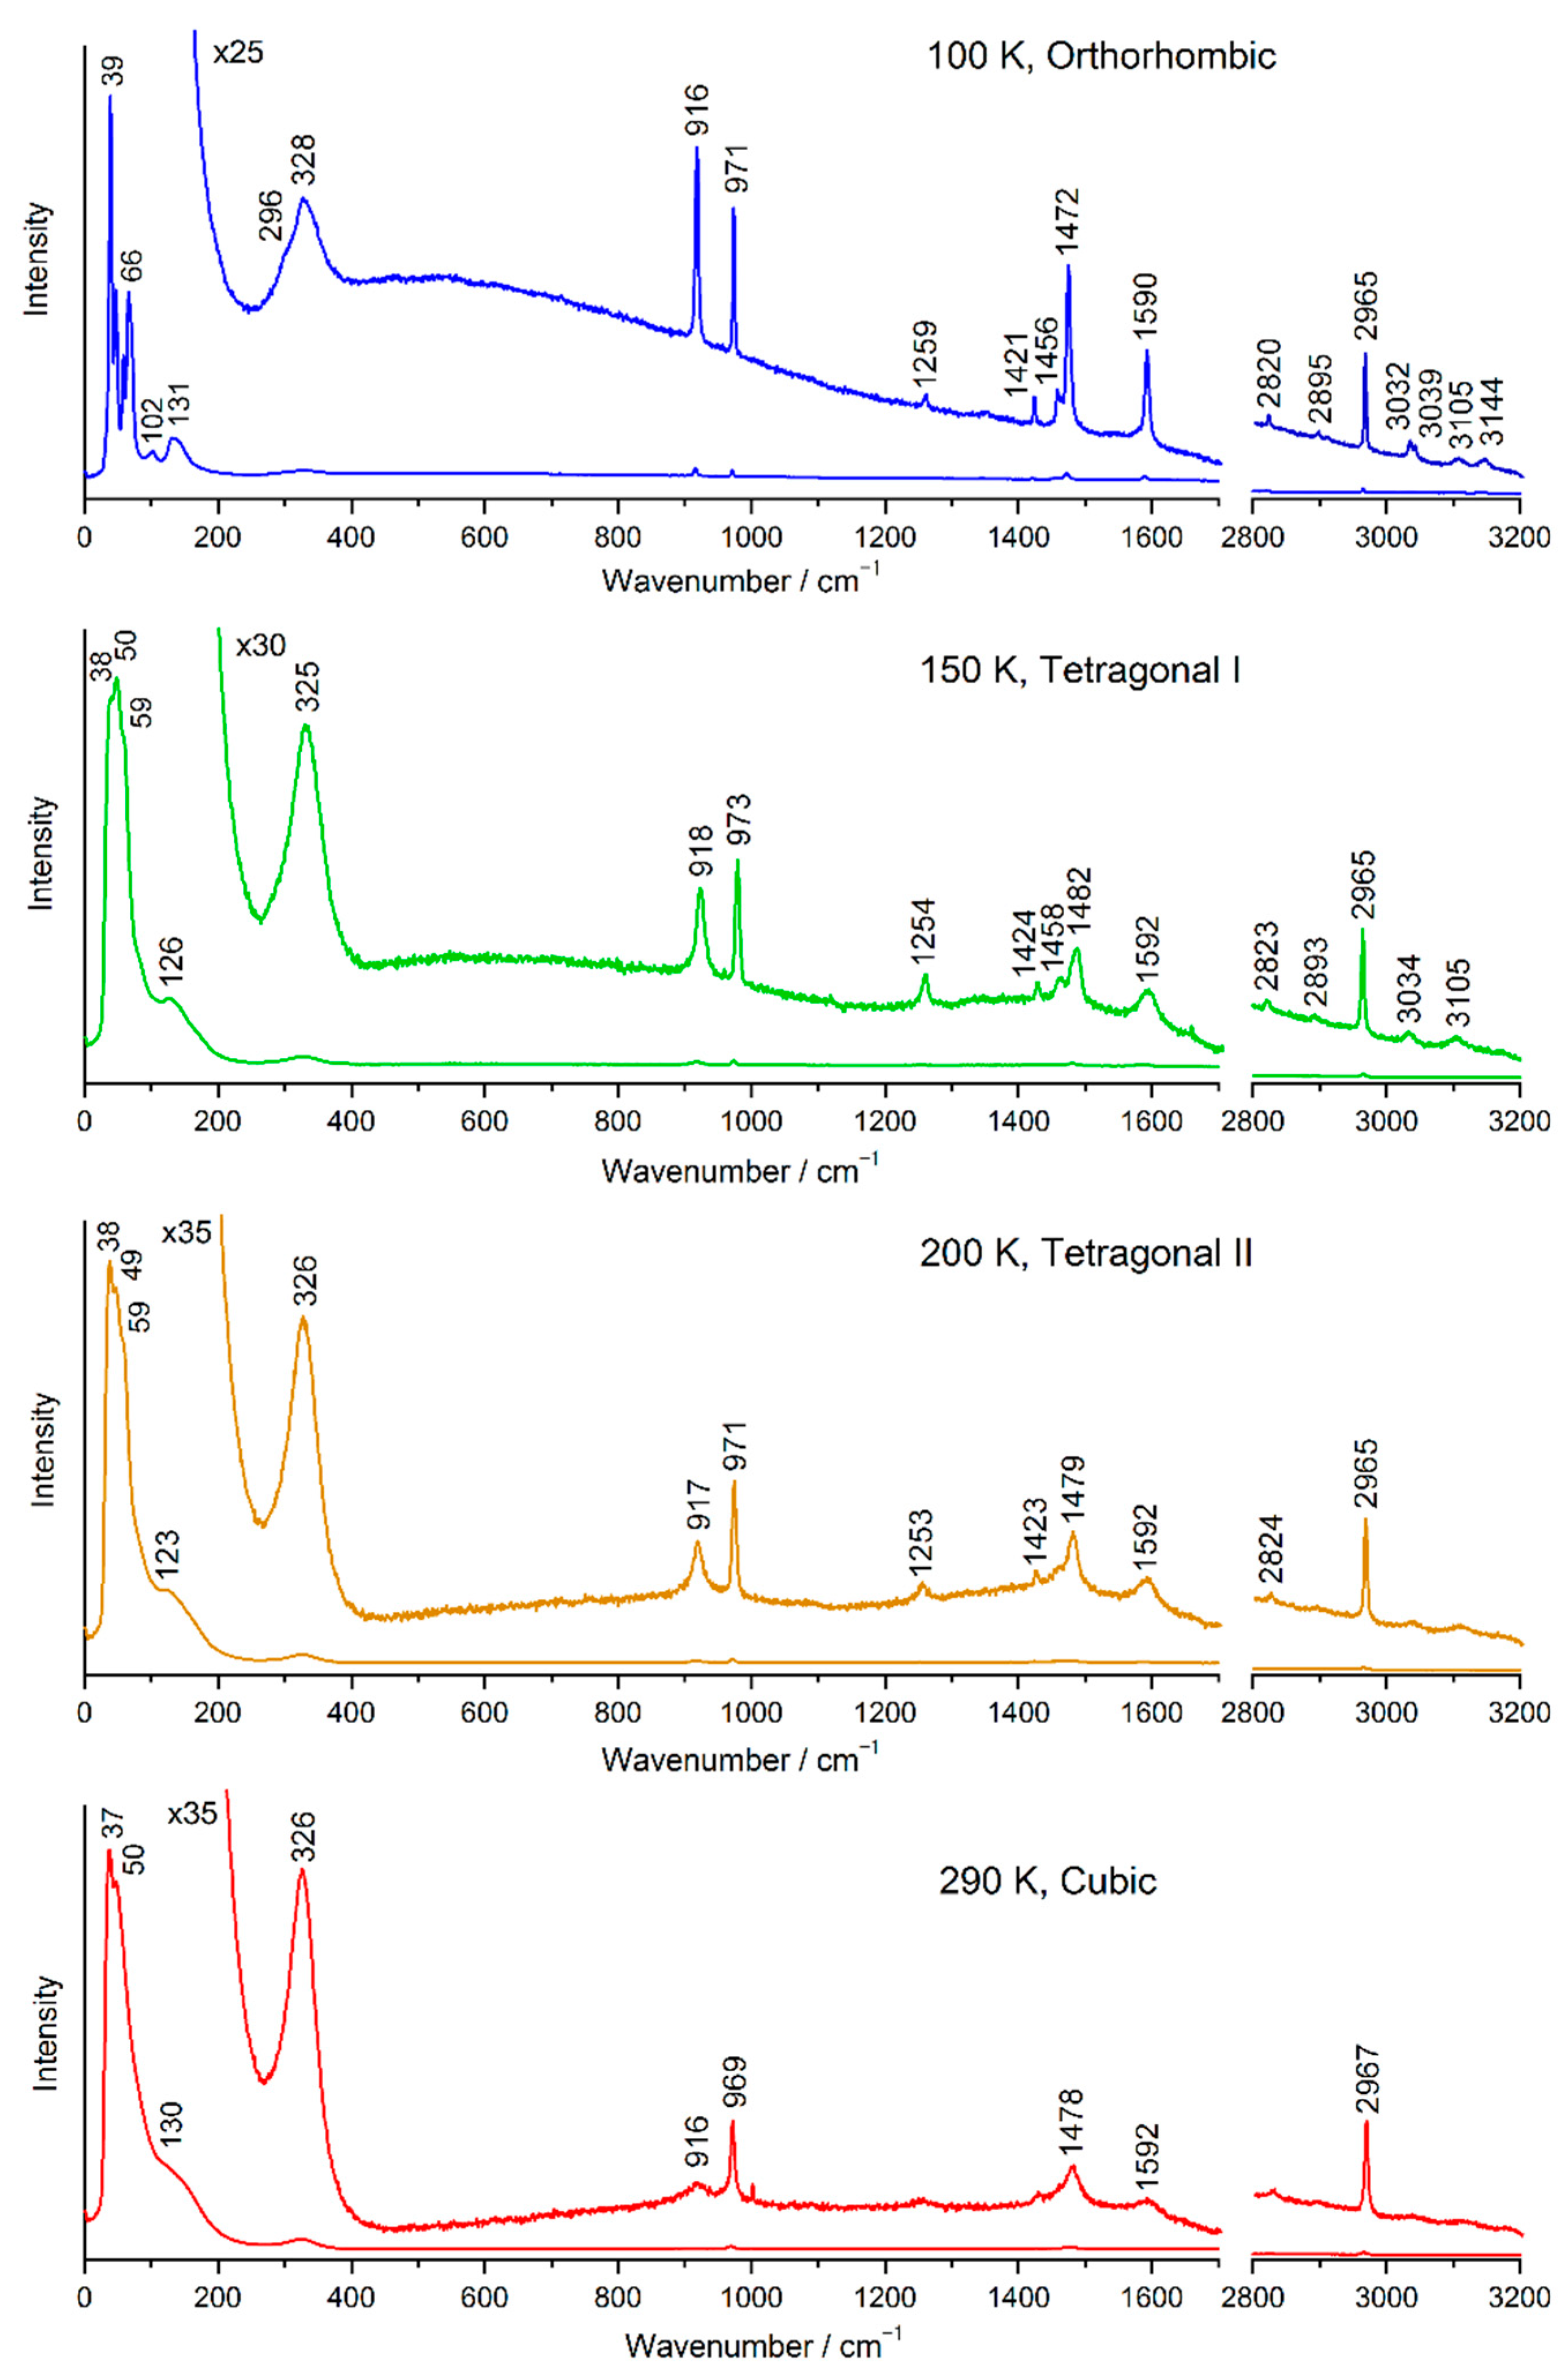
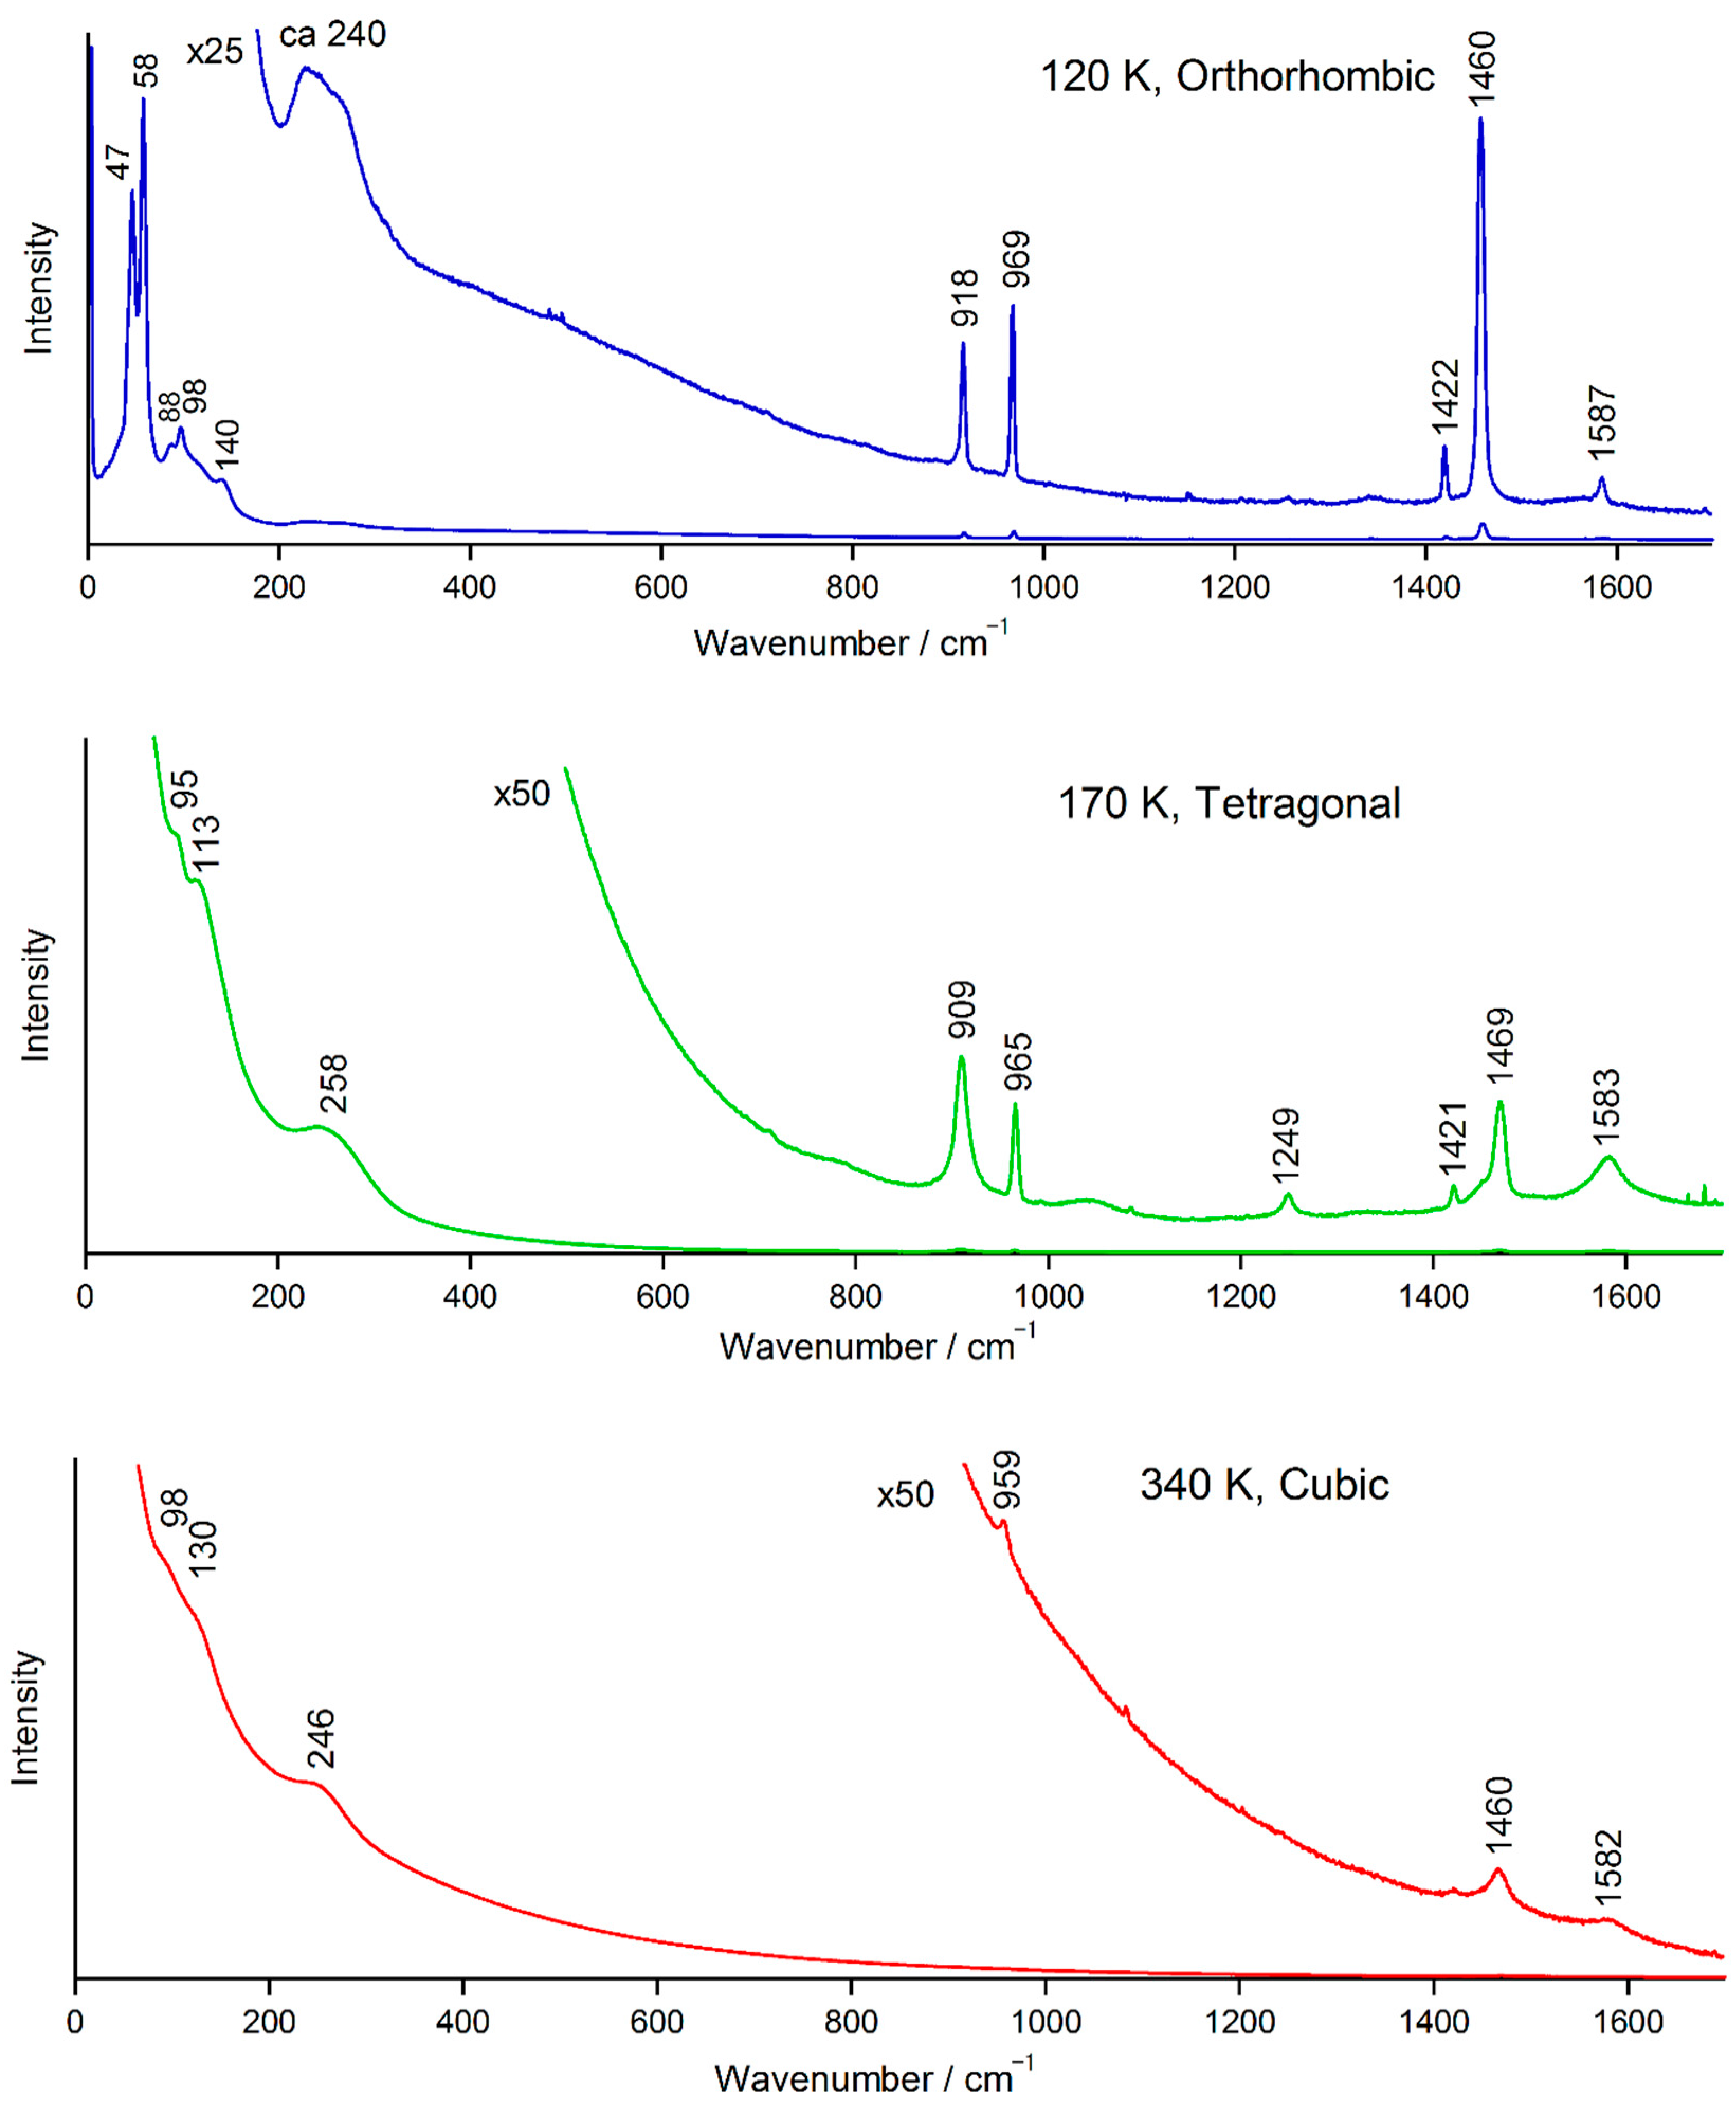
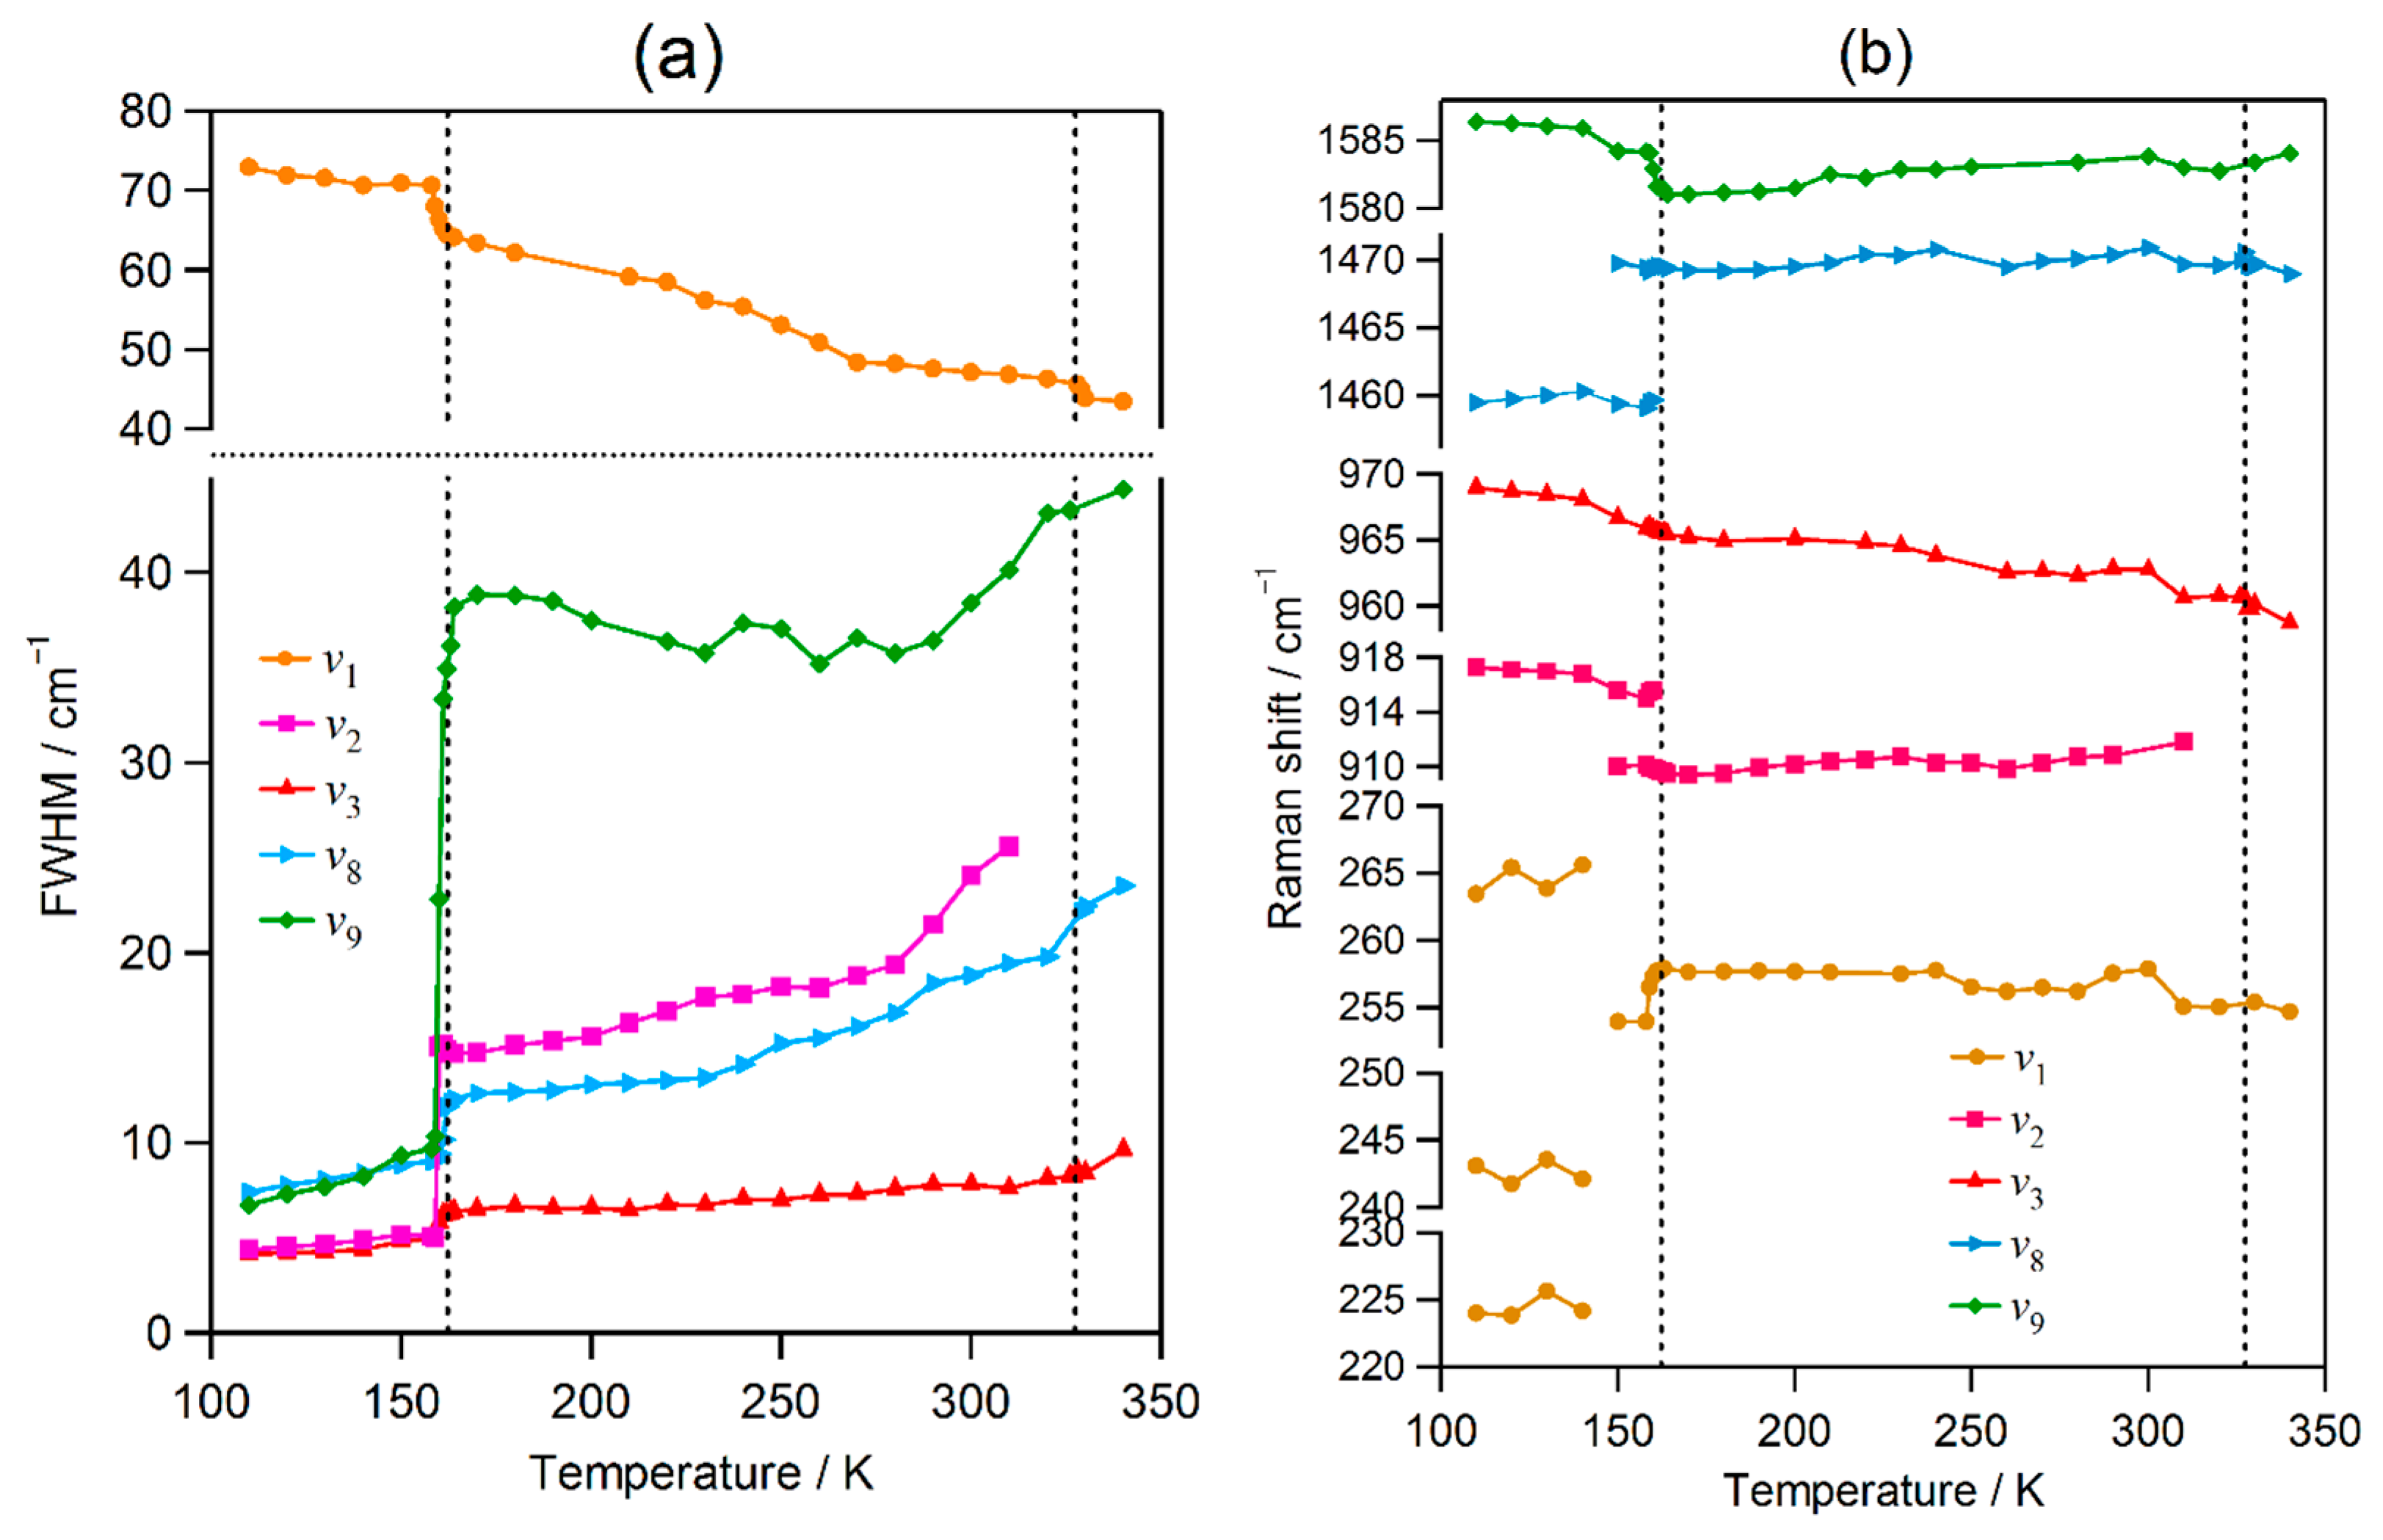
2.2. Temperature Evolution of the Raman Spectrum of MAPbI3

The Raman spectra of an MAPbI3 pellet at 120, 170, and 340 K with 830 nm excitation are shown in Figure 3. In these spectra, CH stretching bands were not observed because the charge-coupled device detector has no spectral response in this region. MAPbI3 exhibits photoluminescence at 776 nm [22]. The tail of the photoluminescence was observed as a background with Raman bands. The intensity of photoluminescence increased with increasing temperature. The Raman spectra at 120, 170, and 340 K originate from the orthorhombic, tetragonal, and cubic phases, respectively. Raman bands below 200 cm−1 are attributed to lattice vibrations, whereas the bands above 400 cm−1 are attributed to intramolecular vibrations of MA [41,43,44]. The assignments of the intramolecular vibrations are listed in Table S2.
Spectral features of the ν1 band observed at 240–249 cm−1 are peculiar, as described for MAPbBr3 in 2.1. This band is very broad compared with other bands. The ν1 band is assigned to the MA–cage vibration, corresponding to the X band in the theoretical study [44]. The band originates from the thermally induced weakening of the H···I interactions [44]. As shown in Figure 3, the relative intensity of the ν1 band increases with increasing temperature, which is consistent with the temperature evolution of the X band [44]. At temperatures lower than 140 K, the shape of the ν1 band showed changes. Thus, the ν1 band was decomposed with three bands at approximately 265, 243, and 225 cm−1 by least-squares curve fitting. In a previous paper [41], five peaks at 312, 272, 243, 223, and 199 cm−1 were reported for MAPbI3. In the orthorhombic phase, MA cations are fully ordered [18]. Thus, the observed spectral feature are attributed to this ordering of MA cations.
The assignments of other main bands are as follows: ν2, ~912 cm−1, CH3/NH3+ rocking; ν3, ~964 cm−1, C−N+ stretching; ν8, ~1466 cm−1, NH3+ symmetric deformation; ν9, ~1584 cm−1, NH3+ degenerate deformation.
The FWHMs and peak positions of the ν1, ν2, ν3, ν8, and ν9 bands are shown in Figure 4. Across the orthorhombic-to-tetragonal phase transition at 161 K, the FWHMs of the bands show large changes: the ν2, ν3, ν8, and ν9 bands exhibit abrupt increases, while the ν1 band exhibits an abrupt decrease. The ν2 and ν9 bands shift downward, and the ν1 and ν8 bands shift upward. In the temperature range between 150 and 160 K, weak bands associated with the tetragonal phase are observed, which is probably attributed to a supercooled state with the decreasing temperature. These changes in bandwidth and peak position are consistent with a first-order phase transition.
Across the tetragonal-to-cubic phase transition at 330 K, the FWHM of the ν1 band exhibits an abrupt but small decrease, although the FWHMs of other bands show no abrupt changes or deflections. None of the bands show significant wavenumber shifts. No significant changes of the bandwidths and peak positions of the infrared and Raman bands were found across the tetragonal-to-cubic phase transition of MAPbI3 [35,40]. The observed small change indicates that this transition is close to the second order.
The FWHM of the ν1 band decreases over the whole temperature range, whereas the FWHMs of other bands increase or plateau. This anomaly is attributable to motional narrowing [47], as described in Section 2.1. The MA ion in the PbX3 cage can take several orientations [13,16,17,18]. Motional narrowing was also observed for the ν1 band of MAPbBr3, as described above. However, it is interesting that the FWHM of a torsional vibration at ~480 cm−1 for MAPbCl3 increases with increasing temperature in the range of 77 to 280 K [46].

3. Materials and Methods

Samples of MAPbBr3 and MAPbI3 crystal powders were prepared according to previous papers [14,48]. Compressed micro pellets of the crystalline powders were made. A pellet was placed on a cold head of a liquid-nitrogen-cooled cryostat (Oxford Instruments, Oxon, UK, DN1754) equipped with a temperature controller (Oxford Instruments, ITC5025). The Raman spectra of the pellets were measured in the backscattering configuration on a Raman spectrometer (Renishaw InVia, Gloucestershire, UK) using a macro sampling set with a 60-mm focal length lens (numerical aperture, 0.08). The Raman spectra of the MAPbBr3 pellet were measured with excitation at 633 nm and a power of ~500 μW in the temperature range from 290 to 100 K. The Raman spectra of the MAPbI3 pellet were measured with excitation at 830 nm and a power of ~900 μW in the temperature range from 340 to 110 K. We obtained the peak wavenumber of the FWHM of a band using the Renishaw Wire 3.1 program. An observed band was fitted with a linear combination of the Gaussian and Lorentzian functions and the removal of a baseline by the least-squares curve fitting. The errors of the peak wavenumber and FWHM were ±0.5 and ±1 cm−1, respectively. No error bars were provided for simplicity.

4. Conclusions

The temperature-dependent evolution of the Raman spectra of the organic/inorganic hybrid perovskite MAPbX3 (X = I, Br) was measured. Broad ν1 bands at ~326 cm−1 for MAPbBr3 and at ~240 cm−1 for MAPbI3 were assigned to the MA–PbX3 cage vibrations activated by the thermally induced weakening of the H···X interactions. These bands exhibited anomalous temperature dependence, which was attributable to motional narrowing originating from fast changes between the orientational states of CH3NH3+ in the PbX3 cage. Phase transitions were characterized by changes in the bandwidths and peak positions of the MA–cage vibrations and some bands were associated with the NH3+ group. Across the orthorhombic-to-tetragonal phase transition, abrupt and large increases or decreases in the bandwidth and peak position were observed, which is consistent with a first-order transition. However, across the tetragonal-to-cubic phase transition, small changes were observed.

Supplementary Materials

The following are available online at https://www.mdpi.com/1420-3049/24/3/626/s1: Table S1: Assignments of Raman bands of CH3NH3PbBr3, Table S2: Assignments of Raman bands of CH3NH3PbI3.

Author Contributions

Synthesis, K.Y.; measurements, K.N.; spectral analysis, K.N., Y.F., Y.M., and Y.S.; writing—original draft preparation, Y.F.; writing—review and editing, Y.F., Y.S., and K.Y.; project administration, Y.F.; funding acquisition, Y.F.

Funding

This research was funded by the Waseda University Grant for Special Research Projects (2017K-240).

Conflicts of Interest

The authors declare no conflict of interest.

References

  1. Lee, M.M.; Teuscher, J.; Miyasaka, T.; Murakami, T.N.; Snaith, H.J. Efficient hybrid solar cells based on meso-superstructured organometal halide perovskites. Science 2012, 338, 643–647. [Google Scholar] [CrossRef] [PubMed]
  2. Saliba, M.; Matsui, T.; Seo, J.Y.; Domanski, K.; Correa-Baena, J.P.; Nazeeruddin, M.K.; Zakeeruddin, S.M.; Tress, W.; Abate, A.; Hagfeldt, A.; et al. Cesium-containing triple cation perovskite solar cells: improved stability, reproducibility and high efficiency. Energy Environ. Sci. 2016, 9, 1989–1997. [Google Scholar] [CrossRef] [PubMed] [Green Version]
  3. Snaith, H.J. Present status and future prospects of perovskite photovoltaics. Nat. Mater. 2018, 17, 372–376. [Google Scholar] [CrossRef] [PubMed]
  4. Noh, J.H.; Im, S.H.; Heo, J.H.; Mandal, T.N.; Seok, S.I. Chemical management for colorful, efficient, and stable inorganic‒organic hybrid nanostructured solar cells. Nano Lett. 2013, 13, 1764–1769. [Google Scholar] [CrossRef]
  5. Stoumpos, C.C.; Malliakas, C.D.; Kanatzidis, M.G. Semiconducting tin and lead iodide perovskites with organic cations: phase transitions, high mobilities, and near-infrared photoluminescent properties. Inorg. Chem. 2013, 52, 9019–9038. [Google Scholar] [CrossRef]
  6. Stranks, S.D.; Eperon, G.E.; Grancini, G.; Menelaou, C.; Alocer, M.J.P.; Leijtens, T.; Herz, L.M.; Petrozza, A.; Snaith, H.J. Electron-hole diffusion lengths exceeding 1 micrometer in an organometal trihalide perovskite absorber. Science 2013, 342, 341–344. [Google Scholar] [CrossRef] [PubMed]
  7. Xing, G.; Mathews, N.; Sun, S.; Lim, S.S.; Lam, Y.M.; Grätzel, M.; Mhaisalkar, S.; Sum, T.C. Long-range balanced electron-and hole-transport lengths in organic-inorganic CH3NH3PbI3. Science 2013, 342, 344–347. [Google Scholar] [CrossRef] [PubMed]
  8. Wehrenfennig, C.; Eperon, G.E.; Johnston, M.B.; Snaith, H.I.; Hertz, L.M. High charge carrier mobilities and lifetimes in organolead trihalide perovskites. Adv. Mater. 2014, 26, 1584–1589. [Google Scholar] [CrossRef] [PubMed]
  9. Poglitsch, A.; Weber, D. Dynamic disorder in methylammoniumtrihalogenoplumbates (II) observed by millimeter-wave spectroscopy. J. Chem. Phys. 1987, 87, 6373–6378. [Google Scholar] [CrossRef]
  10. Swainson, I.P.; Hammond, R.P.; Soullière, C.; Knop, O.; Massa, W. Phase transitions in the perovskite methylammonium lead bromide, CH3ND3PbBr3. J. Solid State Chem. 2003, 176, 97–104. [Google Scholar] [CrossRef]
  11. Mashiyama, H.; Kawamura, Y.; Kubota, Y. The anti-polar structure of CH3NH3PbBr3. J. Korean Phys. Soc. 2007, 51, 850–853. [Google Scholar] [CrossRef]
  12. Baikie, T.; Fang, Y.; Kadro, J.M.; Schreyer, M.; Wei, F.; Mhaisalkar, S.G.; Graetzel, M.; White, T.J. Synthesis and crystal chemistry of the hybrid perovskite (CH3NH3)PbI3 for solid-state sensitized solar cell applications. J. Mater. Chem. A 2013, 1, 5628–5641. [Google Scholar] [CrossRef]
  13. Onoda-Yamamuro, N.; Matsuo, T.; Suga, H. Calorimetric and IR spectroscopic studies of phase transitions in methylammonium trihalogenoplumbates (II). J. Phys. Chem. Solids 1990, 51, 1383–1395. [Google Scholar] [CrossRef]
  14. Yamada, K.; Hino, S.; Hirose, S.; Yamane, Y.; Turkevych, I.; Urano, T.; Tomiyasu, H.; Yamagishi, H.; Aramaki, S. Static and dynamic structures of perovskite halides ABX3 (B = Pb, Sn) and their characteristic semiconducting properties by a Hückel analytical calculation. Bull. Chem. Soc. Jpn. 2018, 91, 1196–1204. [Google Scholar] [CrossRef]
  15. Leguy, A.M.A.; Frost, J.M.; McMahon, A.P.; Sakai, V.G.; Kockelmann, W.; Law, C.; Li, X.; Foglia, F.; Walsh, A.; O’Regan, B.C.; et al. The dynamics of methylammonium ions in hybrid organic–inorganic perovskite solar cells. Nat. Commun. 2015, 6, 7124. [Google Scholar] [CrossRef] [PubMed] [Green Version]
  16. Chen, T.; Foley, B.J.; Ipek, B.; Tyagi, M.; Copley, J.R.D.; Brown, C.M.; Choi, J.J.; Lee, S.-H. Rotational dynamics of organic cations in the CH3NH3PbI3 perovskite. Phys. Chem. Chem. Phys. 2015, 17, 31278–31286. [Google Scholar]
  17. Mosconi, E.; Quarti, C.; Ivanovska, T.; Ruani, G.; De Angelis, F. Structural and electronic properties of organo-halide lead perovskites: a combined IE-spectroscopy and ab initio molecular dynamics investigation. Phys. Chem. Chem. Phys. 2014, 16, 16137–16144. [Google Scholar] [CrossRef] [PubMed]
  18. Weller, M.T.; Weber, O.J.; Henry, P.F.; Di Pumpo, A.M.; Hansen, T.C. Complete structure and cation orientation in the perovskite photovoltaic methylammonium lead iodide between 100 and 352 K. Chem. Commun. 2015, 51, 4180–4183. [Google Scholar]
  19. Umebayashi, T.; Asai, K.; Kondo, T.; Nakao, A. Electronic structures of lead iodide based low-dimensional crystals. Phys. Rev. B 2003, 67, 155405. [Google Scholar] [CrossRef]
  20. Mosconi, E.; Amat, A.; Nazeeruddin, M.K.; Grätzel, M.; De Angelis, F. First-principles modeling of mixed halide organometal perovskites for photovoltaic applications. J. Phys. Chem. C 2013, 117, 13902–13913. [Google Scholar] [CrossRef]
  21. Filippetti, A.; Mattoni, A. Hybrid perovskites for photovoltaics: insights from first principles. Phys. Rev. B 2014, 89, 125203. [Google Scholar] [CrossRef]
  22. Grancini, G.; Marras, S.; Prato, M.; Giannini, C.; Quarti, C.; De Angelis, F.; De Bastiani, M.; Eperon, G.E.; Snaith, H.J.; Manna, L.; et al. The impact of the crystallization processes on the structural and optical properties of hybrid perovskite films for photovoltaics. J. Phys. Chem. Lett. 2014, 5, 3836–3842. [Google Scholar] [CrossRef] [PubMed]
  23. Filip, M.R.; Eperon, G.E.; Snaith, H.J.; Giustino, F. Steric engineering of metal-halide perovskites with tunable optical band gaps. Nat. Commun. 2014, 5, 5757. [Google Scholar] [CrossRef] [PubMed] [Green Version]
  24. Even, J.; Pedesseau, L.; Katan, C.; Kepenekian, M.; Lauret, J.-S.; Sapori, D.; Deleporte, E. Solid-state physics perspective on hybrid perovskite semiconductors. J. Phys. Chem. C 2015, 119, 10161–10177. [Google Scholar] [CrossRef]
  25. Park, J.-S.; Choi, S.; Yan, Y.; Yang, Y.; Luther, J.M.; Wei, S.-H.; Parilla, P.; Zhu, K. Electronic structure and optical properties of α-CH3NH3PbBr3 perovskite single crystal. J. Phys. Chem. Lett. 2015, 6, 4304–4308. [Google Scholar] [CrossRef]
  26. Wehrenfennig, C.; Liu, M.; Snaith, H.J.; Johnston, M.B.; Herz, L.M. Homogeneous emission line broadening in the organo lead halide perovskite CH3NH3PbI3−xClx. J. Phys. Chem. Lett. 2014, 5, 1300–1306. [Google Scholar] [CrossRef]
  27. Delugas, P.; Filippetti, A.; Mattoni, A. Methylammonium fragmentation in amines as source of localized trap levels and the heating role of Cl in hybrid lead-iodide perovskites. Phys. Rev. B 2015, 92, 045301. [Google Scholar] [CrossRef]
  28. Liu, J.; Prezhdo, O.V. Chlorine doping reduces electron–hole recombination in lead iodide perovskites: time-domain ab initio analysis. J. Phys. Chem. Lett. 2015, 6, 4463–4469. [Google Scholar] [CrossRef]
  29. Umari, P.; Mosconi, E.; De Angelis, F. Infrared dielectric screening determines the low exciton binding energy of metal-halide perovskites. J. Phys. Chem. Lett. 2018, 9, 620–627. [Google Scholar] [CrossRef]
  30. Kirchartz, T.; Markvart, T.; Rau, U.; Egger, D.A. Impact of small phonon energies on the charge-carrier lifetimes in metal-halide perovskites. J. Phys. Chem. Lett. 2018, 9, 939–946. [Google Scholar] [CrossRef]
  31. Glaser, T.; Müller, C.; Sendner, M.; Krekeler, C.; Semonin, O.E.; Hull, T.D.; Yaffe, O.; Owen, J.S.; Kowalsky, W.; Pucci, A.; et al. Infrared spectroscopic study of vibrational modes in methylammonium lead halide perovskites. J. Phys. Chem. Lett. 2015, 6, 2913–2918. [Google Scholar] [CrossRef] [PubMed]
  32. Bakulin, A.A.; Selig, O.; Bakker, H.J.; Rezus, Y.L.A.; Müller, C.; Glaser, T.; Lovrincic, R.; Sun, Z.; Chen, Z.; Walsh, A.; et al. Real-time observation of organic cation reorientation in methylammonium lead iodide perovskites. J. Phys. Chem. Lett. 2015, 6, 3663–3669. [Google Scholar] [CrossRef] [PubMed]
  33. Pérez-Osorio, M.A.; Milot, R.L.; Filip, M.R.; Patel, J.B.; Herz, L.M.; Johnston, M.B.; Giustino, F. Vibrational properties of the organic–inorganic halide perovskite CH3NH3PbI3 from theory and experiment: factor group analysis, first-principles calculations, and low-temperature infrared spectra. J. Phys. Chem. C 2015, 119, 25703–25718. [Google Scholar] [CrossRef]
  34. Capitani, F.; Marini, C.; Caramazza, S.; Dore, P.; Pisanu, A.; Malavasi, L.; Nataf, L.; Baudelet, F.; Brubach, J.-B.; Roy, P.; et al. Locking of methylammonium by pressure-enhanced H-bonding in (CH3NH3)PbBr3 hybrid perovskite. J. Phys. Chem. C 2017, 121, 28125–28131. [Google Scholar] [CrossRef]
  35. Schuck, G.; Többens, D.M.; Koch-Müller, M.; Efthimiopoulos, I.; Schorr, S. Infrared spectroscopic study of vibrational modes across the orthorhombic–tetragonal phase transition in methylammonium lead halide single crystals. J. Phys. Chem. C 2018, 122, 5227–5237. [Google Scholar] [CrossRef]
  36. Quarti, C.; Grancini, G.; Mosconi, E.; Bruno, P.; Ball, J.M.; Lee, M.M.; Snaith, H.J.; Petrozza, A.; De Angelis, F. The Raman spectrum of the CH3NH3PbI3 hybrid perovskite: interplay of theory and experiment. J. Phys. Chem. Lett. 2014, 5, 279–284. [Google Scholar] [CrossRef] [PubMed]
  37. Ledinský, M.; Löper, P.; Niesen, B.; Holovský, J.; Moon, S.J.; Yum, J.H.; De Wolf, S.; Fejfar, A.; Ballif, C. Raman spectroscopy of organic-inorganic halide perovskites. J. Phys. Chem. Lett. 2015, 6, 401–406. [Google Scholar] [CrossRef]
  38. Brivio, F.; Frost, J.M.; Skelton, J.M.; Jackson, A.J.; Weber, O.J.; Weller, M.T.; Goñi, A.R.; Leguy, A.M.A.; Barnes, P.R.F.; Walsh, A. Lattice dynamics and vibrational spectra of the orthorhombic, tetragonal, and cubic phases of methylammonium lead iodide. Phys. Rev. B 2015, 92, 144308. [Google Scholar] [CrossRef]
  39. Niemann, R.G.; Kontos, A.G.; Palles, D.; Kamitsos, E.I.; Kaltzoglou, A.; Brivio, F.; Falaras, P.; Cameron, P.J. Halogen effects on ordering and bonding of CH3NH3+ in CH3NH3PbX3 (X = Cl, Br, I) hybrid perovskites: Vibrational spectroscopic study. J. Phys. Chem. C 2016, 120, 2509–2519. [Google Scholar] [CrossRef]
  40. Ivanovska, T.; Quarti, C.; Grancini, G.; Petrozza, A.; De Angelis, F.; Milani, A.; Ruani, G. Vibrational response of methylammonium lead iodide: from cation dynamics to phonon–phonon interactions. ChemSusChem 2016, 9, 2994–3004. [Google Scholar] [CrossRef]
  41. Leguy, A.M.A.; Goñi, A.R.; Frost, J.M.; Skelton, J.; Brivio, F.; Rodríguez-Martínez, X.; Weber, O.J.; Pallipurath, A.; Alonso, M.I.; Campoy-Quiles, M.; et al. Dynamic disorder, phonon lifetimes, and the assignments of modes to the vibrational spectra of methylammonium lead halide perovskites. Phys. Chem. Chem. Phys. 2016, 18, 27051–27066. [Google Scholar] [PubMed]
  42. Létoublon, A.; Paofai, S.; Rufflé, B.; Bourges, P.; Hehlen, B.; Michel, T.; Ecolivet, C.; Durand, O.; Cordier, S.; Katan, C.; et al. Elastic constants, optical phonons, and molecular relaxations in the high temperature plastic phase of the CH3NH3PbBr3 hybrid perovskite. J. Phys. Chem. Lett. 2016, 7, 3776–3784. [Google Scholar] [CrossRef] [PubMed]
  43. Pérez-Osorio, M.A.; Lin, Q.; Phillips, R.T.; Milot, R.L.; Herz, L.M.; Johnston, M.B.; Giustino, F. Raman spectrum of the organic–inorganic halide perovskite CH3NH3PbI3 from first principles and high-resolution low-temperature Raman measurements. J. Phys. Chem. C 2018, 122, 21703–21717. [Google Scholar] [CrossRef]
  44. Mattoni, A.; Filippetti, A.; Saba, M.I.; Caddeo, C.; Delugas, P. Temperature evolution of methylammonium trihalide vibrations at the atomic scale. J. Phys. Chem. Lett. 2016, 7, 529–535. [Google Scholar] [CrossRef] [PubMed]
  45. Oxton, I.A.; Knop, O.; Duncan, J.L. The infrared spectrum and force field of the methylammonium ion in (CH3NH3)2PtCl6. J. Mol. Struct. 1977, 38, 25–32. [Google Scholar] [CrossRef]
  46. Maalej, A.; Abid, Y.; Kallel, A.; Daoud, A.; Lautié, A.; Romain, F. Phase transitions and crystal dynamics in the cubic perovskite CH3NH3PbCl3. Solid State Commun. 1997, 103, 279–284. [Google Scholar] [CrossRef]
  47. Kasahara, M.; Kaung, P.; Yagi, T. Anomaly of the Raman linewidth of the internal ν2 mode near the phase transition point of K3D(SO4)2. J. Phys. Soc. Jpn. 1994, 63, 441–444. [Google Scholar] [CrossRef]
  48. Yamada, K.; Kawaguchi, H.; Matsui, T. Structural phase transition and electrical conductivity of the perovskite CH3NH3Sn1−xPbxBr3 and CsSnBr3. Bull. Chem. Soc. Jpn. 1990, 63, 2521–2525. [Google Scholar] [CrossRef]
Sample Availability: Samples of the perovskite crystals are not available from the authors.
Figure 1. Raman spectra of an MAPbBr3 pellet; excitation wavelength: 633 nm.
Molecules 24 00626 g001
Figure 2. Temperature dependence of the (a) widths and (b) peak positions of the Raman bands of MAPbBr3.
Molecules 24 00626 g002
Figure 3. Raman spectra of a MAPbI3 pellet; excitation wavelength: 830 nm.
Molecules 24 00626 g003
Figure 4. Temperature-dependent evolution of the (a) widths and (b) peak positions of the Raman bands of MAPbI3.
Molecules 24 00626 g004
Table 1. Crystal structures [9,10,11] and transition temperatures [13] of CH3NH3PbX3 (X = I, Br).
CH3NH3PbBr3
orthorhombic————tetragonal I————tetragonal II————cubic
Pnma: D2h
Z = 4
148.8 KP4/mmm: D4 h
Z = 1
154.0 KI4/mcm: D4 h
Z = 4
236.3 K P m 3 ¯ m : O h
Z = 1
CH3NH3PbI3
orthorhombic—————————————————tetragonal————cubic
Pnma: D2h
Z = 4
161.4 K I4/mcm: D4 h
Z = 4
330.4 K P m 3 ¯ m : O h
Z = 1

