
‘Seeing’ Strain in Soft Materials

 ,
,
Abstract
:1. Introduction
2. Experimental
2.1. Quasi-Static Tensile Test and Color Analysis
2.2. SP Synthesis
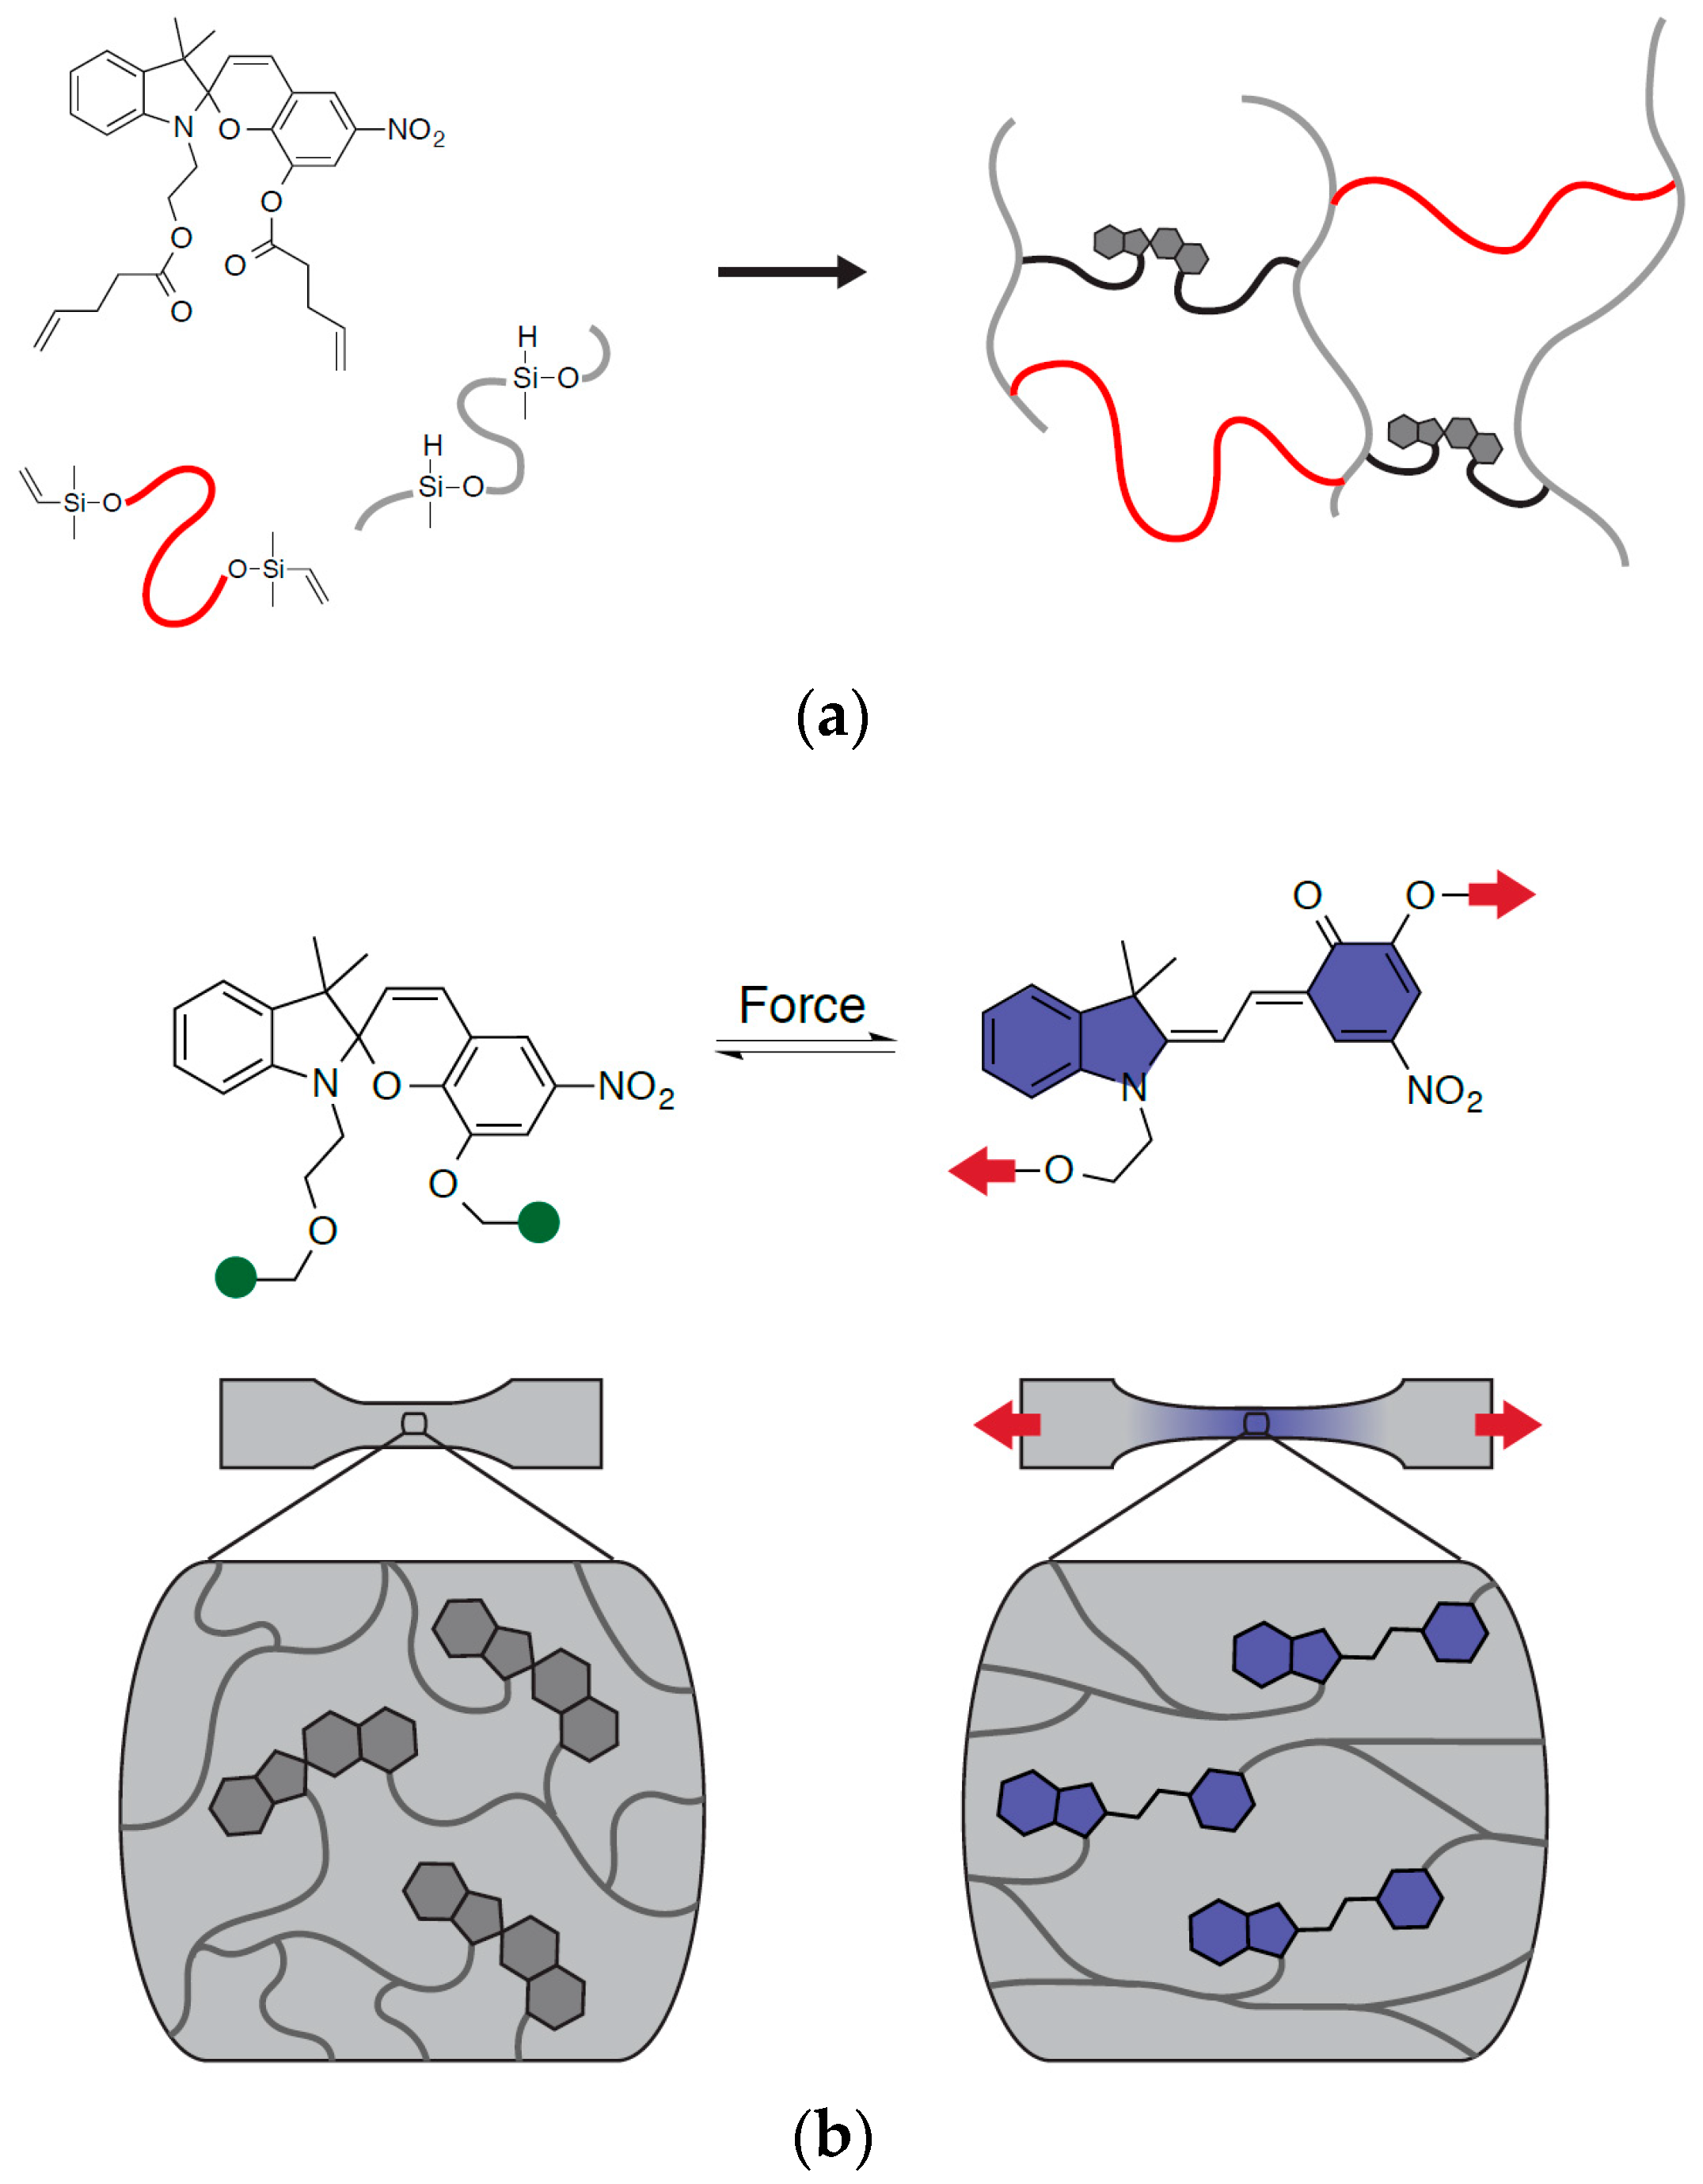
2.3. SP-PDMS Elastomer Block Synthesis
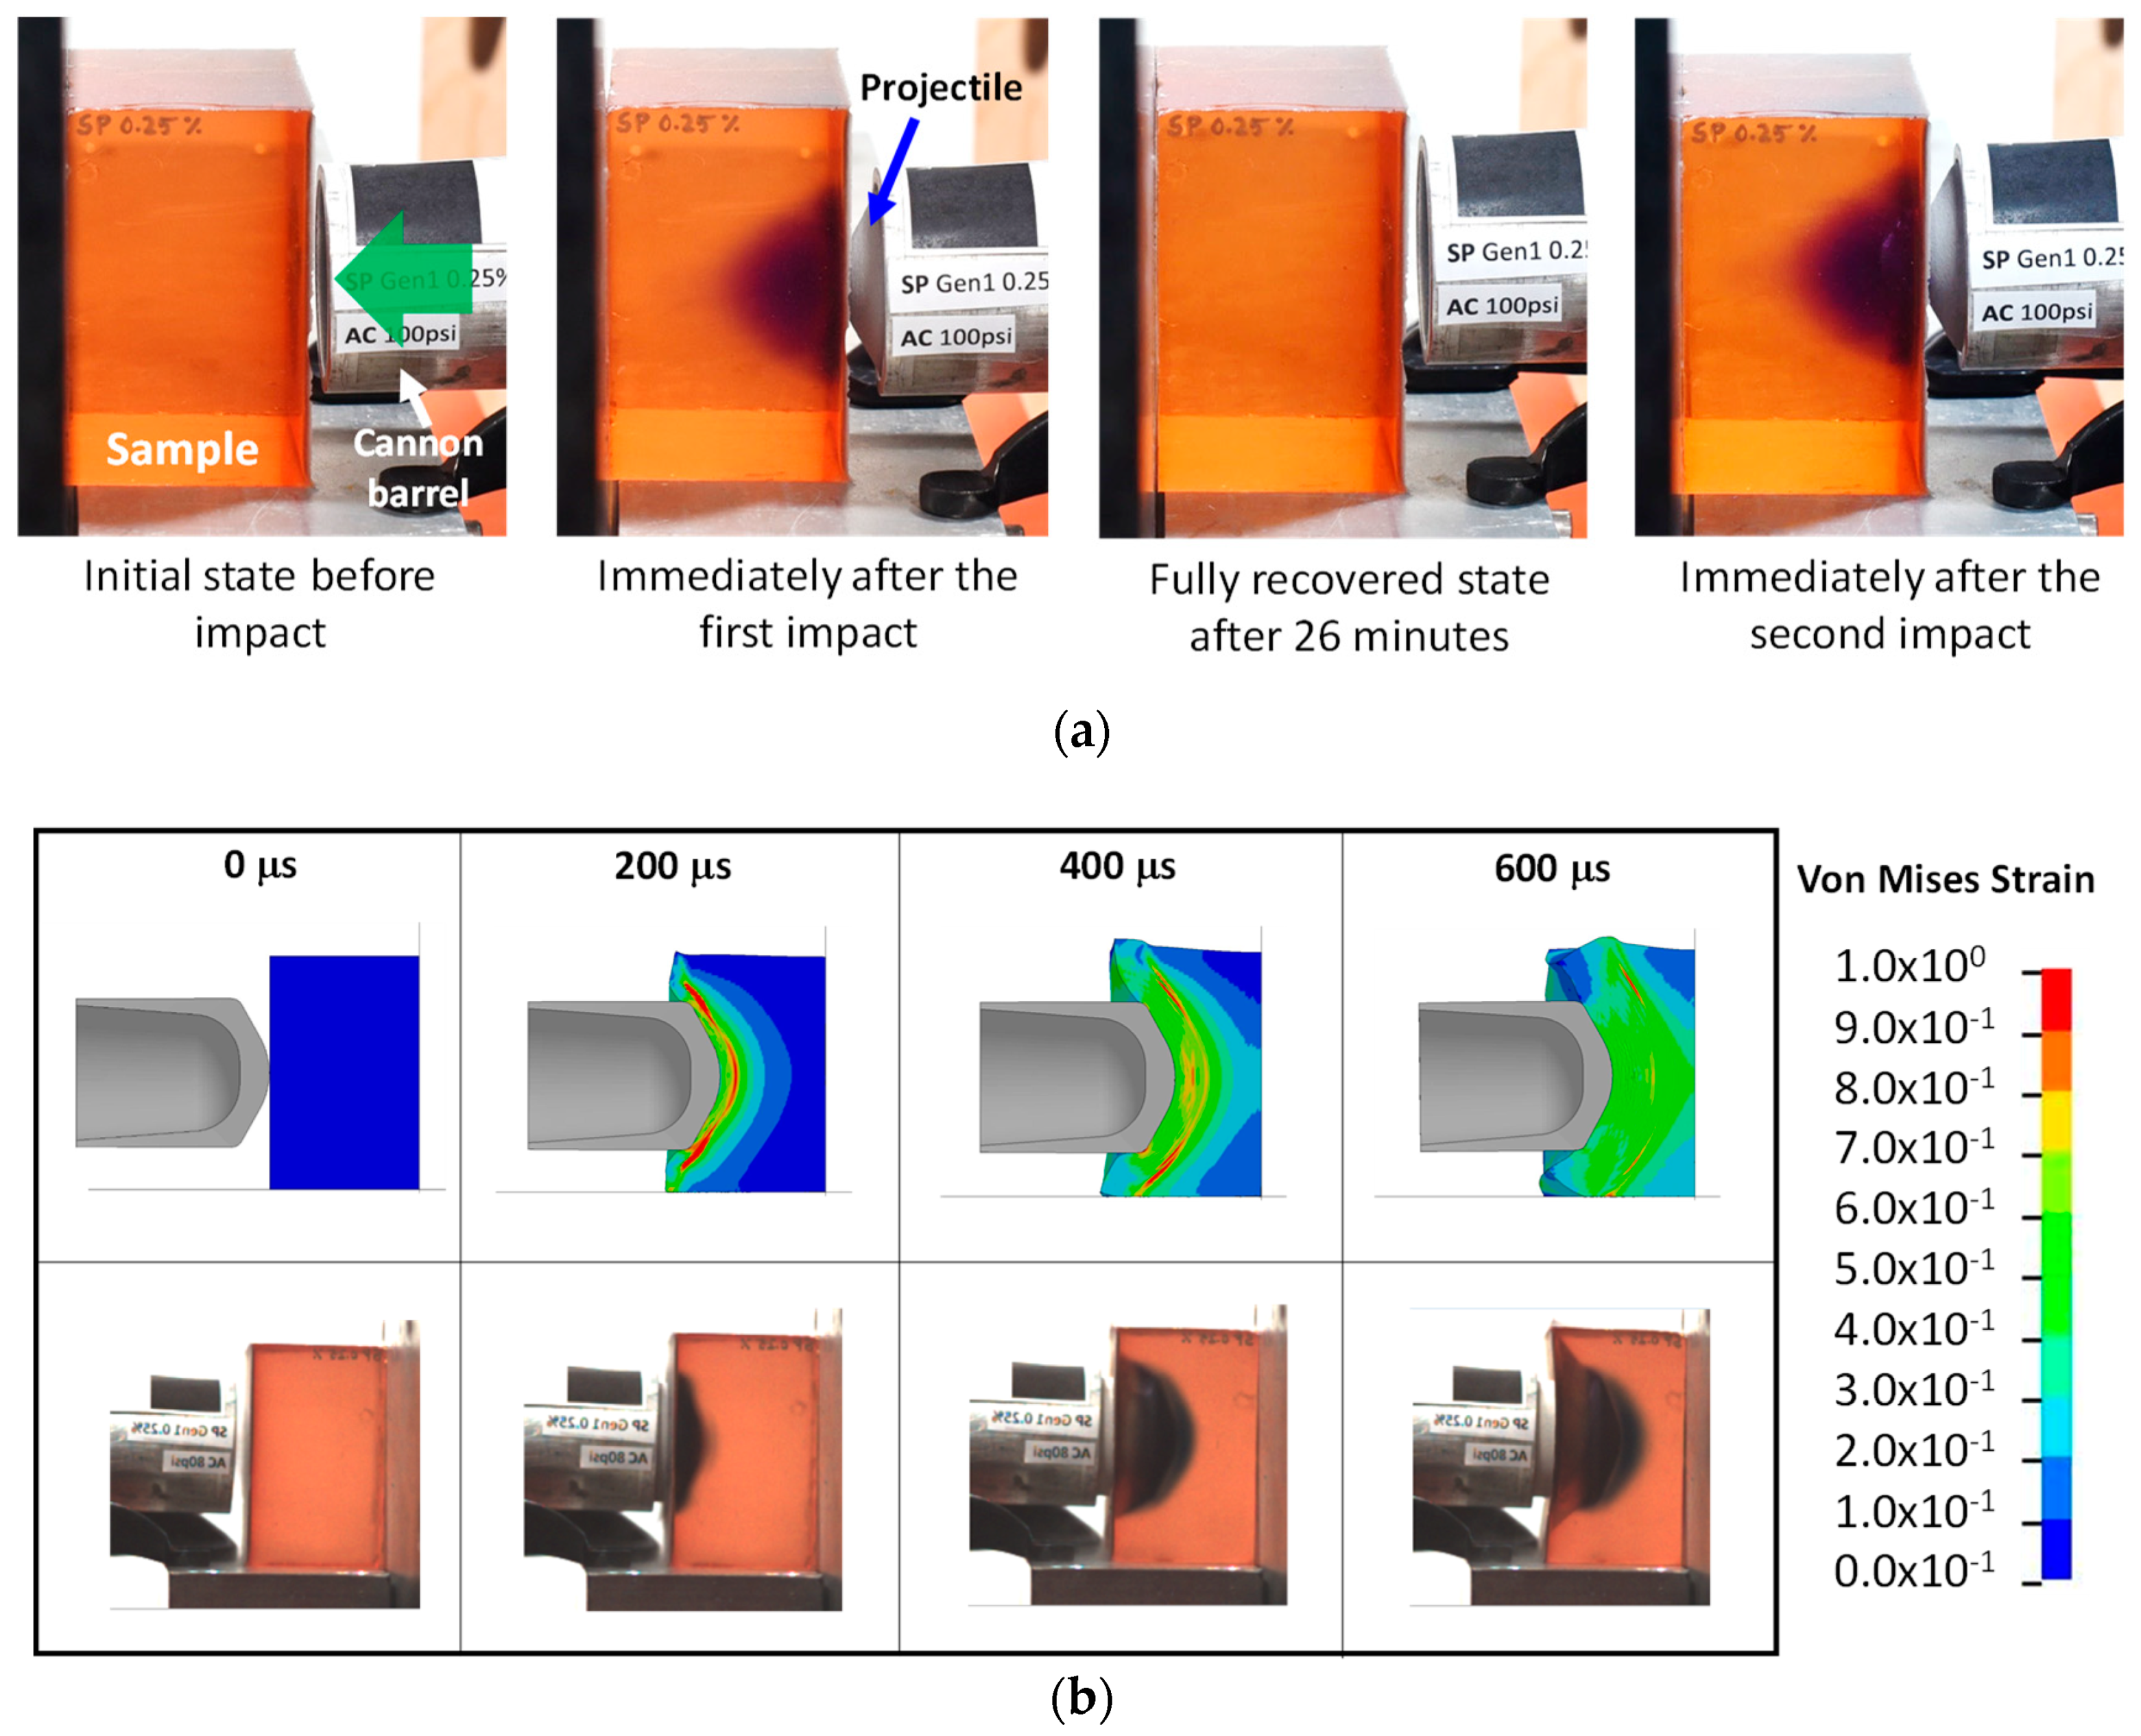
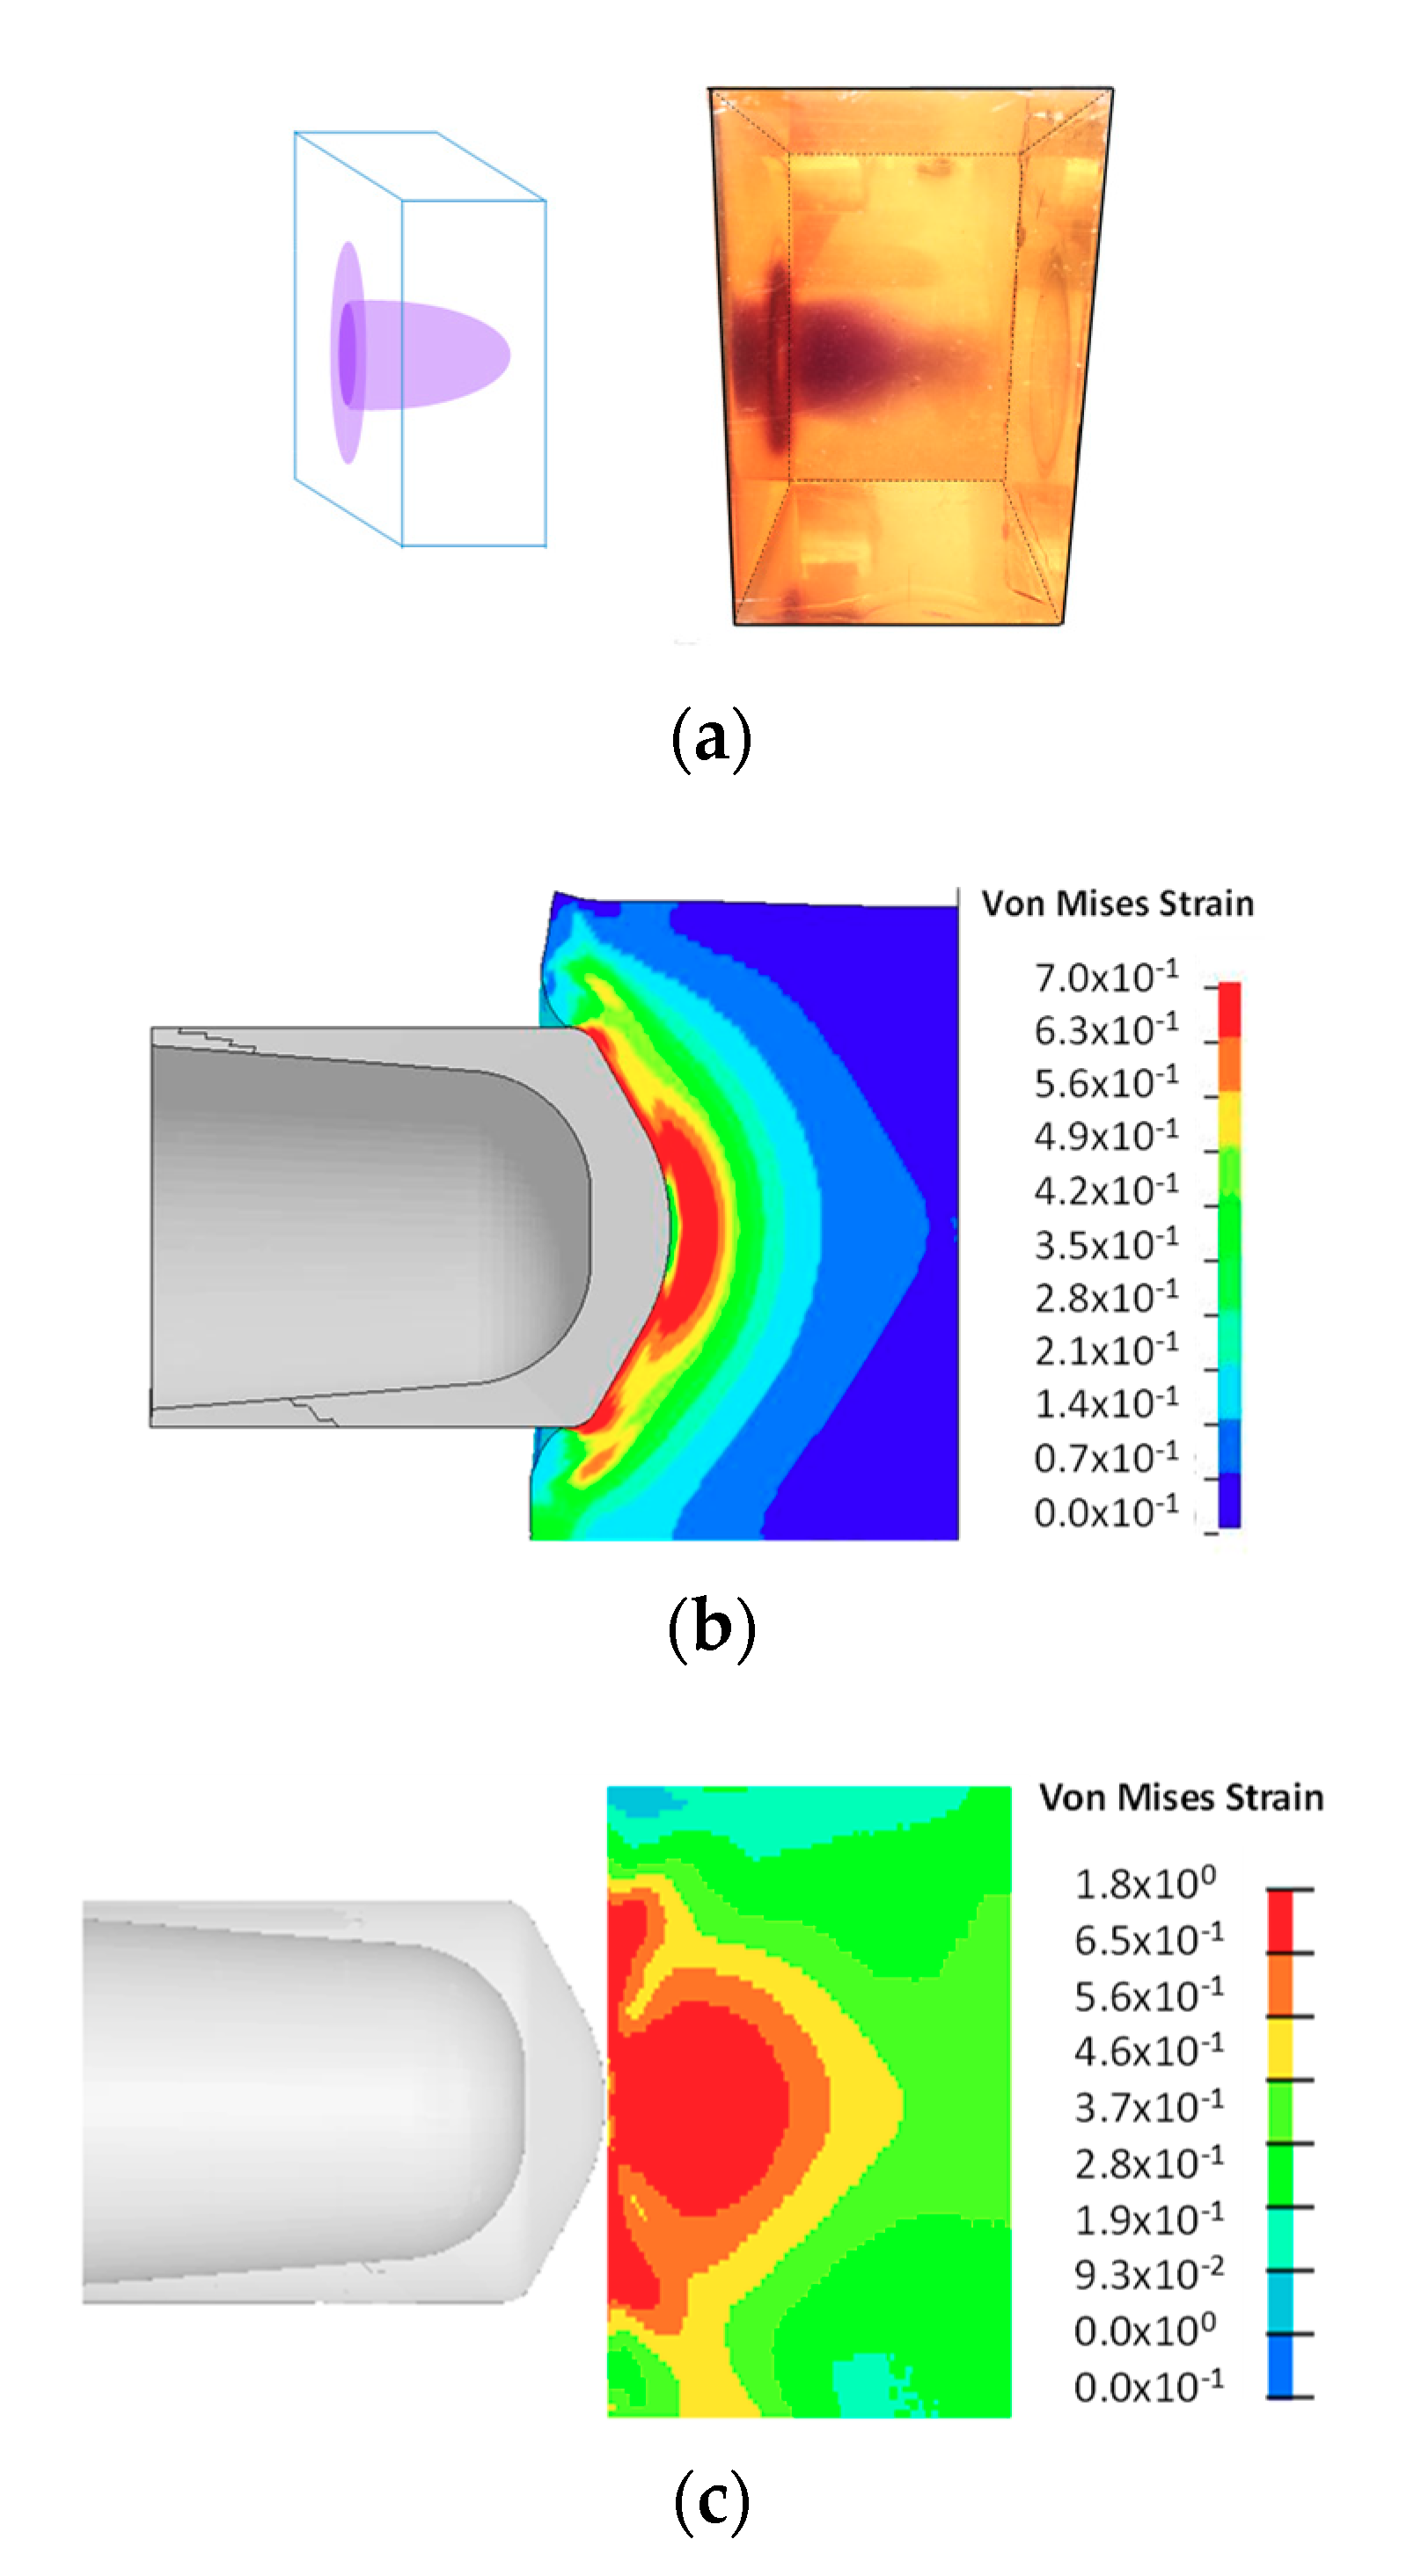
2.4. High Rate Impact Test and Finite Element Analysis
3. Results
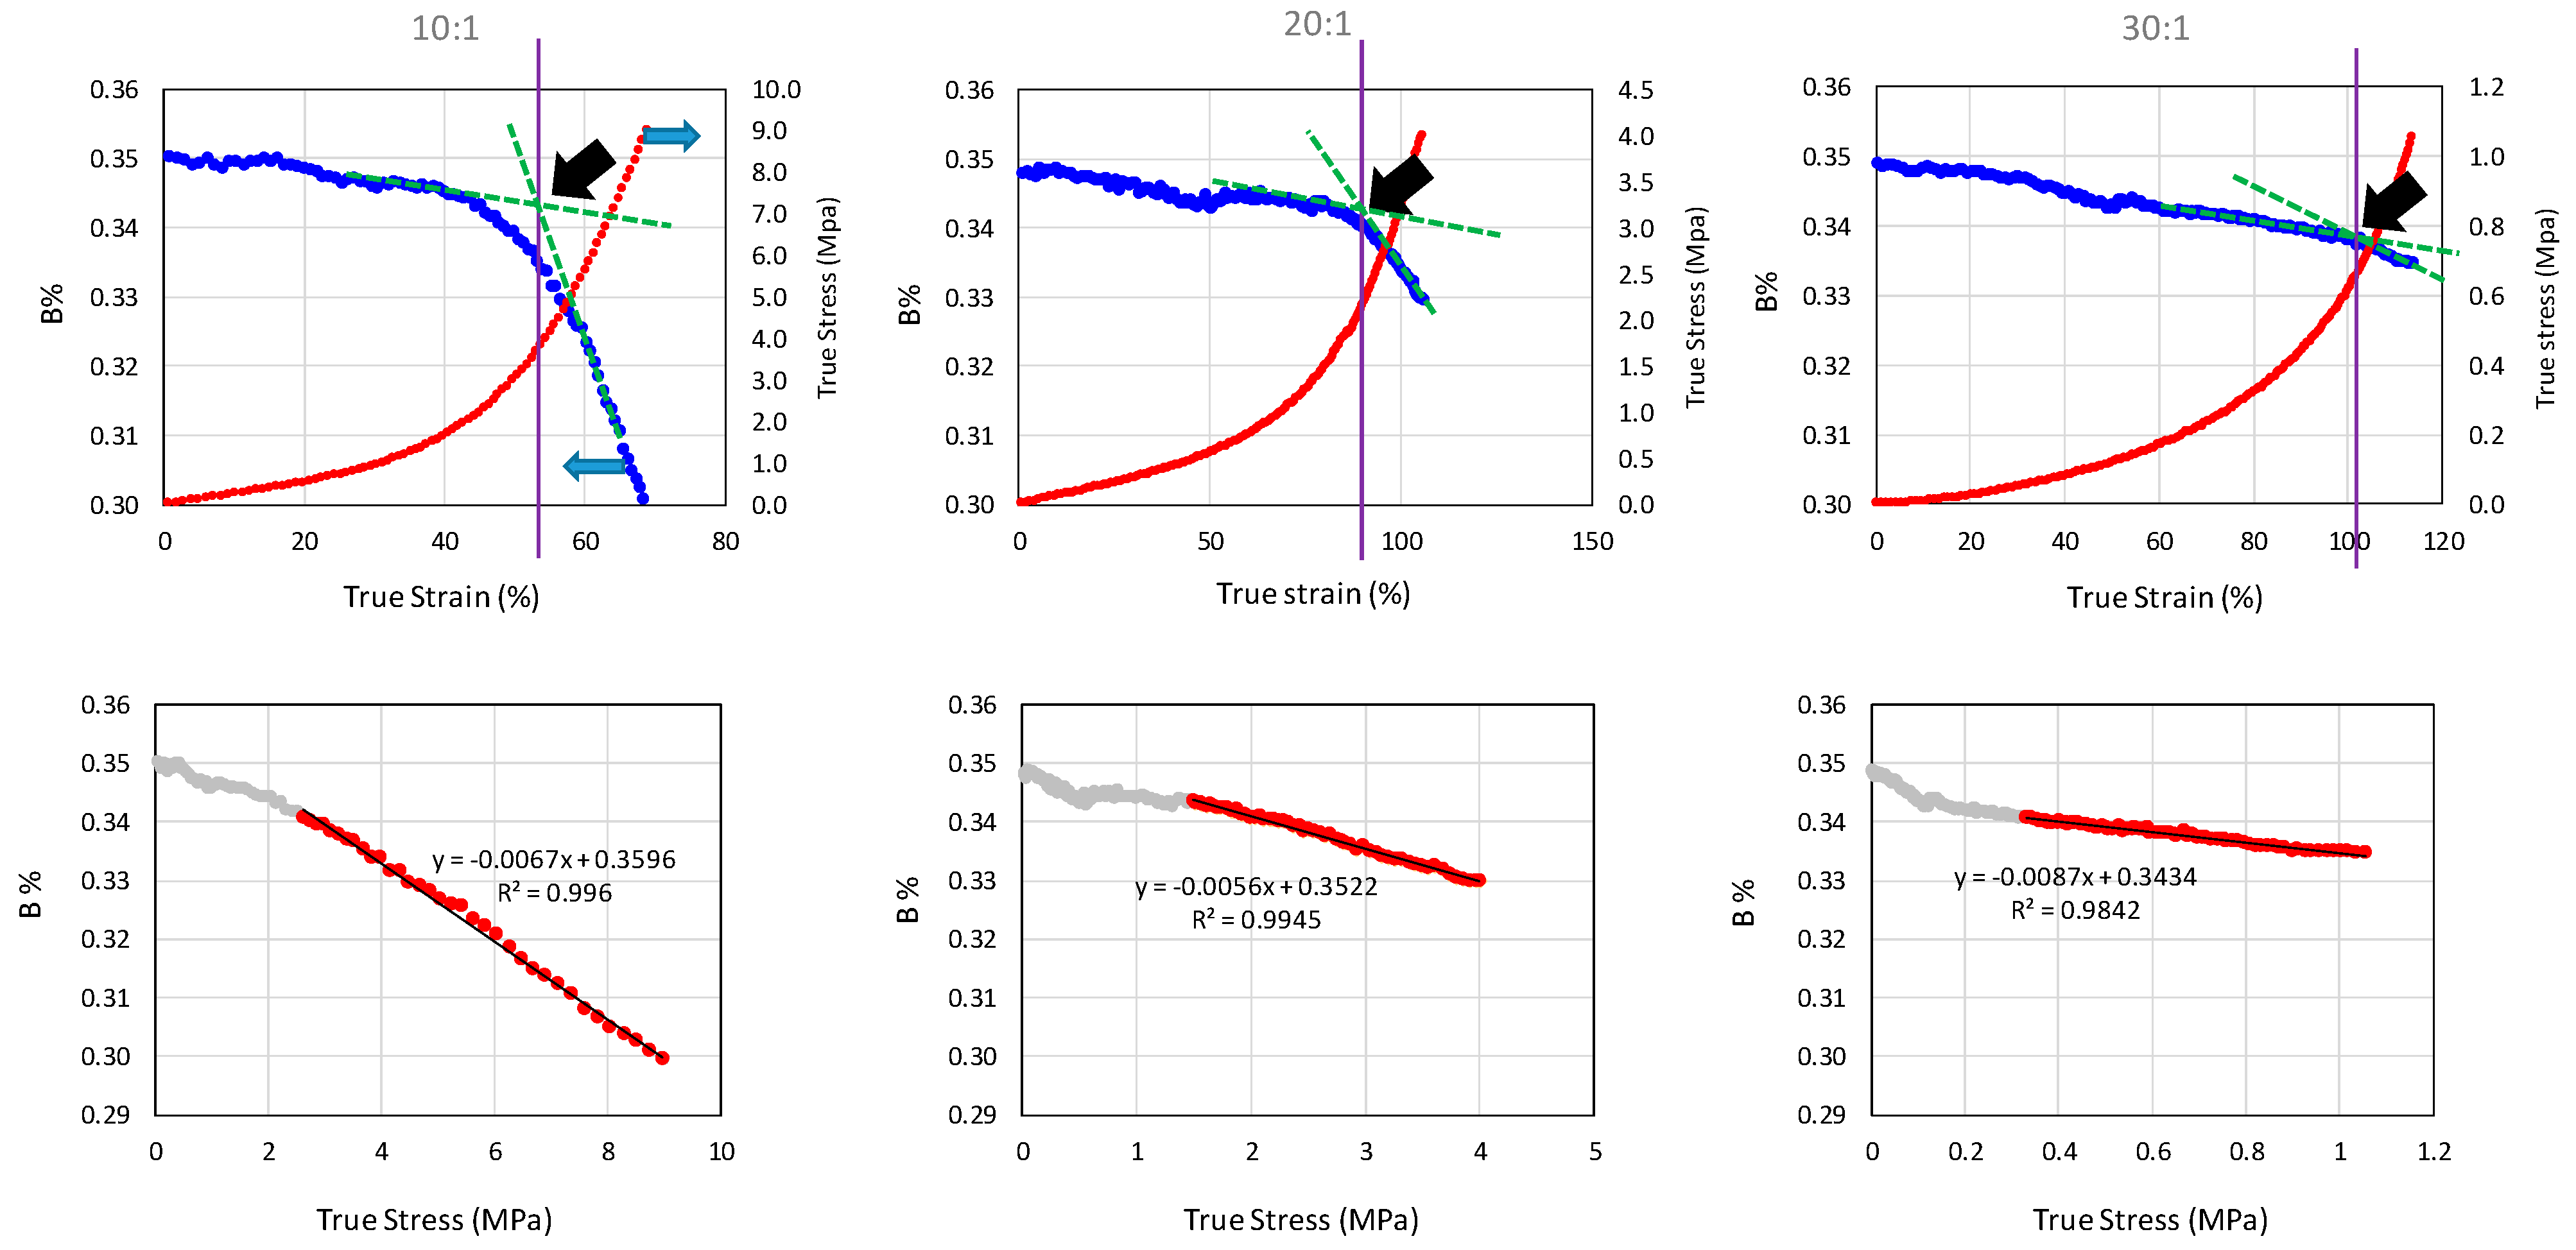
3.1. Quasi-Static Test Results
3.2. High Strain Rate Impact Results
3.3. Application
4. Conclusions
Supplementary Materials
Author Contributions
Funding
Conflicts of Interest
References
- Lane, B.; Sherratt, P.; Hu, X.; Harland, A. Measurement of Strain and Strain Rate during the Impact of Tennis Ball Cores. Appl. Sci. 2018, 8, 371. [Google Scholar] [CrossRef]
- Trexler, M.M.; Lennon, A.M.; Wickwire, A.C.; Harrigan, T.P.; Luong, Q.T.; Graham, J.L.; Maisano, A.J.; Roberts, J.C.; Merkle, A.C. Verification and implementation of a modified split Hopkinson pressure bar technique for characterizing biological tissue and soft biosimulant materials under dynamic shear loading. J. Mech. Behav. Biomed. Mater. 2011, 4, 1920–1928. [Google Scholar] [CrossRef] [PubMed]
- Hardy, W.N.; Mason, M.J.; Foster, C.D.; Shah, C.S.; Kopacz, J.M.; Yang, K.H.; King, A.I. A Study of the Response of the Human Cadaver Head to Impact. Stapp Car Crash J. 2007, 51, 17–80. [Google Scholar] [PubMed]
- Beberniss, T.J.; Ehrhardt, D.A. High-speed 3D digital image correlation vibration measurement: Recent advancements and noted limitations. Mech. Syst. Signal Process. 2017, 86, 35–48. [Google Scholar] [CrossRef]
- Wang, Z.Y.; Li, H.Q.; Tong, J.W.; Ruan, J.T. Statistical analysis of the effect of intensity pattern noise on the displacement measurement precision of digital image correlation using self-correlated images. Exp. Mech. 2007, 47, 701–707. [Google Scholar] [CrossRef]
- Bertelson, R.C. Spiropyrans. In Organic Photochromic and Thermochromic Compounds, 1st ed.; Crano, J.C., Guglielmetti, R.J., Eds.; Springer: New York, NY, USA, 2002. [Google Scholar]
- Lukyanov, B.S.; Lukyanova, M.B. Spiropyrans: Synthesis, Properties and Application. Chem. Heterocycl. Compd. 2005, 41, 281–311. [Google Scholar] [CrossRef]
- Lee, C.K.; Davis, D.A.; White, S.R.; Moore, J.S.; Sottos, N.R.; Braun, P.V. Force-Induced Redistribution of a Chemical Equilibrium. J. Am. Chem. Soc. 2010, 132, 16107–16111. [Google Scholar] [CrossRef] [PubMed]
- Davis, D.A.; Hamilton, A.; Yang, J.L.; Cremar, L.D.; Van Gough, D.; Potisek, S.L.; Ong, M.T.; Braun, P.V.; Martinez, T.J.; White, S.R.; et al. Force-induced activation of covalent bonds in mechanoresponsive polymeric materials. Nature 2009, 459, 68–72. [Google Scholar] [CrossRef] [PubMed]
- Raisch, M.; Genovese, D.; Zaccheroni, N.; Schmidt, S.B.; Focarete, M.L.; Sommer, M.; Gualandi, C. Highly Sensitive, Anisotropic and Reversible Stress/Strain-Sensors from Mechanochromic Nanofiber Composites. Adv. Mater. 2018, 30. [Google Scholar] [CrossRef] [PubMed]
- Wang, Q.; Gossweiler, G.R.; Craig, S.L.; Zhao, X. Mechanics of Mechanochemically Responsive Elastomers. J. Mech. Phys. Solids 2015, 82, 320–344. [Google Scholar] [CrossRef]
- Silberstein, M.N.; Manivannan, M.S. Materials design principles for mechanochemical transduction. In Mechanochemistry in Materials, 1st ed.; Simon, Y.C., Craig, S.L., Eds.; Royal Society of Chemistry: London, UK, 2017; pp. 76–118. [Google Scholar]
- Chanda, A.; Callawa, C.; Clifton, C.; Unnikrishnan, V. Biofidelic human brain tissue surrogates. Mech. Adv. Mater. Struct. 2018, 25, 1335–1341. [Google Scholar] [CrossRef]
- Gossweiler, G.R.; Kouznetsova, T.B.; Craig, S.L. Force-Rate Characterization of Two Spiropyran-Based Molecular Force Probes. J. Am. Chem. Soc. 2015, 137, 6148–6151. [Google Scholar] [CrossRef] [PubMed]
- Gossweiler, G.R.; Hewage, G.B.; Soriano, G.; Wang, Q.; Welshofer, G.W.; Zhao, X.; Craig, S.L. Mechanochemical Activation of Covalent Bonds in Polymers with Full and Repeatable Macroscopic Shape Recovery. ACS Macro. Lett. 2014, 3, 216–219. [Google Scholar] [CrossRef]
- Centers for Disease Control and Prevention. Available online: https://www.cdc.gov/traumaticbraininjury/basics.html (accessed on 21 November 2017).
- Voo, L.; Swetz, S.; Luong, Q.; Warfield, J.; Alvarez, B.; Brinkley, K.; O’Donnell, J.; Bevan, M.; Merkle, A. Improved Repeatability and Reproducibility of the Ballistic Load Sensing Headform. In Proceedings of the 13th Personal Armour Systems Symposium (PASS), Amsterdam, The Netherlands, 19–23 September 2016. [Google Scholar]
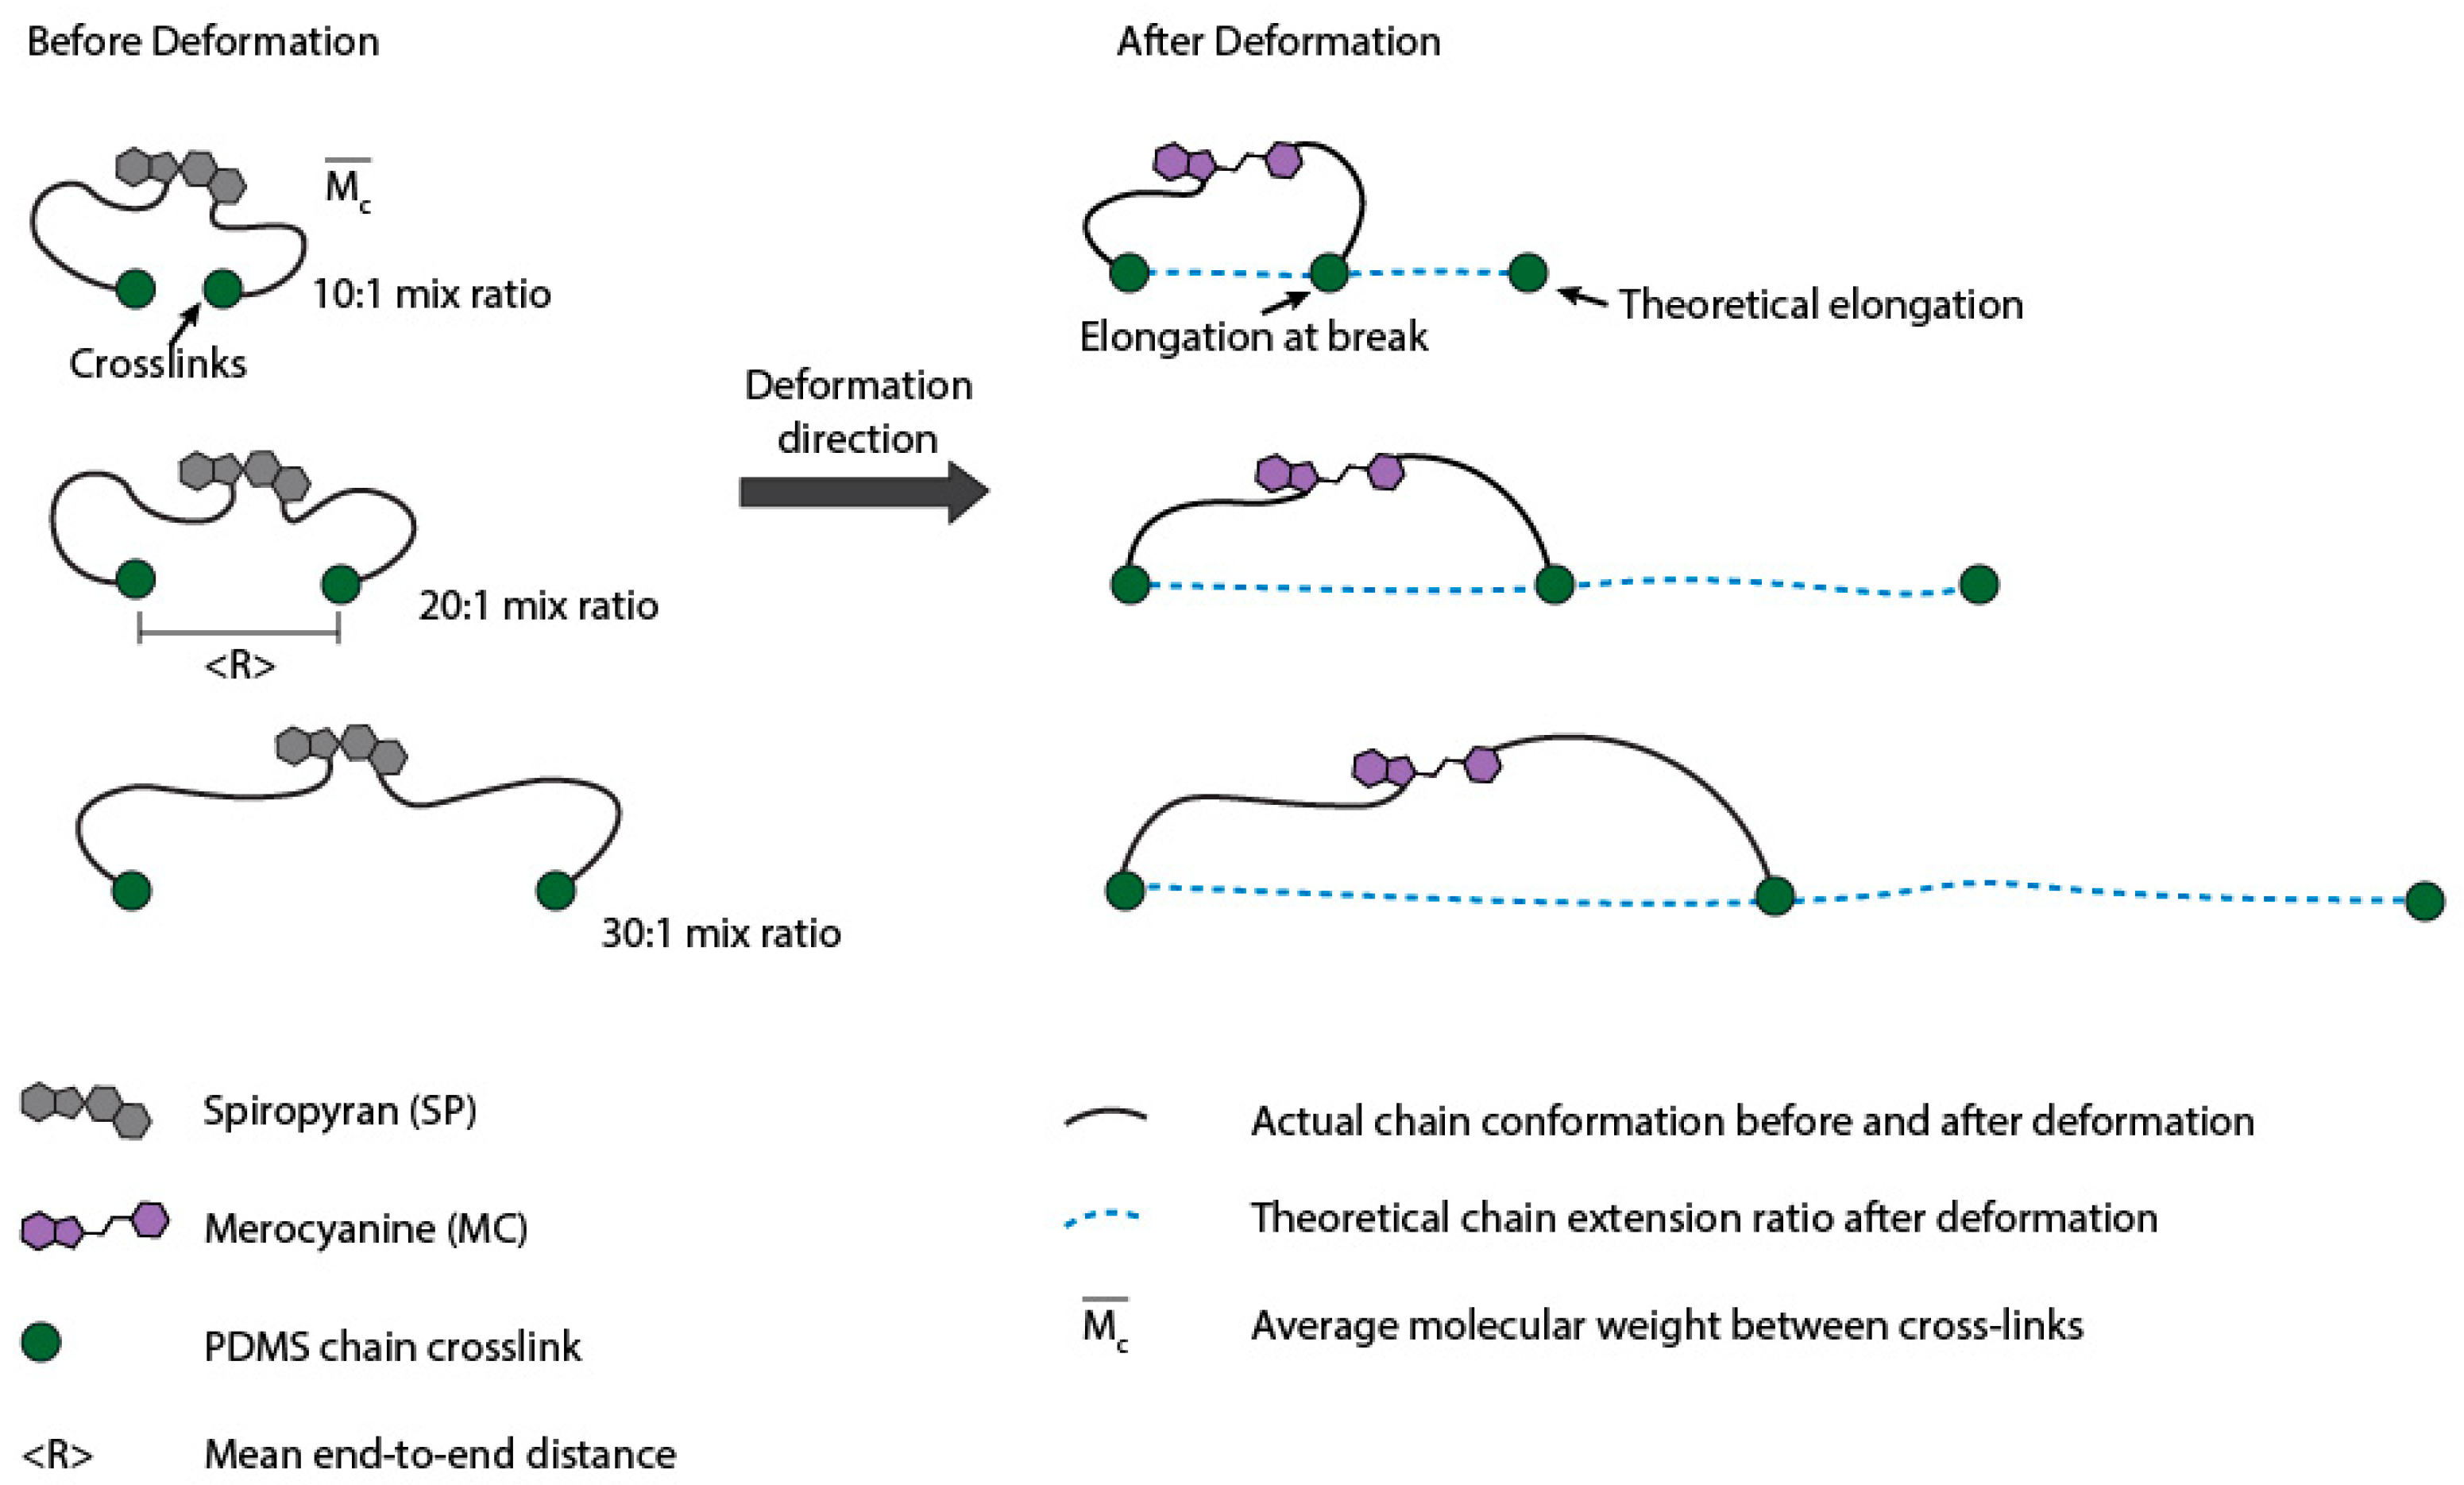
- Xia, Z.; Patchan, M.; Maranchi, J.; Elisseeff, J.; Trexler, M. Determination of Crosslinking Density of Hydrogels Prepared from Microcrystalline Cellulose. J. Appl. Polym. Sci. 2012, 127, 4537–4541. [Google Scholar] [CrossRef]
- Treloar, L.R.G. The Physics of Rubber Elasticity, 3rd ed.; Oxford University Press: New York, NY, USA, 2005; p. 213. [Google Scholar]
- Flory, P.J. Statistical Mechanics of Chain Molecules; Hanser Gardner Publications: Cincinnati, OH, USA, 1989; pp. 16–19. [Google Scholar]
- Bauer, W.H. Silicon-oxygen bond length, bridging angles Si-O-Si and synthetic low tridymite. Acta Crsyt. 1977, 33, 2615–2619. [Google Scholar] [CrossRef]
- Liu, B.C.; Ivers, R.; Norton, R.; Boufous, S.; Blows, S.; Lo, S.K. Helmets for preventing injury in motorcycle riders. Cochrane Database Syst Rev. 2008, 23. [Google Scholar] [CrossRef] [PubMed]
- Olsen, C.S.; Thomas, A.M.; Singleton, M.; Gaichas, A.M.; Smith, T.J.; Smith, G.A.; Peng, J.; Bauer, M.J.; Qu, M.; Yeager, D.; et al. Motorcycle helmet effectiveness in reducing head, face and brain injuries by state and helmet law. Inj. Epidemiol. 2016, 8, 2. [Google Scholar] [CrossRef] [PubMed]
- Prange, M.T.; Margulies, S.S. Regional, Directional and Age-Dependent Properties of the Brain Undergoing Large Deformation. J. Biomech. Eng. 2002, 124, 244–252. [Google Scholar] [CrossRef] [PubMed]
- Lin, S.-C.; Shieh, S.-J.; Grimm, M.J. Ultrasonic measurements of Brain Tissue Properties. In Proceedings of the Center for Disease Control Conference, Atlanta, GA, USA, March 1997; pp. 27–31. [Google Scholar]
- Klukovich, H.M.; Kouznetsova, T.B.; Kean, Z.S.; Lenhardt, J.M.; Craig, S.L. A Backbone Lever Arm Effect Enhances Polymer Mechanochemistry. Nat. Chem. 2013, 5, 110–114. [Google Scholar] [CrossRef] [PubMed]
- Wang, J.; Kouznetsova, T.B.; Kean, Z.S.; Fan, L.; Mar, B.D.; Martínez, T.J.; Craig, S.L. A Remote Stereochemical Lever Arm Effect in Polymer Mechanochemistry. J. Am. Chem. Soc. 2014, 136, 15162–15165. [Google Scholar] [CrossRef] [PubMed]
Sample Availability: Samples of spiropyran are available from the authors. |


| Sylgard® 184 Mixing Ratio | C1 (kPa) | C2 (kPa) | N (mol/m3) | Onset True Strain for Blue Color (B%) Change | Root Mean End-to-End Distance (<r>) (Å) | |
|---|---|---|---|---|---|---|
| 10:1 | 611 | 189 | 1.6 | 646 | 53% | 9.7 |
| 20:1 | 168 | 123 | 4.4 | 235 | 92% | 16.1 |
| 30:1 | 99 | 30 | 19.5 | 104 | 102% | 33.9 |
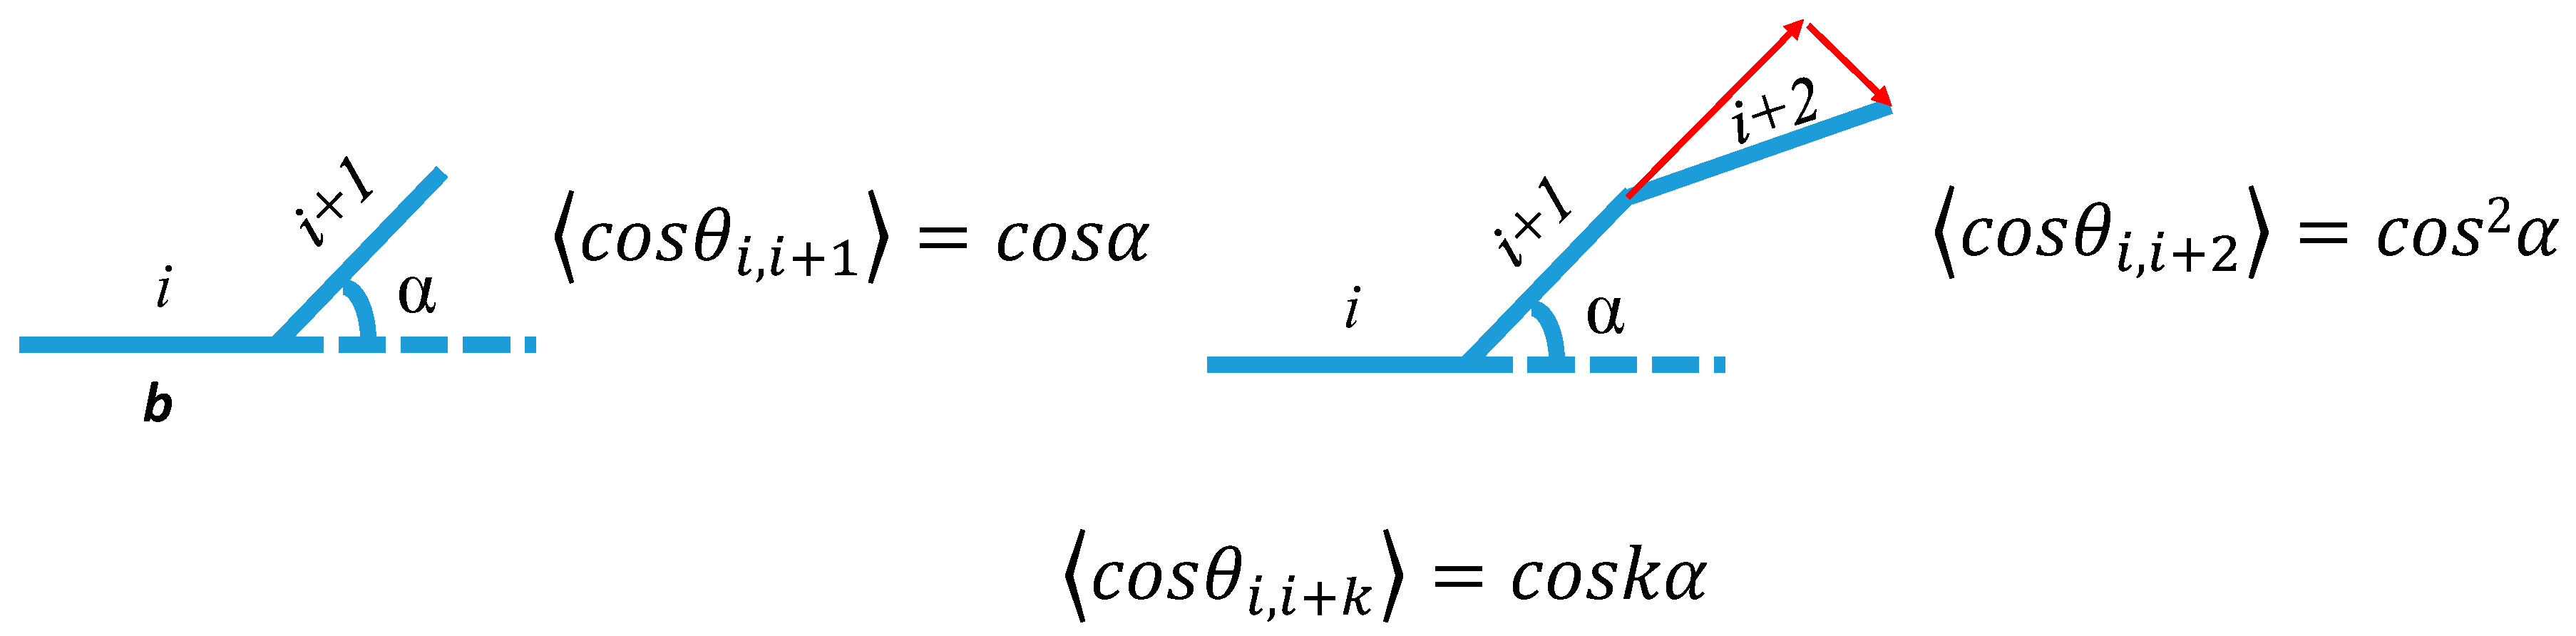
| Slygard® 184 Mix Ratio | Chain Contour Length between Crosslinks (τ) (Å) | Maximum Theoretical Extension Ratio (λt = τ/<R>) | Measured Extension Ratio (λm) | Observed Elongation for the Onset of Blue Color Change (λo) | Percent Reached to Theoretical Extension Ratio (λm/λt) | Force Required to Perturb the Chain Dimensions (f) (picoNewton-pN) |
|---|---|---|---|---|---|---|
| 10:1 | 35.1 | 3.6 | 2.0 | 1.6 | 56% | 20.9 |
| 20:1 | 96.4 | 6.0 | 2.9 | 2.4 | 49% | 12.6 |
| 30:1 | 429.4 | 12.7 | 3.1 | 2.7 | 25% | 6.0 |
© 2019 by the authors. Licensee MDPI, Basel, Switzerland. This article is an open access article distributed under the terms and conditions of the Creative Commons Attribution (CC BY) license (http://creativecommons.org/licenses/by/4.0/).
Share and Cite
Xia, Z.; Alphonse, V.D.; Trigg, D.B.; Harrigan, T.P.; Paulson, J.M.; Luong, Q.T.; Lloyd, E.P.; Barbee, M.H.; Craig, S.L. ‘Seeing’ Strain in Soft Materials. Molecules 2019, 24, 542. https://doi.org/10.3390/molecules24030542
Xia Z, Alphonse VD, Trigg DB, Harrigan TP, Paulson JM, Luong QT, Lloyd EP, Barbee MH, Craig SL. ‘Seeing’ Strain in Soft Materials. Molecules. 2019; 24(3):542. https://doi.org/10.3390/molecules24030542
Chicago/Turabian StyleXia, Zhiyong, Vanessa D. Alphonse, Doug B. Trigg, Tim P. Harrigan, Jeff M. Paulson, Quang T. Luong, Evan P. Lloyd, Meredith H. Barbee, and Stephen L. Craig. 2019. "‘Seeing’ Strain in Soft Materials" Molecules 24, no. 3: 542. https://doi.org/10.3390/molecules24030542
APA StyleXia, Z., Alphonse, V. D., Trigg, D. B., Harrigan, T. P., Paulson, J. M., Luong, Q. T., Lloyd, E. P., Barbee, M. H., & Craig, S. L. (2019). ‘Seeing’ Strain in Soft Materials. Molecules, 24(3), 542. https://doi.org/10.3390/molecules24030542