
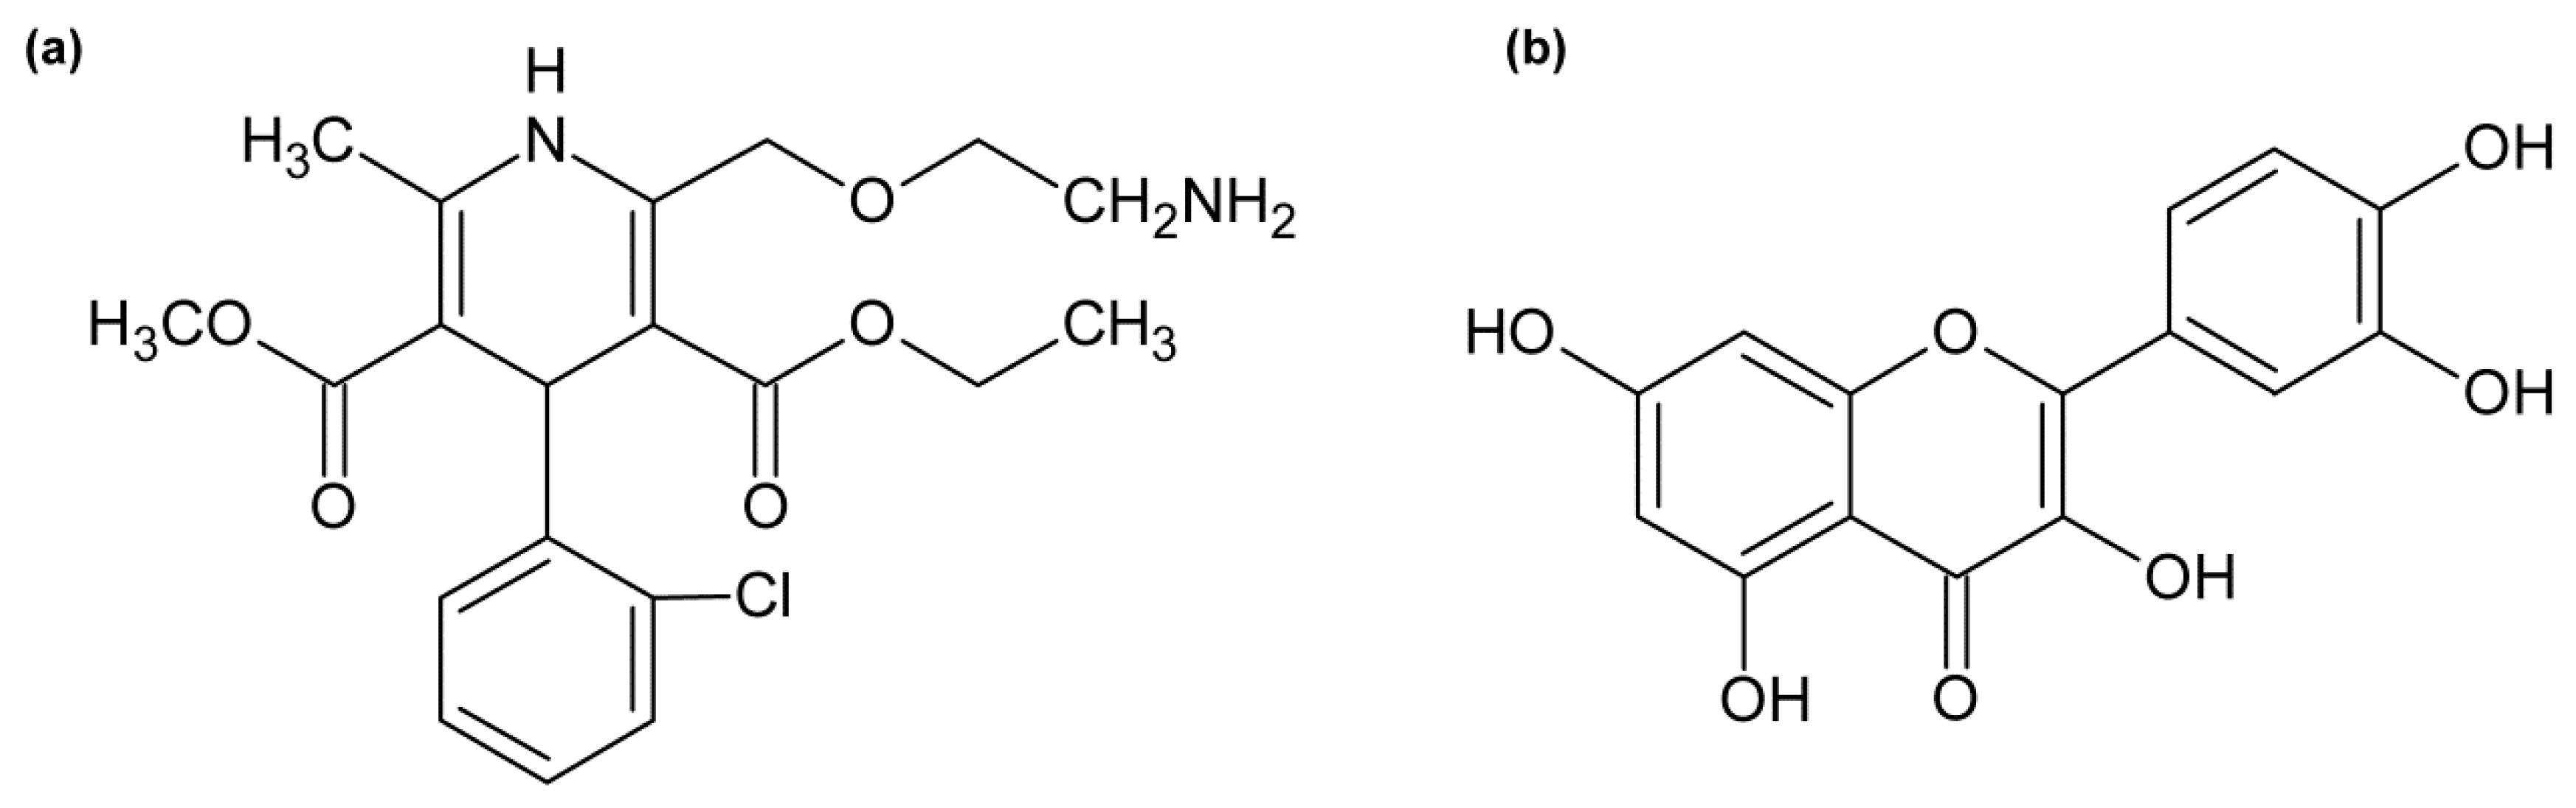
Study of Interactions between Amlodipine and Quercetin on Human Serum Albumin: Spectroscopic and Modeling Approaches

 ,
,  ,
,  ,
,
Abstract
1. Introduction
2. Results
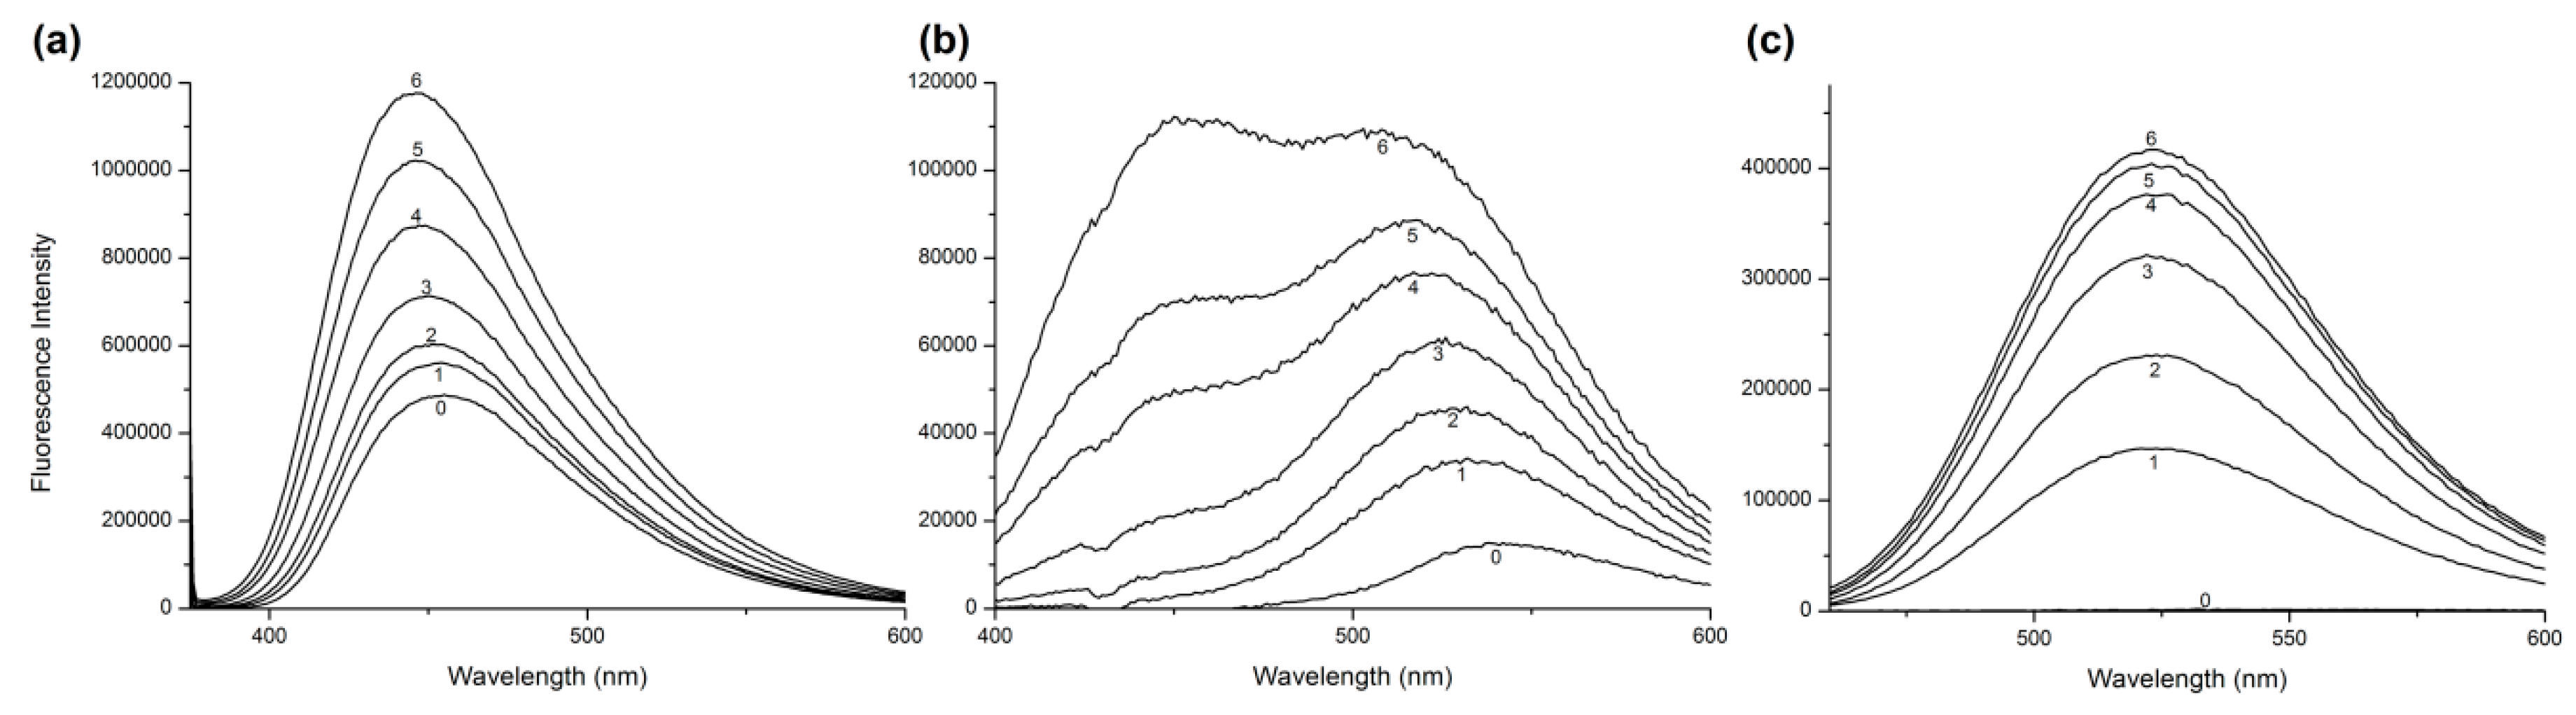
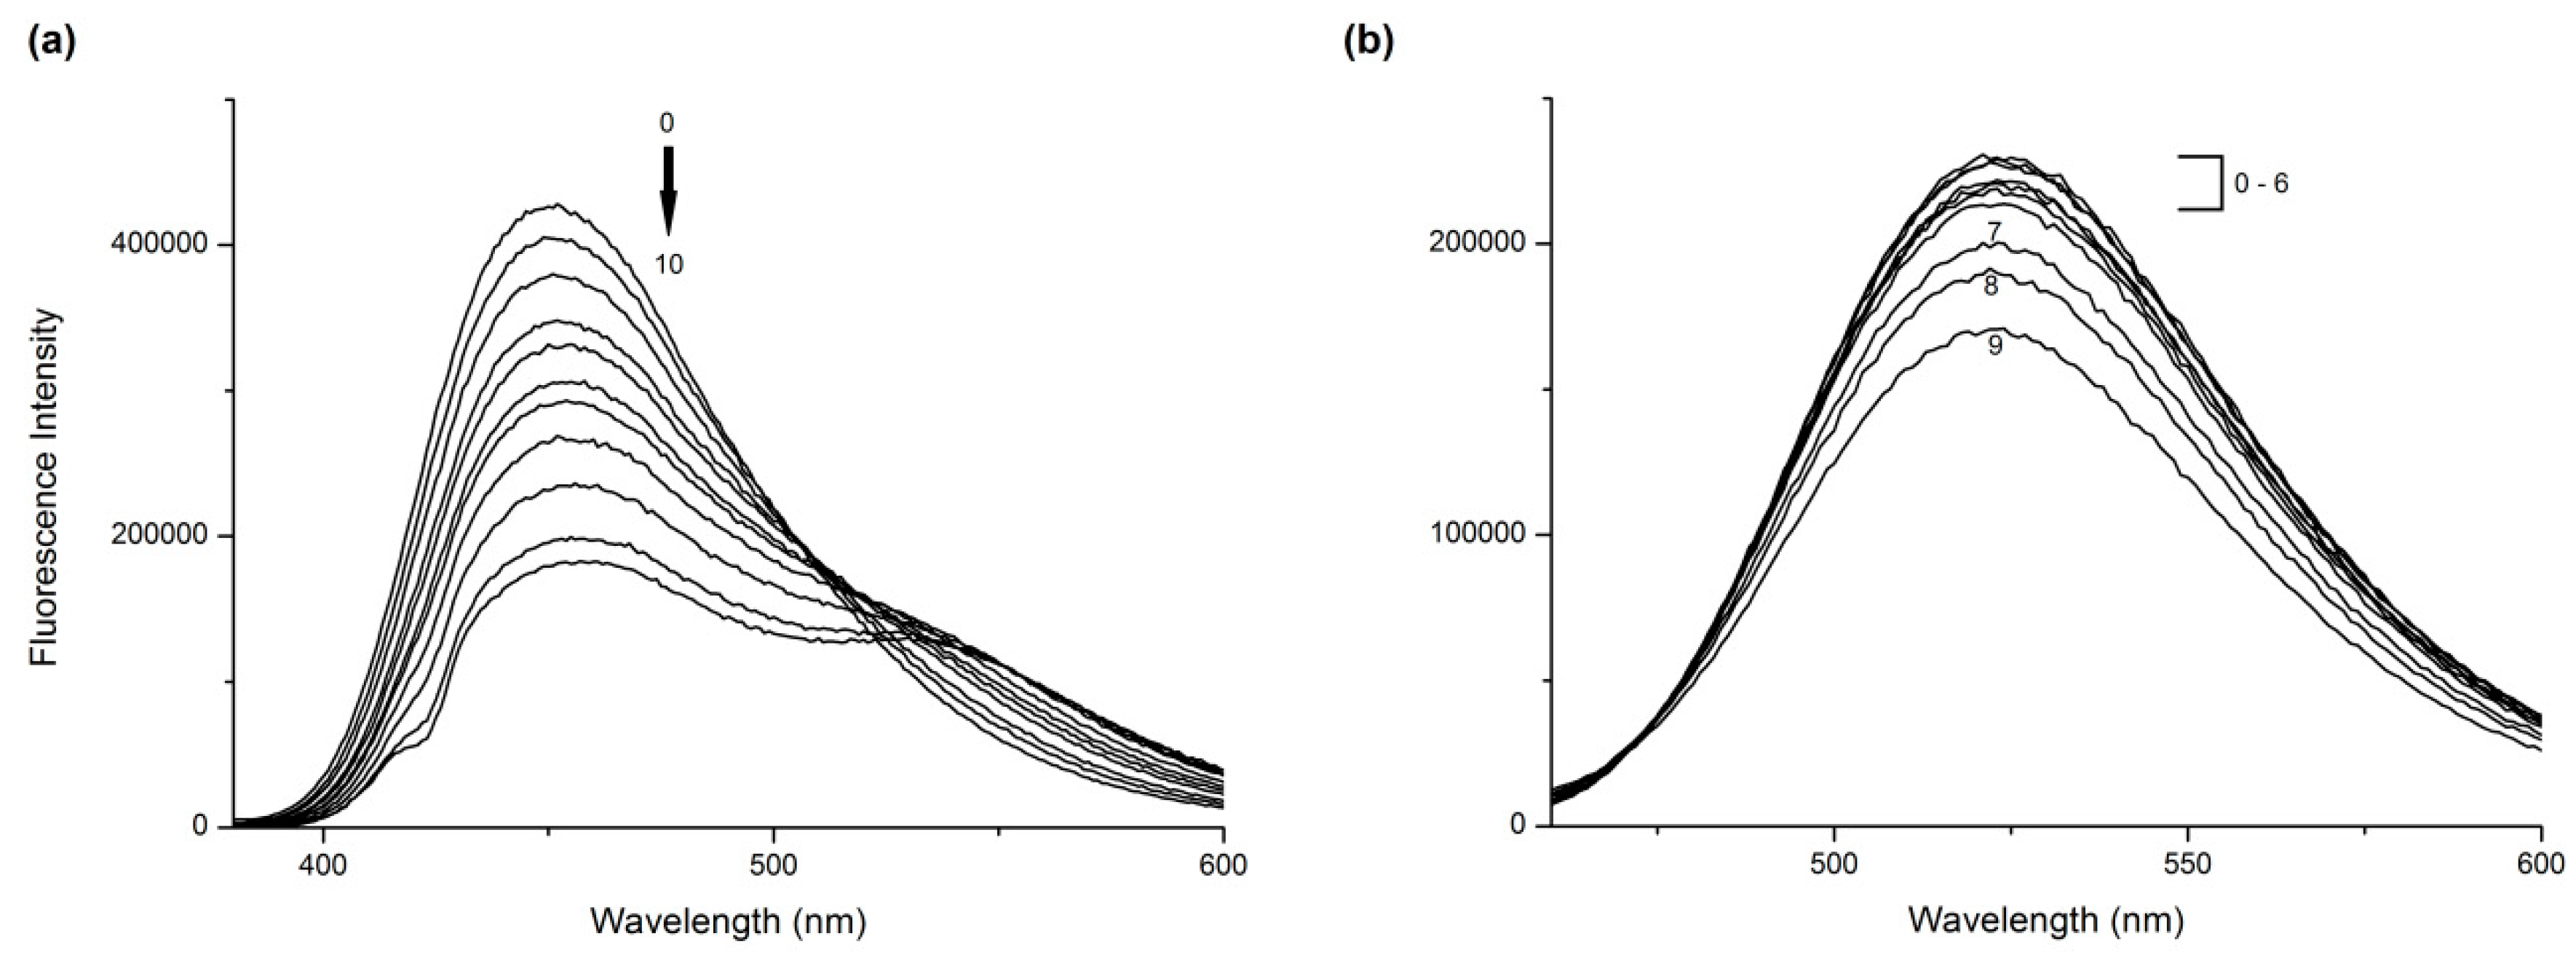
2.1. Fluorescence Quenching and Enhancement
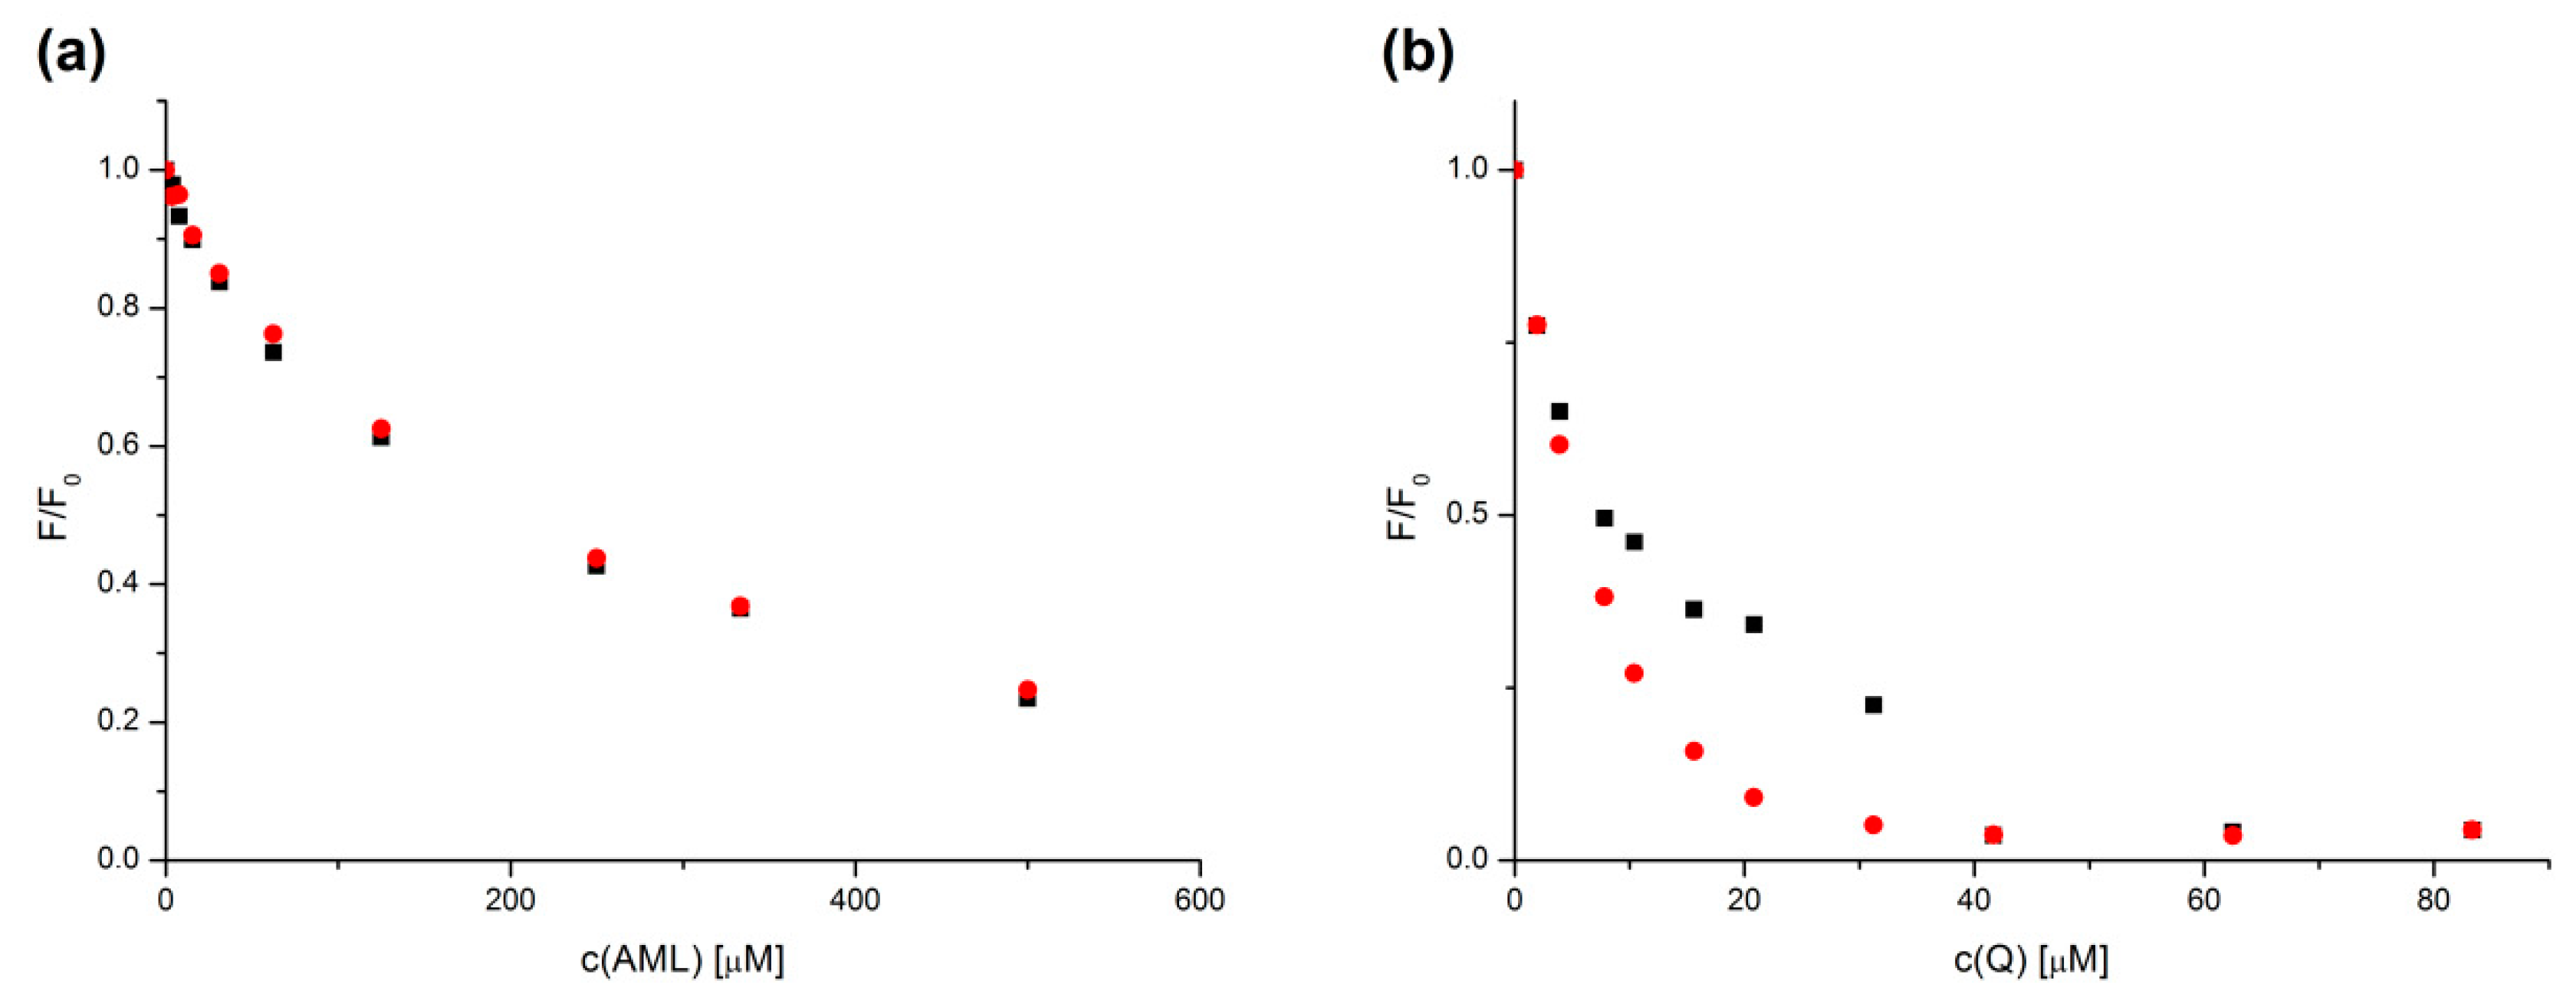
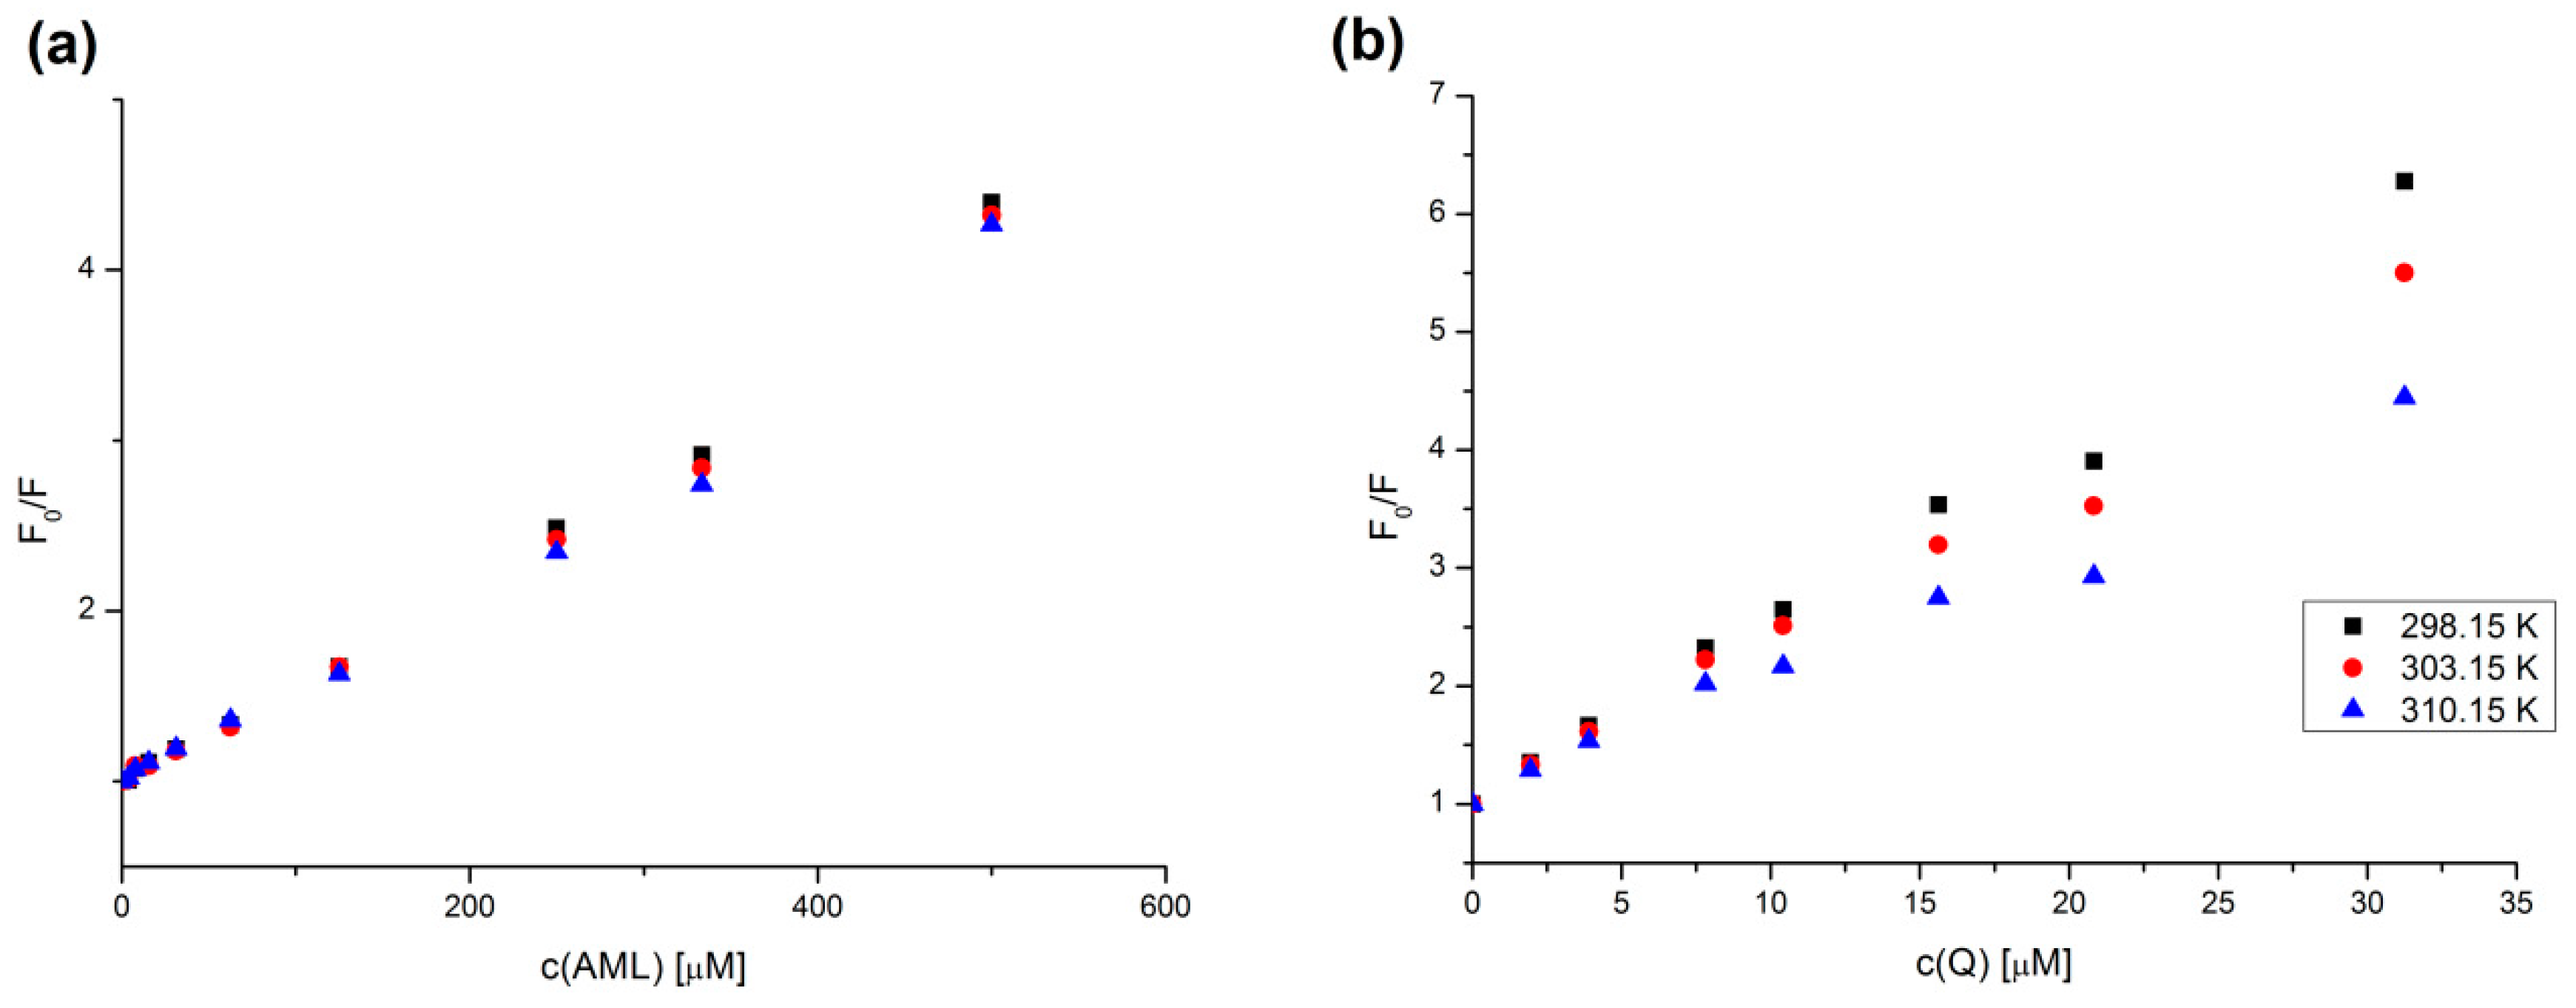
2.2. Stern–Volmer Analysis
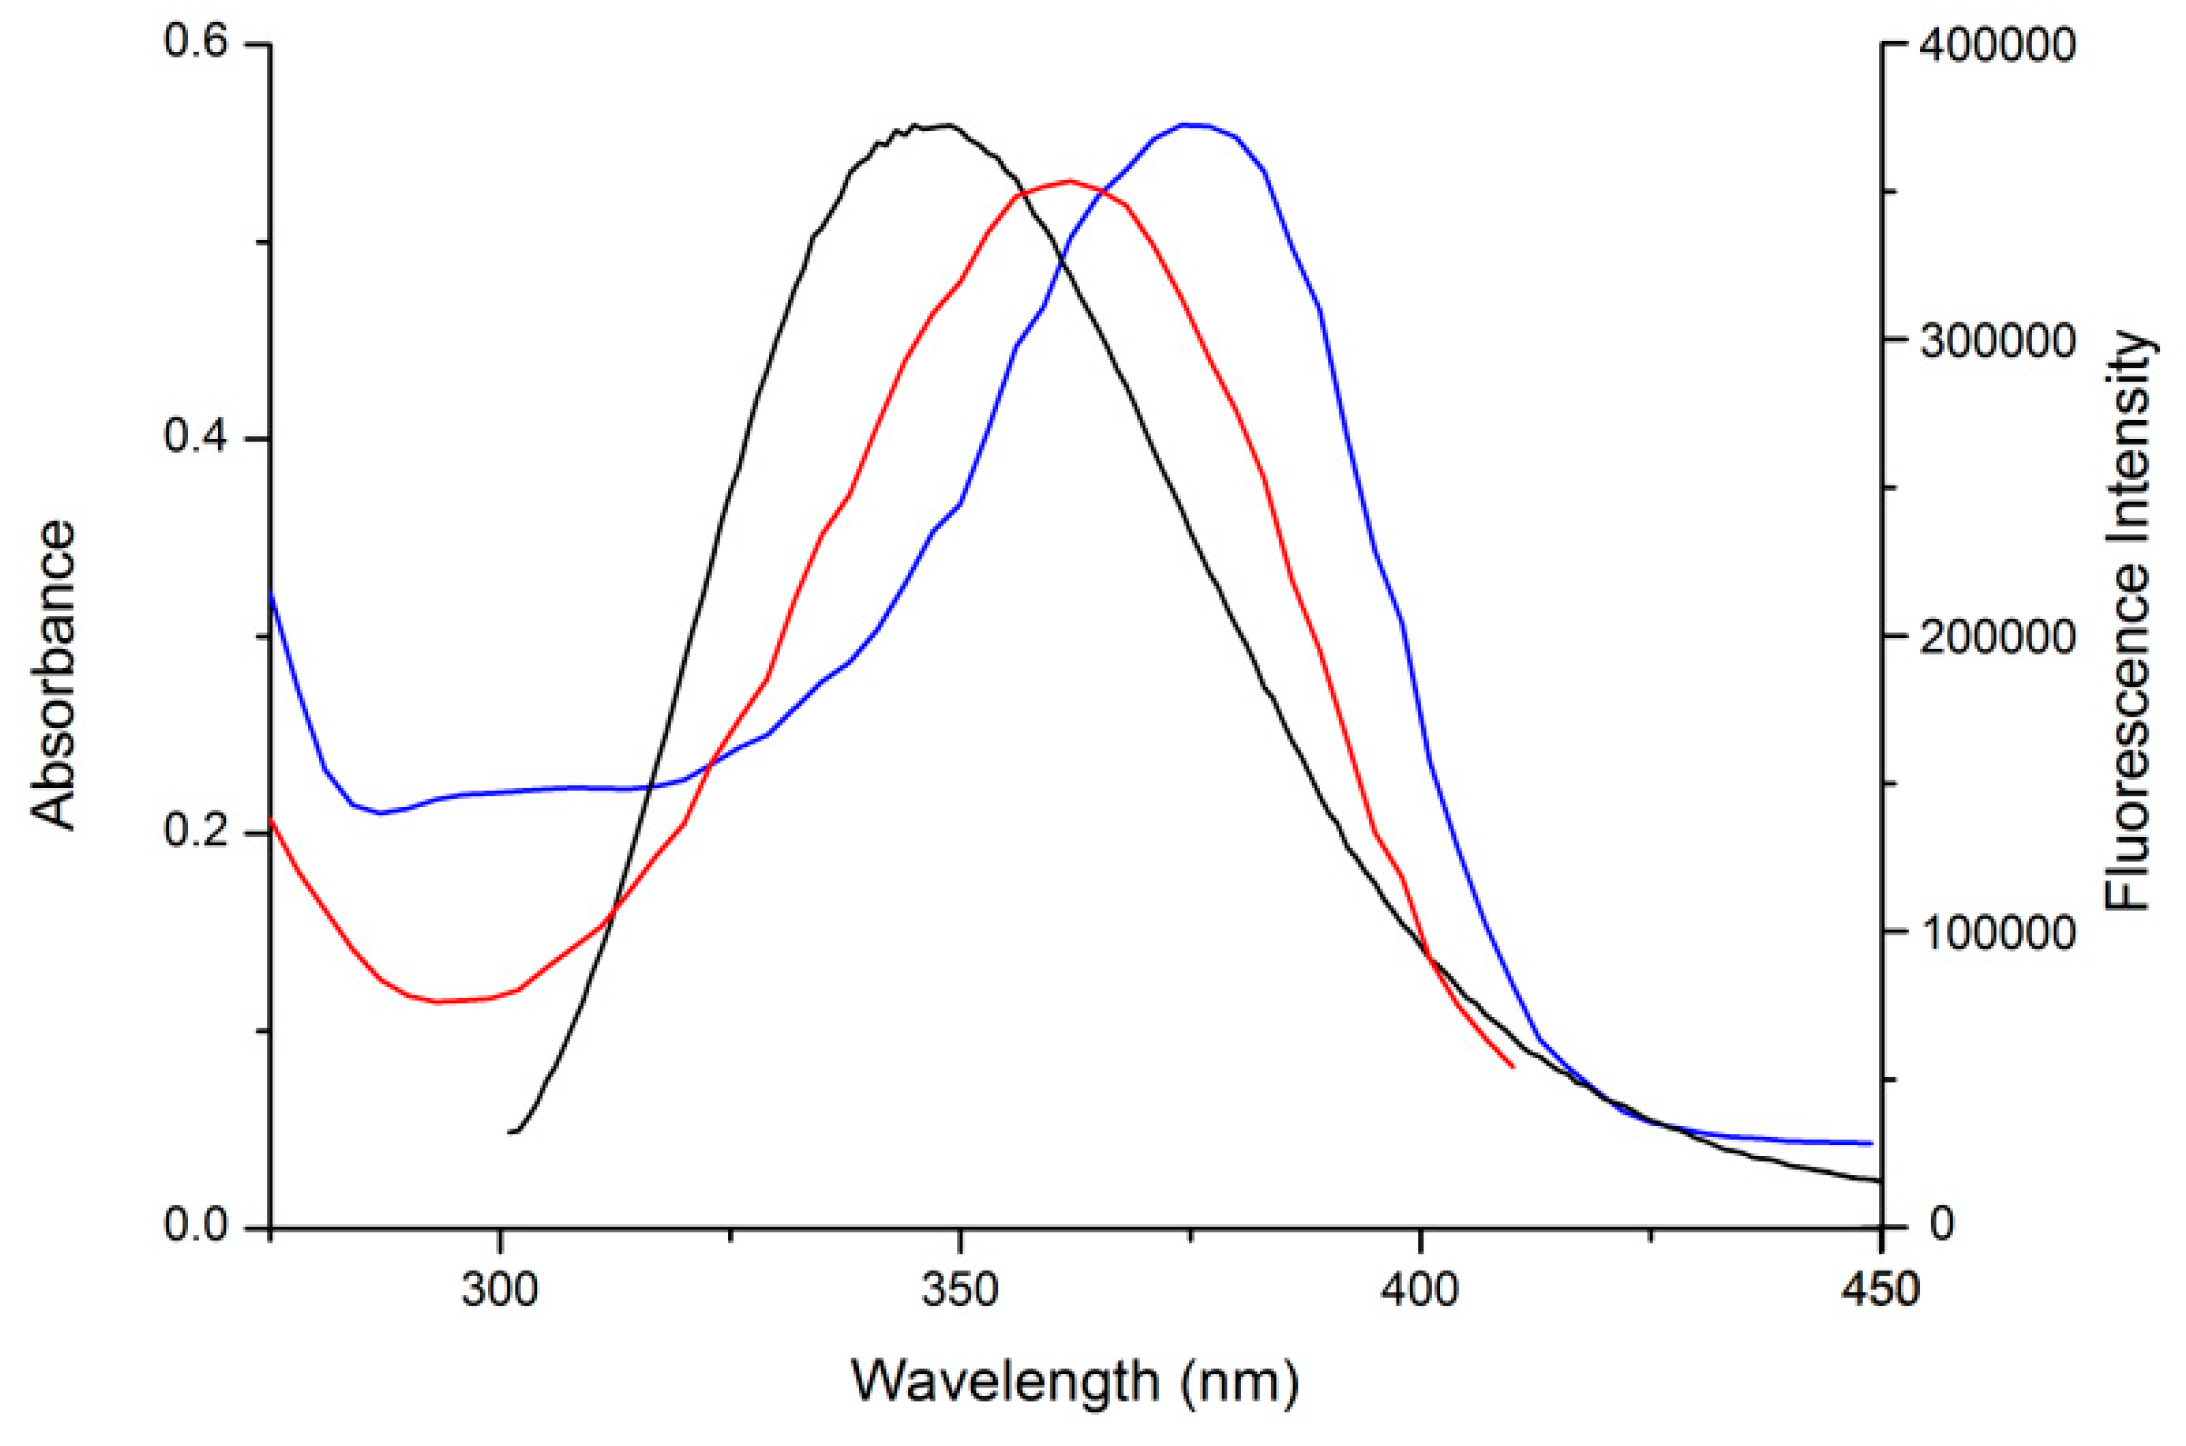
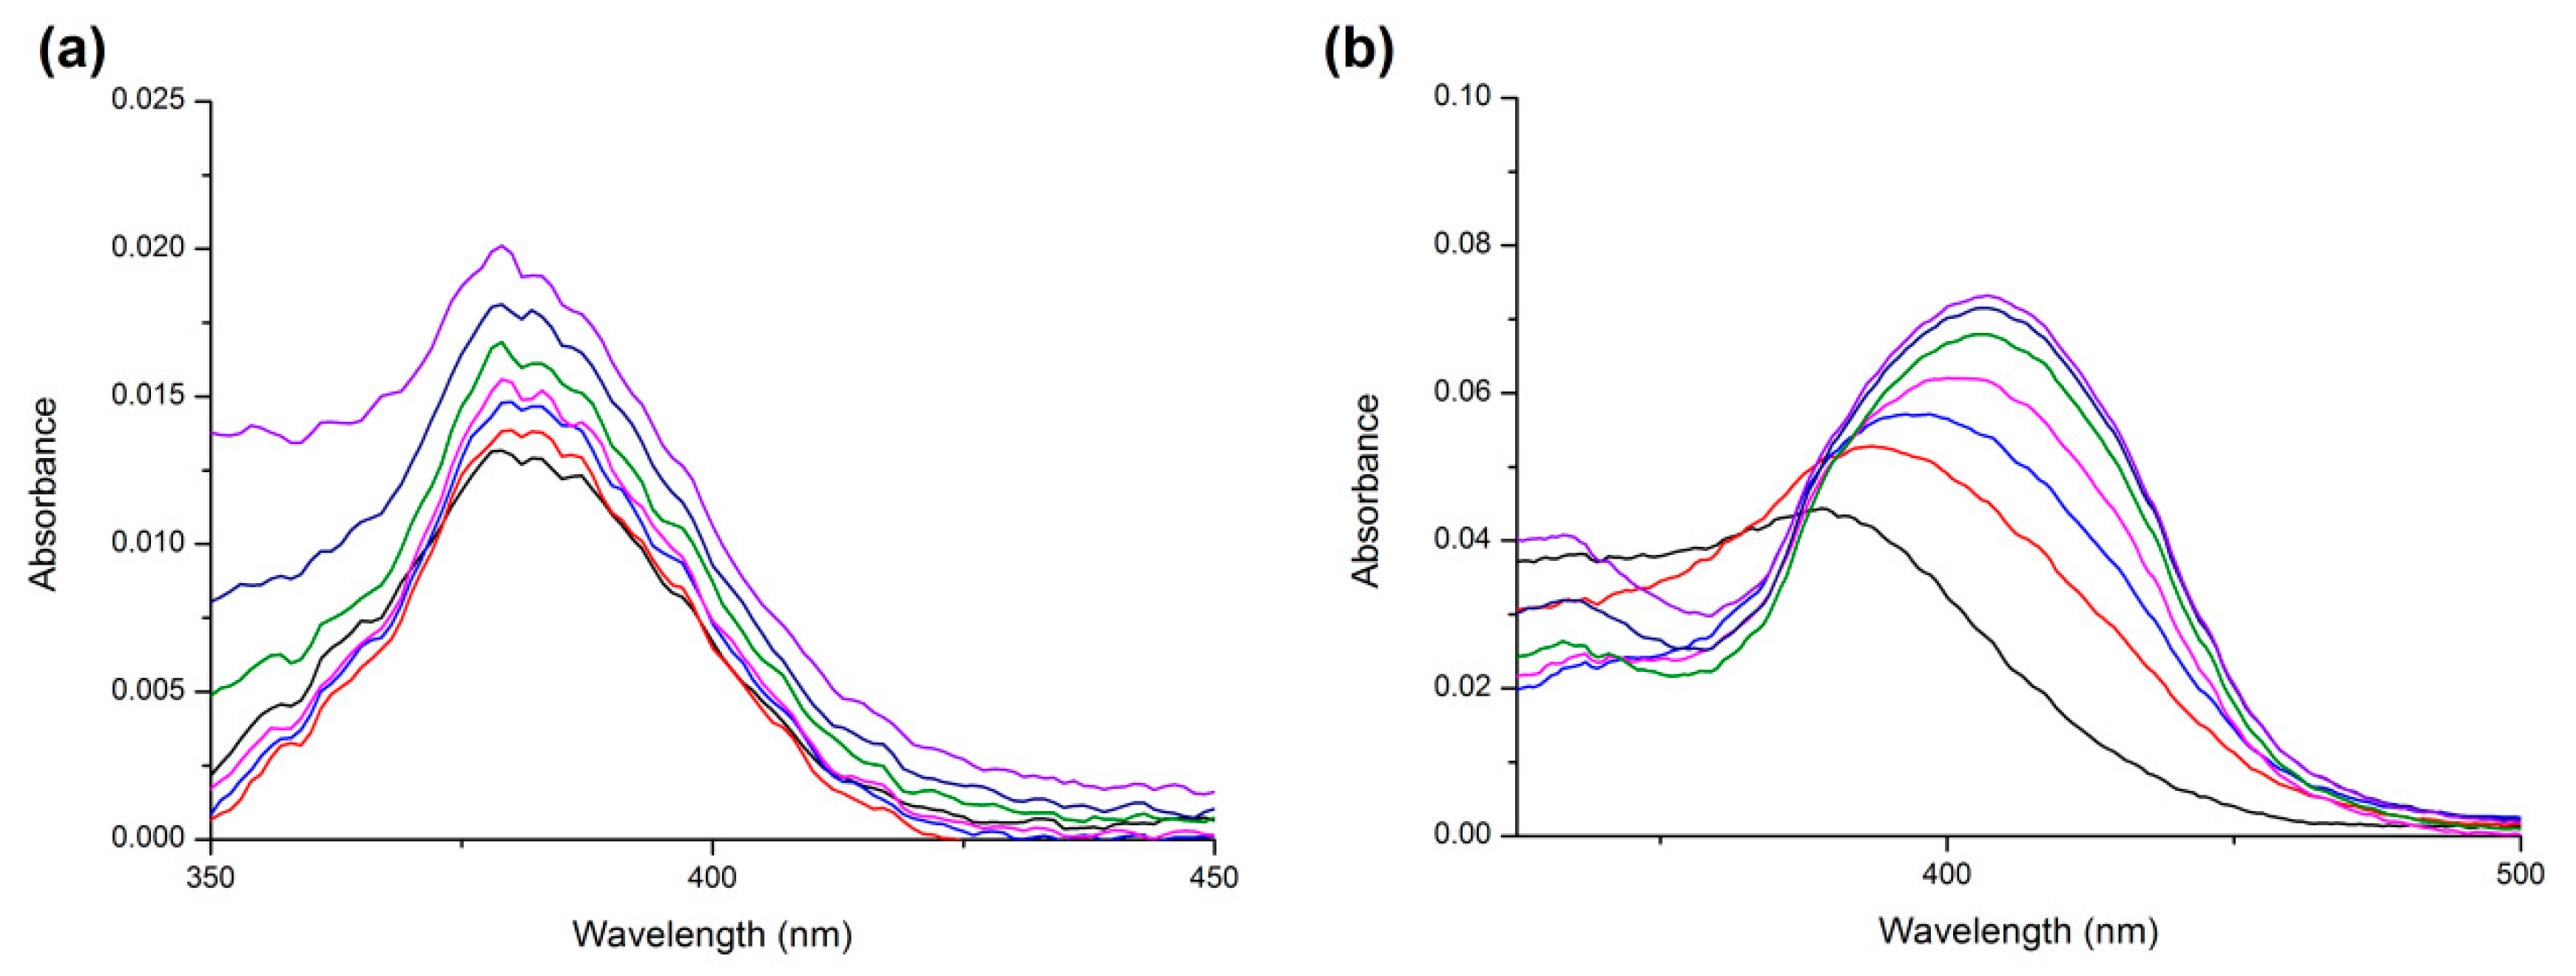
2.3. UV Absorption Measurements
2.4. Binding Constant Analysis
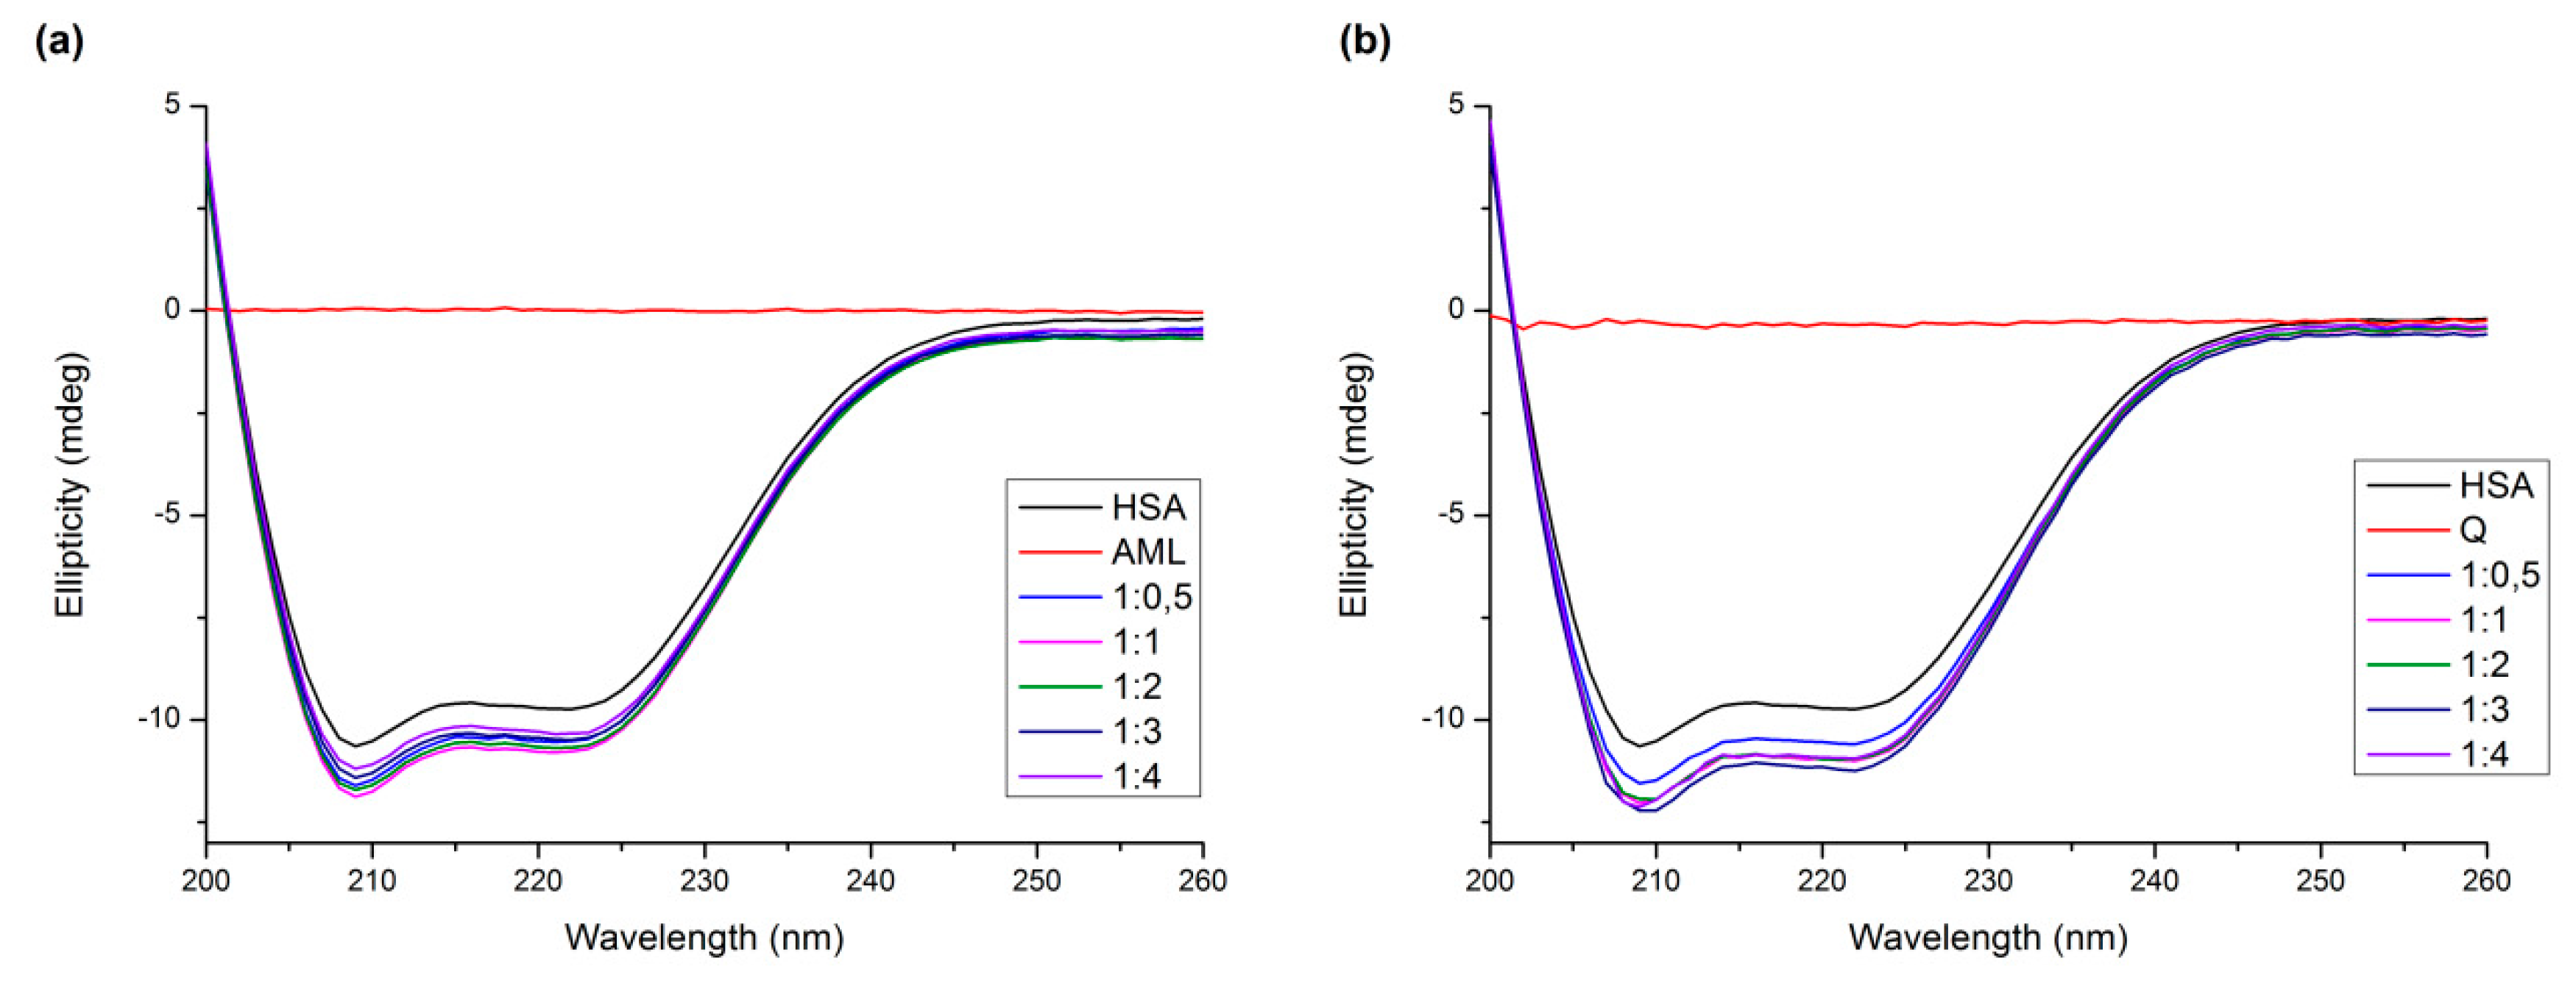
2.5. Circular Dichroism Measurements
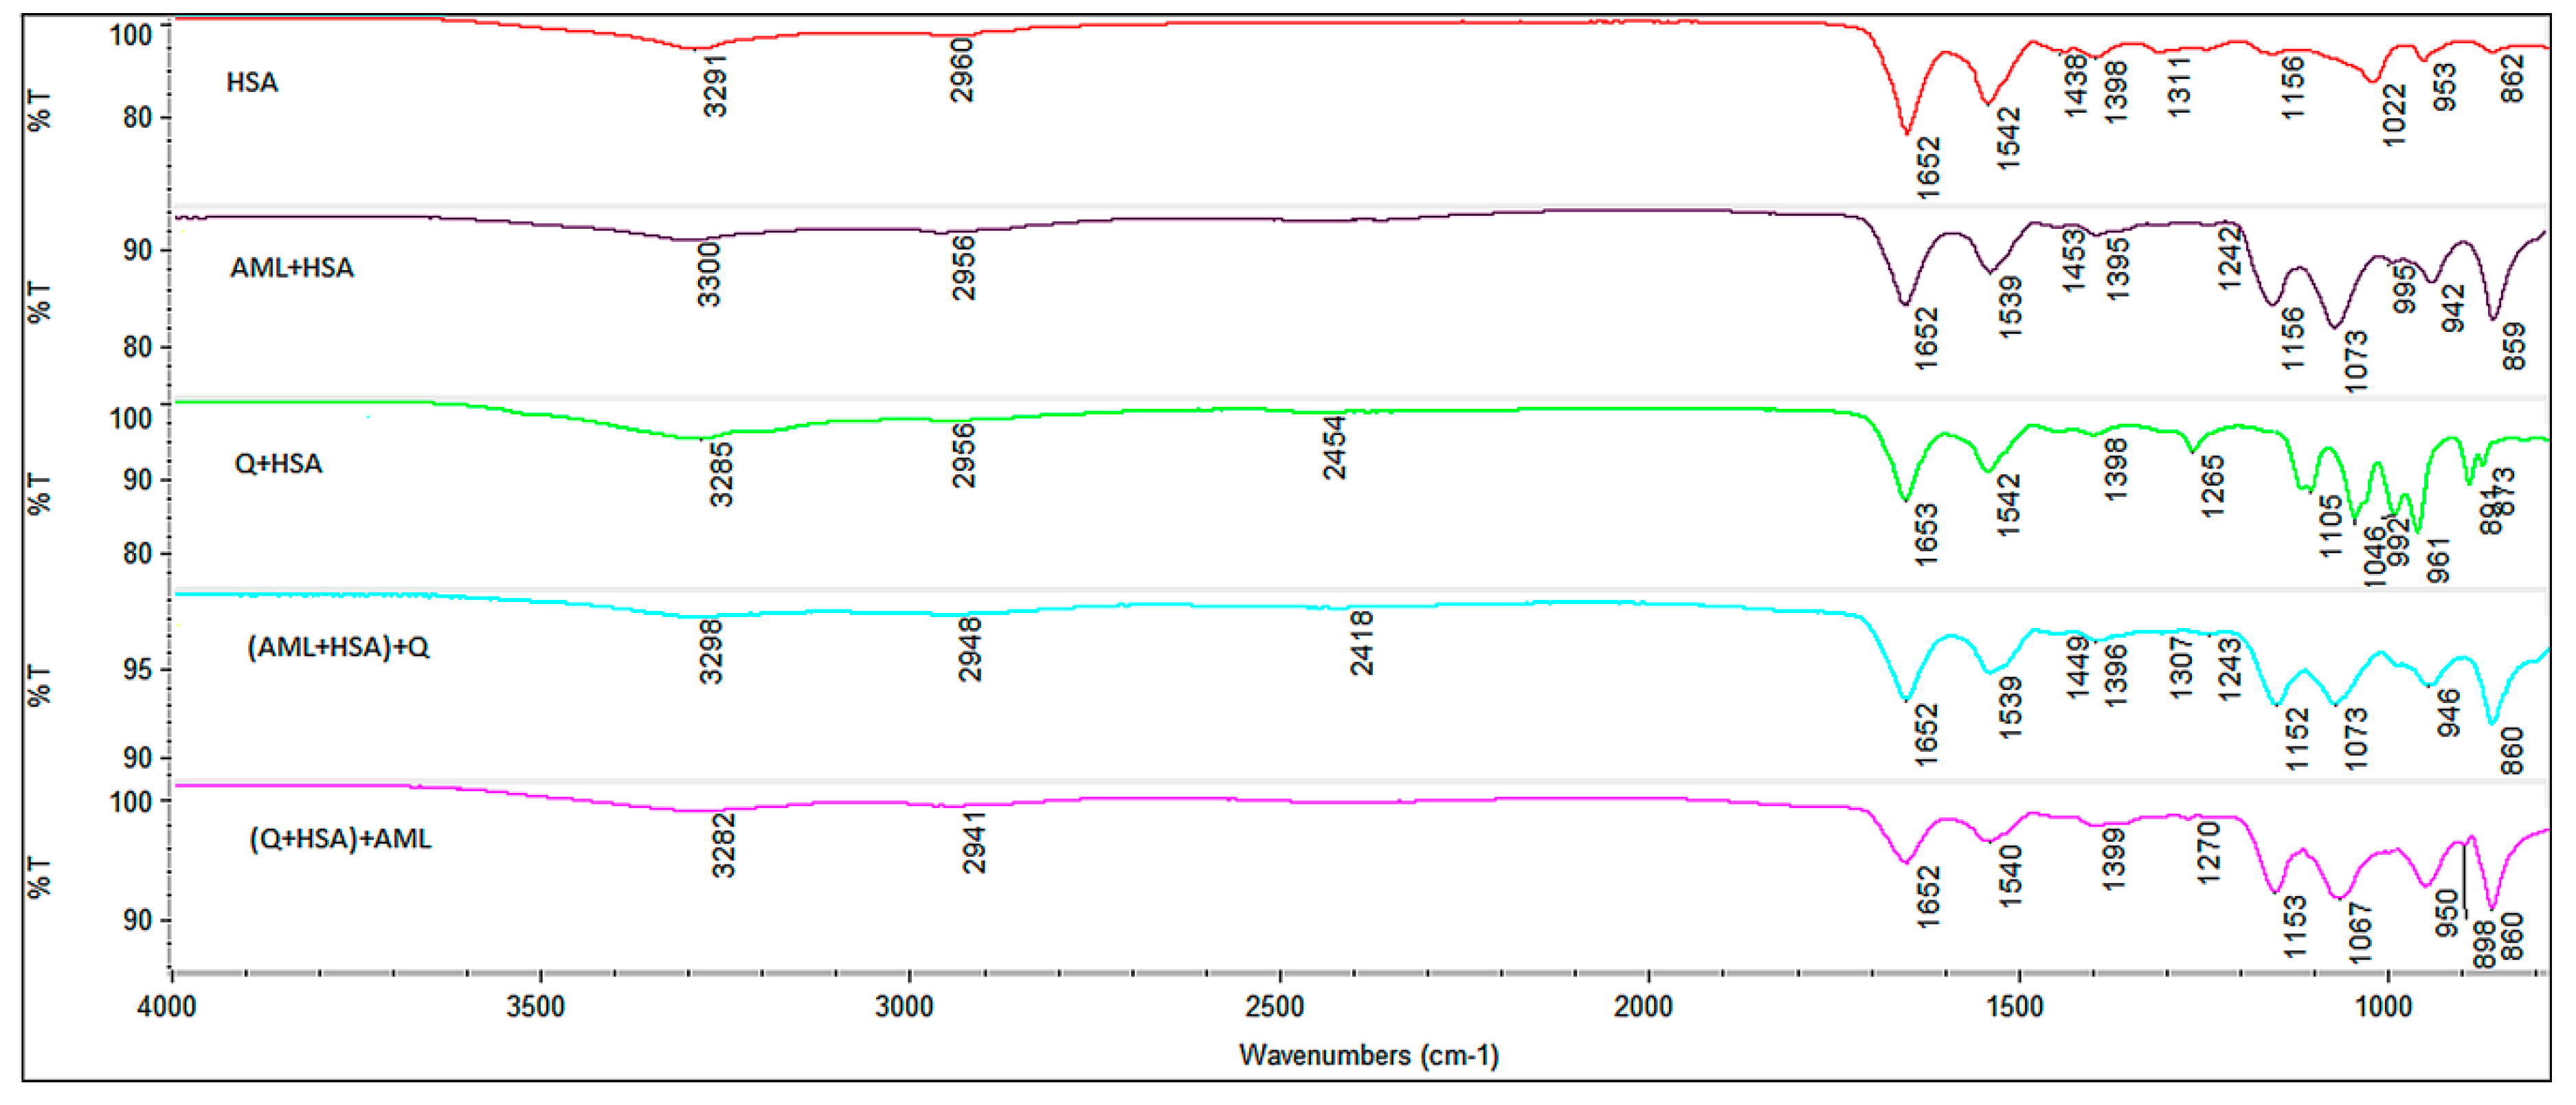
2.6. FT-IR
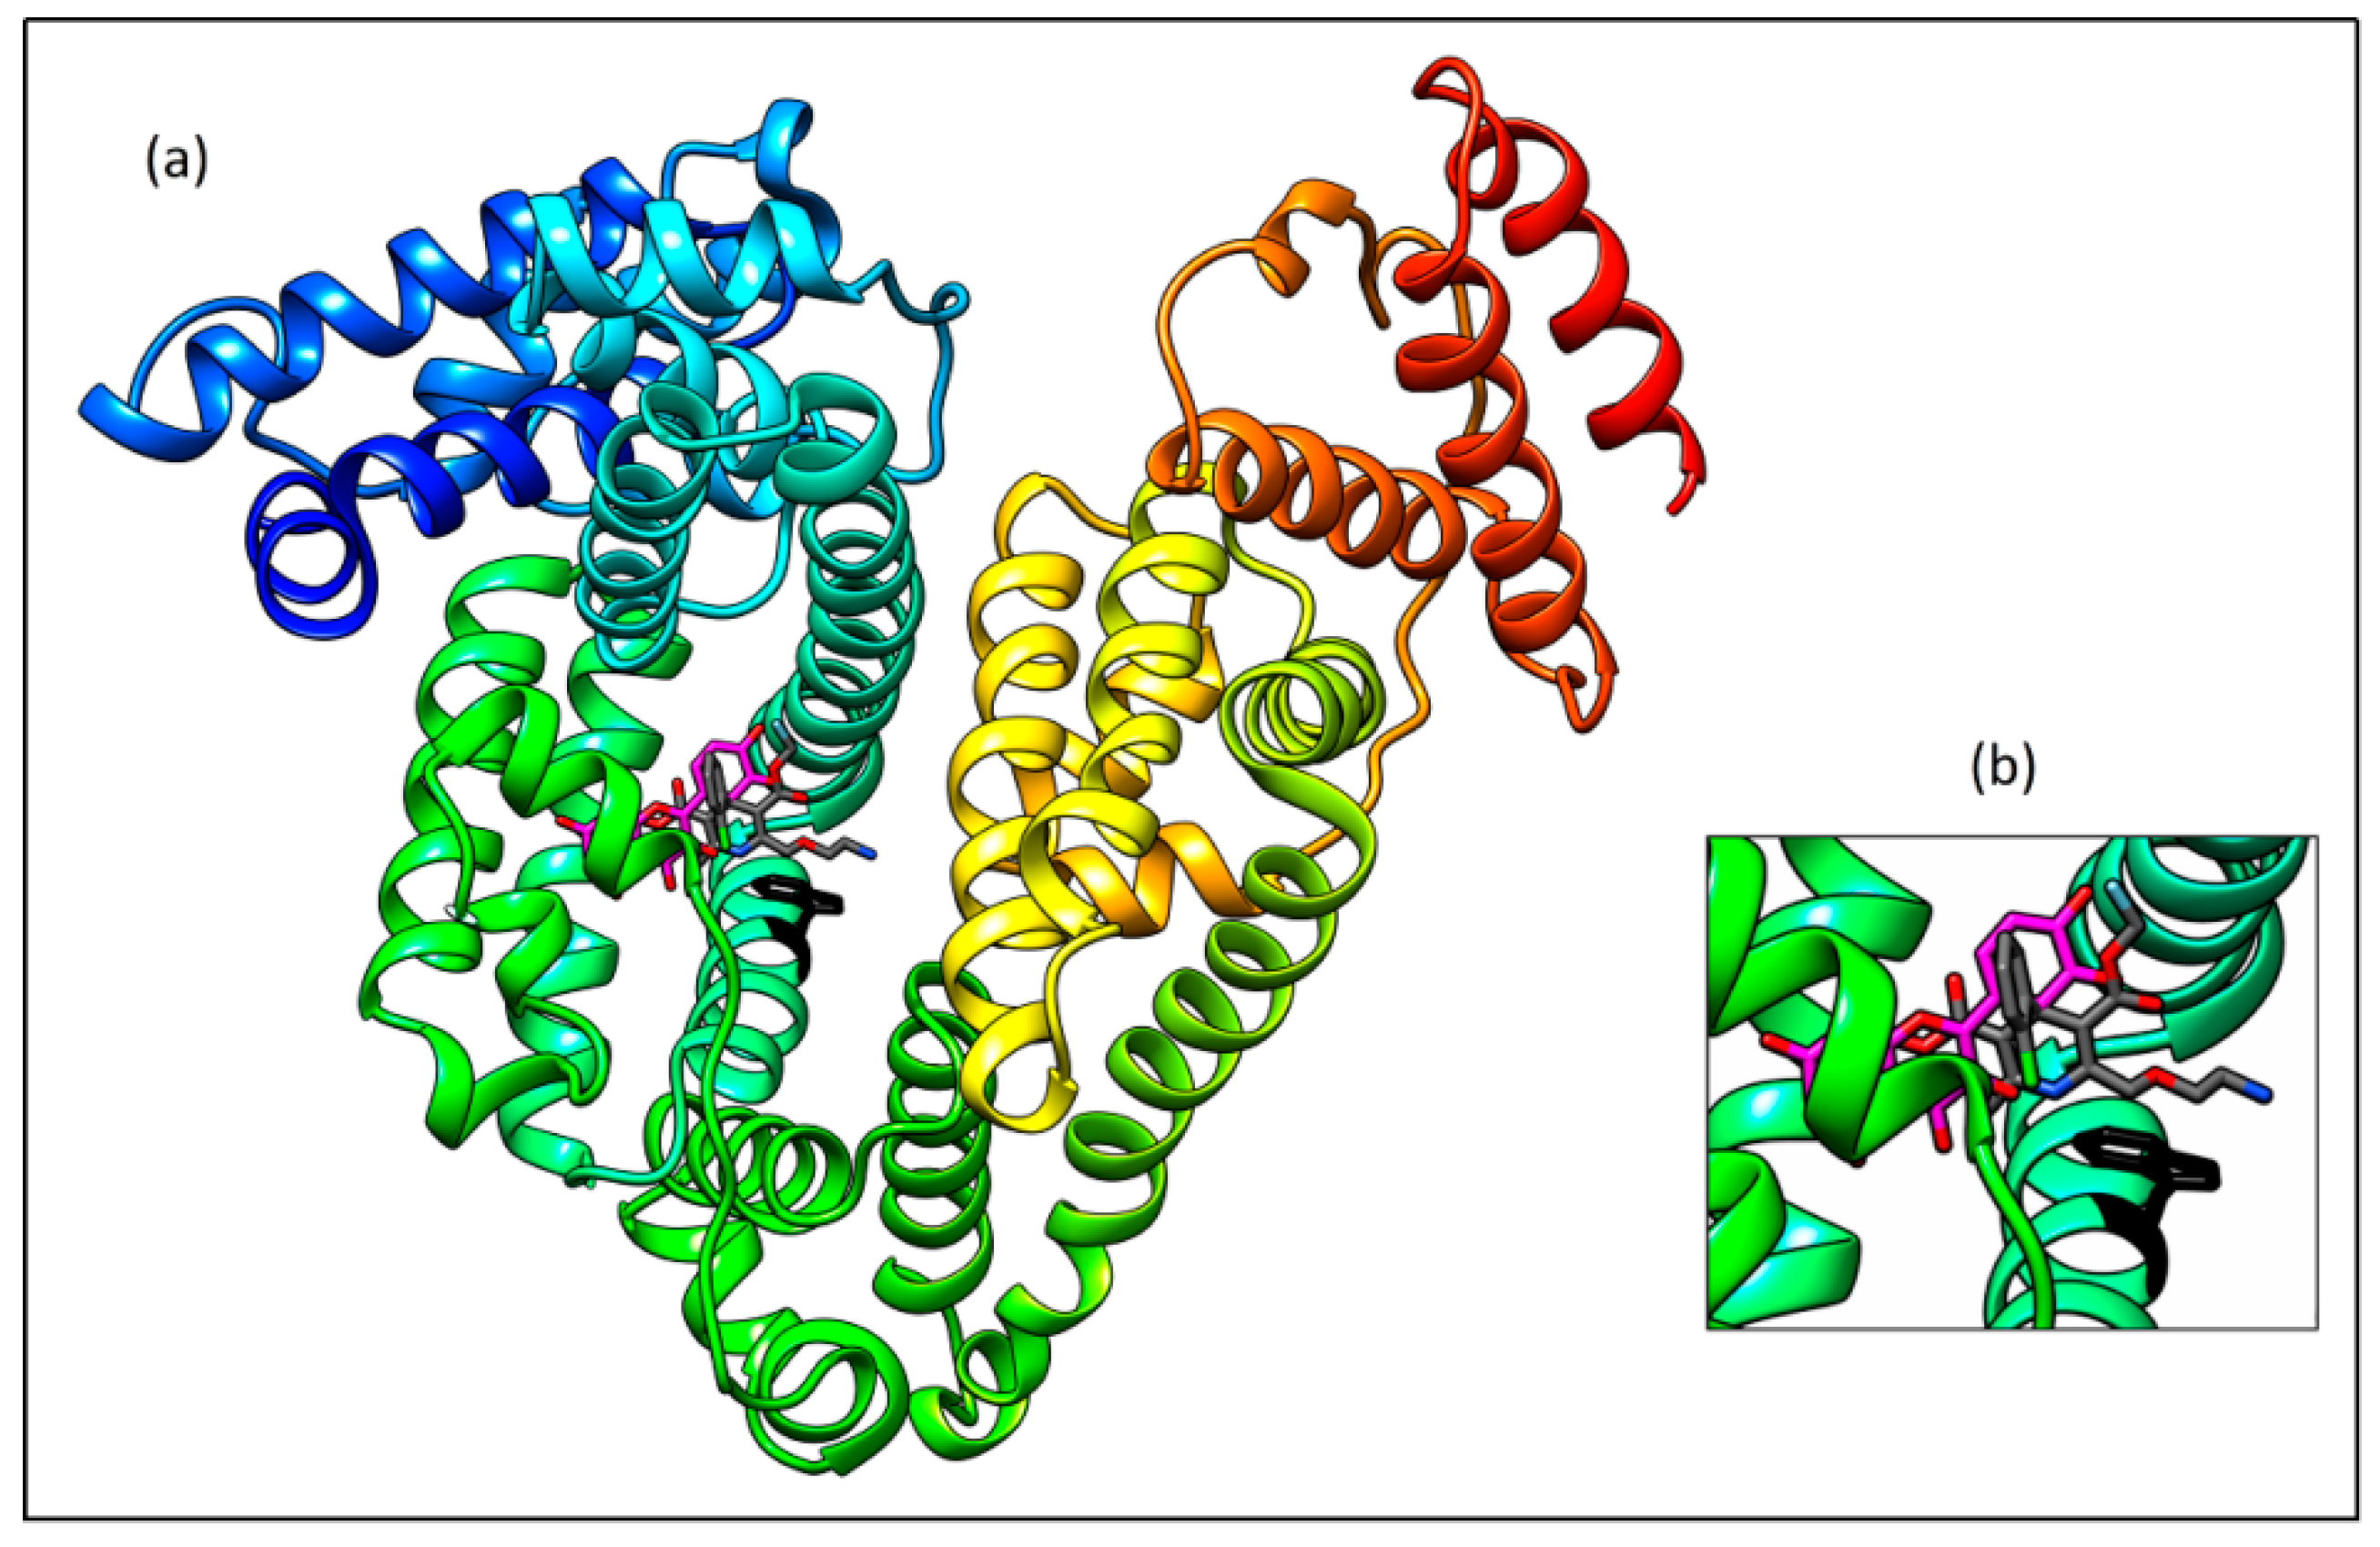
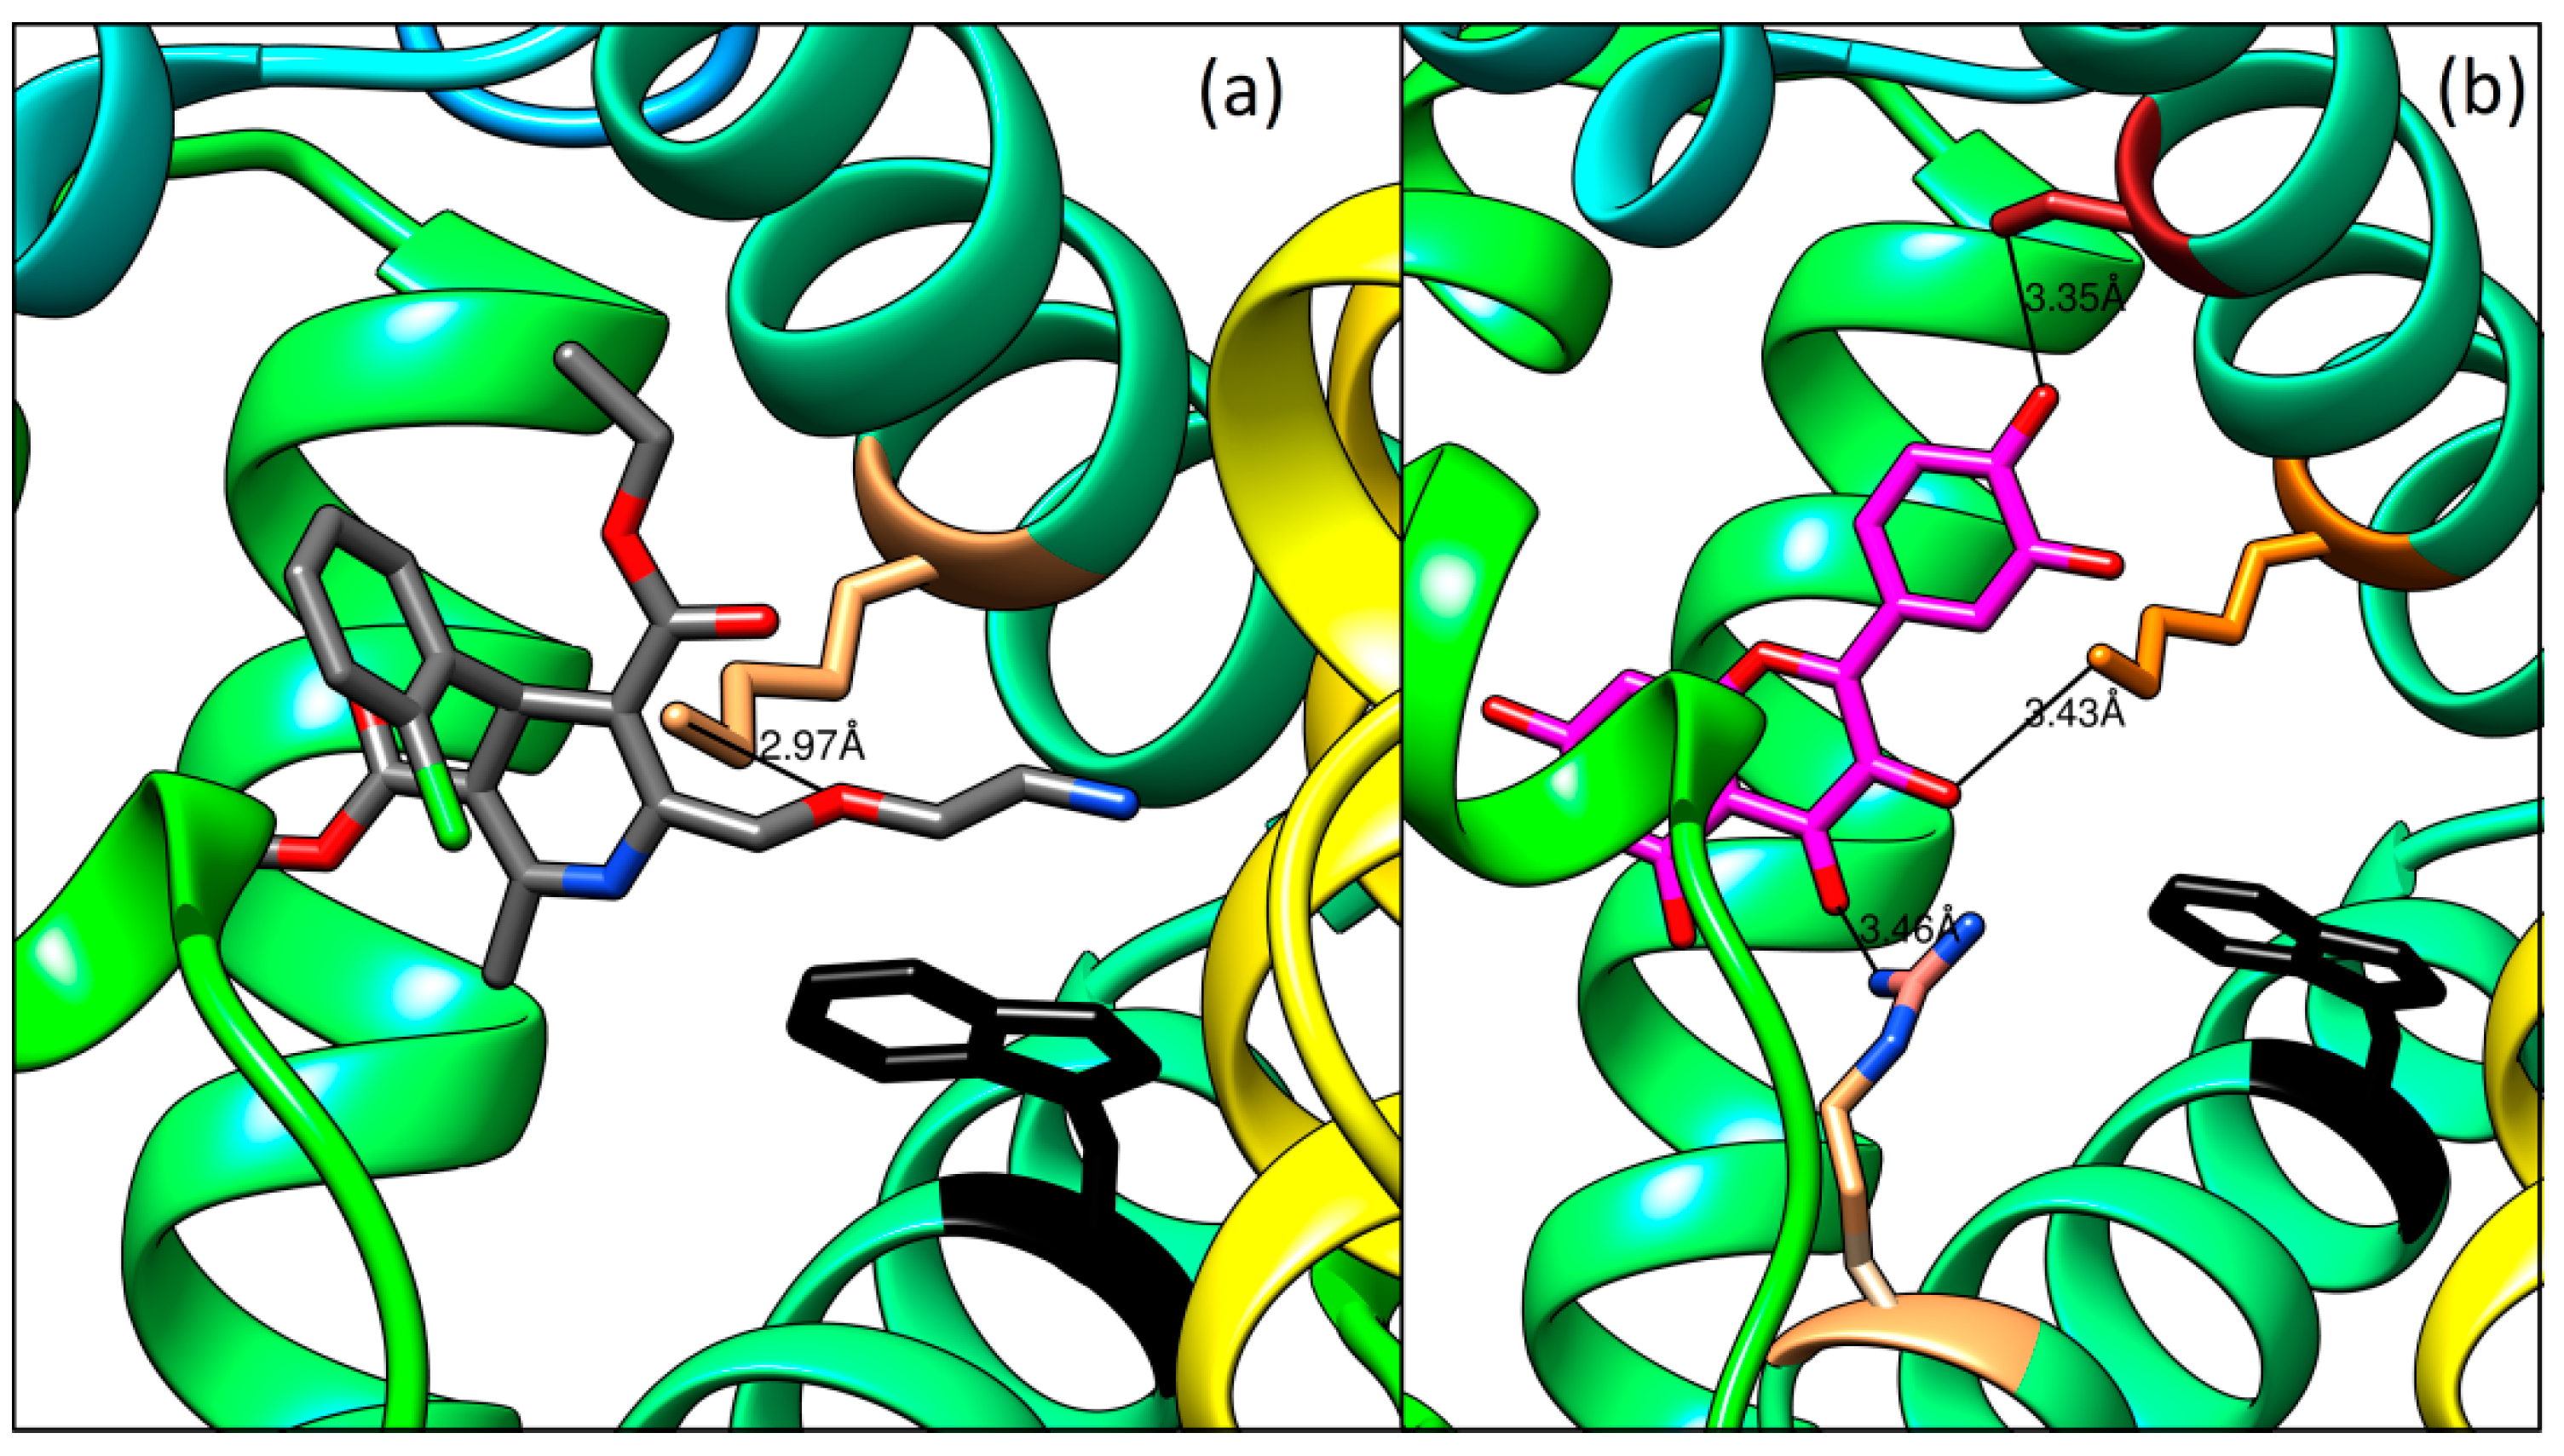
2.7. Molecular Docking Study
- - the carbonyl oxygen and the amino group of guanidine part of Arg222 (distance 3.46 Å),
- - the hydroxyl group on the C-3 and the amino group of Lys199 (3.43 Å), and
- - the hydroxyl group on the C-4′ and the hydroxyl group of Ser192 (3.35 Å)
3. Discussion
4. Materials and Methods
4.1. Materials
4.2. Methods
4.2.1. Fluorescence Measurements
4.2.2. Binding Constant Analysis
4.2.3. UV Absorption Measurements
4.2.4. Circular Dichroism (CD) Measurements
4.2.5. FT-IR
4.2.6. Docking Study
Author Contributions
Funding
Acknowledgments
Conflicts of Interest
References
- Peters, T., Jr. All About Albumin, 1st ed.; Academic Press: Cambridge, MA, USA, 1995. [Google Scholar]
- Fanali, G.; di Masi, A.; Trezza, V.; Marino, M.; Fasano, M.; Ascenzi, P. Human serum albumin: From bench to bedside. Mol. Asp. Med. 2012, 33, 209–290. [Google Scholar] [CrossRef] [PubMed]
- Sudlow, G.; Birkett, D.J.; Wade, D.N. Spectroscopic techniques in the study of protein binding. A fluorescence technique for the evaluation of the albumin binding and displacement of warfarin and warfarin-alcohol. Clin. Exp. Pharmacol. Physiol. 1975, 2, 129–140. [Google Scholar] [CrossRef] [PubMed]
- He, X.M.; Carter, D.C. Atomic structure and chemistry of human serum albumin. Nature 1992, 358, 209–215. [Google Scholar] [CrossRef] [PubMed]
- Ni, Y.; Su, S.; Kokot, S. Spectrofluorimetric studies on the binding of salicylic acid to bovine serum albumin using warfarin and ibuprofen as site markers with the aid of parallel factor analysis. Anal. Chim. Acta 2006, 580, 206–215. [Google Scholar] [CrossRef] [PubMed]
- Poór, M.; Boda, G.; Needs, P.W.; Kroon, P.A.; Lemlic, B.; Bencsik, T. Interaction of quercetin and its metabolites with warfarin: Displacement of warfarin from serum albumin and inhibition of CYP2C9 enzyme. Biomed. Pharmacother. 2017, 88, 574–581. [Google Scholar] [CrossRef]
- Poór, M.; Li, Y.; Kunsági-Máté, S. Molecular displacement of warfarin from human serum albumin by flavonoid aglycones. J. Lumin. 2013, 142, 122–127. [Google Scholar] [CrossRef]
- Wang, X.; Liu, Y.; He, L.; Liu, B.; Zhang, S.-Y.; Ye, X.; Jing, J.-J.; Zhang, J.-F.; Gao, M.; Wang, X. Spectroscopic investigation on the food components–drug interaction The influence of flavonoids on the affinity of nifedipine to human serum albumin. Food Chem. Toxicol. 2015, 78, 42–51. [Google Scholar] [CrossRef]
- Liu, B.-M.; Zhang, J.; Bai, C.-L.; Wang, X.; Qiu, X.-Z.; Wang, X.-L.; Ji, H.; Liu, B. Spectroscopic study on flavonoid–drug interactions: Competitive binding for human serum albumin between three flavonoid compounds and ticagrelor, a new antiplatelet drug. J. Lumin. 2015, 168, 69–76. [Google Scholar] [CrossRef]
- Mohseni-Shahri, F.S.; Housaindokht, M.R.; Bozorgmehr, M.R.; Moosavi-Movahedi, A.A. The influence of the flavonoid quercetin on the interaction of propranolol with human serum albumin: Experimental and theoretical approaches. J. Lumin. 2014, 154, 229–240. [Google Scholar] [CrossRef]
- Kameníková, M.; Furtmüller, P.G.; Klacsová, M.; Lopez-Guzman, A.; Toca-Herrera, J.L.; Vitkovská, A.; Devínsky, F.; Mučaji, P.; Nagy, M. Influence of quercetin on the interaction of gliclazide with human serum albumin-spectroscopic and docking approaches. Luminescence 2017, 32, 1203–1211. [Google Scholar] [CrossRef] [PubMed]
- Ritter, J.; Flower, R.; Henderson, G.; Rang, H. Rang & Dale’s Pharmacology, 8th ed.; Elsevier: Amsterdam, The Netherlands, 2016. [Google Scholar]
- NORVASC—Amlodipine Besylate Tablet. Available online: http://labeling.pfizer.com/ShowLabeling.aspx?id=562 (accessed on 2 December 2018).
- Shahri, P.A.; Rad, A.S.; Beigoli, S.; Saberi, M.R.; Chamani, J. Human serum albumin–amlodipine binding studied by multi-spectroscopic, zeta-potential, and molecular modeling techniques. J. Iran. Chem. Soc. 2018, 15, 223–243. [Google Scholar] [CrossRef]
- Housaindokht, M.R.; Zaeri, Z.R.; Bahrololoom, M.; Chamanic, J.; Bozorgmehrd, M.R. Investigation of the behavior of HSA upon binding to amlodipine and propranolol: Spectroscopic and molecular modeling approaches. Spectrochim. Acta A 2012, 85, 79–84. [Google Scholar] [CrossRef] [PubMed]
- Abdollahpour, N.; Soheili, V.; Saberi, M.R.; Chamani, J. Investigation of the Interaction between Human Serum Albumin and Two Drugs as Binary and Ternary Systems. Eur. J. Drug Metab. Pharmacokinet. 2016, 41, 705–721. [Google Scholar] [CrossRef] [PubMed]
- Abdollahpour, N.; Asoodeh, A.; Saberi, M.R.; Chamani, J.K. Separate and simultaneous binding effects of aspirin and amlodipine to human serum albumin based on fluorescence spectroscopic and molecular modeling characterizations: A mechanistic insight for determining usage drugs doses. J. Lumin. 2011, 131, 1885–1899. [Google Scholar] [CrossRef]
- Maddi, S.; Yamsani, M.R.; Seeling, A.; Scriba, G.K.E. Stereoselective Plasma Protein Binding of Amlodipine. Chiralit 2010, 22, 262–266. [Google Scholar] [CrossRef] [PubMed]
- Wang, W.; Sun, C.; Mao, L.; Ma, P.; Liu, F.; Yang, J.; Gao, Y. The biological activities, chemical stability, metabolism and delivery systems of quercetin. A review. Trends Food Sci. Technol. 2016, 56, 21–38. [Google Scholar] [CrossRef]
- Formica, J.V.; Regelson, W. Review of the Biology of Quercetin and Related Bioflavonoids. Food and Chemical Toxicology. Food Chem. Toxicol. 1995, 33, 1061–1080. [Google Scholar] [CrossRef]
- Boulton, D.W.; Walle, U.K.; Walle, T. Extensive Binding of the Bioflavonoid Quercetin to Human Plasma Proteins. J. Pharm. Pharmacol. 1998, 50, 243–249. [Google Scholar] [CrossRef]
- Sengupta, B.; Sengupta, P.K. Binding of Quercetin with Human Serum Albumin: A Critical Spectroscopic Study. Biopolymers 2003, 72, 427–434. [Google Scholar] [CrossRef]
- Lakowicz, J.R. Principles of Fluorescence Spectroscopy, 3rd ed.; Springer Science+Business Media, LLC: New York, NY, USA, 2006. [Google Scholar]
- Klotz, I.M. Ligand-Receptor Energetics: A Guide for the Perplexed, 1st ed.; John Wiley & Sons: Hoboken, NJ, USA, 1997. [Google Scholar]
- Lissi, E.; Calderón, C.; Campos, A. Evaluation of the number of binding sites in proteins from their intrinsic fluorescence: Limitations and pitfalls. Photochem. Photobiol. 2013, 89, 1413–1416. [Google Scholar] [CrossRef]
- Zsila, F. Circular Dichroism Spectroscopic Detection of Ligand Binding Induced Subdomain IB Specific Structural Adjustment of Human Serum Albumin. J. Phys. Chem. B 2013, 117, 10798–10806. [Google Scholar] [CrossRef] [PubMed]
- Zsila, F.; Bikádi, Z.; Simonyi, M. Probing the binding of the flavonoid, quercetin to human serum albumin by circular dichroism, electronic absorption spectroscopy and molecular modelling methods. Biochem Pharmacol. 2003, 65, 447–456. [Google Scholar] [CrossRef]
- Byler, D.M.; Susi, H. Examination of the secondary structure of proteins by deconvolved FTIR spectra. Biopolymers 1986, 25, 469–487. [Google Scholar] [CrossRef] [PubMed]
- Ionescu, S.; Matei, I.; Tablet, C.; Hillebrand, M. New insights on flavonoid-serum albumin interactions from concerted spectroscopic methods and molecular modeling. Curr. Drug MeTable 2013, 14, 474–490. [Google Scholar] [CrossRef]
- Chi, Z.; Liu, R. Phenotypic characterization of the binding of tetracycline to human serum albumin. Biomacromolecules 2011, 12, 203–209. [Google Scholar] [CrossRef] [PubMed]
- Zaccai, N.R.; Serdyuk, I.N.; Zaccai, J. Methods in Molecular Biophysics. Structure, Dynamics, Function for Biology and Medicine, 2nd ed.; Cambridge University Press: Cambridge, UK, 2007. [Google Scholar]
- Zsila, F. Subdomain IB Is the Third Major Drug Binding Region of Human Serum Albumin: Toward the Three-Sites Model. Mol. Pharm. 2013, 10, 1668–1682. [Google Scholar] [CrossRef] [PubMed]
Sample Availability: Samples of the compounds Human serum albumin, Amlodipine and Quercetin are available from the authors. |


| System | Kq [103 M−1] | kq [1011 M−1s−1] | R | KD [μM] | ΔG [kJ mol−1] |
|---|---|---|---|---|---|
| AML + HSA | 5.35 ± 0.09 | 5.35 ± 0.09 | 0.9998 | 183.77 ± 25.28 | −22.181 |
| Q + HSA | 15.23 ± 1.89 | 15.23 ± 1.89 | 0.9756 | 6.48 ± 2.01 | −30.807 |
| (Q +HSA) +AML | 5.07 ± 0.07 | 5.07 ± 0.07 | 0.9998 | 192.81 ± 24.09 | −22.057 |
| (AML + HSA) + Q | 76.02 ± 1.35 | 76.02 ± 1.35 | 0.9989 | 2.39 ± 0.32 | −33.379 |
| System | Ratio Protein:Ligand | α-Helix Content [%] |
|---|---|---|
| AML + HSA | 1:0 | 59.1 ± 1.0 |
| 1:0.5 | 63.6 ± 0.3 | |
| 1:1 | 64.7 ± 0.2 | |
| 1:2 | 64.1 ± 0.3 | |
| 1:3 | 62.5 ± 0.1 | |
| 1:4 | 61.5 ± 0.7 | |
| Q + HSA | 1:0 | 59.1 ± 1.0 |
| 1:0.5 | 63.0 ± 2.0 | |
| 1:1 | 65.4 ± 0.5 | |
| 1:2 | 65.2 ± 0.9 | |
| 1:3 | 66.2 ± 0.7 | |
| 1:4 | 66.3 ± 1.5 |
© 2019 by the authors. Licensee MDPI, Basel, Switzerland. This article is an open access article distributed under the terms and conditions of the Creative Commons Attribution (CC BY) license (http://creativecommons.org/licenses/by/4.0/).
Share and Cite
Vaneková, Z.; Hubčík, L.; Toca-Herrera, J.L.; Furtműller, P.G.; Valentová, J.; Mučaji, P.; Nagy, M. Study of Interactions between Amlodipine and Quercetin on Human Serum Albumin: Spectroscopic and Modeling Approaches. Molecules 2019, 24, 487. https://doi.org/10.3390/molecules24030487
Vaneková Z, Hubčík L, Toca-Herrera JL, Furtműller PG, Valentová J, Mučaji P, Nagy M. Study of Interactions between Amlodipine and Quercetin on Human Serum Albumin: Spectroscopic and Modeling Approaches. Molecules. 2019; 24(3):487. https://doi.org/10.3390/molecules24030487
Chicago/Turabian StyleVaneková, Zuzana, Lukáš Hubčík, José Luis Toca-Herrera, Paul Georg Furtműller, Jindra Valentová, Pavel Mučaji, and Milan Nagy. 2019. "Study of Interactions between Amlodipine and Quercetin on Human Serum Albumin: Spectroscopic and Modeling Approaches" Molecules 24, no. 3: 487. https://doi.org/10.3390/molecules24030487
APA StyleVaneková, Z., Hubčík, L., Toca-Herrera, J. L., Furtműller, P. G., Valentová, J., Mučaji, P., & Nagy, M. (2019). Study of Interactions between Amlodipine and Quercetin on Human Serum Albumin: Spectroscopic and Modeling Approaches. Molecules, 24(3), 487. https://doi.org/10.3390/molecules24030487