Modification of Immobilized Titanium Dioxide Nanostructures by Argon Plasma for Photocatalytic Removal of Organic Dyes


Abstract
:
1. Introduction
2. Results and Discussion
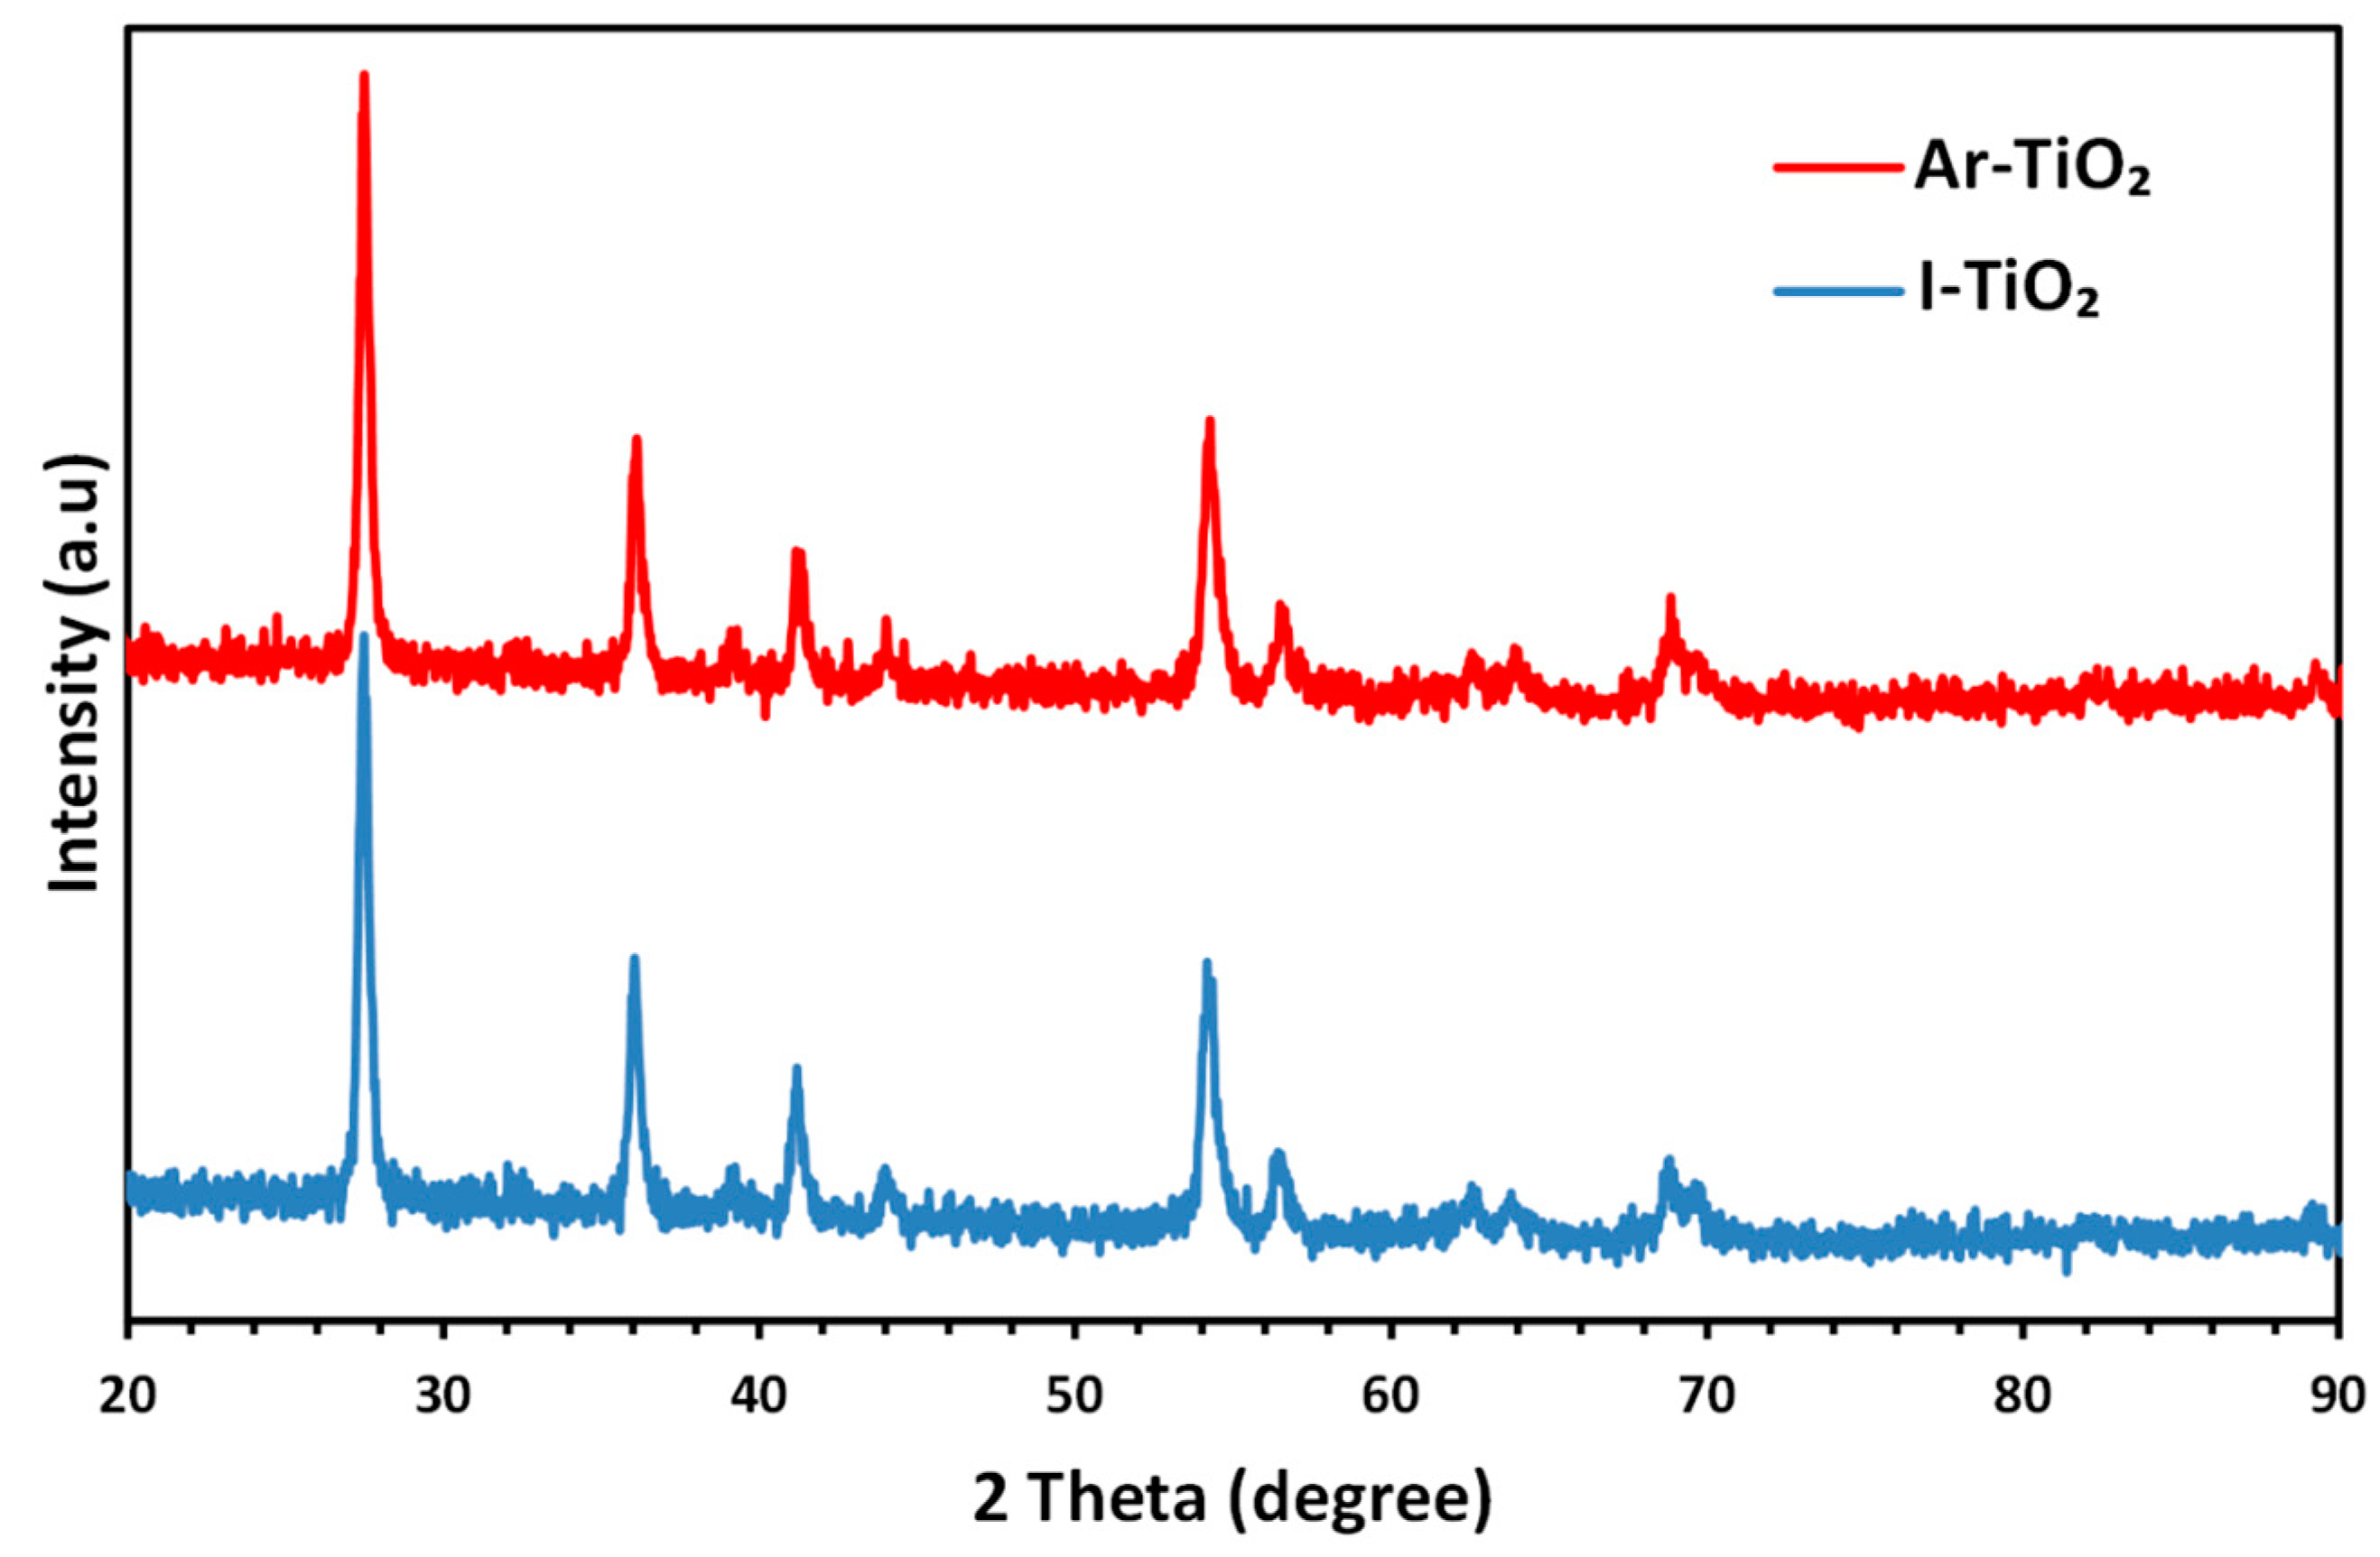
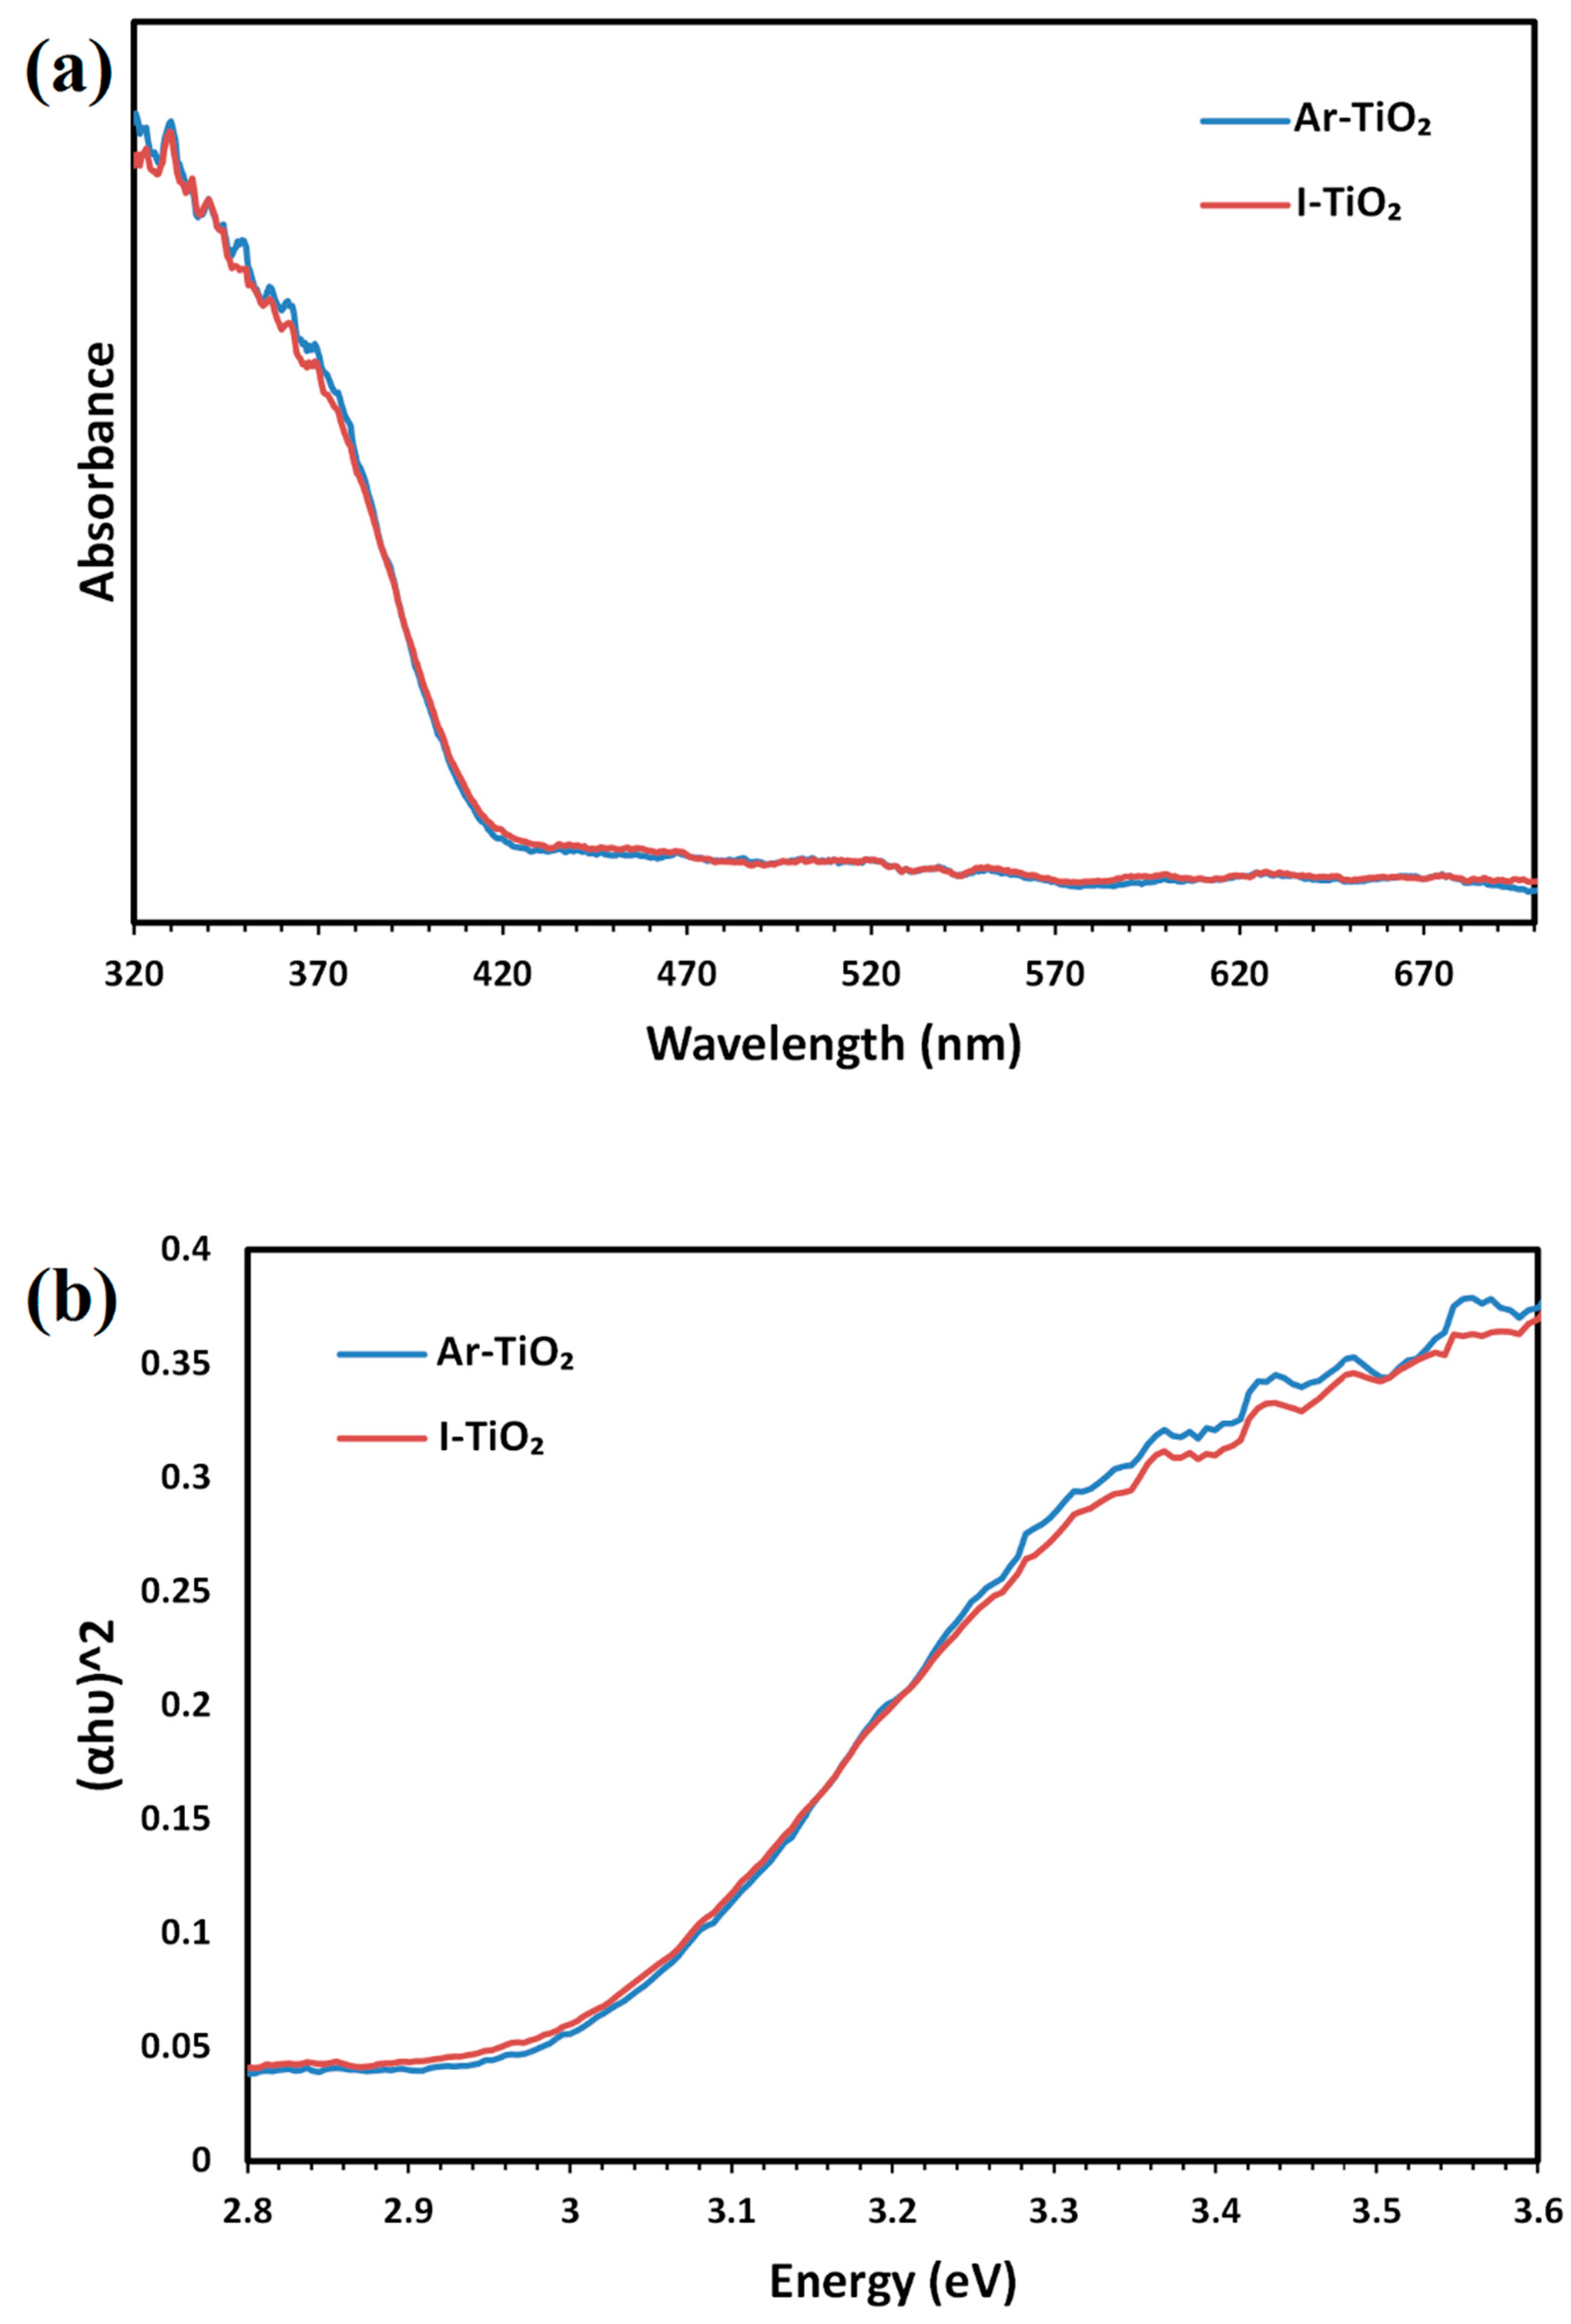
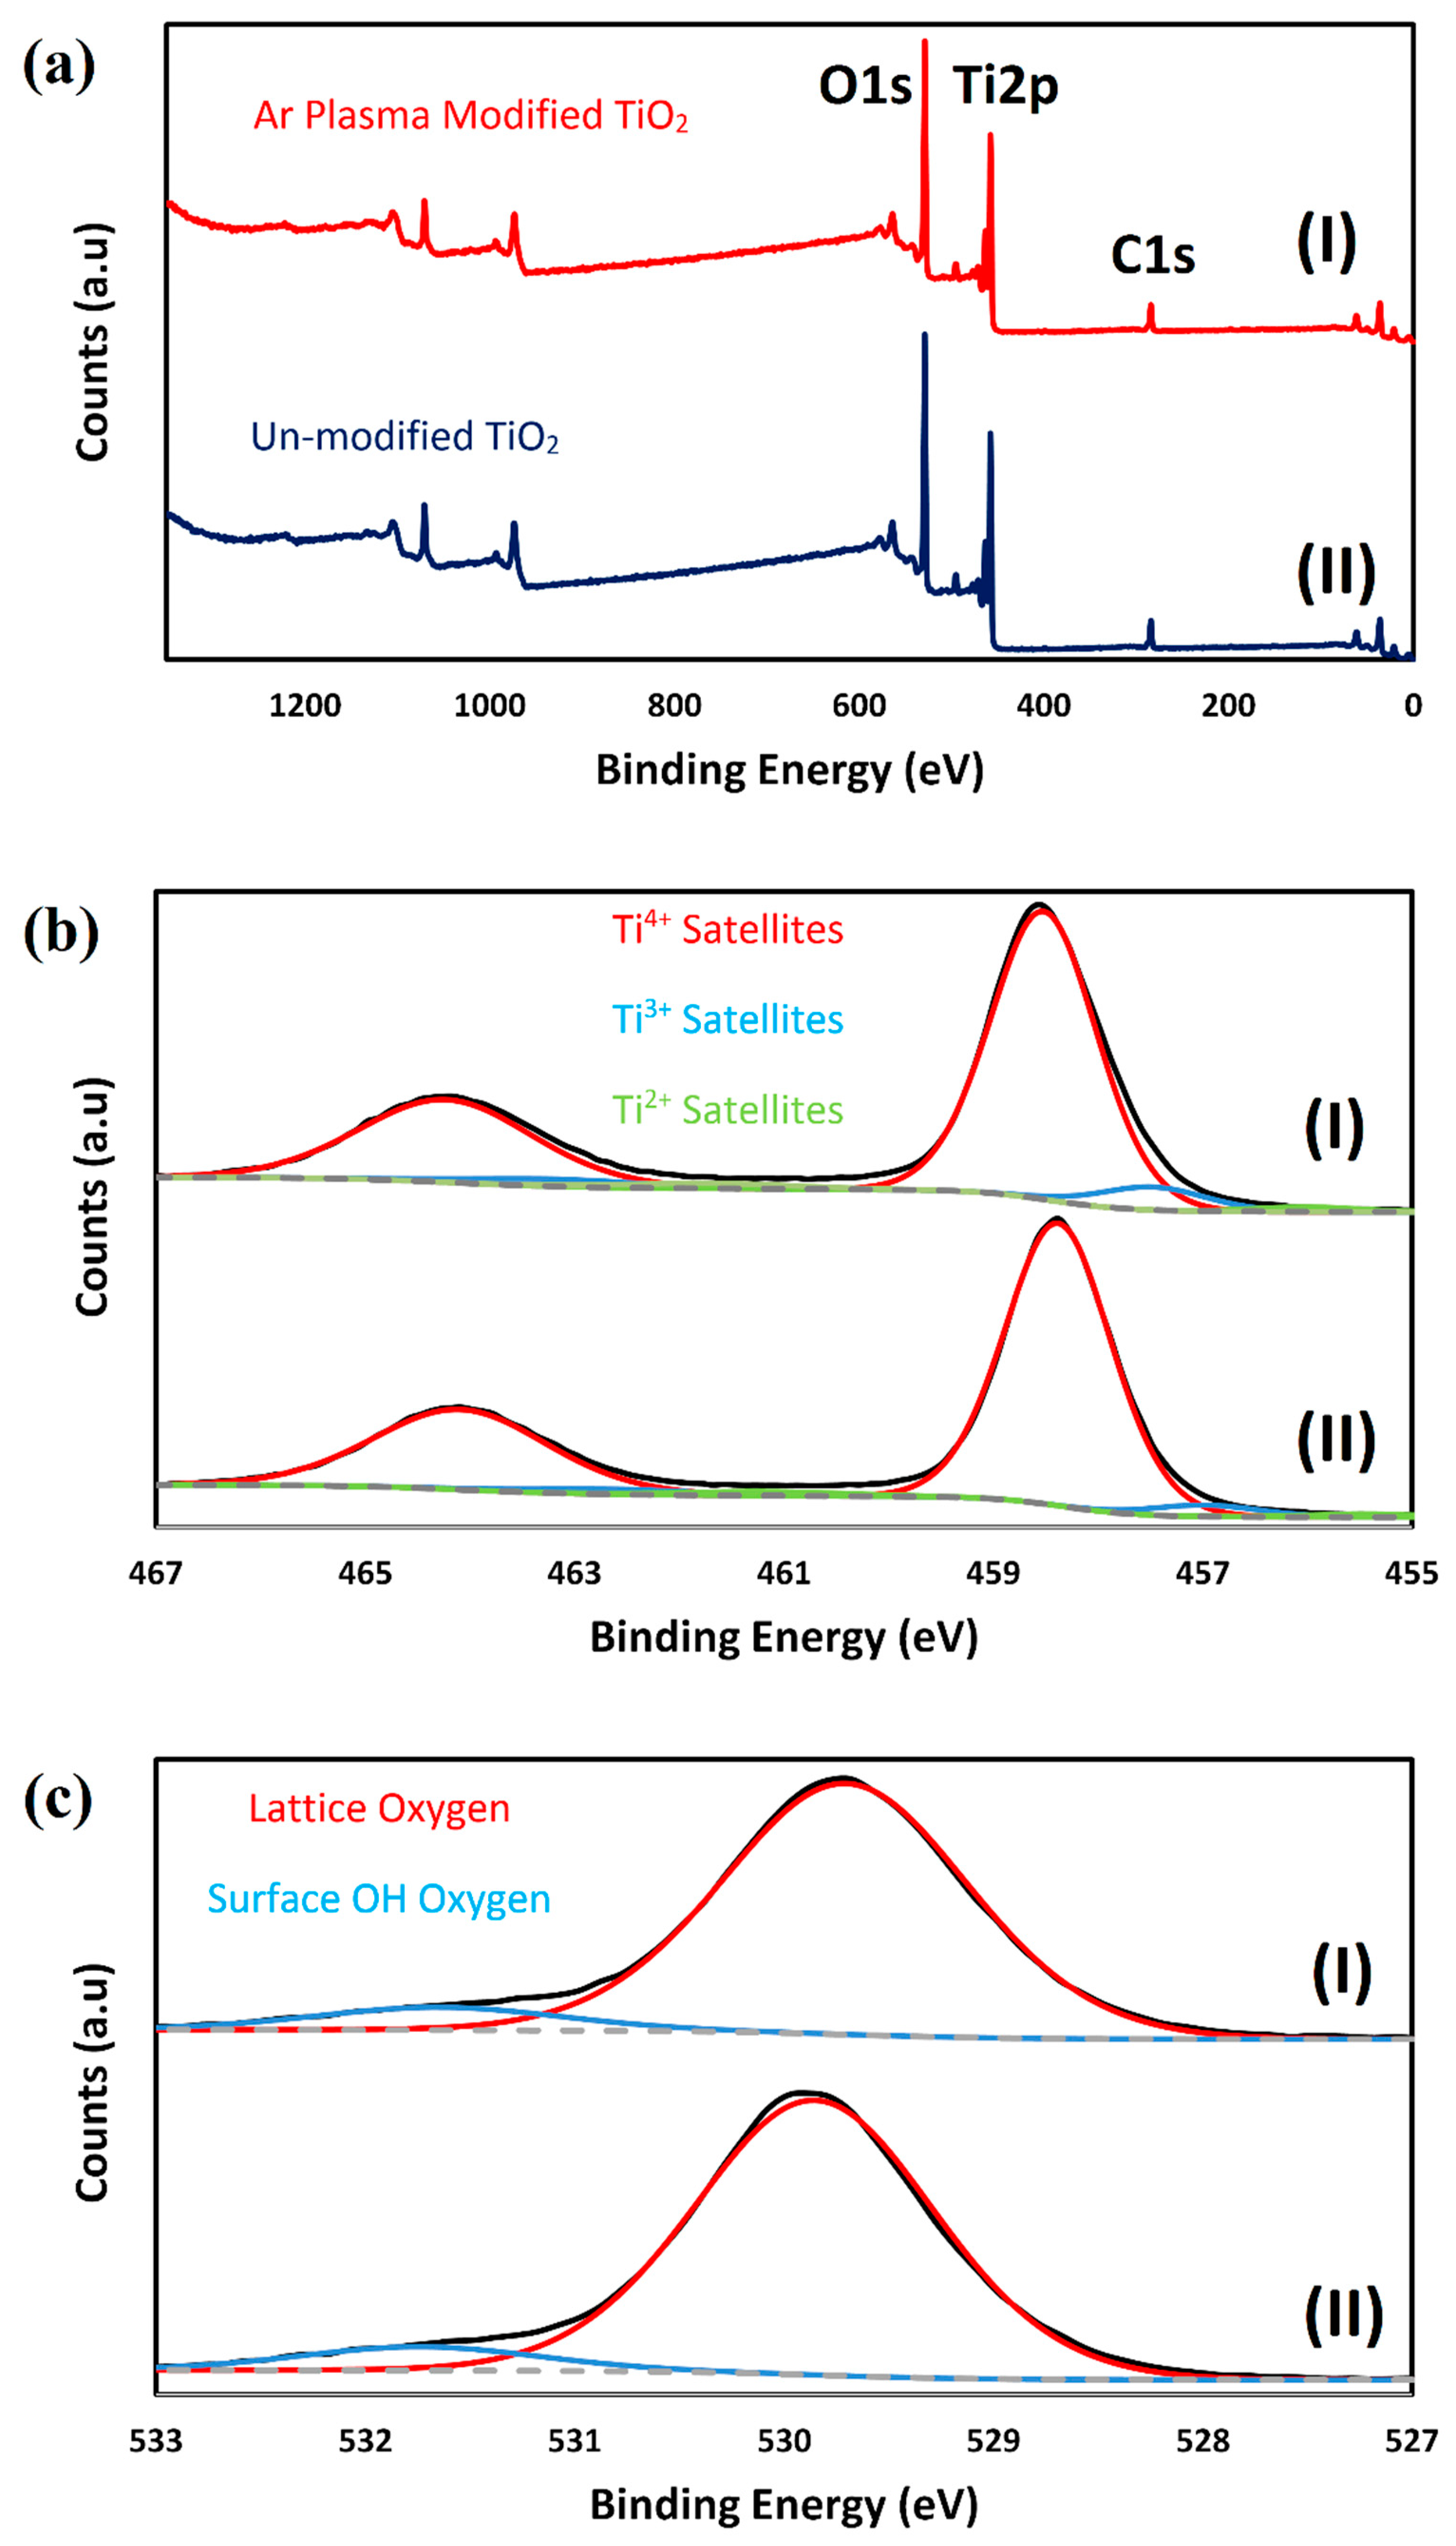
2.1. Characterizing of the Catalysts
2.2. Optimal Plasma Treatment Conditions
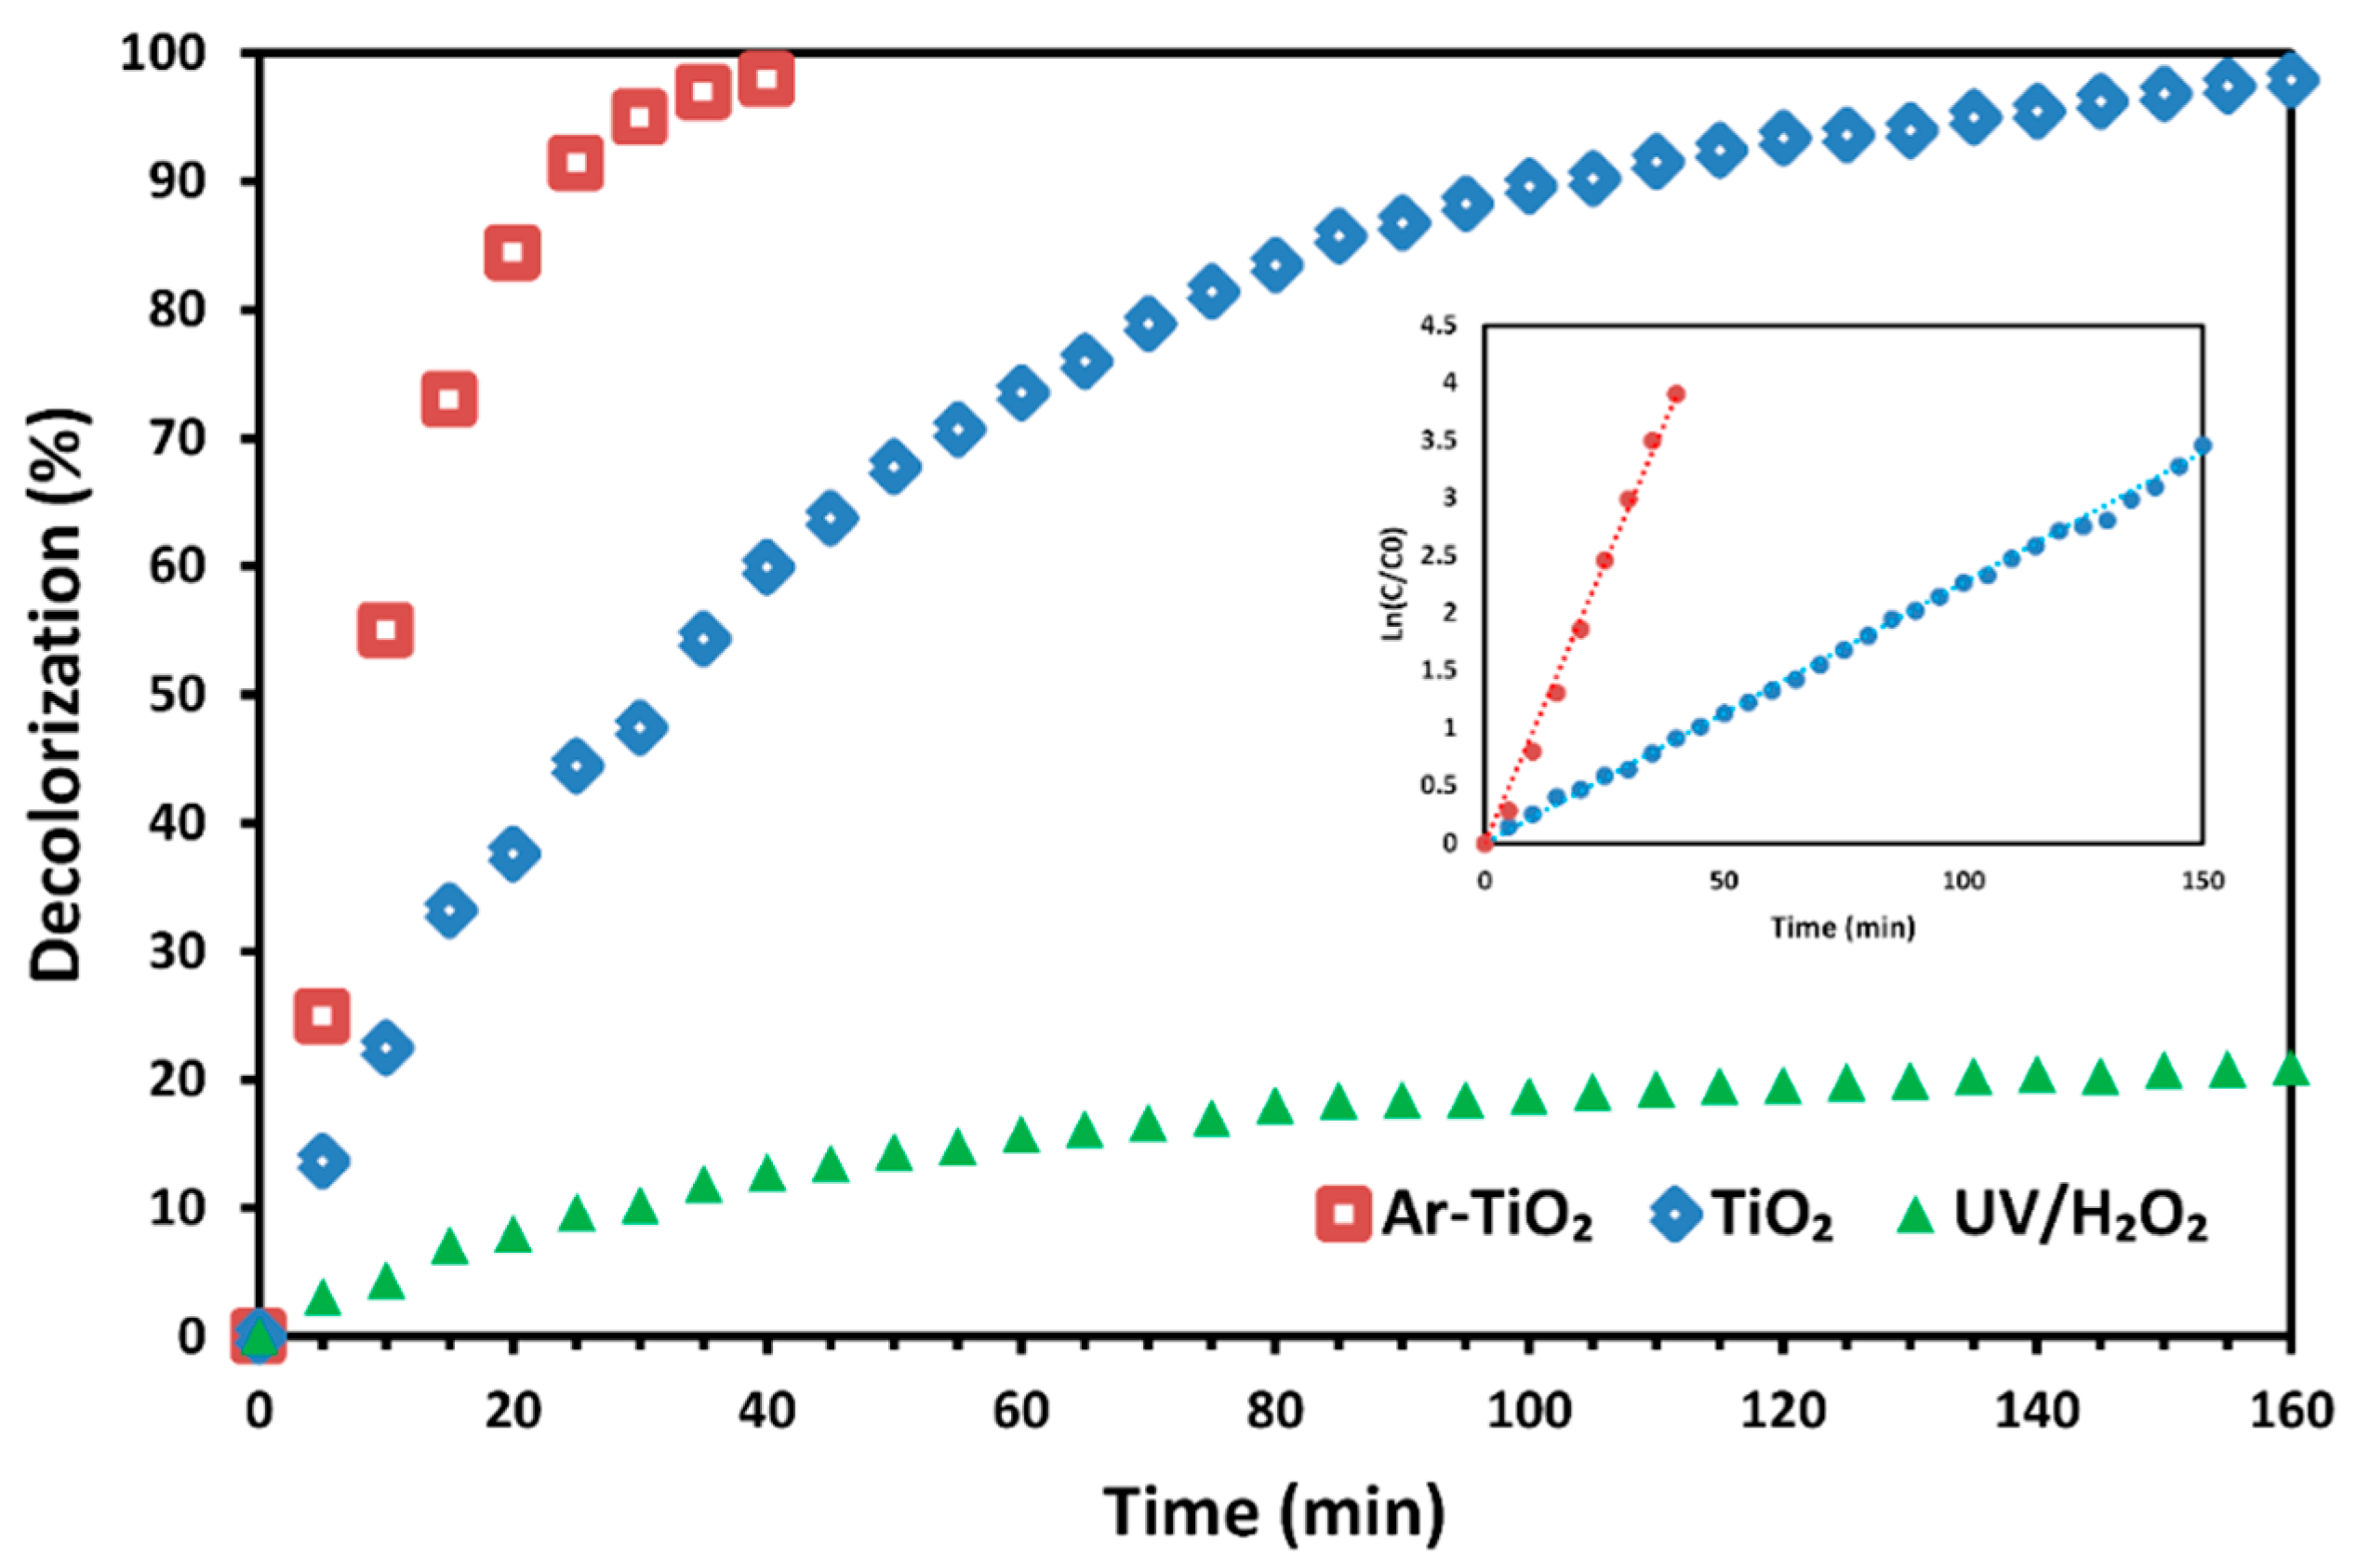
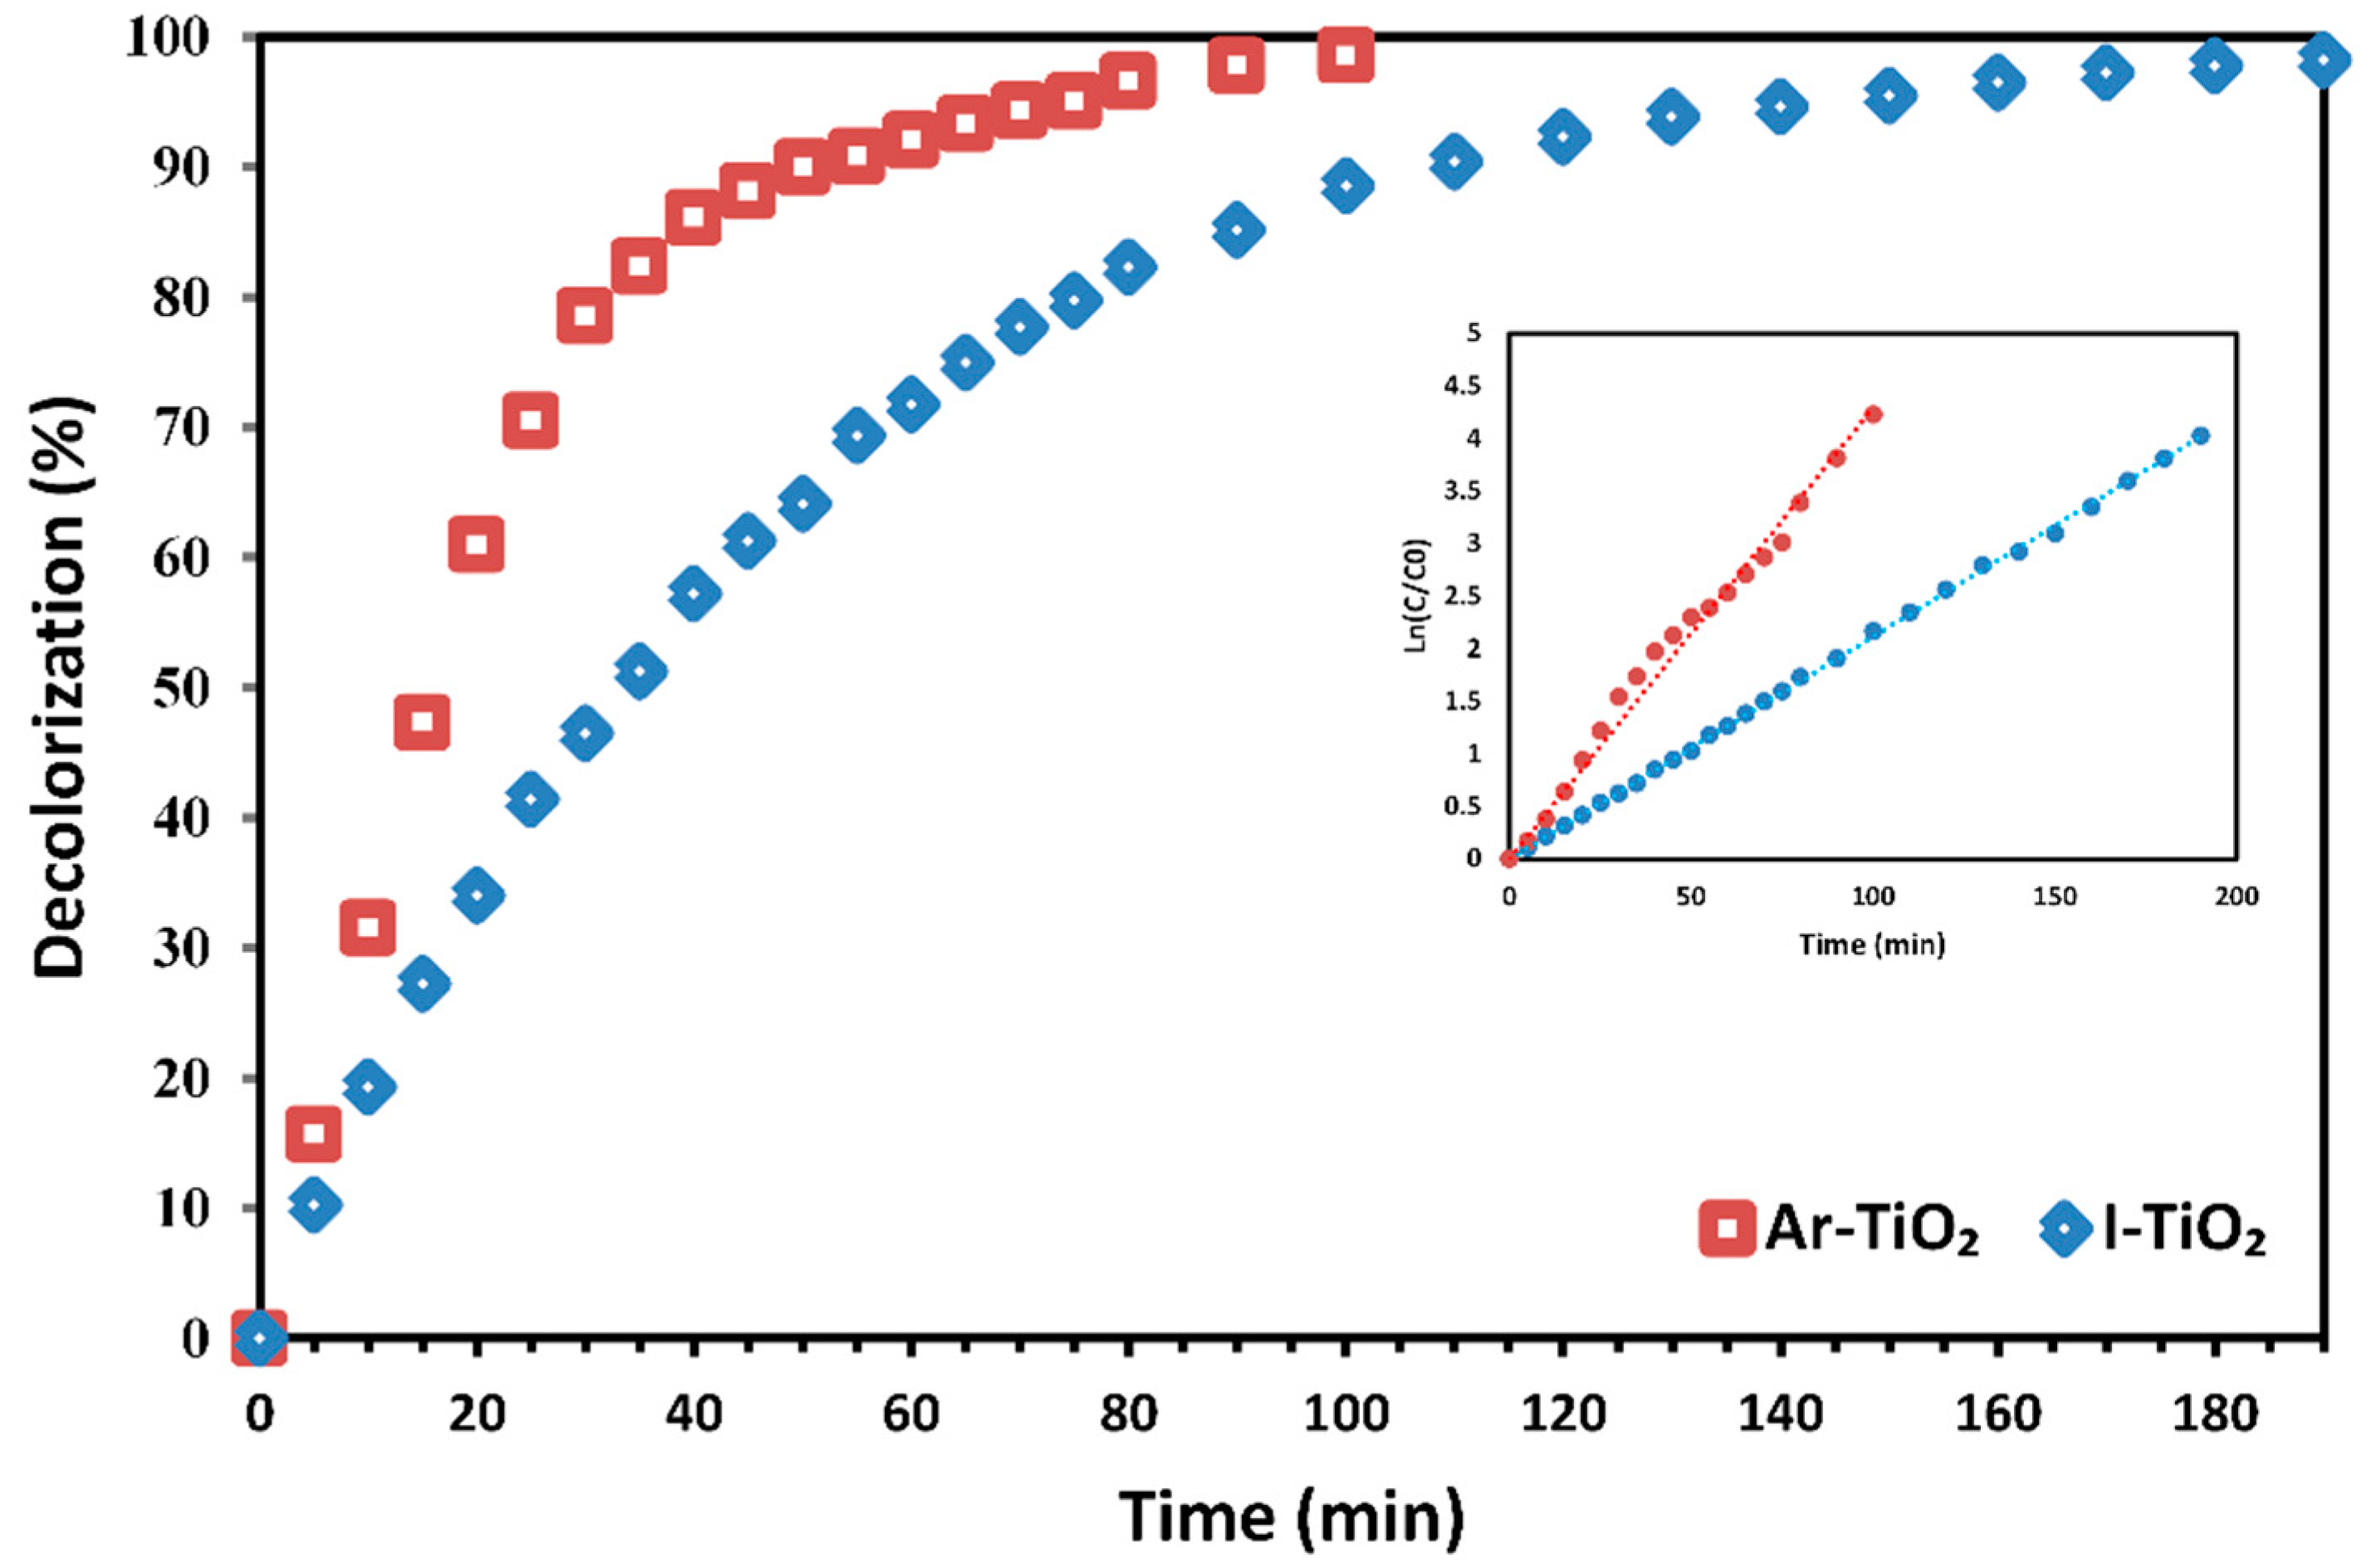
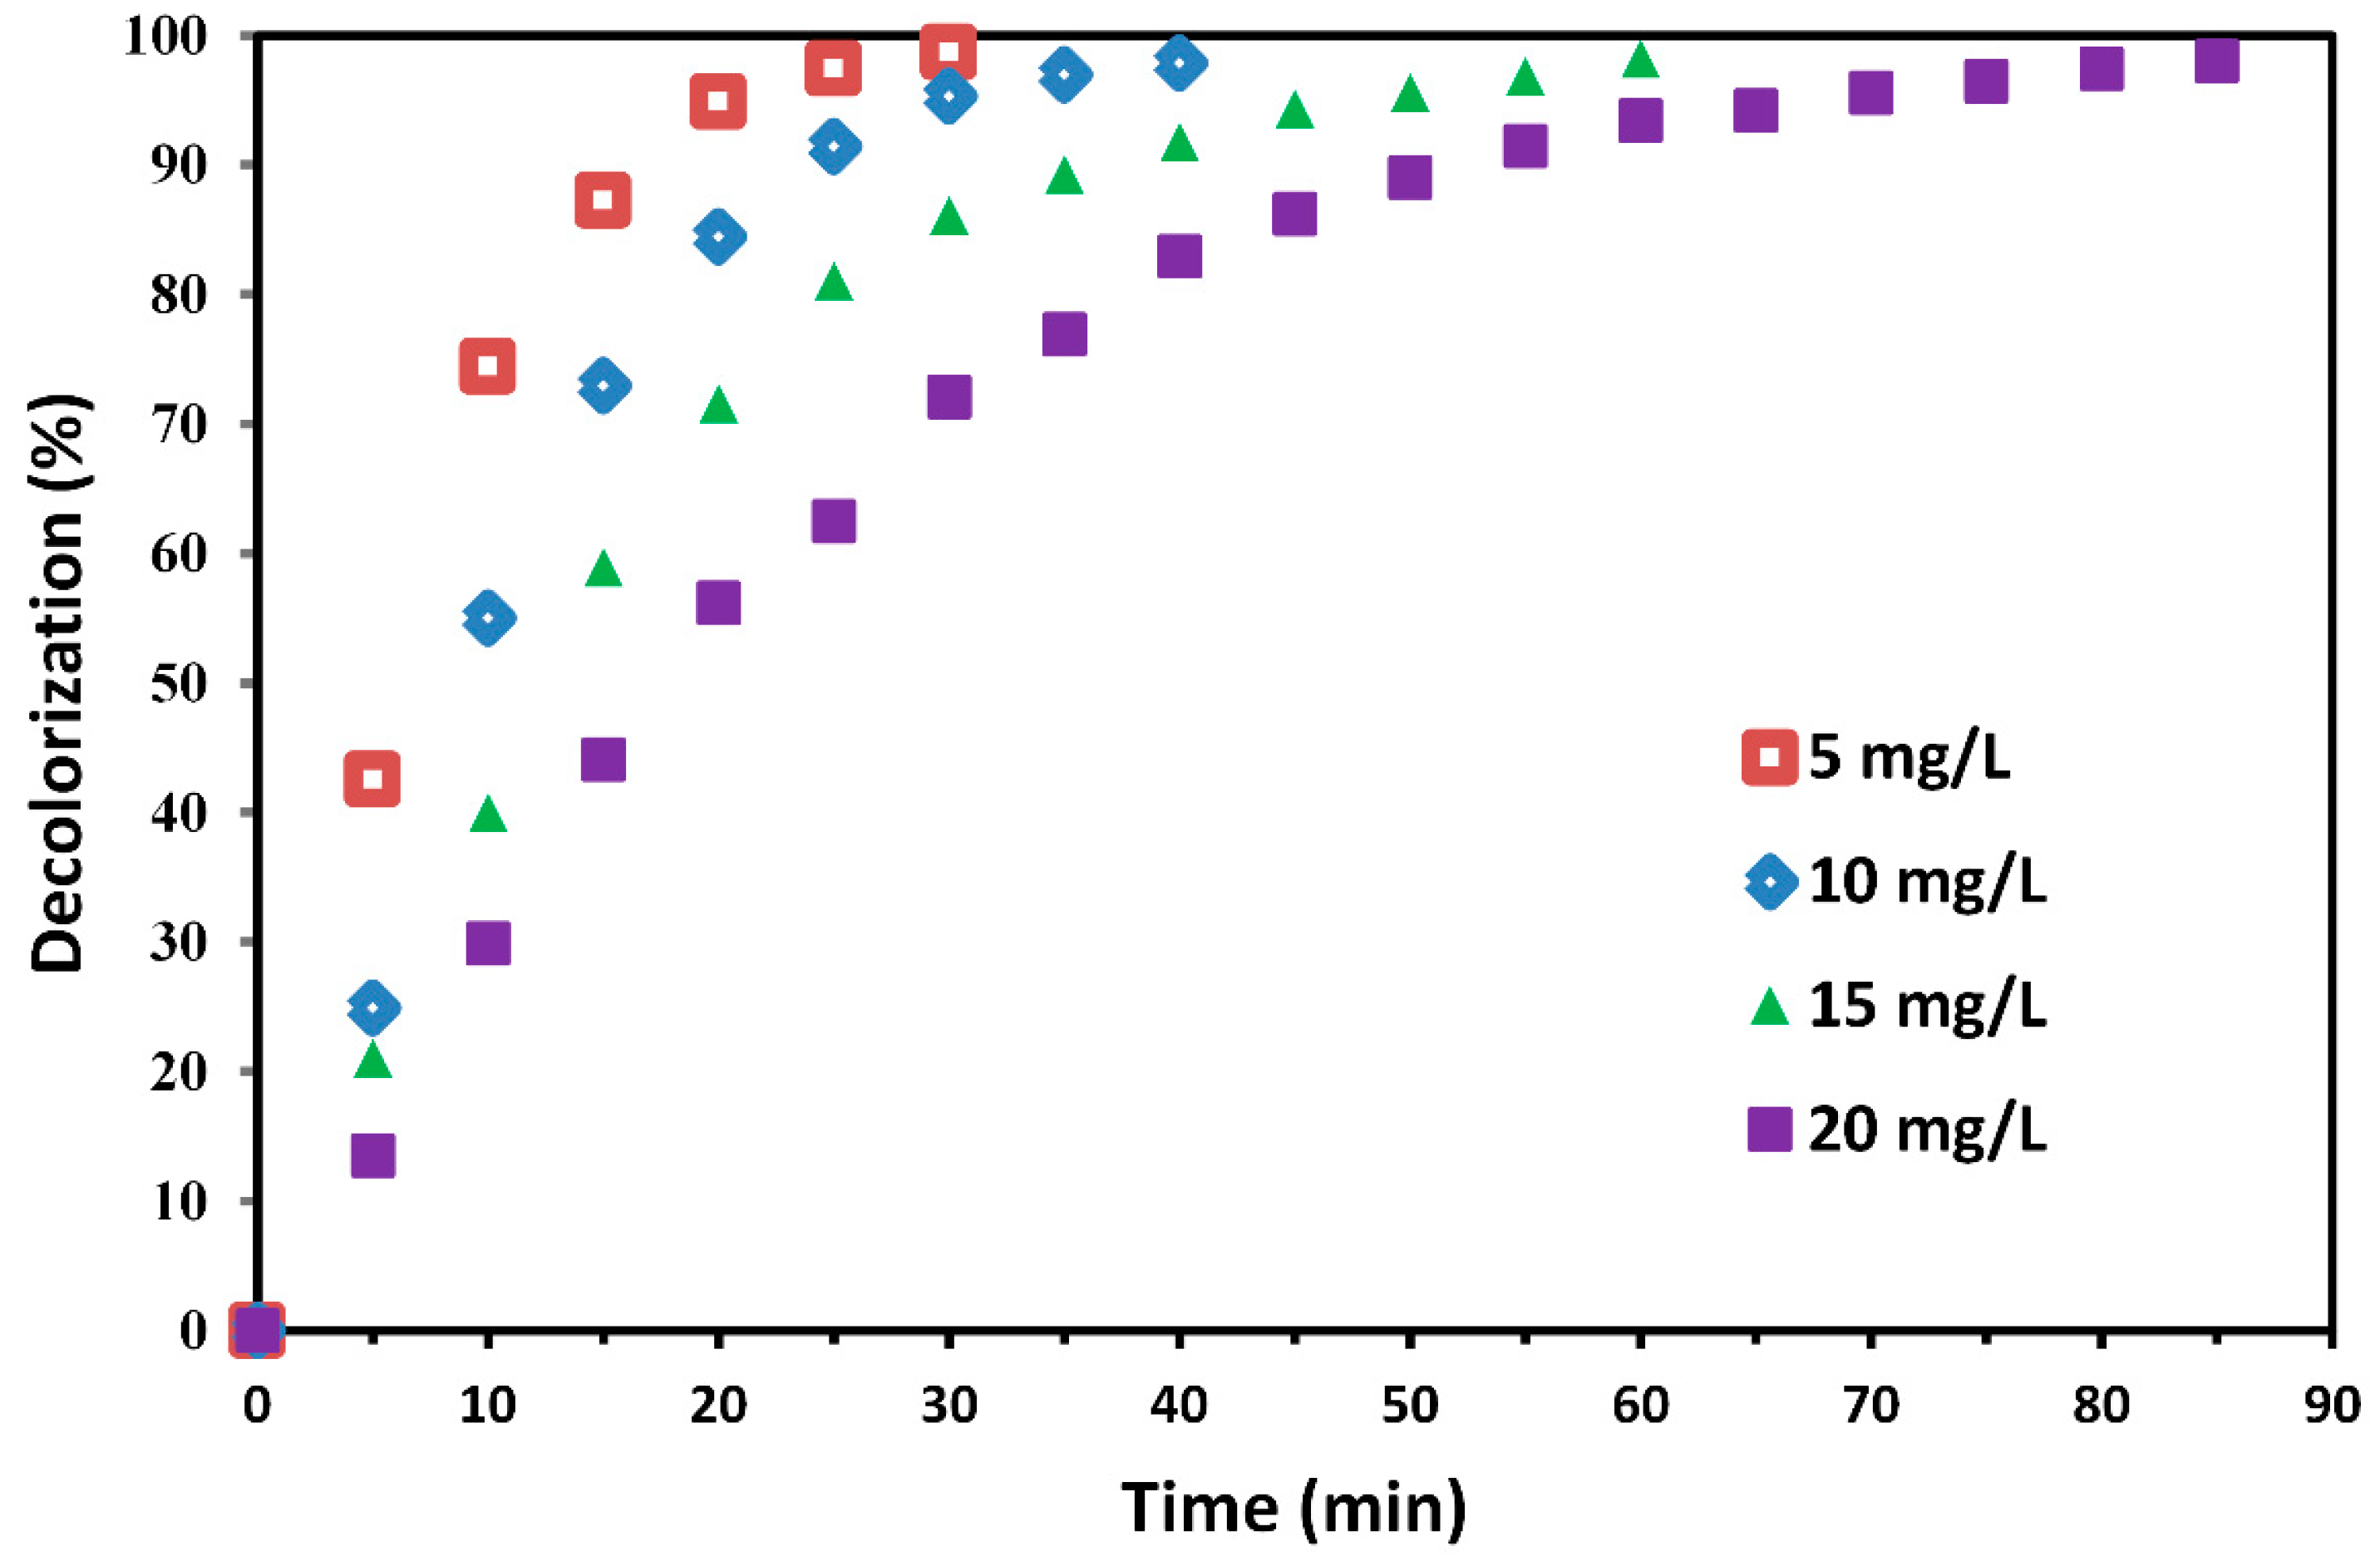
2.3. Decolorization Efficiency of Treated Catalyst vs. Non-Treated Catalyst
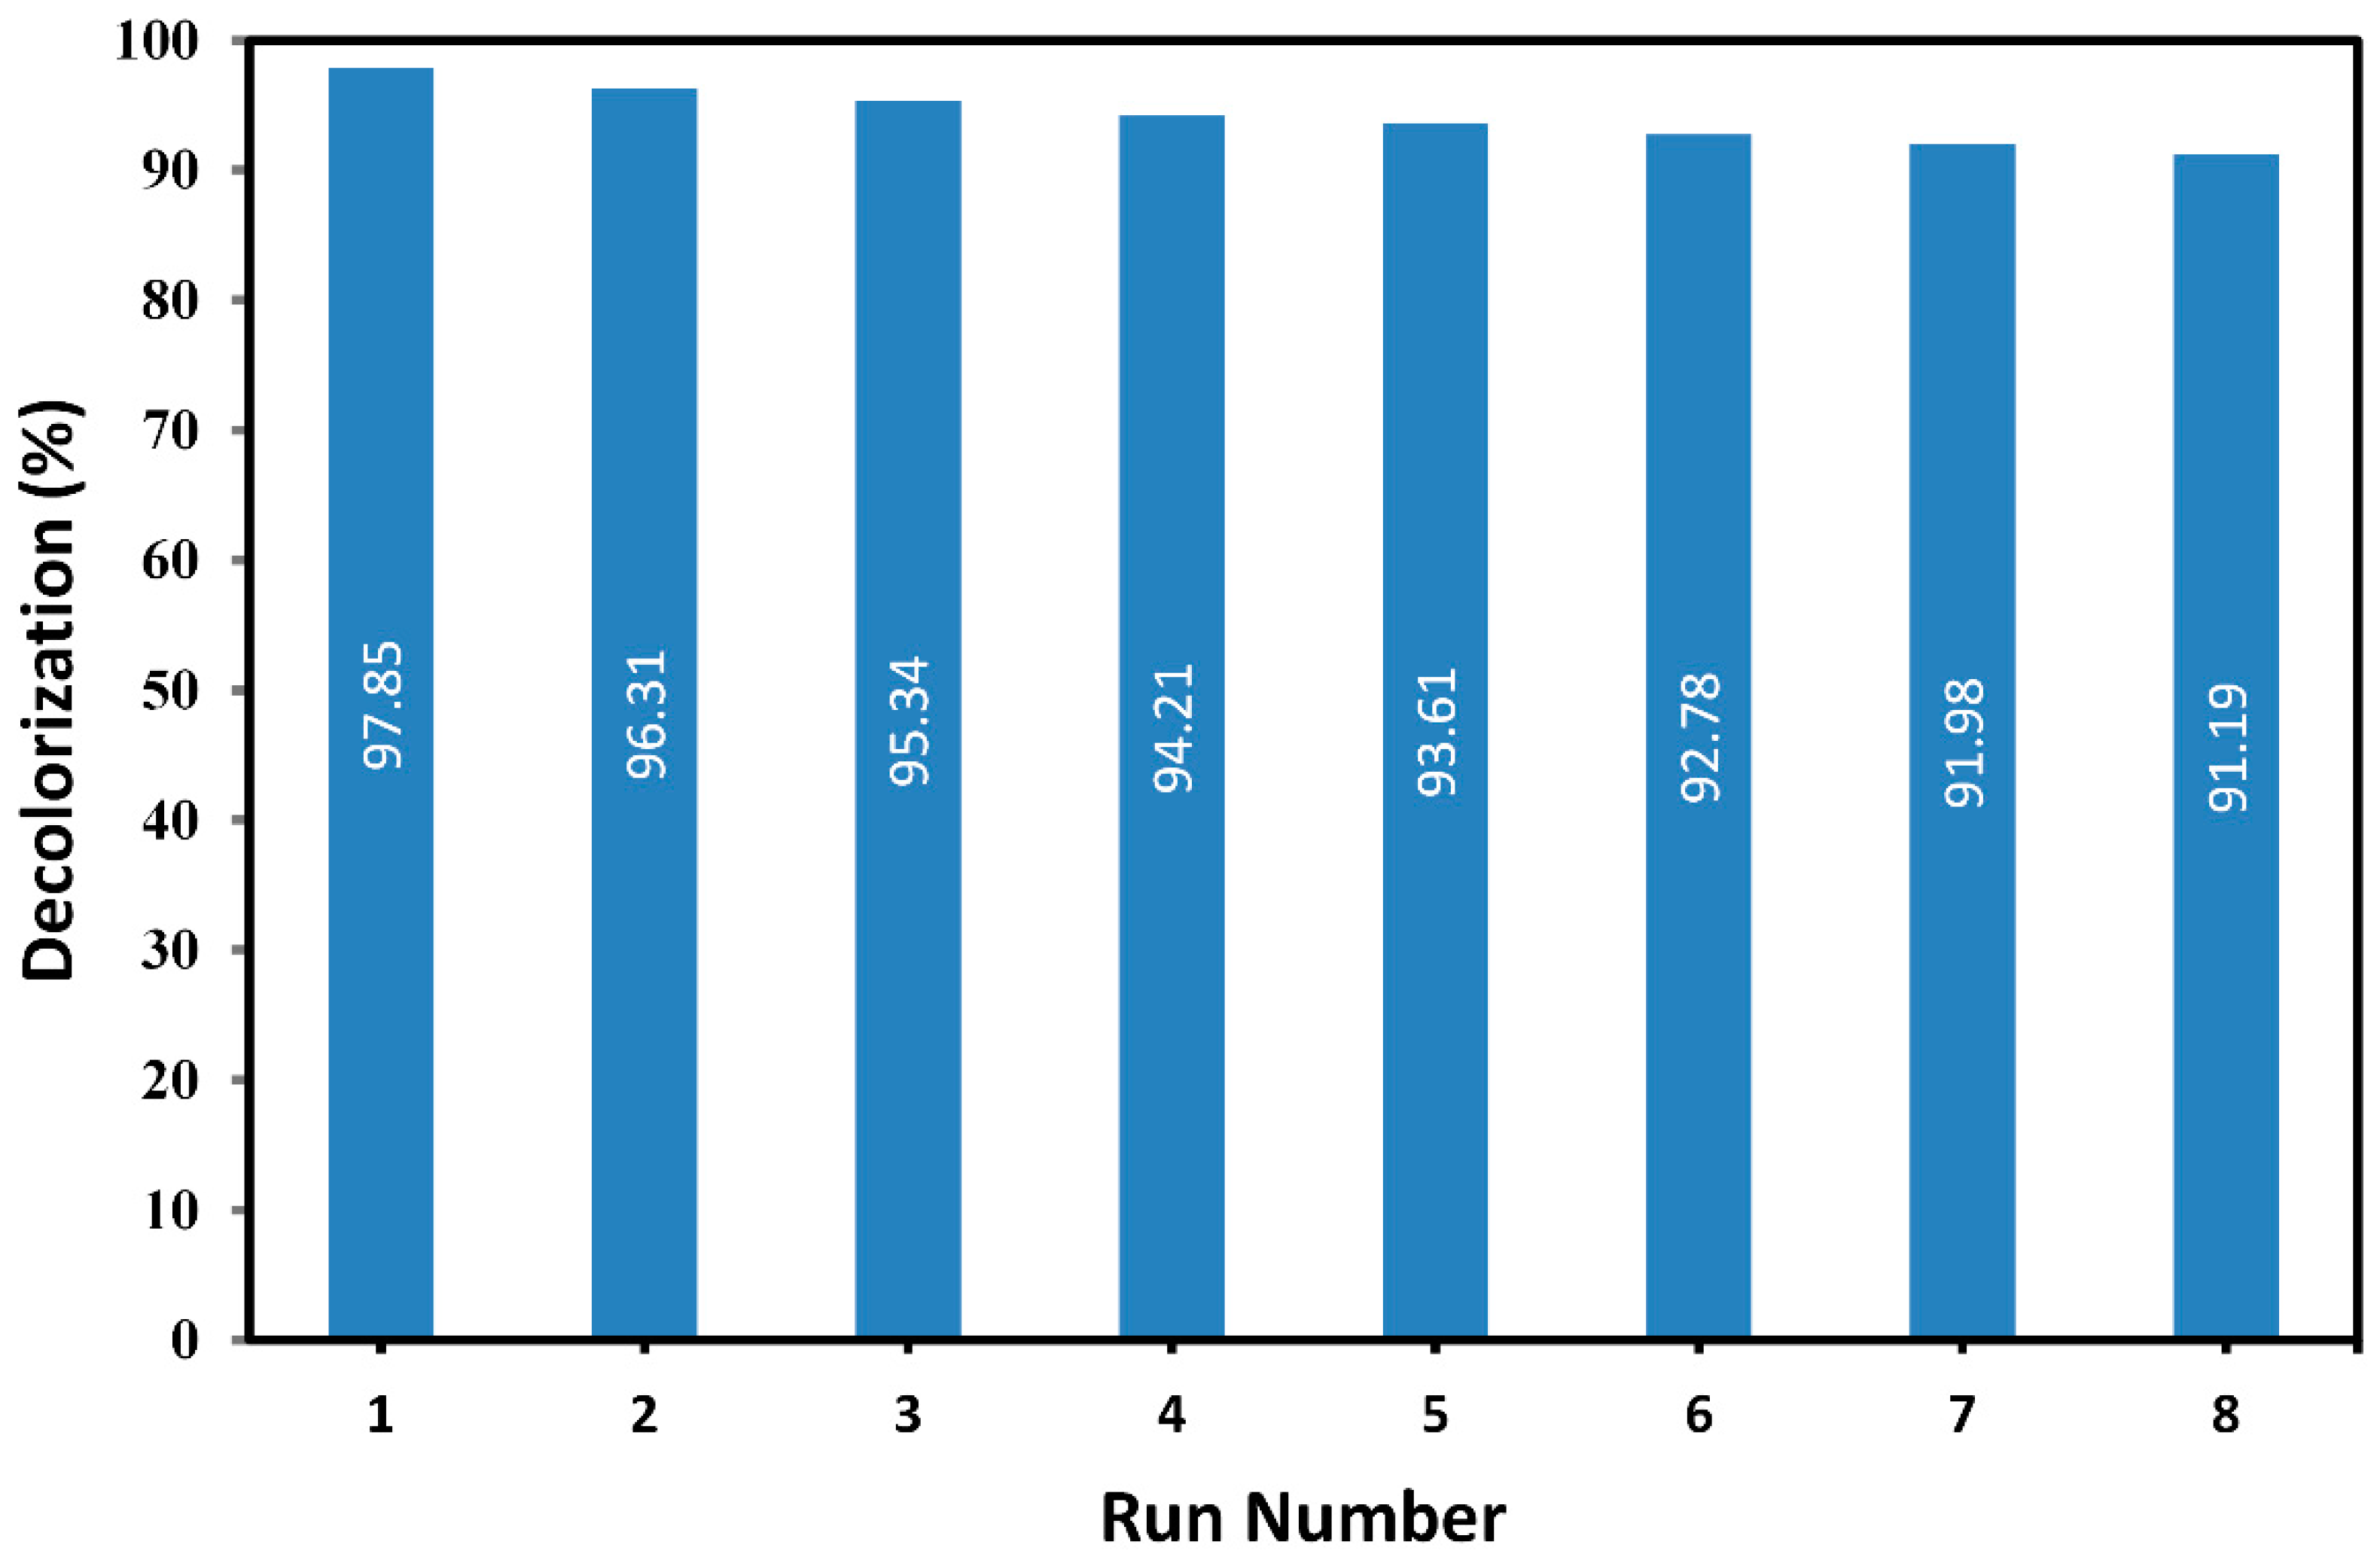
2.4. Reusability of Plasma-Modified Catalyst
3. Materials and Methods
3.1. Materials
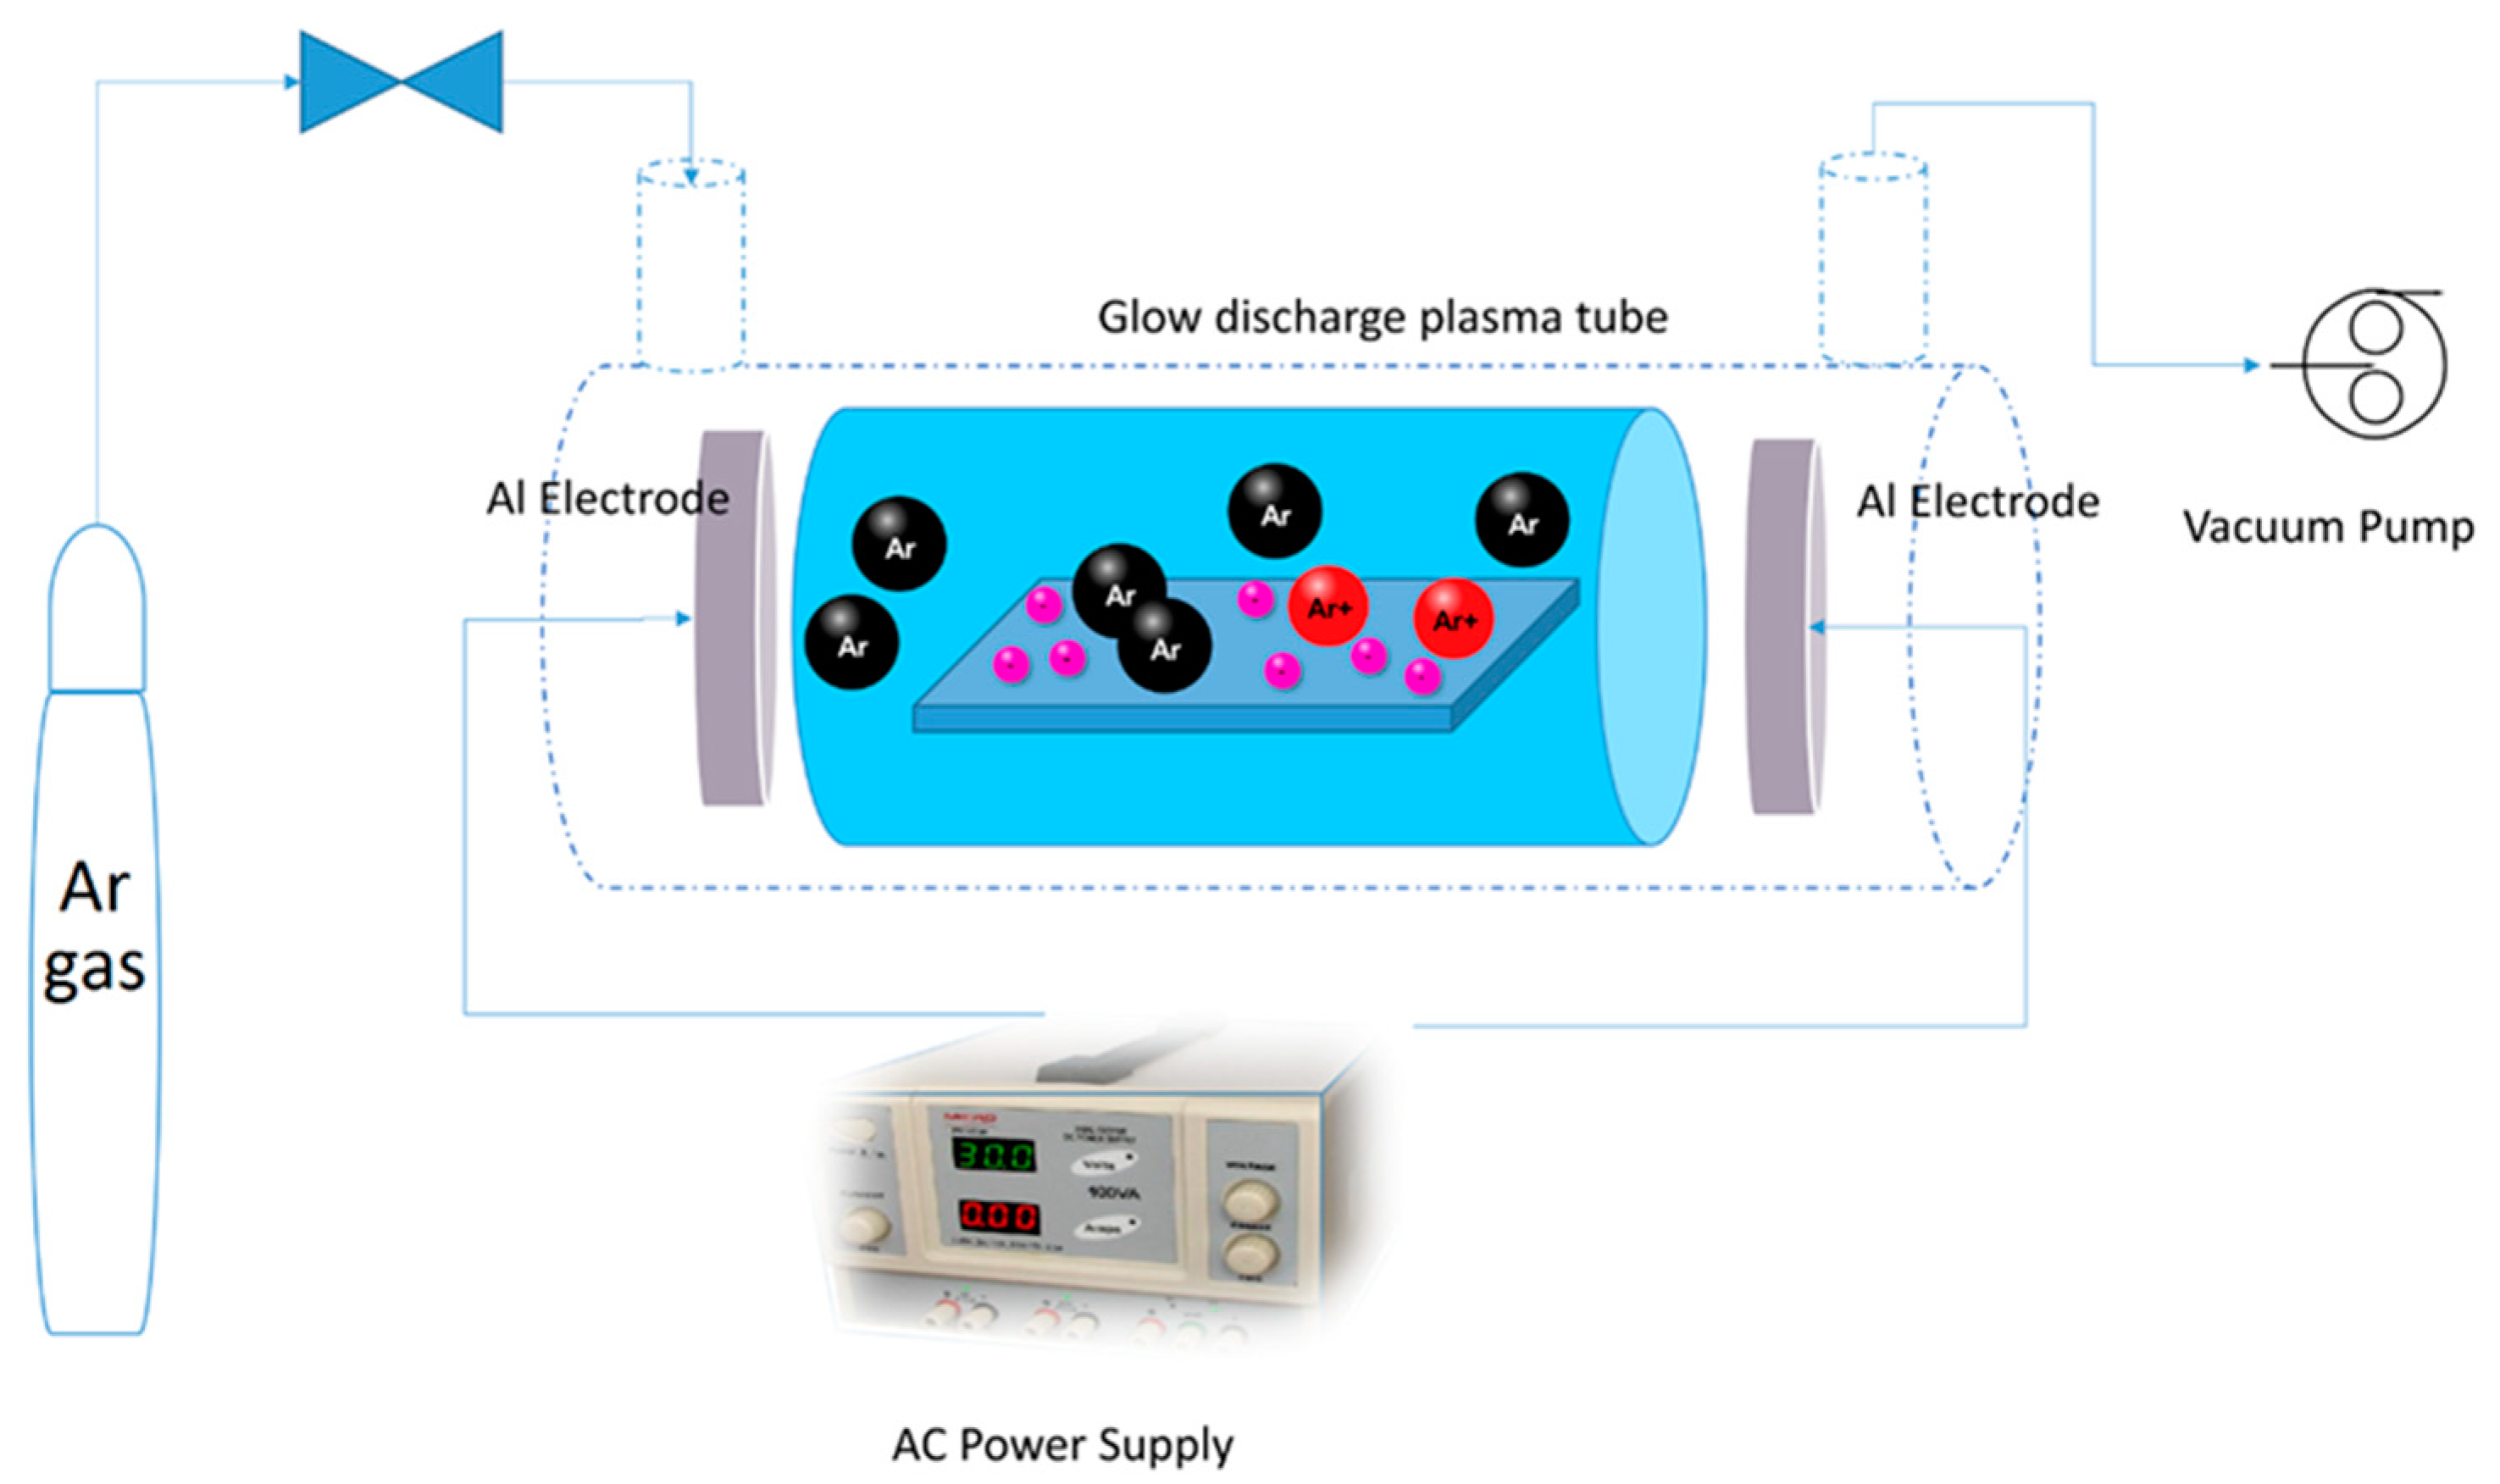
3.2. Apparatus
3.3. Immobilization of TiO2 and Plasma Treatment
3.4. Photocatalytic Batch Reactor
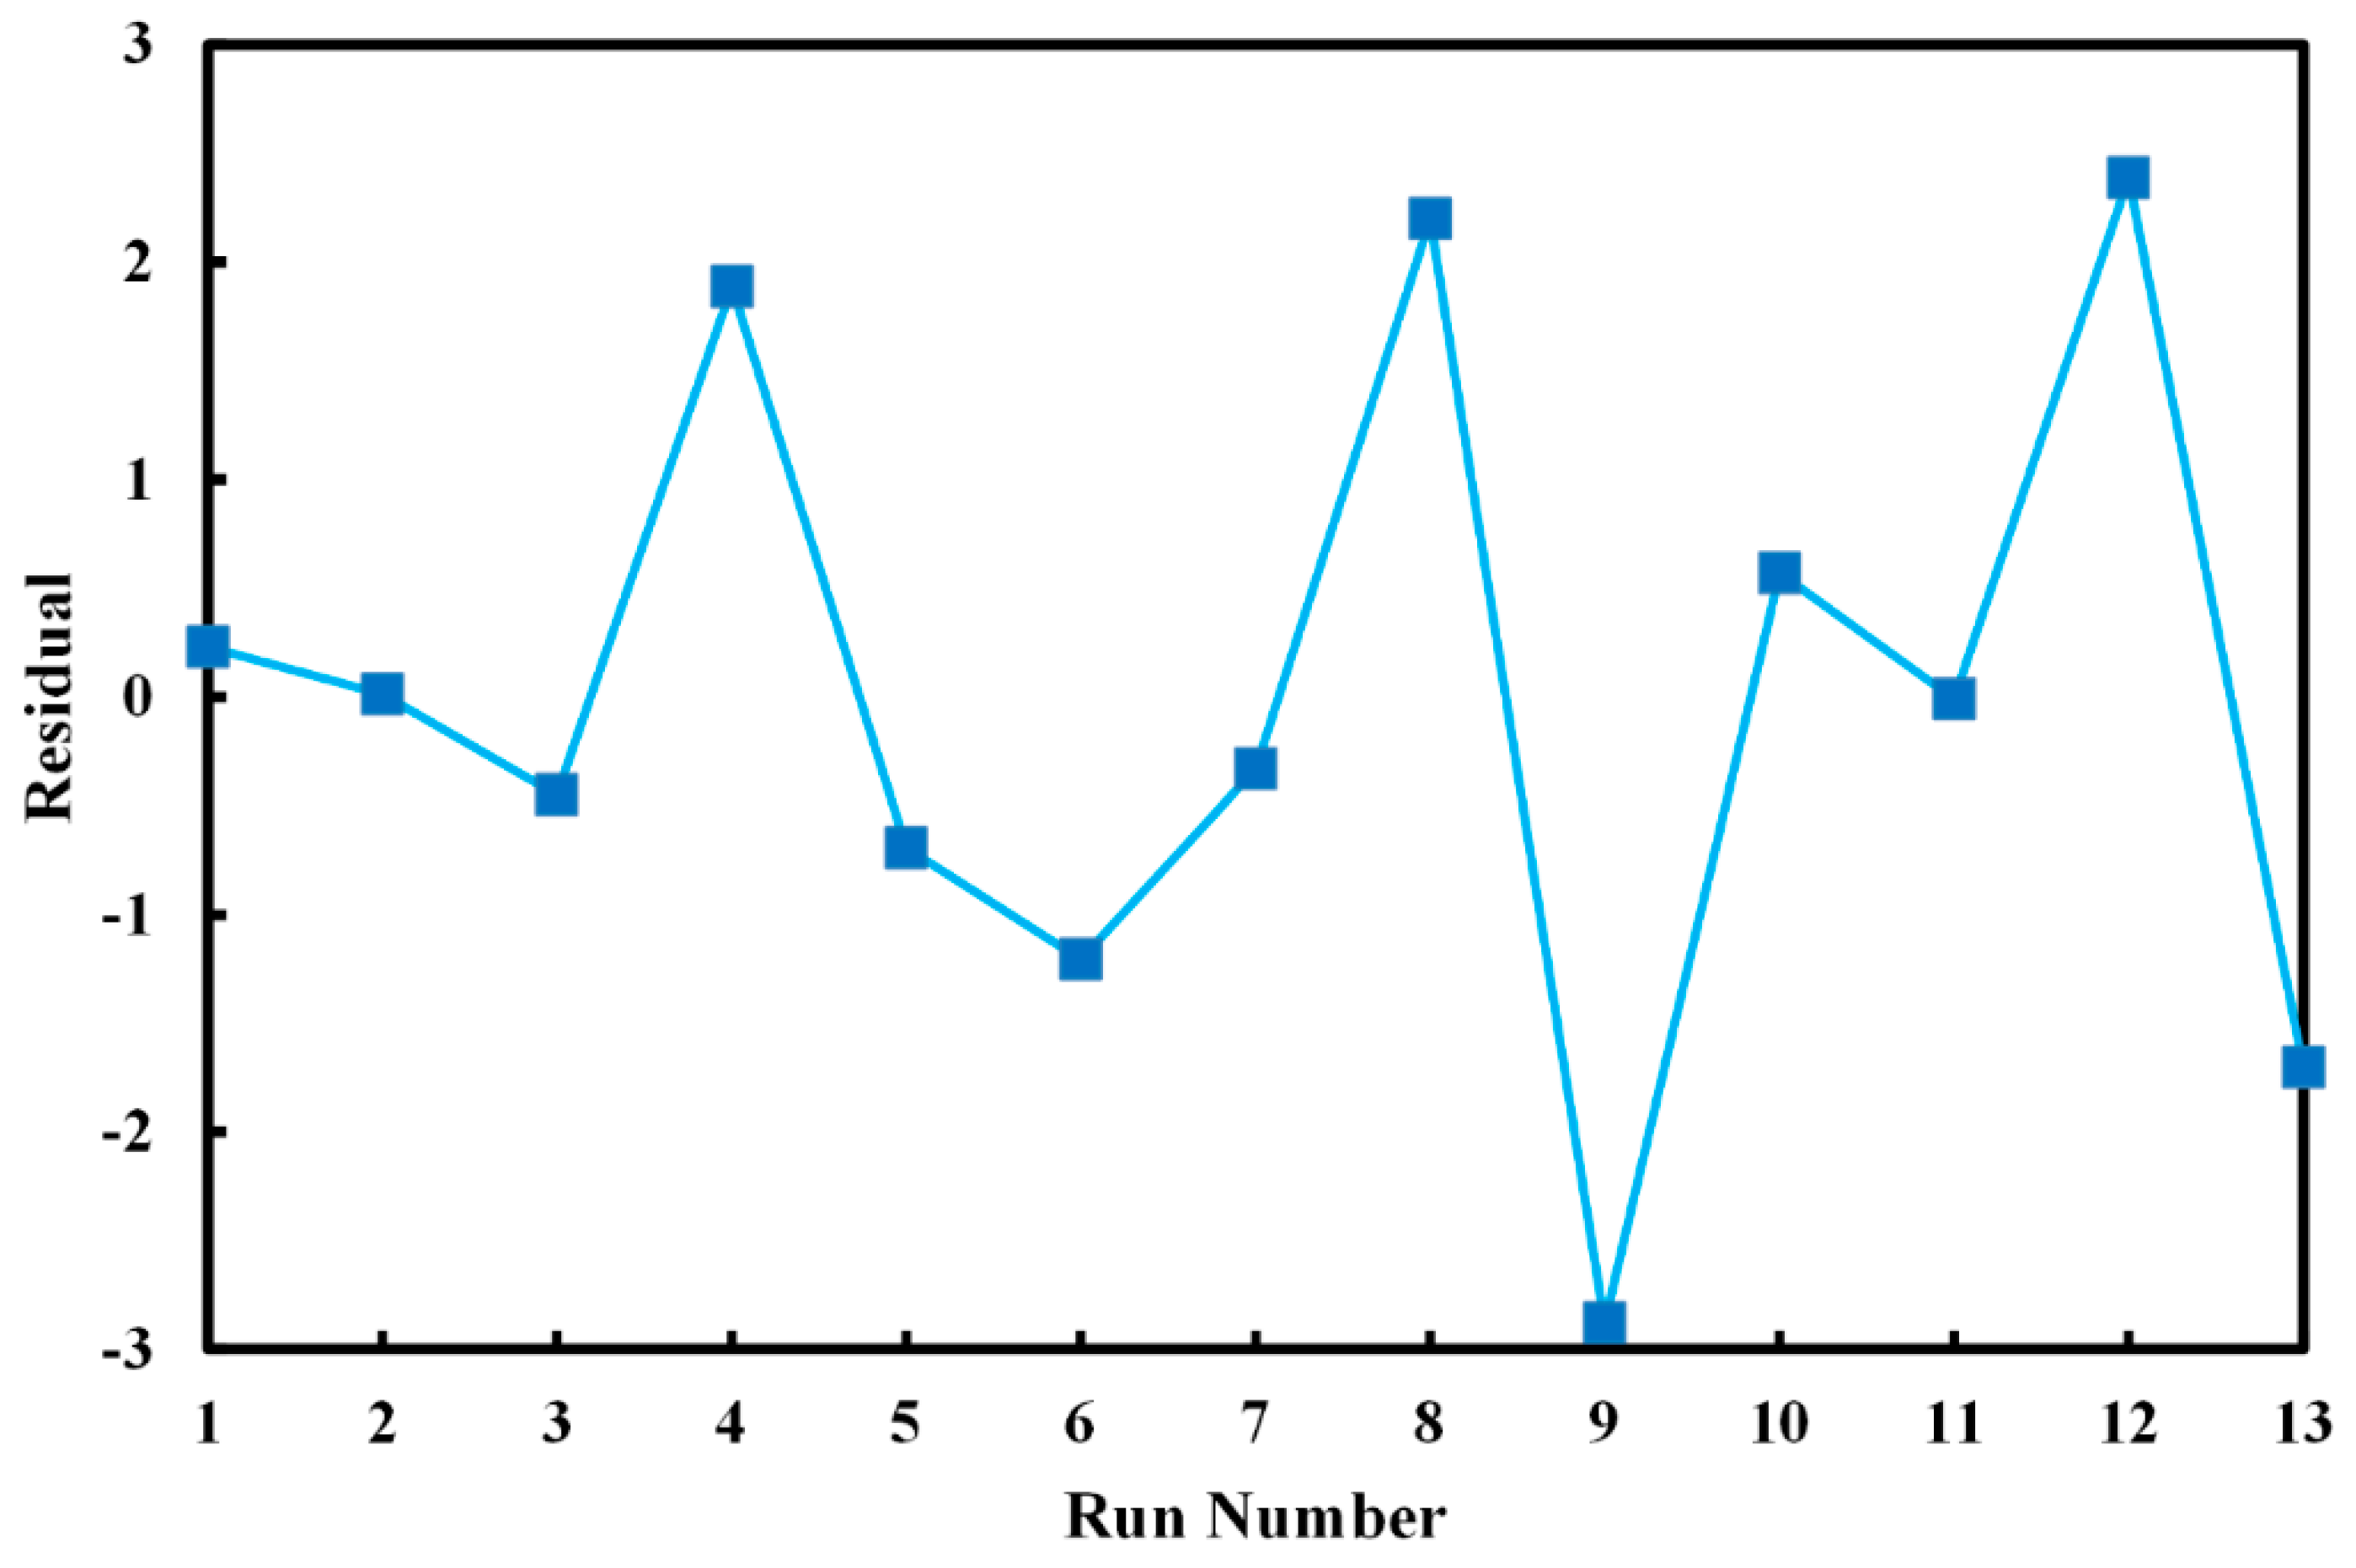
3.5. Response Surface Methodology and Experimental Design
4. Conclusions
Author Contributions
Acknowledgments
Conflicts of Interest
References
- Baghdadi, M.; Alipour Soltani, B.; Nourani, M. Malachite green removal from aqueous solutions using fibrous cellulose sulfate prepared from medical cotton waste: Comprehensive batch and column studies. J. Ind. Eng. Chem. 2017, 55, 128–139. [Google Scholar] [CrossRef]
- Zolfaghari, P.; Shojaat, R.; Karimi, A.; Saadatjoo, N. Application of fluidized bed reactor containing GOx/MnFe2O4/calcium alginate nano-composite in degradation of a model pollutant. J. Environ. Chem. Eng. 2018, 6, 6414–6420. [Google Scholar] [CrossRef]
- Zolfaghari, P.; Aghbolaghy, M.; Karimi, A.; Khataee, A. Continuous degradation of an organic pollutant using heterogeneous magnetic biocatalyst and CFD analysis of the process. Process Saf. Environ. Prot. 2019, 121, 338–348. [Google Scholar] [CrossRef]
- Elhami, V.; Karimi, A.; Aghbolaghy, M. Preparation of heterogeneous bio-Fenton catalyst for decolorization of Malachite Green. J. Taiwan Inst. Chem. Eng. 2015, 56, 154–159. [Google Scholar] [CrossRef]
- Arimi, M.M. Integration of Fenton with biological and physical–chemical methods in the treatment of complex effluents: A review. Environ. Technol. Rev. 2017, 6, 156–173. [Google Scholar] [CrossRef]
- Khataee, A.R.; Fathinia, M.; Aber, S. Kinetic study of photocatalytic decolorization of C.I. Basic Blue 3 solution on immobilized titanium dioxide nanoparticles. Chem. Eng. Res. Des. 2011, 89, 2110–2116. [Google Scholar] [CrossRef]
- Montalvo-Romero, C.; Aguilar-Ucán, C.; Alcocer-Dela hoz, R.; Ramirez-Elias, M.; Cordova-Quiroz, V. A Semi-Pilot Photocatalytic Rotating Reactor (RFR) with Supported TiO2/Ag Catalysts for Water Treatment. Molecules 2018, 23, 224. [Google Scholar] [CrossRef] [PubMed]
- Yaparatne, S.; Tripp, C.P.; Amirbahman, A. Photodegradation of taste and odor compounds in water in the presence of immobilized TiO2-SiO2 photocatalysts. J. Hazard. Mater. 2018, 346, 208–217. [Google Scholar] [CrossRef] [PubMed]
- Karimi, A.; Aghbolaghy, M.; Khataee, A.; Shoa Bargh, S. Use of Enzymatic Bio-Fenton as a New Approach in Decolorization of Malachite Green. Sci. World J. 2012, 2012, 691569–691574. [Google Scholar] [CrossRef] [PubMed]
- Bendjabeur, S.; Zouaghi, R.; Kaabeche, O.; Sehili, T. Parameters Affecting Adsorption and Photocatalytic Degradation Behavior of Gentian Violet under UV Irradiation with Several Kinds of TiO2 as a Photocatalyst. Int. J. Chem. React. Eng. 2017, 15, 1–15. [Google Scholar] [CrossRef]
- Rott, E.; Kuch, B.; Lange, C.; Richter, P.; Kugele, A.; Minke, R. Removal of Emerging Contaminants and Estrogenic Activity from Wastewater Treatment Plant Effluent with UV/Chlorine and UV/H2O2 Advanced Oxidation Treatment at Pilot Scale. Int. J. Environ. Res. Public Health 2018, 15, 935. [Google Scholar] [CrossRef] [PubMed]
- Shuang, S.; Zhang, Z. The Effect of Annealing Treatment and Atom Layer Deposition to Au/Pt Nanoparticles-Decorated TiO2 Nanorods as Photocatalysts. Molecules 2018, 23, 525. [Google Scholar] [CrossRef] [PubMed]
- Kim, H.-i.; Kim, J.; Kim, W.; Choi, W. Enhanced Photocatalytic and Photoelectrochemical Activity in the Ternary Hybrid of CdS/TiO2/WO3 through the Cascadal Electron Transfer. J. Phys. Chem. C 2011, 115, 9797–9805. [Google Scholar] [CrossRef]
- Ratanatawanate, C.; Tao, Y.; Balkus, K.J. Photocatalytic Activity of PbS Quantum Dot/TiO2 Nanotube Composites. J. Phys. Chem. C 2009, 113, 10755–10760. [Google Scholar] [CrossRef]
- Lee, S.-Y.; Park, S.-J. TiO2 photocatalyst for water treatment applications. J. Ind. Eng. Chem. 2013, 19, 1761–1769. [Google Scholar] [CrossRef]
- Sayılkan, F.; Asiltürk, M.; Tatar, P.; Kiraz, N.; Şener, S.; Arpac, E.; Sayılkan, H. Photocatalytic performance of Sn-doped TiO2 nanostructured thin films for photocatalytic degradation of malachite green dye under UV and VIS-lights. Mater. Res. Bull. 2008, 43, 127–134. [Google Scholar] [CrossRef]
- Asiltürka, M.; Sayılkana, F.; Arpac, E. Effect of Fe3+ ion doping to TiO2 on the photocatalytic degradation of Malachite Green dye under UV and vis-irradiation. J. Photochem. Photobiol. A Chem. 2009, 203, 64–71. [Google Scholar] [CrossRef]
- Rajabi, H.R.; Khani, O.; Shamsipur, M.; Vatanpour, V. High-performance pure and Fe3+-ion doped ZnS quantum dots as green nanophotocatalysts for the removal of malachite green under UV-light irradiation. J. Hazard. Mater. 2013, 250–251, 370–378. [Google Scholar] [CrossRef]
- Kaneva, N.; Stambolova, I.; Blaskov, V.; Dimitriev, Y.; Vassilev, S.; Dushkin, C. Photocatalytic activity of nanostructured ZnO films prepared by two different methods for the photoinitiated decolorization of malachite green. J. Alloys Compd. 2010, 500, 252–258. [Google Scholar] [CrossRef]
- Ameen, S.; Shaheer Akhtar, M.; Nazim, M.; Shin, H.-S. Rapid photocatalytic degradation of crystal violet dye over ZnO flower nanomaterials. Mater. Lett. 2013, 96, 228–232. [Google Scholar] [CrossRef]
- Chen, C.-C.; Mai, F.-D.; Chen, K.-T.; Wu, C.-W.; Lu, C.-S. Photocatalyzed N-de-methylation and degradation of crystal violet in titania dispersions under UV irradiation. Dyes Pigments 2007, 75, 434–442. [Google Scholar] [CrossRef]
- Li, W.; Bak, T.; Atanacio, A.; Nowotny, J. Photocatalytic properties of TiO2: Effect of niobium and oxygen activity on partial water oxidation. Appl. Catal. B 2016, 198, 243–253. [Google Scholar] [CrossRef]
- Jung, C.-K.; Bae, I.-S.; Song, Y.-H.; Boo, J.-H. Plasma surface modification of TiO2 photocatalysts for improvement of catalytic efficiency. Surf. Coat. Technol. 2005, 200, 1320–1324. [Google Scholar] [CrossRef]
- An, H.-R.; Park, S.Y.; Kim, H.; Lee, C.Y.; Choi, S.; Lee, S.C.; Seo, S.; Park, E.C.; Oh, Y.-K.; Song, C.-G.; et al. Advanced nanoporous TiO2 photocatalysts by hydrogen plasma for efficient solar-light photocatalytic application. Sci. Rep. 2016, 6, 29683–29691. [Google Scholar] [CrossRef] [PubMed]
- Khataee, A.; Rad, T.S.; Vahid, B.; Khorram, S. Preparation of zeolite nanorods by corona discharge plasma for degradation of phenazopyridine by heterogeneous sono-Fenton-like process. Ultrason. Sonochem. 2016, 33, 37–46. [Google Scholar] [CrossRef] [PubMed]
- Dastan, D. Effect of preparation methods on the properties of titania nanoparticles: Solvothermal versus sol-gel. Appl. Phys. A 2017, 123, 699–711. [Google Scholar] [CrossRef]
- Dastan, D.; Chaure, N.; Kartha, M. Surfactants assisted solvothermal derived titania nanoparticles: Synthesis and simulation. J. Mater. Sci. Mater. Electron. 2017, 28, 7784–7796. [Google Scholar] [CrossRef]
- Attri, P.; Arora, B.; Choi, E.H. Retracted Article: Utility of plasma: A new road from physics to chemistry. RSC Adv. 2013, 3, 12540–12567. [Google Scholar] [CrossRef]
- Yavuz, Ö.; Saka, C. Surface modification with cold plasma application on kaolin and its effects on the adsorption of methylene blue. Appl. Clay Sci. 2013, 85, 96–102. [Google Scholar] [CrossRef]
- Zhou, R.; Zhou, R.; Zhang, X.; Li, J.; Wang, X.; Chen, Q.; Yang, S.; Chen, Z.; Bazaka, K.; Ostrikov, K.K. Synergistic Effect of Atmospheric pressure Plasma and TiO2 Photocatalysis on Inactivation of Escherichia coliCells in Aqueous Media. Sci. Rep. 2016, 6, 1–10. [Google Scholar] [CrossRef]
- Dastan, D.; Londhe, P.U.; Chaure, N.B. characterization of TiO2 nanoparticles prepared using different surfactants by sol-gel method. J. Mater. Sci: Mater. Electron. 2014, 25, 3473–3479. [Google Scholar] [CrossRef]
- Manolache, S.; Romanescu, C.; Cobileac, G.; Simionescu, C. Some Terpenes and Related Derivatives Synthesized in Cold Plasma Systems. Molecules 1997, 2, 158–164. [Google Scholar] [CrossRef] [Green Version]
- Castro Vidaurre, E.F.; Achete, C.A.; Gallo, F.; Garcia, D.; Simão, R.; Habert, A.C. Surface Modification of Polymeric Materials by Plasma Treatment. Mater. Res. 2002, 5, 37–41. [Google Scholar] [CrossRef] [Green Version]
- Quitzau, M.; Wolter, M.; Kersten, H. Plasma Treatment of Polyethylene Powder Particles in a Hollow Cathode Glow Discharge. Plasma Process. Polym. 2009, 6, s392–s396. [Google Scholar] [CrossRef]
- Popelka, A.; Novák, I.; Lehocký, M.; Chodák, I.; Sedliačik, J.; Gajtanska, M.; Sedliačiková, M.; Vesel, A.; Junkar, I.; Kleinová, A.; et al. Anti-bacterial Treatment of Polyethylene by Cold Plasma for Medical Purposes. Molecules 2012, 17, 762–785. [Google Scholar] [CrossRef] [PubMed] [Green Version]
- Ma, Y.; Manolache, S.; Denes, F.; Cho, J.; Timmons, R. Surface Modification of Rutile TiO2 by Submerged Arc Discharge for mproved Photoreactivity. J. Mater. Eng. Perform. 2006, 15, 370–375. [Google Scholar] [CrossRef]
- Yang, Y.; Zhang, T.; Le, L.; Ruan, X.; Fang, P.; Pan, C.; Xiong, R.; Shi, J.; Wei, J. Quick and Facile Preparation of Visible light-Driven TiO2 Photocatalyst with High Absorption and Photocatalytic Activity. Sci. Rep. 2014, 4, 7045–7052. [Google Scholar] [CrossRef]
- Shoaebargh, S.; Karimi, A. RSM modeling and optimization of glucose oxidase immobilization on TiO2/polyurethane: Feasibility study of AO7 decolorization. J. Environ. Chem. Eng. 2014, 2, 1741–1747. [Google Scholar] [CrossRef]
- Zeng, Z.; Zou, H.; Li, X.; Sun, B.; Chen, J.; Shao, L. Ozonation of acidic phenol wastewater with O3/Fe(II) in a rotating packed bed reactor: Optimization by response surface methodology. Chem. Eng. Process. Process Intensif. 2012, 60, 1–8. [Google Scholar] [CrossRef]
- Ozbay, N.; Yargic, A.S. Factorial experimental design for Remazol Yellow dye sorption using apple pulp/apple pulp carbon–titanium dioxide co-sorbent. J. Clean. Prod. 2015, 100, 333–343. [Google Scholar] [CrossRef]
- Devi, L.G.; Nithya, P.M.; Abraham, C.; Kavitha, R. Influence of surface metallic silver deposit and surface fluorination on the photocatalytic activity of rutile TiO2 for the degradation of crystal violet a cationic dye under UV light irradiation. Mater. Today Commun. 2017, 10, 1–13. [Google Scholar] [CrossRef]
- Tao, T.; Chen, Y.; Zhou, D.; Zhang, H.; Liu, S.; Amal, R.; Sharma, N.; Glushenkov, A.M. Expanding the applications of the ilmenite mineral to the preparation of nanostructures: TiO2 nanorods and their photocatalytic properties in the degradation of oxalic acid. Chemistry 2013, 19, 1091–1097. [Google Scholar] [CrossRef] [PubMed]
- Tang, S.; Choi, H.S. Comparison of Low- and Atmospheric-Pressure Radio Frequency Plasma Treatments on the Surface Modification of Poly(methyl methacrylate) Plates. J. Phys. Chem. C 2008, 112, 4712–4718. [Google Scholar] [CrossRef]
- Şahin, Ö.; Kaya, M.; Saka, C. Plasma-surface modification on bentonite clay to improve the performance of adsorption of methylene blue. Appl. Clay Sci. 2015, 116–117, 46–53. [Google Scholar] [CrossRef]
- Bharti, B.; Kumar, S.; Lee, H.-N.; Kumar, R. Formation of oxygen vacancies and Ti3+ state in TiO2 thin film and enhanced optical properties by air plasma treatment. Sci. Rep. 2016, 6, 32355–32367. [Google Scholar] [CrossRef]
- Berger, T.; Sterrer, M.; Diwald, O.; Knözinger, E.; Panayotov, D.; Thompson, T.L.; Yates, J.T. Light-Induced Charge Separation in Anatase TiO2 Particles. J. Phys. Chem. B 2005, 109, 6061–6068. [Google Scholar] [CrossRef]
- Bityurin, N.; Kuznetsov, A.I.; Kanaev, A. Kinetics of UV-induced darkening of titanium-oxide gel. Appl. Surf. Sci. 2005, 248, 86–90. [Google Scholar] [CrossRef]
- Dastan, D.; Panahi, S.L.; Chaure, N.B. Characterization of titania thin films grown by dip coating technique. J. Mater. Sci. Mater. Electron. 2016, 27, 12291–12296. [Google Scholar] [CrossRef]
- Dastan, D. Nanostructured Anatase Titania Thin Films Prepared by Sol-Gel Dip Coating Technique. J. Atom. Mol. Condens. Nano Phys. (JAMCNP) 2015, 2, 109–114. [Google Scholar]
- Dohshi, S.; Anpo, M.; Okuda, S.; Kojima, T. Effect of γ-ray Irradiation on the Wettability of TiO2 Single Crystals. Top. Catal. 2005, 35, 327–330. [Google Scholar] [CrossRef]
- Henrich, V.E.; Kurtz, R.L. Surface electronic structure of TiO2: Atomic geometry, ligand coordination, and the effect of adsorbed hydrogen. Phys. Rev. B 1981, 23, 6280–6287. [Google Scholar] [CrossRef]
- Jun, J.; Dhayal, M.; Shin, J.-H.; Kim, J.-C.; Getoff, N. Surface properties and photoactivity of TiO2 treated with electron beam. Radiat. Phys. Chem. 2006, 75, 583–589. [Google Scholar] [CrossRef]
- Lu, G.; Linsebigler, A.; Yates, J.T. Ti3+ Defect Sites on TiO2(110): Production and Chemical Detection of Active Sites. J. Phys. Chem. 1994, 98, 11733–11738. [Google Scholar] [CrossRef]
- Hassani, A.; Soltani, R.D.C.; Kıranşan, M.; Karaca, S.; Karaca, C.; Khataee, A. Ultrasound-assisted adsorption of textile dyes using modified nanoclay: Central composite design optimization. Korean J. Chem. Eng. 2016, 33, 178–188. [Google Scholar] [CrossRef]
- Fridman, A. Plasma Chemistry; Cambridge University Press: Cambridge, MA, USA, 2008; p. 1022. [Google Scholar]
- Liberman, M.A.; Lichtenberg, A.J. Principles of Plasma Discharges and Materials Processing; John Wiley & Sons, Inc.: Hoboken, NJ, USA, 2005; p. 794. [Google Scholar]
- Jia, Y.; Liu, J.; Cha, S.; Choi, S.; Park, Y.C.; Liu, C. Magnetically separable Au-TiO2/nanocube ZnFe2O4 composite for chlortetracycline removal in wastewater under visible light. J. Ind. Eng. Chem. 2017, 47, 303–314. [Google Scholar] [CrossRef]
- Sakata, K. Study of electronic structure of reduced TiO2 and VxTi1−xO2 crystals by ESCA and optical absorption. Phys. Status Solidi B 1983, 116, 145–153. [Google Scholar] [CrossRef]
- Pan, X.; Yang, M.-Q.; Fu, X.; Zhang, N.; Xu, Y.-J. Defective TiO2 with oxygen vacancies: Synthesis, properties and photocatalytic applications. Nanoscale 2013, 5, 3601–3614. [Google Scholar] [CrossRef]
- Zangeneh, H.; Zinatizadeh, A.A.L.; Habibi, M.; Akia, M.; Hasnain Isa, M. Photocatalytic oxidation of organic dyes and pollutants in wastewater using different modified titanium dioxides: A comparative review. J. Ind. Eng. Chem. 2015, 26, 1–36. [Google Scholar] [CrossRef]
- Khataee, A.; Bozorg, S.; Khorram, S.; Fathinia, M.; Hanifehpour, Y.; Joo, S.W. Conversion of Natural Clinoptilolite Microparticles to Nanorods by Glow Discharge Plasma: A Novel Fe-Impregnated Nanocatalyst for the Heterogeneous Fenton Process. Ind. Eng. Chem. Res. 2013, 52, 18225–18233. [Google Scholar] [CrossRef]
- Khataee, A.; Gholami, P.; Vahid, B. Heterogeneous sono-Fenton-like process using nanostructured pyrite prepared by Ar glow discharge plasma for treatment of a textile dye. Ultrason. Sonochem. 2016, 29, 213–225. [Google Scholar] [CrossRef] [PubMed]
- Yahia Cherif, L.; Yahiaoui, I.; Aissani-Benissad, F.; Madi, K.; Benmehdi, N.; Fourcade, F.; Amrane, A. Heat Attachment Method for the Immobilization of TiO2 on Glass Plates: Application to Photodegradation of Basic Yellow Dye and Optimization of Operating Parameters, Using Response Surface Methodology. Ind. Eng. Chem. Res. 2014, 53, 3813–3819. [Google Scholar] [CrossRef]
- Liu, C.-C.; Hsieh, Y.-H.; Lai, P.-F.; Li, C.-H.; Kao, C.-L. Photodegradation treatment of azo dye wastewater by UV/TiO2 process. Dyes Pigments 2006, 68, 191–195. [Google Scholar] [CrossRef]
- Minero, C.; Mariella, G.; Maurino, V.; Pelizzetti, E. Photocatalytic Transformation of Organic Compounds in the Presence of Inorganic Anions. 1. Hydroxyl-Mediated and Direct Electron-Transfer Reactions of Phenol on a Titanium Dioxide-Fluoride System. Langmuir 2000, 16, 2632–2641. [Google Scholar] [CrossRef]
- Sirisuk, A.; Klansorn, E.; Praserthdam, P. Effects of reaction medium and crystallite size on Ti3+ surface defects in titanium dioxide nanoparticles prepared by solvothermal method. Catal. Commun. 2008, 9, 1810–1814. [Google Scholar] [CrossRef]
Sample Availability: Samples of the compounds are available from the authors. |


| Dye Name | Chemical Structure | Molecular Formula | Color Index Number | λmax (nm) | Mw |
|---|---|---|---|---|---|
| Malachite Green Oxalate | 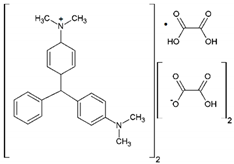 | C52H54N4O12 | 42000 | 618 | 921 |
| Crystal Violet | 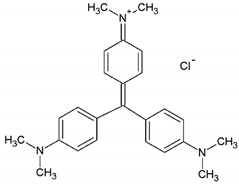 | C25H30N3Cl | 42555 | 595 | 408 |
| Run No. | Variables (Level) | Decolorization (%) | Residual | ||
|---|---|---|---|---|---|
| Plasma Exposure Time (min) | Plasma Operation Pressure (Torr) | Experimental | Predicted | ||
| 1 | 50.00 (0) | 0.50 (0) | 84.92 | 84.69 | 0.23 |
| 2 | 78.28 (+1.41) | 0.50 (0) | 82.54 | 82.53 | 0.01 |
| 3 | 50.00 (0) | 0.50 (0) | 84.24 | 84.69 | −0.45 |
| 4 | 70.00 (+1) | 0.30 (−1) | 77.05 | 75.16 | 1.89 |
| 5 | 21.71 (−1.41) | 0.50 (0) | 87.38 | 88.07 | −0.69 |
| 6 | 30.00 (−1) | 0.70 (+1) | 90.94 | 92.14 | −1.20 |
| 7 | 50.00 (0) | 0.50 (0) | 84.36 | 84.69 | −0.33 |
| 8 | 50.00 (0) | 0.78 (+1.41) | 92.58 | 90.38 | 2.10 |
| 9 | 50.00 (0) | 0.22 (−1.41) | 69.03 | 71.91 | −2.88 |
| 10 | 50.00 (0) | 0.50 (0) | 85.26 | 84.69 | 0.57 |
| 11 | 50.00 (0) | 0.50 (0) | 84.68 | 84.69 | −0.01 |
| 12 | 30.00 (−1) | 0.30 (−1) | 80.61 | 78.22 | 2.39 |
| 13 | 70.00 (+1) | 0.70 (+1) | 85.66 | 87.36 | −1.70 |
| Source of Variation | Sum of Squares | Degree of Freedom | Mean Square | F-Value | P-Value |
|---|---|---|---|---|---|
| Model | 396.57 | 5 | 79.31 | 19.89 | 0.001 |
| Residuals | 27.91 | 7 | 3.98 | - | - |
| Total | 424.48 | 12 | - | - | - |
| Quadratic Term | Estimated Coefficient | Standard Error | F-Value | P-Value |
|---|---|---|---|---|
| B0 (constant) | 84.692 | 0.893 | 94.838 | 0.000 |
| B1 (time) | −1.960 | 0.706 | −2.777 | 0.027 |
| B2 (pressure) | 6.530 | 0.706 | 9.250 | 0.000 |
| B11 (time × time) | 0.304 | 0.757 | 0.402 | 0.699 |
| B22 (pressure × pressure) | −1.772 | 0.757 | −2.342 | 0.052 |
| B12 (time × pressure) | −0.430 | 0.998 | −0.431 | 0.680 |
| Code | Parameter | Level | ||||
|---|---|---|---|---|---|---|
| −1.41 | −1 | 0 | 1 | 1.41 | ||
| X1 | Time (min) | 21.71 | 30 | 50 | 70 | 78.28 |
| X2 | Pressure (Torr) | 0.21 | 0.3 | 0.5 | 0.7 | 0.78 |
© 2019 by the authors. Licensee MDPI, Basel, Switzerland. This article is an open access article distributed under the terms and conditions of the Creative Commons Attribution (CC BY) license (http://creativecommons.org/licenses/by/4.0/).
Share and Cite
Khaledian, H.R.; Zolfaghari, P.; Elhami, V.; Aghbolaghy, M.; Khorram, S.; Karimi, A.; Khataee, A. Modification of Immobilized Titanium Dioxide Nanostructures by Argon Plasma for Photocatalytic Removal of Organic Dyes. Molecules 2019, 24, 383. https://doi.org/10.3390/molecules24030383
Khaledian HR, Zolfaghari P, Elhami V, Aghbolaghy M, Khorram S, Karimi A, Khataee A. Modification of Immobilized Titanium Dioxide Nanostructures by Argon Plasma for Photocatalytic Removal of Organic Dyes. Molecules. 2019; 24(3):383. https://doi.org/10.3390/molecules24030383
Chicago/Turabian StyleKhaledian, Hamid Reza, Pezhman Zolfaghari, Vahide Elhami, Mostafa Aghbolaghy, Sirous Khorram, Afzal Karimi, and Alireza Khataee. 2019. "Modification of Immobilized Titanium Dioxide Nanostructures by Argon Plasma for Photocatalytic Removal of Organic Dyes" Molecules 24, no. 3: 383. https://doi.org/10.3390/molecules24030383
APA StyleKhaledian, H. R., Zolfaghari, P., Elhami, V., Aghbolaghy, M., Khorram, S., Karimi, A., & Khataee, A. (2019). Modification of Immobilized Titanium Dioxide Nanostructures by Argon Plasma for Photocatalytic Removal of Organic Dyes. Molecules, 24(3), 383. https://doi.org/10.3390/molecules24030383