UHPLC-ESI-MS/MS Quantitative Analyses of Multicomponent Hu Gan Tablets

Abstract
:1. Introduction
2. Results and Discussion
2.1. Optimization of UHPLC-ESI-MS/MS Conditions
2.2. Comparisons with Other Analytical Methods
2.3. Method Validation
2.4. Sample Analysis
3. Materials and Methods
3.1. Chemicals and Materials
3.2. Preparation of Standard Solutions
3.3. Samples Preparation
3.4. Chromatographic and MS Conditions
4. Conclusions
Supplementary Materials
Author Contributions
Funding
Conflicts of Interest
References
- Peng, W.M.; Huang, G.L.; Yi, X.H. Simultaneous determination of seven active components in Hugan tablets by HPLC. Jiangxi J. Tradit. Chin. Med. 2019, 50, 68–71. [Google Scholar]
- Gao, Y.Y.; Ma, M.F. Rapid determination of γ-schizandrin in Hugan tablets by HPLC. Shandong J. Tradit. Chin. Med. 2003, 22, 40–42. [Google Scholar]
- Liu, H.; Wang, R.B.; Xie, Y.M.; Li, Y.Y.; Liao, X.; Liu, S.N.; Ye, Y.A.; Gou, C.Y.; Zhan, S.Y.; Wang, Y.Y. Expert consensus statement on Hugan tablets in clinical practice. Chin. J. Chin. Mater. Med. 2019, 44, 2943–2946. [Google Scholar]
- Wu, G.Y. Uncertainty Analysis for five effective components in Hugan tabelts by HPLC. Chin. J. Ethnomed. Ethnopharm. 2016, 25, 33–36. [Google Scholar]
- Wang, R.J.; Qiu, B. Optimization of the fingerprint of Hugan tablets based on analytical quality by design. Chin. Pharm. 2019, 22, 82–85. [Google Scholar]
- Li, J.Y.; Li, X.M.; Wang, Y.H. Identification of Hugan tablets by near infrared spectroscopy. Anhui Med. Pharm. J. 2011, 2011, 579–580. [Google Scholar]
- Shen, H.B.; Zhou, Y.N.; Zheng, J.; Zhu, R.H. “Multi-component-multi-target-multi-pathway” mechanism of Kuihua Hugan tablets based on network pharmacology. Chin. J. Chin. Mater. Med. 2019, 44, 1464–1474. [Google Scholar]
- Wang, Y. The economic evaluation of the medicine for the treatment of liver injury by sunflower. Med. Prac. 2018, 13, 79–81. [Google Scholar]
- Du, J.H.; Zuo, T.B.; Li, F.L.; Hu, B.Z. Progression of studies of Bupleurum L. J. Northeast Agric. Univ. 2003, 34, 352–359. [Google Scholar]
- Huang, W.; Zhao, Y.; Sun, R. Research development on hepatoprotective effect and hepatotoxicity based on Bupleurum Saikosaponin components. Chin. J. Pharm. 2011, 8, 44–47. [Google Scholar]
- Shi, Q.; Nie, S.Q.; Huang, L.Q. New progression of chemical component and pharmacological studies of Radix Bupleuri. Chin. J. Exp. Tradit. Med. Form. 2002, 8, 53–56. [Google Scholar]
- Liu, Y.P.; Qiu, X.Y.; Liu, Y.; Ma, G. Research progress on pharmacological effect of Artemisiae Scopariae Herba. Chin. Tradit. Herbal Drugs 2019, 50, 2235–2241. [Google Scholar]
- Huang, J.D. Summary of chemical constituents and pharmacological effects of Isatis root. Chin. J. Mod. Drug Appl. 2009, 3, 197–198. [Google Scholar]
- Yang, H.J.; Yang, S.H. Overview of pharmacological action of Schisandra chinensis. Renshen Res. 1999, 11, 5–8. [Google Scholar]
- Zhang, C.; Hao, M.L. Studies on anti-inflammatory effects of pig bile powder. J. Agric. Univ. Hebei. 2018, 41, 89–93. [Google Scholar]
- Sun, L.L.; Li, L.; Dong, Y.M. Research progress of the active components and preparation technology of the Mung beans and the sprouts. North. Horticul. 2013, 2013, 194–200. [Google Scholar]
- Yang, L.; Li, T.L. Quality evaluation of Hugan tablets based on HPLC fingerprint and chemical pattern recognition. Chin. Tradit. Herb. Drugs 2019, 50, 3351–3356. [Google Scholar]
- Min, Y.H.; Wang, J.H.; Fan, M.X.; Chen, Y.G.; Fu, X.T.; Guo, H.Z. Study on the variation of saikosaponins and the quality control of the decoction pieces of Radix Bupleuri. Chin. J. Pharm. Anal. 2014, 34, 836–843. [Google Scholar]
- Li, Y.Q.; Wang, Z.X.; Guan, Y.L.; Qu, W.H.; Ma, C.H. Determination of two major conjugated bile acids in Hugan tablets by HPLC-ELSD. China Pharm. 2019, 22, 350–352. [Google Scholar]
- Zhu, X.; Han, L.W.; Ma, W.C.; Ni, J.; Wu, Q. Establishment of quantitative determination of wuweizi (Fructus Schisandrae) in Hugan tablets and content comparison among products from different manufactures. J. Beijing Univ. Tradit. Chin. Med. 2011, 34, 258–262. [Google Scholar]
- Demonte, L.D.; Michlig, N.; Gaggiotti, M.; Adam, C.G.; Beldoménico, H.R.; Repetti, M.R. Determination of glyphosate, AMPA and glufosinate in dairy farm water from Argentina using a simplified UHPLC-MS/MS method. Sci. Total Environ. 2018, 645, 34–43. [Google Scholar] [CrossRef]
- Bao, Y.W.; Li, C.; Shen, H.W.; Nan, F.J. Determination of saikosaponin derivatives in Radix bupleuri and in pharmaceuticals of the Chinese multiherb remedy Xiaochaihu-tang using liquid chromatographic tandem mass spectrometry. Anal. Chem. 2004, 76, 4208–4216. [Google Scholar] [CrossRef]
- Li, Y.; Yan, Q.H.; Yu, J.; Zhang, J.W.; Xi, G.X. Simultaneous determination baicalin and forsythin in shuanghuanglian oral liquid by HPLC/DAD and LC-ESI-MS. J. Chin. Chem. Soc. 2013, 60, 1050–1054. [Google Scholar]
- Tang, Q.Z.; Wang, Y.C.; Meng, Q.Y.; Hou, J.H.; Wang, T. HPLC simultaneous determination of schisandrin, deoxyschizandrin, schizandrin B of Hugan tablets. Drug Stand. Chin. 2012, 13, 258–261. [Google Scholar]
- Song, X.J.; Zhang, Y.X.; Zhang, Y.; Zhang, Q.W. Qualitative and quantitative methods of chlorogenic acid in commercial herba Artemisiae scopariae. Chin. J. Chin. Mater. Med. 2002, 27, 267–269. [Google Scholar]
- Zhai, H.Y.; Yin, J. Determination of chlorogenic acid content in Hugan tablets by HPLC. Chin. J. Pharm. 2011, 9, 71–75. [Google Scholar]
- Xia, Y.G.; Yang, B.Y.; Liang, J.; Yang, Q.; Wang, D.; Kuang, H.X. Quantitative analysis and fingerprint profiles for quality control of Fructus Schisandrae by gas chromatography: Mass spectrometry. Sci. World J. 2014, 2014, 1–8. [Google Scholar] [CrossRef]
- Yu, H.H.; Gao, X.Y. Prevention and therapeutic effects to drug-induced liver injury with liver-aid tablets. Chin. J. Mod. Appl. Pharm. 2019, 36, 2271–2274. [Google Scholar]
- Shi, L.; Wang, Z.C.; Feng, X.Q. Advances in studies on chemical constituents and pharmacological activities of Schisandrae Chinensis. Drug Eval. Res. 2011, 34, 208–212. [Google Scholar]
- Yan, M.L.; Yang, L.; Hou, A.J.; Guo, X.Y.; Man, W.J.; Xing, X.D.; Han, H. Research progress on chemical composition and pharmacological effect of Bupleurum chinense. Inf. Tradit. Chin. Med. 2018, 35, 103–109. [Google Scholar]
- Cao, J.H. Advanced study on chemical constituents and pharmaceutical activities of Artemisiae scopariae Herba. J. ShenYang Pharm. Univ. 2013, 30, 489–494. [Google Scholar]
- Zhu, M.; Zhang, K.M.; Ding, Y. Evaluation of the antioxidant effect of scoparone and scopoletin from Artemisia capillaries. ShenYang Pharm. Univ. 2016, 33, 889–893. [Google Scholar]
- Zhang, D.D.; Li, J.Y.; Shi, Y.H.; Chen, K.X.; Li, Y.M.; Wang, R. Glycosides from roots of Isatis indigotica. Chin. Tradit. Herb. Drugs 2019, 50, 3575–3580. [Google Scholar]
- Sun, L.X.; Tang, H.; Yin, P.; Ning, L.L.; Bi, K.S. Determination of the content of indigo and indirubin in the indigowoad root and leaves by RP-HPLC. J. ShenYang Pharm. Univ. 2000, 17, 191–193. [Google Scholar]
- Liu, D.M.; Zhang, Y.M.; Tan, N.H. Research progress on chemical constituents and biological activities of Phaseolus radiatus. J. Qiannan Med. Coll. Natl. 2012, 25, 163–166. [Google Scholar]
- Li, Z.W.; Ma, Q.; Yuan, Y.S.; Zhou, Y.X. Determination of hyodeoxycholic acid in procine gall power by HPLC with evaporative light scattering detector. Chin. J. Exp. Tradit. Med. Form. 2005, 11, 14–16. [Google Scholar]
Sample Availability: The samples and compounds 1–18 were not available from the authors. |

| No. | tR (min) | Compounds | Molecular Weights | Precursor Ions (m/z) | Q1 (Da) | Q3 (Da) | DP | CE |
|---|---|---|---|---|---|---|---|---|
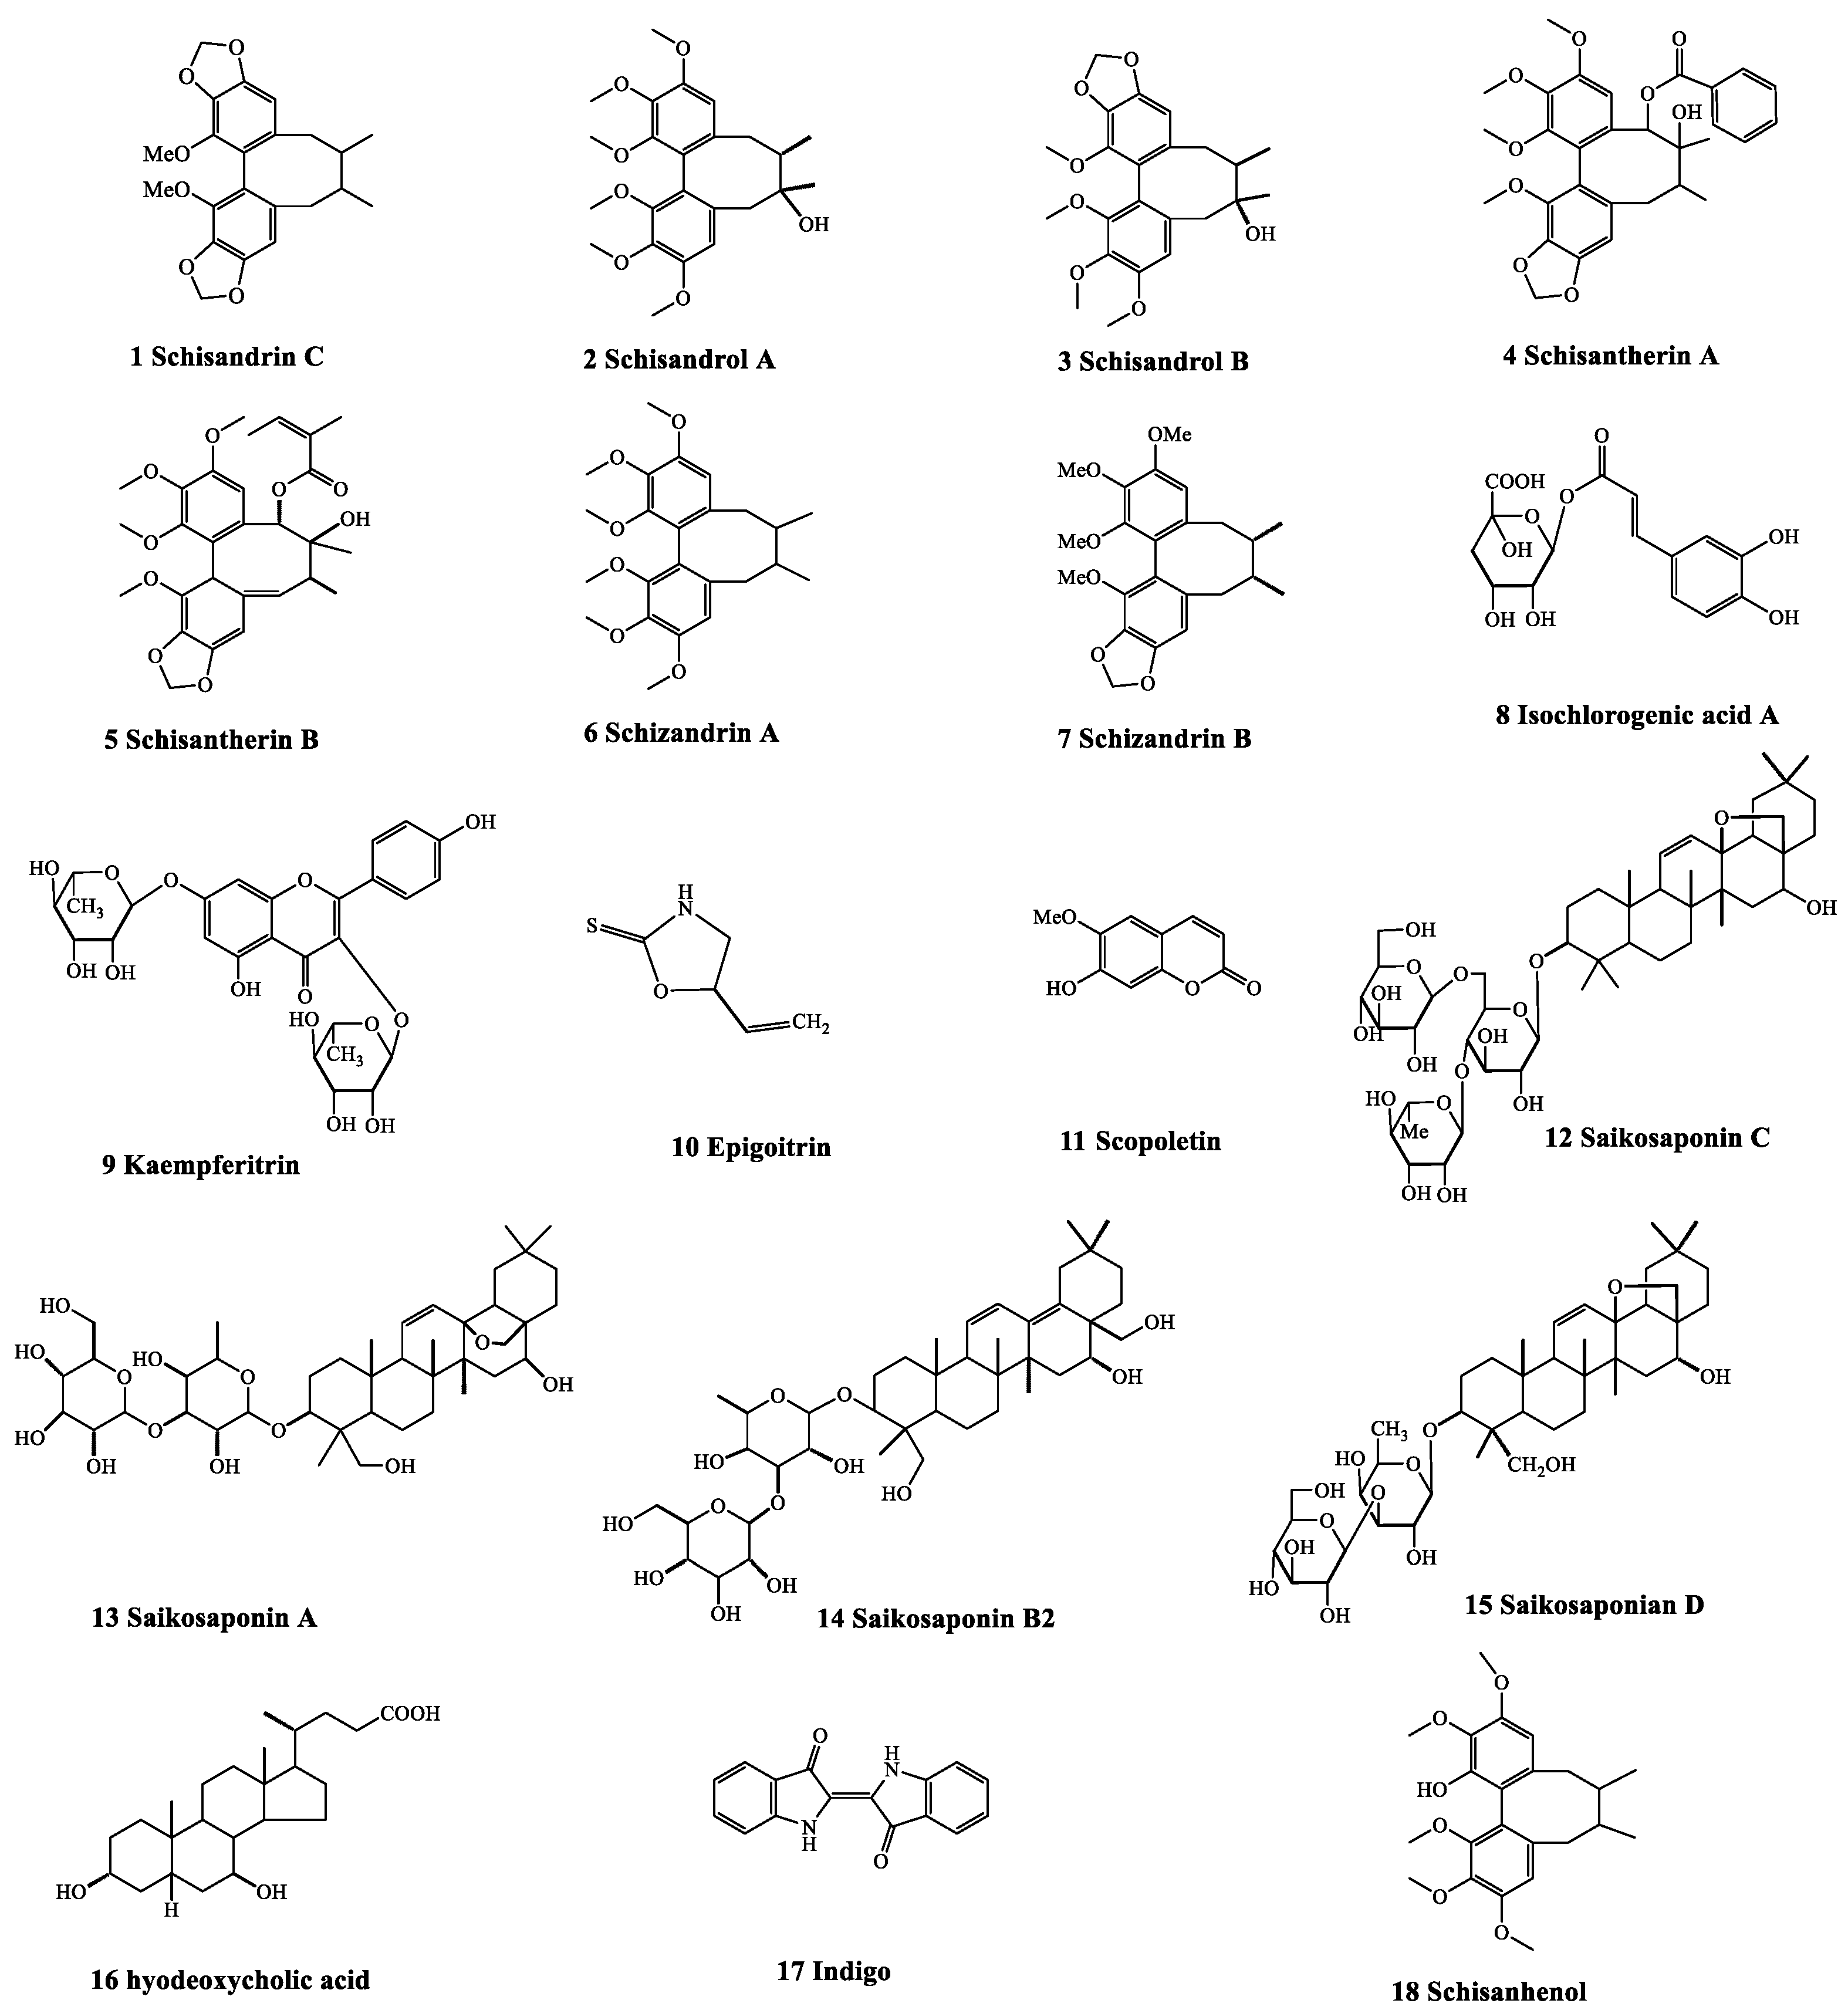
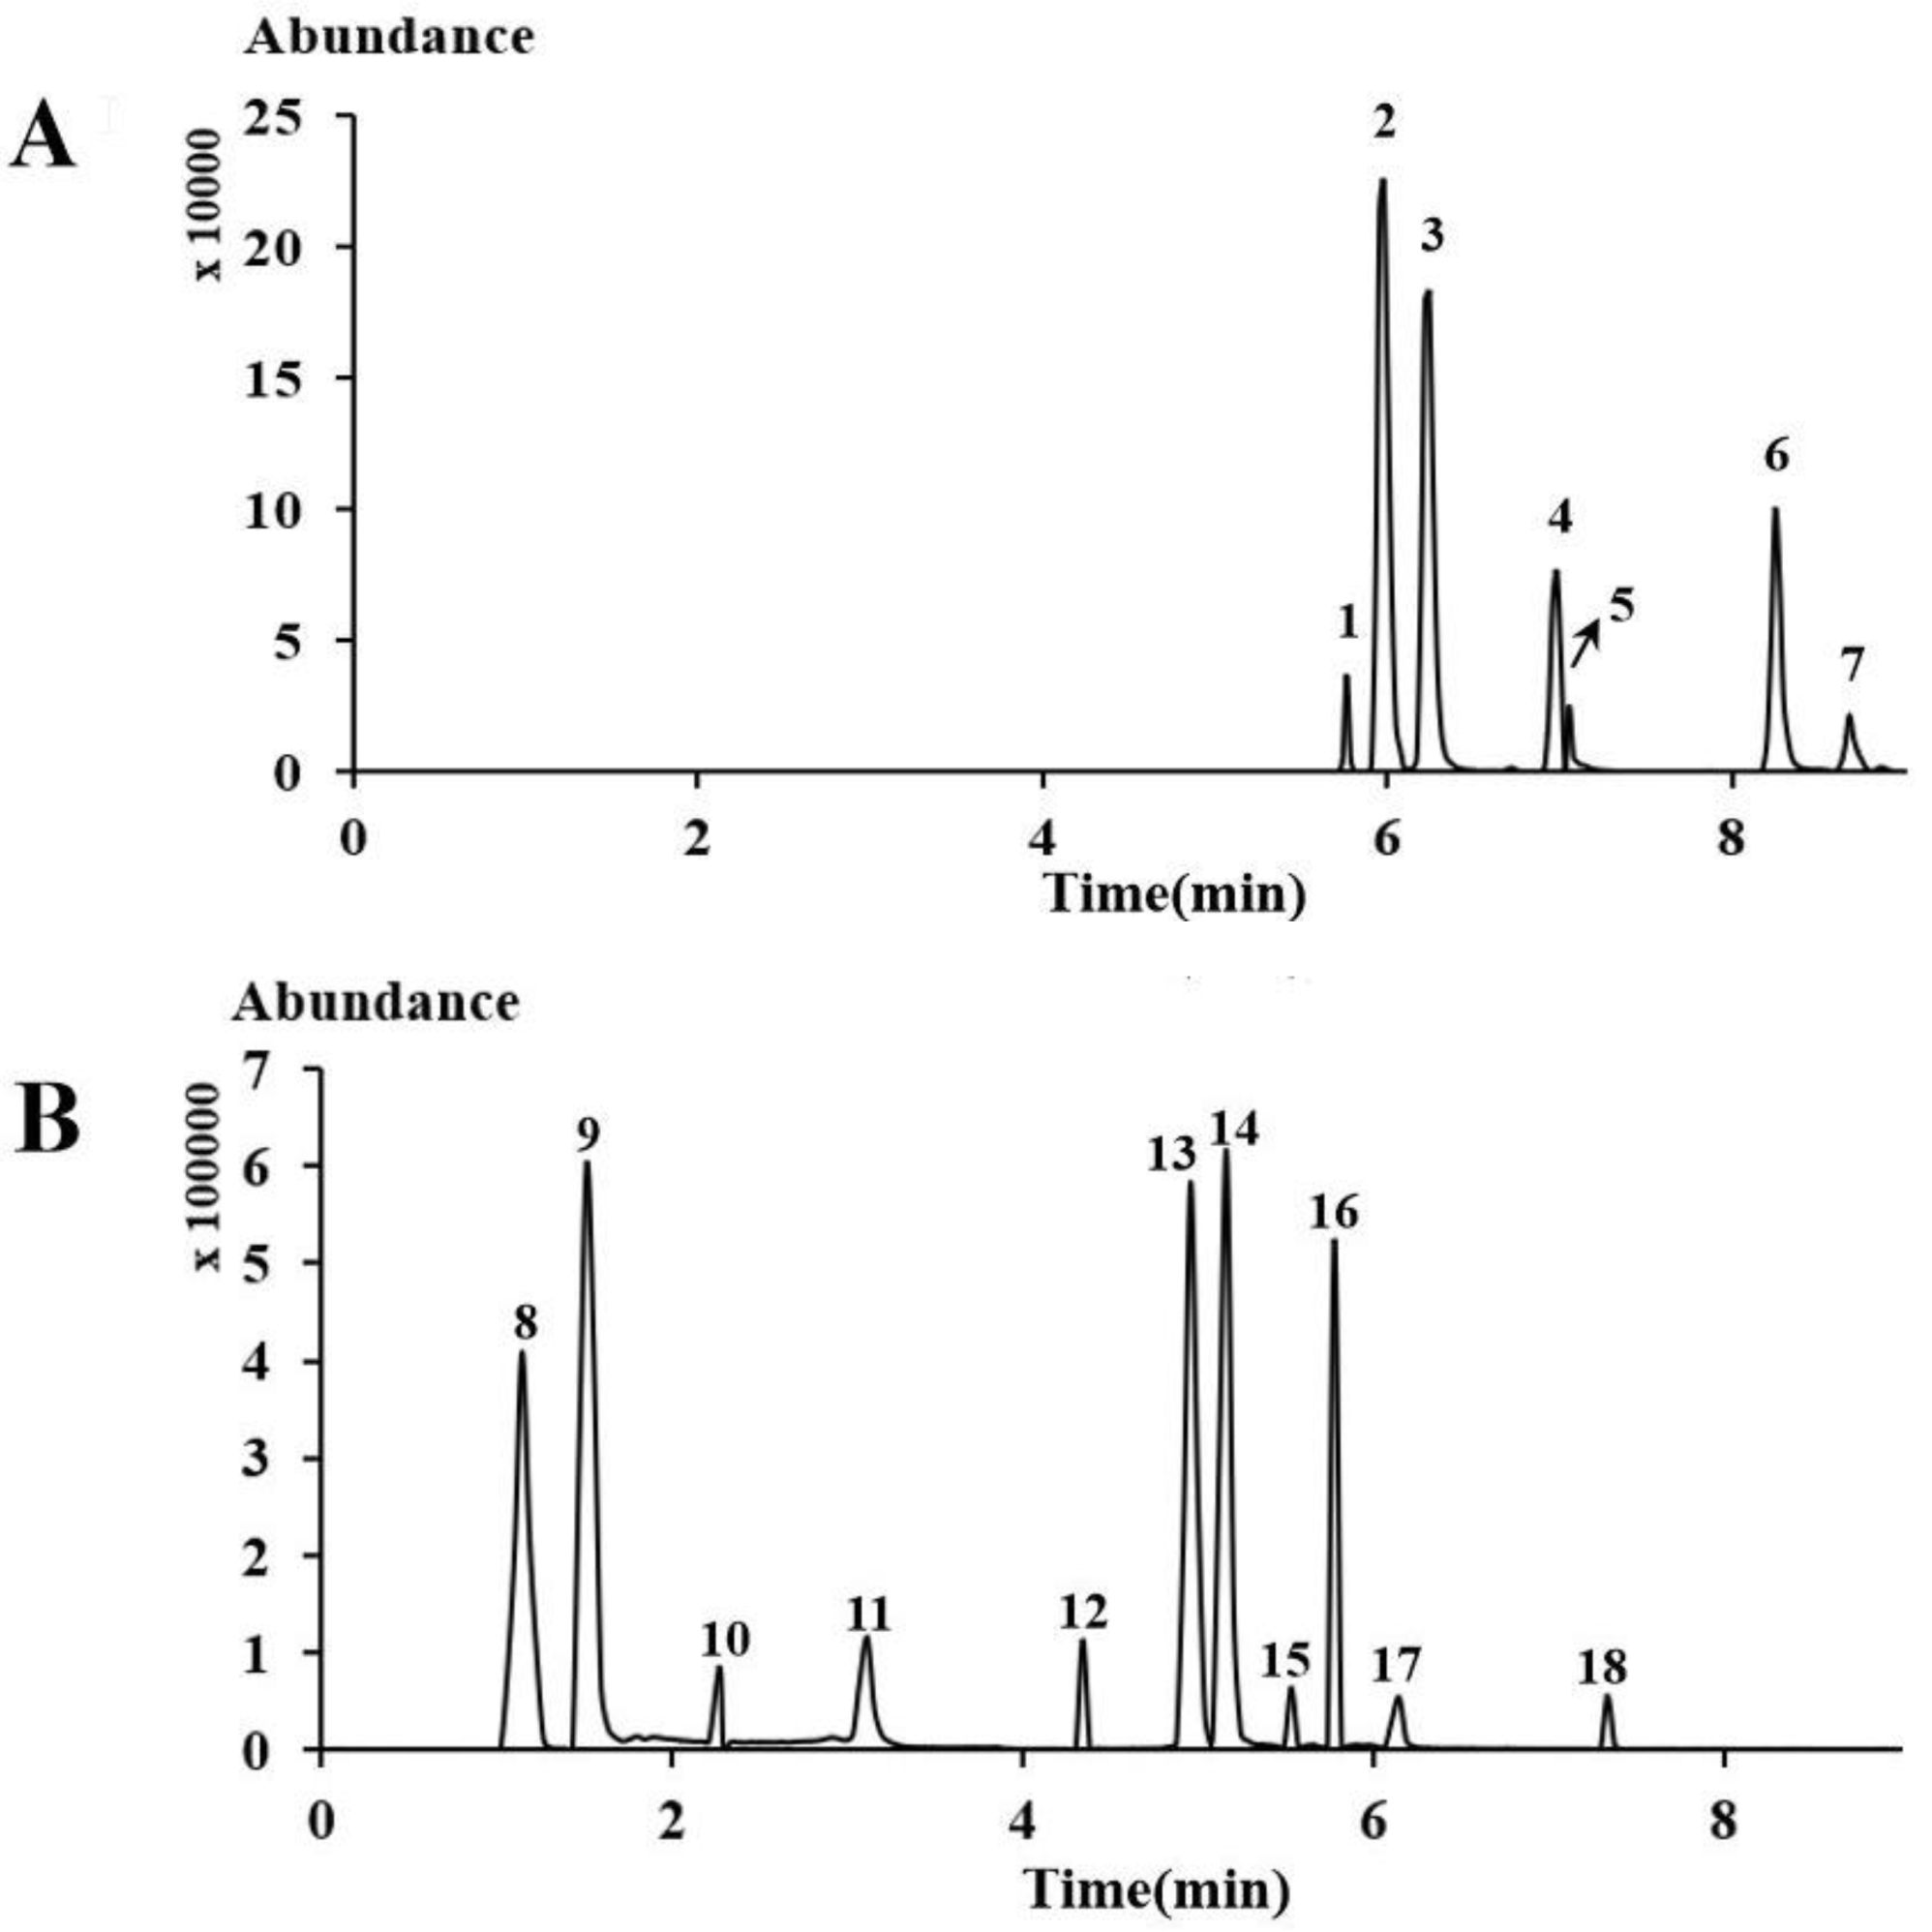
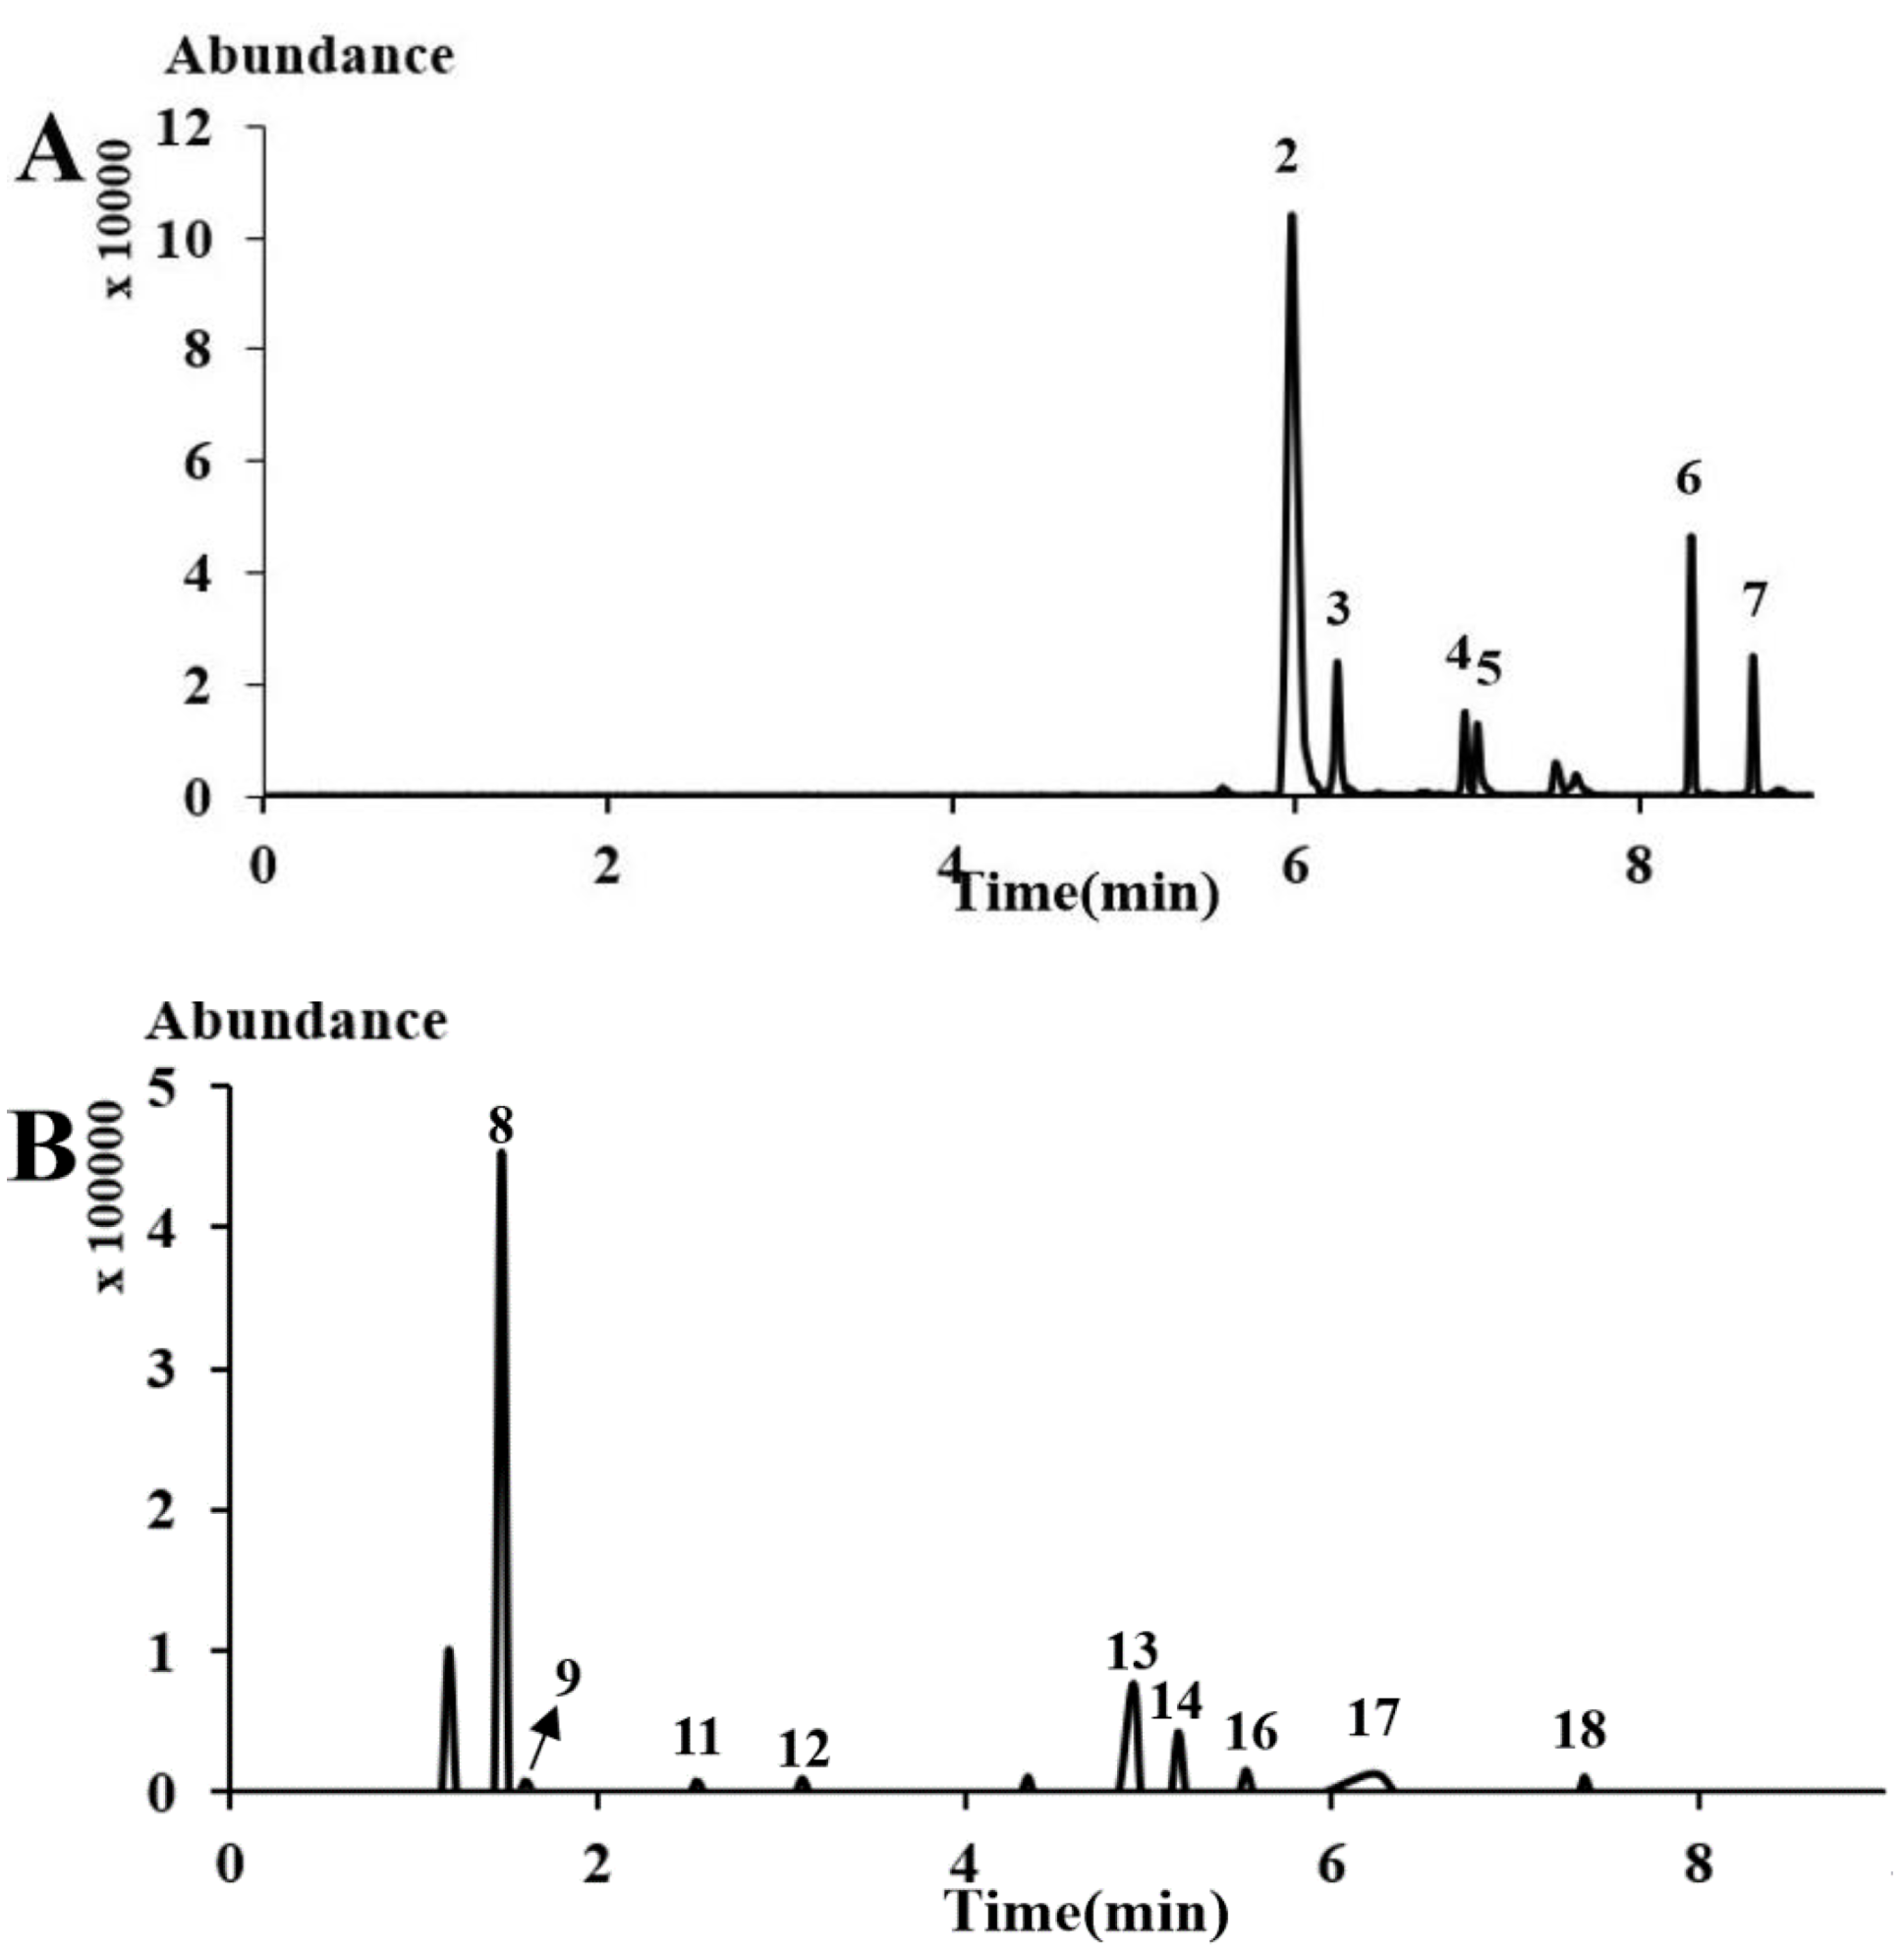
| 1 | 5.77 | Schisandrin C | 384.42 | [M + Na]+ | 406.8 | 161.0 | 98.79 | 47.07 |
| 2 | 5.99 | Schisandrol A | 432.51 | [M + H − H2O]+ | 415.8 | 339.0 | 113.26 | 47.12 |
| 3 | 6.25 | Schisandrol B | 416.47 | [M + H − H2O]+ | 399.9 | 300.1 | 100.74 | 47.95 |
| 4 | 7.00 | Schisantherin A | 536.57 | [M + Na]+ | 559.9 | 341.2 | 160.59 | 45.66 |
| 5 | 7.09 | Schisantherin B | 514.57 | [M + Na]+ | 537.7 | 341.1 | 159.39 | 39.61 |
| 6 | 8.30 | Schizandrin A | 416.51 | [M + H]+ | 417.7 | 301.2 | 157.41 | 44.09 |
| 7 | 8.70 | Schizandrin B | 400.47 | [M + H]+ | 401.7 | 285.1 | 149.92 | 36.85 |
| 8 | 1.52 | Isochlorogenic acid A | 354.31 | [M − H]− | 353.3 | 190.8 | −63.68 | −21.72 |
| 9 | 1.56 | Kaempferitrin | 578.57 | [M − H]− | 577.3 | 285.0 | −131.67 | −47.04 |
| 10 | 2.27 | Epigoitrin | 129.18 | [M − H]− | 127.9 | 58.0 | −45.86 | −15.63 |
| 11 | 3.12 | Scopoletin | 192.17 | [M − H]− | 190.9 | 103.7 | −65.39 | −35.86 |
| 12 | 4.34 | Saikosaponin C | 927.12 | [M − H]− | 926.0 | 617.2 | −169.58 | −51.86 |
| 13 | 4.96 | Saikosaponin A | 780.98 | [M − H]− | 779.4 | 617.7 | −195.03 | −48.56 |
| 14 | 5.16 | Saikosaponin B2 | 780.99 | [M − H]− | 779.5 | 617.8 | −184.29 | −48.30 |
| 15 | 5.79 | Saikosaponian D | 780.99 | [M − H]− | 779.6 | 617.5 | −185.68 | −52.11 |
| 16 | 5.53 | hyodeoxycholic acid | 392.56 | [M − H]− | 391.7 | 374.3 | −166.39 | −45.04 |
| 17 | 6.14 | Indigo | 262.26 | [M − H]− | 261.1 | 155.8 | −105.36 | −44.00 |
| 18 | 7.36 | Schisanhenol | 402.5 | [M − H]− | 401.1 | 339.2 | −89.91 | −34.67 |
| No. | Regression Equation | Linea Range (μg/mL) | R2 | LODs (μg/mL) | LOQs (μg/mL) |
|---|---|---|---|---|---|
| 1 | y = 655.51x − 184.48 | 0.63–10.00 | 0.999 | 0.16 | 0.31 |
| 2 | y = 219418x + 32705 | 0.08–5.00 | 0.998 | 2.44 × 10⁻³ | 9.77 × 10⁻³ |
| 3 | y = 152722x + 2964 | 0.08–2.50 | 1.000 | 2.44 × 10⁻³ | 9.77 × 10⁻³ |
| 4 | y = 71665x + 1342.6 | 0.01–0.63 | 0.999 | 9.77 × 10⁻³ | 0.02 |
| 5 | y = 10172x + 60.62 | 0.08–2.50 | 0.999 | 9.77 × 10⁻³ | 0.02 |
| 6 | y = 47841x + 2066.3 | 0.01–2.50 | 0.998 | 2.44 × 10⁻³ | 9.77 × 10⁻³ |
| 7 | y = 16223x − 186.99 | 0.04–2.50 | 1.000 | 9.77 × 10⁻³ | 0.02 |
| 8 | y = 31312x + 16578 | 0.01–5.00 | 0.999 | 2.44 × 10⁻³ | 9.77 × 10⁻³ |
| 9 | y = 409356x − 550.49 | 0.002–0.08 | 1.000 | 2.44 × 10⁻³ | 9.77 × 10⁻³ |
| 10 | y = 1123.6x − 1129.2 | 1.25–40.00 | 0.999 | 0.63 | 1.25 |
| 11 | y = 70281x − 312.58 | 0.01–1.25 | 0.999 | 2.44 × 10⁻³ | 9.77 × 10⁻³ |
| 12 | y = 100.12x + 64.52 | 0.63–40.00 | 0.999 | 0.04 | 1.25 |
| 13 | y = 44268x + 30605 | 0.08–40.00 | 0.999 | 2.44 × 10⁻³ | 9.77 × 10⁻³ |
| 14 | y = 156901x − 1354.7 | 0.01–0.63 | 0.999 | 2.44 × 10⁻³ | 9.77 × 10⁻³ |
| 15 | y = 44456x + 71374 | 0.31–20.00 | 0.992 | 2.44 × 10⁻³ | 9.77 × 10⁻³ |
| 16 | y = 147.67x + 569.89 | 0.63–40.00 | 0.991 | 0.04 | 0.16 |
| 17 | y = 7702.2x − 121.23 | 0.04–1.25 | 0.999 | 0.02 | 0.04 |
| 18 | y = 724.64x − 232.14 | 0.31–10.00 | 0.999 | 0.02 | 0.08 |
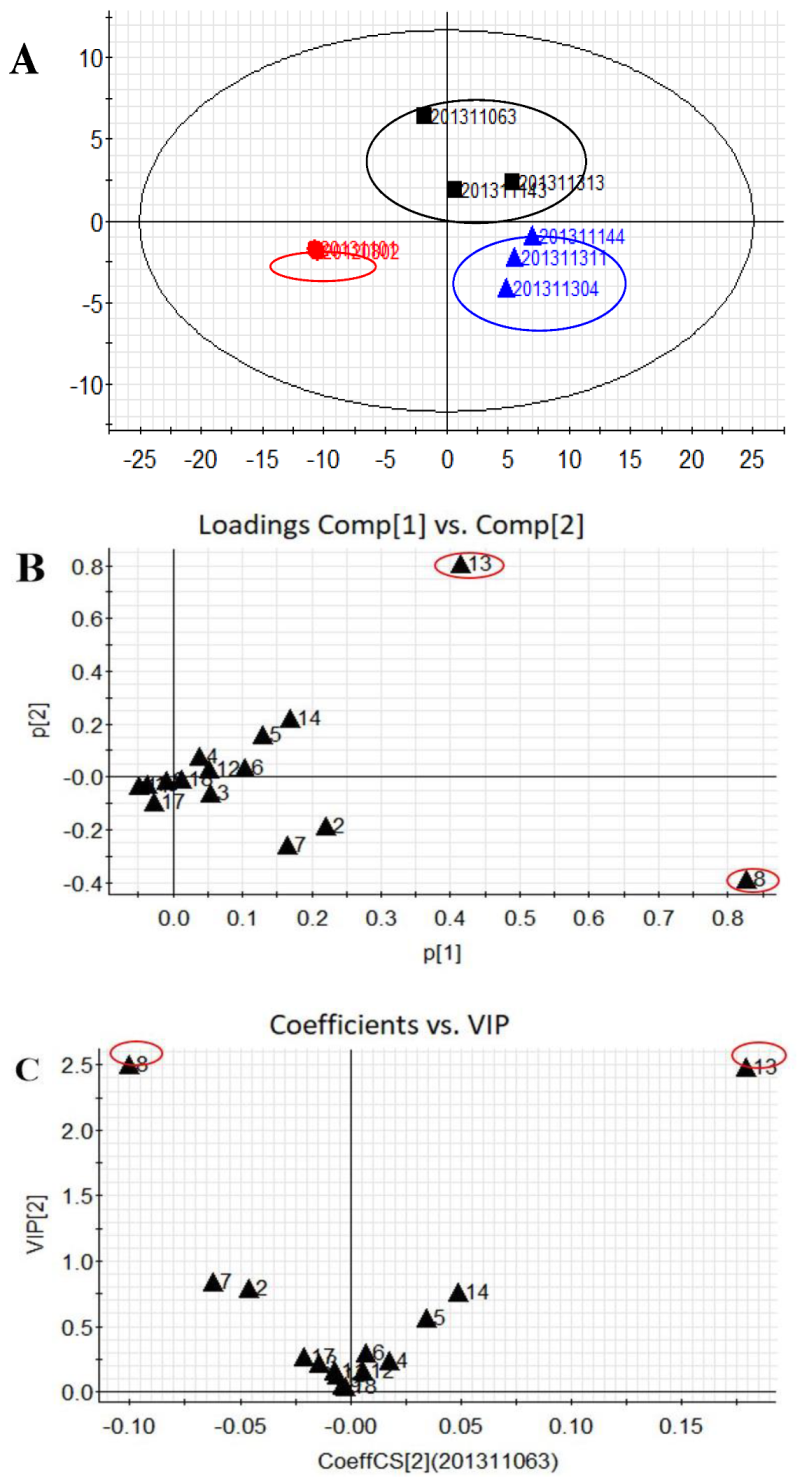
| Manufacturers | Batches | 1 | 2 | 3 | 4 | 5 | 6 | 7 | 8 | 9 | 10 | 11 | 12 | 13 | 14 | 15 | 16 | 17 | 18 |
|---|---|---|---|---|---|---|---|---|---|---|---|---|---|---|---|---|---|---|---|
| a1. | 201311063 | / | 30.8 | 1.0 | 2.5 | 12.3 | 10.7 | 13.8 | 96.2 | 0.01 | / | 0.1 | 0.3 | 44.8 | 7.2 | / | 0.12 | / | 0.2 |
| a2. | 201311143 | / | 34.5 | 1.4 | 2.0 | 11.6 | 11.2 | 18.6 | 115.9 | 0.02 | / | 0.1 | / | 34.6 | 7.2 | / | 0.11 | 0.2 | 0.2 |
| a3. | 201311144 | / | 39.0 | 1.4 | 1.7 | 12.3 | 10.2 | 15.7 | 160.7 | 0.02 | / | 0.1 | 0.5 | 34.6 | 7.2 | / | 0.13 | 0.2 | 0.2 |
| b1. | 201311311 | / | 37.0 | 1.7 | 2.5 | 12.1 | 11.7 | 20.8 | 152.0 | 0.02 | / | 0.1 | 0.6 | 27.8 | 7.2 | / | 0.10 | 0.5 | 0.2 |
| b2. | 201311304 | / | 38.0 | 1.6 | 2.0 | 11.1 | 10.7 | 22.7 | 153.0 | 0.02 | / | 0.1 | 0.1 | 23.2 | 4.8 | / | 0.10 | 0.3 | 0.3 |
| b3. | 201311313 | / | 39.3 | 1.6 | 2.0 | 12.6 | 9.2 | 16.7 | 139.5 | 0.02 | / | 0.1 | 0.6 | 45.3 | 7.2 | / | 0.03 | 0.3 | 0.3 |
| c1. | 20131101 | / | 31.8 | 1.3 | 1.7 | 10.3 | 8.5 | 14.8 | 67.5 | 0.03 | / | 0.6 | / | 3.4 | 2.4 | / | 0.26 | 0.6 | 0.2 |
| c2. | 20120802 | / | 32.0 | 0.9 | 1.5 | 8.6 | 8.5 | 13.0 | 71.5 | 0.04 | / | 0.3 | / | 3.4 | 2.4 | / | 0.31 | 0.5 | 0.2 |
© 2019 by the authors. Licensee MDPI, Basel, Switzerland. This article is an open access article distributed under the terms and conditions of the Creative Commons Attribution (CC BY) license (http://creativecommons.org/licenses/by/4.0/).
Share and Cite
Liang, J.; Guo, X.-D.; Han, F. UHPLC-ESI-MS/MS Quantitative Analyses of Multicomponent Hu Gan Tablets. Molecules 2019, 24, 4241. https://doi.org/10.3390/molecules24234241
Liang J, Guo X-D, Han F. UHPLC-ESI-MS/MS Quantitative Analyses of Multicomponent Hu Gan Tablets. Molecules. 2019; 24(23):4241. https://doi.org/10.3390/molecules24234241
Chicago/Turabian StyleLiang, Jun, Xin-Dong Guo, and Fang Han. 2019. "UHPLC-ESI-MS/MS Quantitative Analyses of Multicomponent Hu Gan Tablets" Molecules 24, no. 23: 4241. https://doi.org/10.3390/molecules24234241
APA StyleLiang, J., Guo, X.-D., & Han, F. (2019). UHPLC-ESI-MS/MS Quantitative Analyses of Multicomponent Hu Gan Tablets. Molecules, 24(23), 4241. https://doi.org/10.3390/molecules24234241