Levels of the Thiocyanate in the Saliva of Tobacco Smokers in Comparison to e-Cigarette Smokers and Nonsmokers Measured by HPLC on a Phosphatidylcholine Column
Abstract
1. Introduction
2. Results and Discussion
2.1. HPLC Conditions
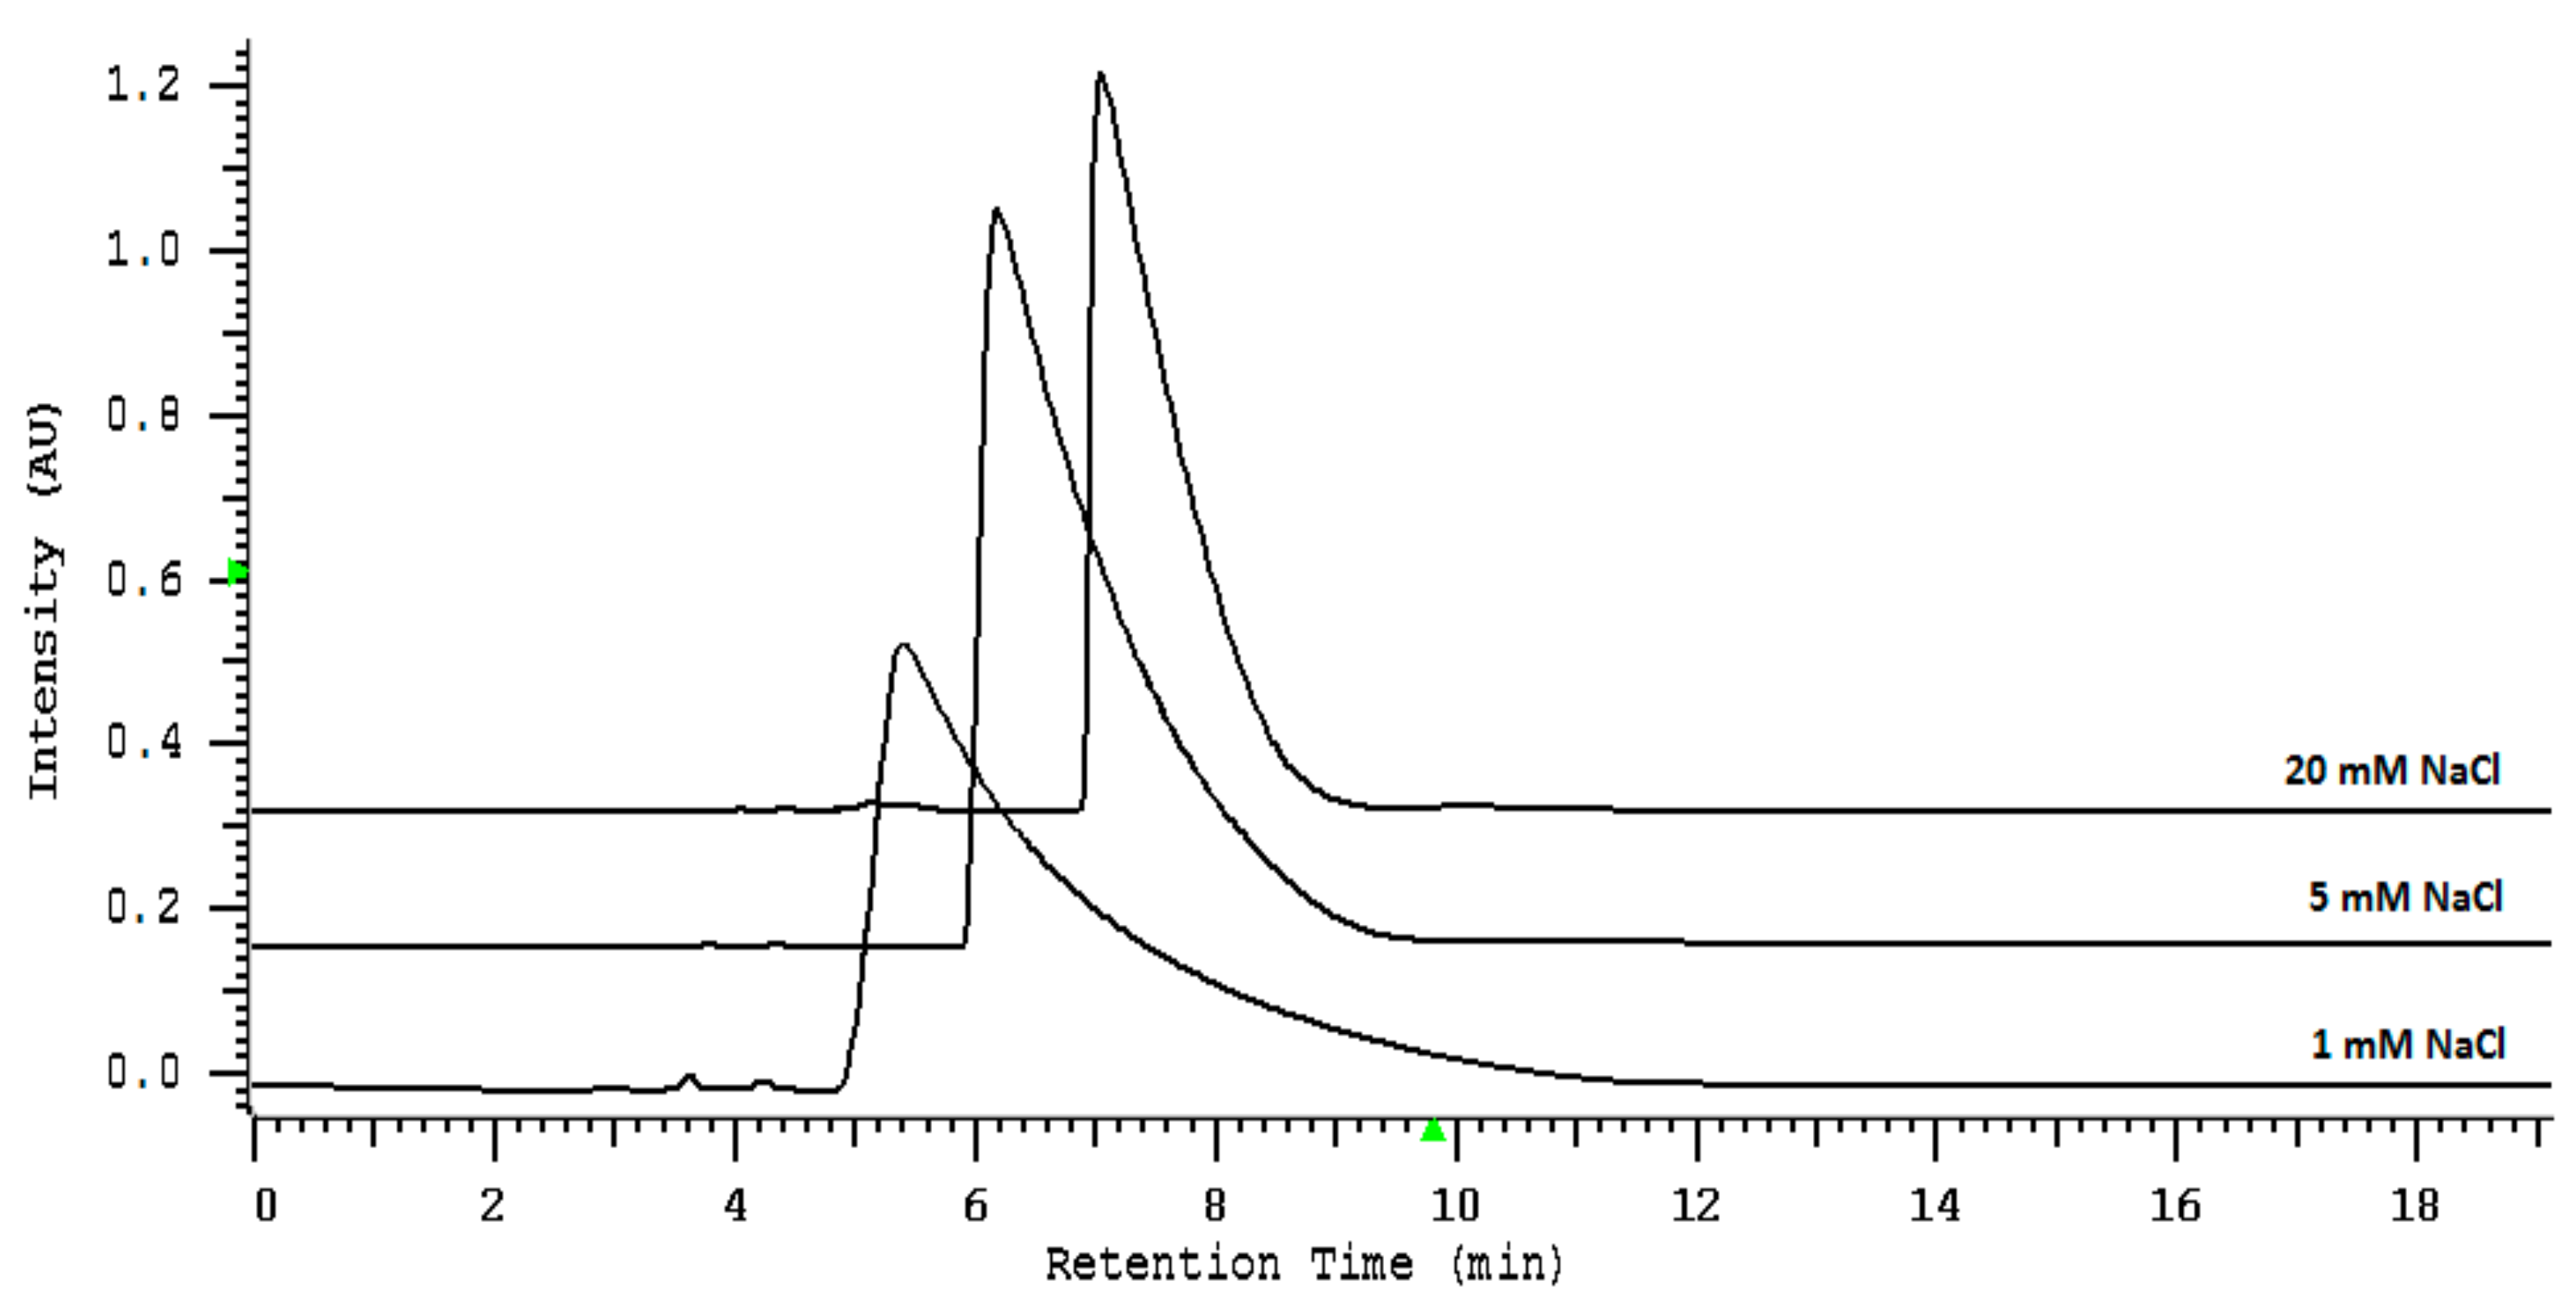
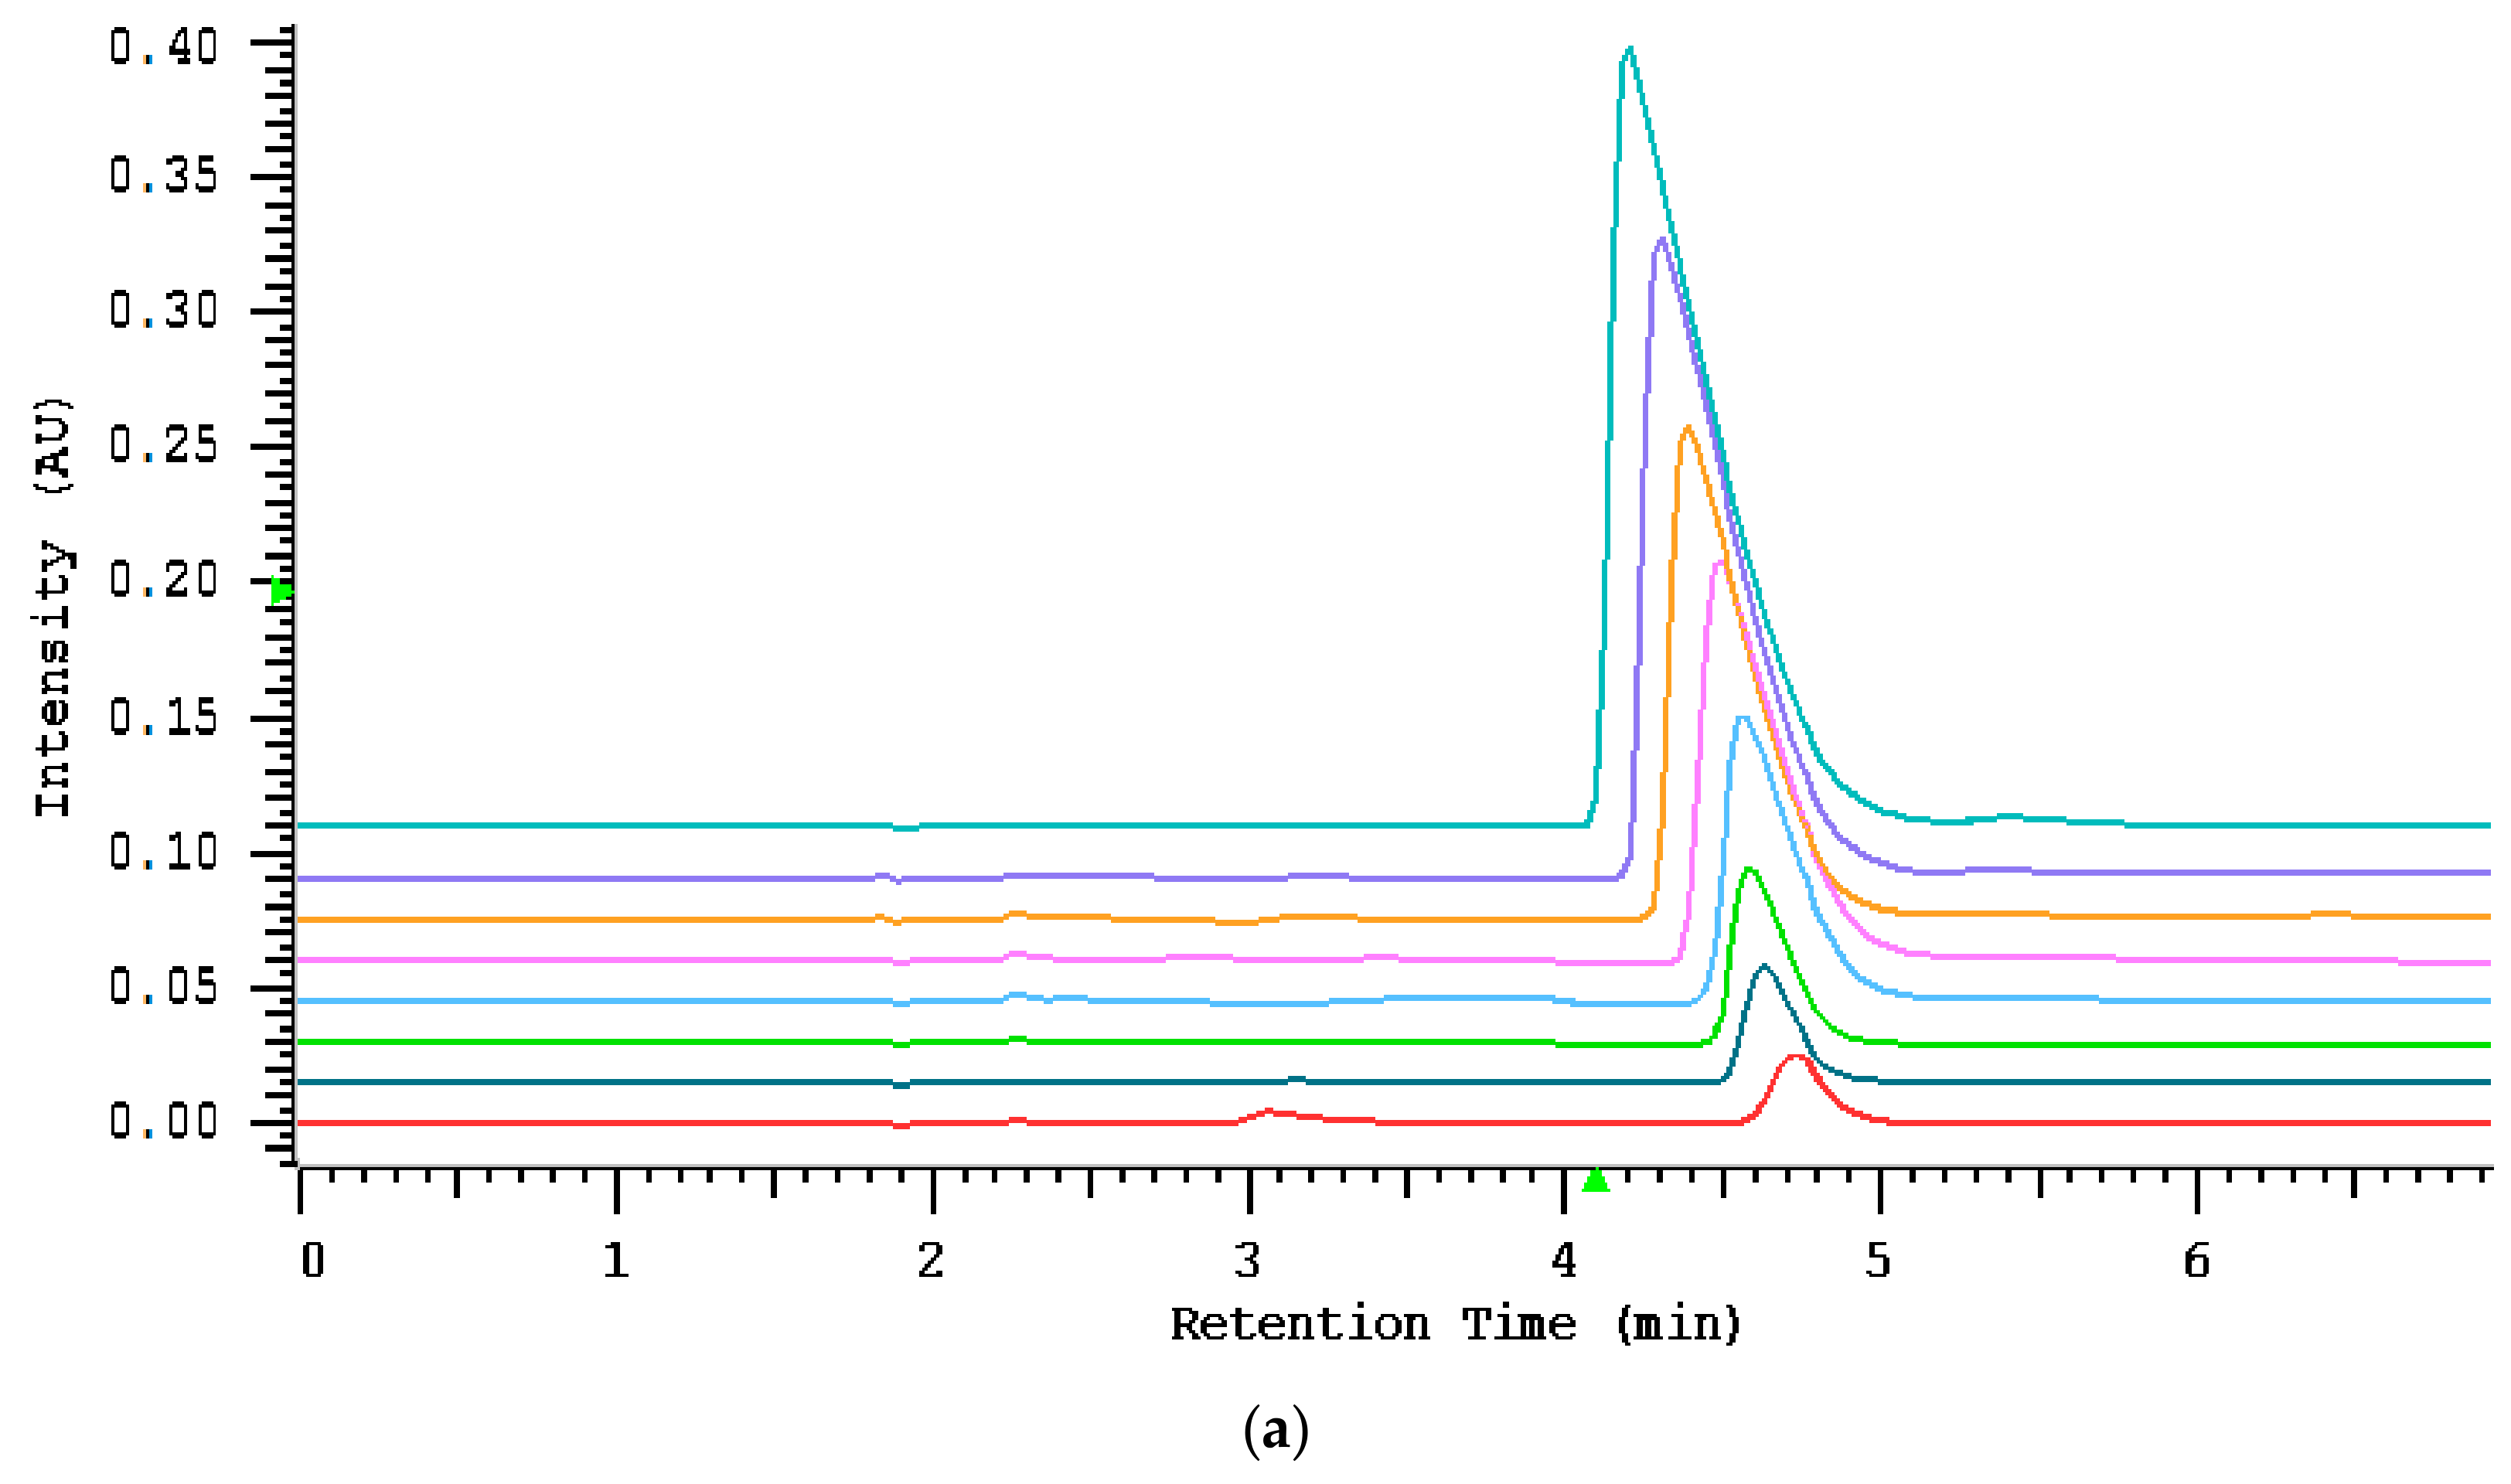
2.2. Loadability Studies
2.3. Validation Studies
2.3.1. Assay Characteristics
2.3.2. Stability of Salivary Thiocyanate
2.4. Quantitation of Salivary Thiocyanate
3. Materials and Methods
3.1. Materials
3.2. Demographic Characteristic
3.3. HPLC Analysis and Characterization
3.3.1. Mobile Phase Composition
3.3.2. The Sample Loading Capacity of Thiocyanate
3.3.3. Detection Wavelength and DAD Peak Identification
3.3.4. Data Analysis
3.4. Thiocyanate Spiked Saliva Sample Preparation
3.5. Data Analysis
4. Conclusions
Author Contributions
Funding
Conflicts of Interest
References
- Department of Health and Human Services, Public Health Service, Alcohol, Drug Abuse, and Mental Health Administration, National Institute on Drug Abuse. The Use of Biological Fluid Samples in Assessing Tobacco Smoke Consumption, (ADM) 83-1285; US Government Printing Office: Washington, DC, USA, 1983; pp. 1–6. Available online: https://archives.drugabuse.gov/sites/default/files/monograph48.pdf (accessed on 20 October 2019).
- Tenovuo, J.; Mäkinen, K.K. Concentration of thiocyanate and ionizable iodine in saliva of smokers and nonsmokers. J. Dent. Res. 1976, 55, 661–663. [Google Scholar] [CrossRef] [PubMed]
- Tenovuo, J. Clinical Chemistry and Microbioloy. In Human Saliva, 2nd ed.; CRC: Boca Raton, FL, USA, 1989. [Google Scholar]
- Pruitt, K.M.; Tenovuo, J. The Lactoperoxidase System: Chemical and Biological Significance; Dekker: New York, NY, USA, 1985. [Google Scholar]
- Rai, B.; Kharb, S.; Anand, S.C. Salivary enzymes and thiocynate: Salivary markers of periodontitis among smokers and non-smokers; a pilot study. Adv. Med. Dent. Sci. 2007, 1, 1–4. [Google Scholar]
- Calabrese, E.J. Multiple Chemical Interactions; Lewis: Chelsea, MI, USA, 1991. [Google Scholar]
- Ward, M.H. Too much of a good thing? Nitrate from nitrogen fertilizers and cancer. Rev. Environ. Health 2009, 24, 357–363. [Google Scholar] [CrossRef] [PubMed]
- Lee, H.-W.; Park, S.-H.; Weng, M.-W.; Wang, H.-T.; Huang, W.C.; Lepor, H.; Wu, X.-R.; Chen, L.-C.; Tang, M.-S. E-cig damages DNA in lung, heart, and bladder. Proc. Natl. Acad. Sci. USA 2018, 115, E1560–E1569. [Google Scholar] [CrossRef] [PubMed]
- Silverstein, P. Smoking and wound healing. Am. J. Med. 1977, 93. [Google Scholar] [CrossRef]
- Costagliola, C.; Cotticelli, L.; Menzione, M.; Rinaldi, M.; Russo, S.; Rinaldi, E. Red cell reduced glutathione and tobacco smoke-induced optic neuropathy. Metab. Pediatr. Syst. Ophthalmol. 1990, 13, 96–98. [Google Scholar]
- Fukayama, H.; Nasu, M.; Murakami, S.; Sugawara, M. Examination of antithyroid effects of smoking products in cultured thyroid follicles: Only thiocyanate is a potent antithyroid agent. Acta Endocrinol. (Copenh.) 1992, 127, 520–525. [Google Scholar] [CrossRef][Green Version]
- Hakim, R.B.; Tielsch, J.M. Maternal cigarette smoking during pregnancy. Arisk factor for childhood strabismus. Arch. Ophthalmol. 1992, 110, 1459–1462. [Google Scholar] [CrossRef]
- Mosely, L.H.; Finseth, F. Cigarette smoking: Impairment of digital blood flow and wound healing in the hand. Hand 1977, 9, 97–101. [Google Scholar] [CrossRef]
- Tsuge, K.; Kataoka, M.; Seto, Y. Cyanide and thiocyanate levels in blood and saliva of healthy adult volunteers. J. Health Sci. 2000, 46, 343–350. [Google Scholar] [CrossRef]
- Javaid, M.A.; Ahmed, A.S.; Durand, R.; Tran, S.D. Saliva as a diagnostic tool for oral and systemic diseases. J. Oral Biol. Craniofac. Res. 2016, 6, 66–75. [Google Scholar] [CrossRef] [PubMed]
- Bhattarai, K.R.; Lee, S.W.; Kim, S.H.; Kim, H.R.; Chae, H.J. Ixeris dentata extract regulates salivary secretion through the activation of aquaporin−5 and prevents diabetes-induced xerostomia. J. Exp. Pharmacol. 2017, 9, 81–91. [Google Scholar] [CrossRef] [PubMed]
- Bhattarai, K.R.; Lee, H.Y.; Kim, S.H.; Kim, H.R.; Chae, H.J. Ixeris dentata Extract Increases Salivary Secretion through the Regulation of Endoplasmic Reticulum Stress in a Diabetes-Induced Xerostomia Rat Model. Int. J. Mol. Sci. 2018, 19, 1059. [Google Scholar] [CrossRef] [PubMed]
- Degiampietro, P.; Peheim, E.; Drew, D.; Graf, H.; Colombo, J.P. Determination of thiocyanate in plasma and saliva without deproteinisation and its validation as a smoking parameter. J. Clin. Chem. Clin. Biochem. 1987, 25, 711–717. [Google Scholar] [CrossRef]
- Yamanaka, S.; Takaku, S.; Takaesu, Y.; Nishimura, M. Validity of salivary thiocyanate as an indicator of cyanide exposure from smoking. Bull. Tokyo Dent. Coll. 1991, 32, 157–163. [Google Scholar]
- Silva, J.J.S.; Farias, M.A.; Silva, V.L.; Montenegro, M.C.B.S.M.; Araújo, A.N.; Lavorante, A.F.; Paim, A.P.S. Spectrophotometric Determination of Thiocyanate in Human Saliva Employing Micropumping Multicommutation Flow System. Spectrosc. Lett. 2010, 43, 213–219. [Google Scholar] [CrossRef]
- Blum, J.W.; Morel, C.; Hammon, H.M.; Bruckmaier, R.M.; Jaggy, A.; Zurbriggen, A.; Jungi, T. High constitutional nitrate status in young cattle. Comp. Biochim. Phys. A 2001, 130, 271–282. [Google Scholar] [CrossRef]
- Owen-Smith, B.; Quiney, J.; Read, J. Salivary urate in gout, exercise, and diurnal variation. Lancet 1998, 351, 1932. [Google Scholar] [CrossRef]
- Moorcroft, M.J.; Davis, J.; Compton, R.G. Detection and determination of nitrate and nitrite: A review. Talanta 2001, 54, 785–803. [Google Scholar] [CrossRef]
- Zappacosta, B.; Persichilli, S.; Sole, P.D.; Mordente, A.; Giardina, B. Effect of smoking one cigarette on antioxidant metabolites in the saliva of healthy smokers. Arch. Oral Biol. 1999, 44, 485–488. [Google Scholar] [CrossRef]
- Themelis, D.G.; Tzanavaras, P. Solvent extraction flow-injection manifold for the simultaneous spectrophotometric determination of free cyanide and thiocyanate ions based upon on-line masking of cyanides by formaldehyde. Anal. Chim. Acta 2002, 452, 295–302. [Google Scholar] [CrossRef]
- Helaleh, M.I.H.; Korenaga, T. Ion chromatographic method for simultaneous determination of nitrate and nitrite in human saliva. J. Chromatogr. B 2000, 744, 433–437. [Google Scholar] [CrossRef]
- Yu, B.-S.; Chen, P.; Nie, L.-H.; Yao, S.-Z. Simultaneous determination of nitrate and nitrite in saliva and foodstuffs by non-suppressed ion chromatography with bulk acoustic wave detector. Anal. Sci. 2001, 17, 495–498. [Google Scholar] [CrossRef] [PubMed]
- Kochańska, B.; Smoleński, R.T.; Knap, N. Determination of adenine nucleotides and their metabolites in human saliva. Acta. Biochim. Pol. 2000, 47, 877–879. [Google Scholar]
- Inoue, K.; Namiki, T.; Iwasaki, Y.; Yoshimura, Y.; Nakazawa, H. Determination of uric acid in human saliva by high-performance liquid chromatography with amperometric electrochemical detection. J. Chromatogr. B 2003, 785, 57–63. [Google Scholar] [CrossRef]
- Mori, M.; Hu, W.; Fritz, J.S.; Tsue, H.; Kaneta, T.; Tanaka, S. Determination of inorganic anions in human saliva by zwitterionic micellar capillary electrophoresis. Fresenius J. Anal. Chem. 2001, 370, 429–433. [Google Scholar] [CrossRef]
- Sádecká, J.; Polonský, J. Determination of inorganic anions in saliva by capillary isotachophoresis. Talanta 2003, 59, 643–649. [Google Scholar] [CrossRef]
- Miyado, T.; Nagai, H.; Takeda, S.; Saito, K.; Fukushi, K.; Yoshida, Y.; Wakida, S.; Niki, E. Development of a novel running buffer for the simultaneous determination of nitrate and nitrite in human serum by capillary zone electrophoresis. J. Chromatogr. A 2003, 1014, 197–202. [Google Scholar] [CrossRef]
- Tanaka, Y.; Naruishi, N.; Fukuya, H.; Sakata, J.; Saito, K.; Wakida, S. Simultaneous determination of nitrite, nitrate, thiocyanate and uric acid in human saliva by capillary zone electrophoresis and its application to the study of daily variations. J. Chromatogr. A 2004, 1051, 193–197. [Google Scholar] [CrossRef]
- Flieger, J.; Trębacz, H.; Pizoń, M.; Plazińska, A.; Plaziński, W.; Kowalska, A.; Szczęsna, A.; Plech, T. Thermodynamic study of new antiepileptic compounds by combining chromatography on the phosphatidylcholine biomimetic stationary phase and differential scanning calorimetry. J. Sep. Sci. 2019. [CrossRef]
- Tsopelas, F.; Vallianatou, T.; Tsantili-Kakoulidou, A. The potential of immobilized artificial membrane chromatography to predict human oral absorption. Eur. J. Pharm. Sci. 2016, 81, 82–93. [Google Scholar] [CrossRef] [PubMed]
- Sun, J.; Wu, X.; Lu, R.; Wang, Y.; He, Z. Relationship between immobilized artificial membrane chromatographic retention and thebrain penetration of structurally diverse drugs. Curr. Drug Metab. 2008, 9, 152–166. [Google Scholar] [PubMed]
- Hu, W.; Haddad, P.R.; Tanaka, K.; Mori, M.; Tekura, K.; Hase, K.; Ohno, M.; Kamo, N. Creation and characteristics of phosphatidylcholine stationary phases for the chromatographic separation of inorganic anions. J. Chromatogr. A 2003, 997, 237–242. [Google Scholar] [CrossRef]
- Tatarczak-Michalewska, M.; Flieger, J.; Kawka, J.; Flieger, W.; Blicharska, E. HPLC-DAD Determination of Iodide in Mineral Waters on Phosphatidylcholine Column. Molecules 2019, 24, 1243. [Google Scholar] [CrossRef]
- Tatarczak-Michalewska, M.; Flieger, J.; Kawka, J.; Płaziński, W.; Flieger, W.; Blicharska, E.; Majerek, D. HPLC-DAD Determination of Nitrite and Nitrate in Human Saliva Utilizing a Phosphatidylcholine Column. Molecules 2019, 24, 1754. [Google Scholar] [CrossRef]
- Buratti, M.; Xaiz, D.; Caravelli, G.; Colombi, A. Validation of urinary thiocyanate as a biomarker of tobacco smoking. Biomarkers 1997, 2, 81–85. [Google Scholar] [CrossRef]
- Naumowicz, M.; Figaszewski, Z.A.; Poltorak, Ł. Electrochemical impedance spectroscopy as a useful method for examination of the acid–base equilibria at interface separating electrolyte solution and phosphatidylcholine bilayer. Electrochim. Acta. 2013, 91, 367–372. [Google Scholar] [CrossRef]
- Scott, R.P.W.; Kucera, P. Some aspects of preparative-scale liquid chromatography. J. Chromatogr. 1976, 119, 467–482. [Google Scholar] [CrossRef]
- Snyder, L.R. Column efficiency in liquid-solid adsorption chromatography. H.E.T.P. [height equivalent to a theoretical plate] values as a function of separation conditions. Anal. Chem. 1967, 39, 698–704. [Google Scholar] [CrossRef]
- Beck, W.; Halasz, I. Präparative Hochdruck-Flüssigkeits-Chromatographie mit Teilchengrößen zwischen 10 μ und 40 μ (Kieselgel und Umkehrphase C18). Fresenius Z. Anal. Chem. 1978, 291, 340–348. [Google Scholar] [CrossRef]
- Roumeliotis, T.; Unger, K.K. Preparative separation of proteins and enzymes in the mean molecular-weight range of 10,000–100,000 LiChrosorb diol® packing by high-performance size-exclusion chromatography. J. Chromatogr. 1979, 185, 445–452. [Google Scholar] [CrossRef]
- U.S. Department of Health and Human Services, Food and Drug Administration. Guidance for Industry, Bioanalytical Method Validation, Draft Guidance. 2013. Available online: http://www.fda.gov/downloads/drugs/guidancecomplianceregulatoryinformation/guidances/ucm368107.pdf (accessed on 20 October 2019).
- European Medicines Agency. Comittee for Medicinal Product for Human Use, Guideline on bioanalytical method validation. 2011. Available online: http://www.ema.europa.eu/docs/en GB/document library/Scientific guideline/2011/08/WC500109686.pdf (accessed on 20 October 2019).
- Konieczka, P.; Namieśnik, J. Quality Assurance and Quality Control in the Analytical Chemistry Laboratory; CRC Press: Boca Raton, FL, USA, 2018. [Google Scholar]
- Bourdoux, P.P. Measurement of thiocyanate in serum and urine yields different information. J. Anal. Toxicol. 1995, 19, 127. [Google Scholar] [CrossRef] [PubMed]
Sample Availability: Samples of the compounds are not available from the authors. |


| Concentration (mg L−1) | Recovery (%) | CV (%) |
|---|---|---|
| 5 | 90.04 | 4.56 |
| 50 | 95.62 | 2.49 |
| 100 | 97.80 | 1.82 |
| Sample (Room Temperature) | Contents Measured [mg L−1] Mean ± S.D. | Relative Bias * (%) | Sample (Refrigerator) | Contents Measured [mg L−1] Mean ± S.D. | Relative Bias * (%) |
|---|---|---|---|---|---|
| a | 56.50 (±0.05) | - | a | 61.48 (±0.04) | - |
| b | 55.01 (±0.07) | −2.64 | b | 57.10 (±0.03) | −7.12 |
| c | 52.98 (±0.07) | −6.23 | c | 56.73 (±0.02) | −7.72 |
| d | 49.44 (±0.03) | −12.50 | d | 53.30 (±0.06) | −13.30 |
| Linear Regression Equation (y = ax + b) | ||||
|---|---|---|---|---|
| Slope (a ± sa) | Intercept (b ± sb) | Correlation Coefficient (R2) | the Standard Error of Estimate (se) | Fisher F Statistic (F) |
| Nonsmokers | ||||
| 7765.25 ± 114.21 | 32065.34 ± 6076.07 | 0.9984 | 11334.56 | 4623.15 |
| 7300.85 ± 92.94 | 72539.61 ± 4944.84 | 0.9988 | 9224.32 | 6170.42 |
| 7958.12 ± 128.84 | 42278.48 ± 6854.81 | 0.9981 | 12787.25 | 3815.06 |
| 7595.09 ± 135.17 | 41417.86 ± 7191.65 | 0.9978 | 13415.62 | 3157.04 |
| 7780.22 ± 65.14 | 69607.38 ± 3465.93 | 0.9995 | 6465.51 | 14263.12 |
| 8002.64 ± 70.26 | 60983.62 ± 3737.99 | 0.9995 | 6973.02 | 12973.60 |
| 7921.36 ± 104.08 | 73983.28 ± 5537.50 | 0.9988 | 10329.89 | 5792.21 |
| 8073.65 ± 33.28 | 67012.04 ± 1770.70 | 0.9998 | 3303.15 | 58846.43 |
| Tobacco Smokers | ||||
| 7809.52 ± 65.50 | 118360.34 ± 3484.88 | 0.9995 | 6500.86 | 14214.89 |
| 7775.82 ± 44.58 | 118561.55 ± 2372.04 | 0.9998 | 4424.92 | 30417.55 |
| 7971.41 ± 39.05 | 136039.10 ± 2077.91 | 0.9998 | 3876.22 | 41657.09 |
| 7803.99 ± 135.38 | 182913.64 ± 7202.95 | 0.9979 | 13436.71 | 3322.65 |
| 6874.31 ± 111.77 | 137752.34 ± 5946.72 | 0.9981 | 11093.28 | 3782.46 |
| 6958.16 ± 73.98 | 142008.39 ± 3935.97 | 0.9992 | 7342.35 | 8846.17 |
| 7983.35 ± 56.65 | 137911.51 ± 3014.14 | 0.9996 | 5622.72 | 19856.98 |
| 7930.19 ± 63.41 | 156159.97 ± 3373.81 | 0.9995 | 6293.65 | 15638.61 |
| e-Cigarette Smokers | ||||
| 7778.52 ± 24.39 | 183659.60 ± 1297.89 | 0.9999 | 2421.14 | 101668.97 |
| 7890.01 ± 130.91 | 200175.71 ± 6965.19 | 0.9981 | 12993.17 | 3632.13 |
| 7539.40 ± 83.05 | 121734.70 ± 4418.33 | 0.9992 | 8242.15 | 8241.93 |
| 7727.04 ± 130.85 | 117098.02 ± 6962.03 | 0.9980 | 12987.27 | 3486.79 |
| 7857.74 ± 93.31 | 206405.09 ± 4964.52 | 0.9990 | 9261.04 | 7091.07 |
| 7677.98 ± 86.58 | 165317.86 ± 4606.57 | 0.9991 | 8593.30 | 7863.41 |
| 7868.81 ± 34.81 | 140711.23 ± 1851.83 | 0.9999 | 3454.50 | 51107.37 |
| 7846.51 ± 45.22 | 239426.03 ± 2405.84 | 0.9998 | 4487.95 | 30108.72 |
| Std. Error of Regression | Point Prediction | t (alpha10%) | St. Error of Prediction | Margin of Error | Lower Bound | Upper Bound |
|---|---|---|---|---|---|---|
| nonsmokers | ||||||
| 1.5738 | 4.1293 | 0.9236 | 1.8407 | 1.7 | 2.4293 | 5.8293 |
| 1.2903 | 9.9358 | 0.9236 | 1.545 | 1.4269 | 8.5089 | 11.3627 |
| 1.7287 | 5.3126 | 0.9236 | 2.0312 | 1.876 | 3.4366 | 7.1886 |
| 1.8347 | 5.4532 | 0.9236 | 2.1569 | 1.9921 | 3.4611 | 7.4453 |
| 0.849 | 8.9467 | 0.9236 | 1.0124 | 0.9351 | 8.0116 | 9.8818 |
| 0.9383 | 7.6204 | 0.9236 | 1.1129 | 1.0279 | 6.5925 | 8.6483 |
| 1.3886 | 9.3397 | 0.9236 | 1.6585 | 1.5318 | 7.8079 | 10.8715 |
| 0.4412 | 8.3001 | 0.9236 | 0.5247 | 0.4846 | 7.8155 | 8.7847 |
| tobacco smokers | ||||||
| 0.7833 | 15.1559 | 0.9236 | 0.9591 | 0.8859 | 14.27 | 16.0418 |
| 0.517 | 15.2475 | 0.9236 | 0.6334 | 0.585 | 14.66247 | 15.83247 |
| 0.5233 | 17.0659 | 0.9236 | 0.6462 | 0.5969 | 16.46898 | 17.66278 |
| 1.8086 | 23.4385 | 0.9236 | 2.299 | 2.1233 | 21.31518 | 25.56178 |
| 1.741 | 20.0387 | 0.9236 | 2.1787 | 2.0122 | 18.02652 | 22.05092 |
| 1.057 | 20.4089 | 0.9236 | 1.3252 | 1.224 | 19.1849 | 21.6329 |
| 0.7528 | 17.2749 | 0.9236 | 0.9306 | 0.8595 | 16.41539 | 18.13439 |
| 0.7707 | 19.6918 | 0.9236 | 0.9632 | 0.8896 | 18.80223 | 20.58143 |
| e-cigarette smokers | ||||||
| 0.3359 | 23.6111 | 0.9236 | 0.4275 | 0.3948 | 23.2163 | 24.0059 |
| 1.5938 | 25.3708 | 0.9236 | 2.0445 | 1.8883 | 23.4825 | 27.2591 |
| 1.1385 | 16.1465 | 0.9236 | 1.4002 | 1.2932 | 14.8533 | 17.4397 |
| 1.7981 | 15.1543 | 0.9236 | 2.2014 | 2.0332 | 13.1211 | 17.1875 |
| 1.2701 | 26.2677 | 0.9236 | 1.6363 | 1.5113 | 24.7564 | 27.7790 |
| 1.11 | 21.5314 | 0.9236 | 1.3988 | 1.2919 | 20.2395 | 22.8233 |
| 0.4709 | 17.8821 | 0.9236 | 0.5837 | 0.5391 | 17.3430 | 18.4212 |
| 0.6177 | 30.5137 | 0.9236 | 0.8123 | 0.7502 | 29.7635 | 31.2639 |
| Nonsmokers | Tobacco Smokers | e-Cigarette Smokers | |||
|---|---|---|---|---|---|
| Mean ± S.D. [mg L−1] | Concentration Range [mg L−1] | Mean ± S.D. [mg L−1] | Concentration Range [mg L−1] | Mean ± S.D. [mg L−1] | Concentration Range [mg L−1] |
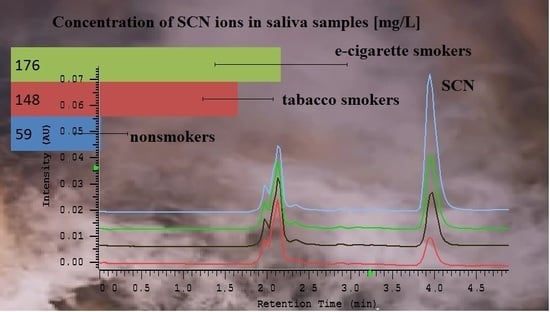
| 59.04 ± 17.18 | 33.03−79.49 | 148.32 ± 22.82 | 121.25−187.54 | 176.46 ± 43.09 | 121.24−244.11 |
© 2019 by the authors. Licensee MDPI, Basel, Switzerland. This article is an open access article distributed under the terms and conditions of the Creative Commons Attribution (CC BY) license (http://creativecommons.org/licenses/by/4.0/).
Share and Cite
Flieger, J.; Kawka, J.; Tatarczak-Michalewska, M. Levels of the Thiocyanate in the Saliva of Tobacco Smokers in Comparison to e-Cigarette Smokers and Nonsmokers Measured by HPLC on a Phosphatidylcholine Column. Molecules 2019, 24, 3790. https://doi.org/10.3390/molecules24203790
Flieger J, Kawka J, Tatarczak-Michalewska M. Levels of the Thiocyanate in the Saliva of Tobacco Smokers in Comparison to e-Cigarette Smokers and Nonsmokers Measured by HPLC on a Phosphatidylcholine Column. Molecules. 2019; 24(20):3790. https://doi.org/10.3390/molecules24203790
Chicago/Turabian StyleFlieger, Jolanta, Justyna Kawka, and Małgorzata Tatarczak-Michalewska. 2019. "Levels of the Thiocyanate in the Saliva of Tobacco Smokers in Comparison to e-Cigarette Smokers and Nonsmokers Measured by HPLC on a Phosphatidylcholine Column" Molecules 24, no. 20: 3790. https://doi.org/10.3390/molecules24203790
APA StyleFlieger, J., Kawka, J., & Tatarczak-Michalewska, M. (2019). Levels of the Thiocyanate in the Saliva of Tobacco Smokers in Comparison to e-Cigarette Smokers and Nonsmokers Measured by HPLC on a Phosphatidylcholine Column. Molecules, 24(20), 3790. https://doi.org/10.3390/molecules24203790


