
Butyl Methacrylate-Co-Ethylene Glycol Dimethacrylate Monolith for Online in-Tube SPME-UHPLC-MS/MS to Determine Chlopromazine, Clozapine, Quetiapine, Olanzapine, and Their Metabolites in Plasma Samples


Abstract
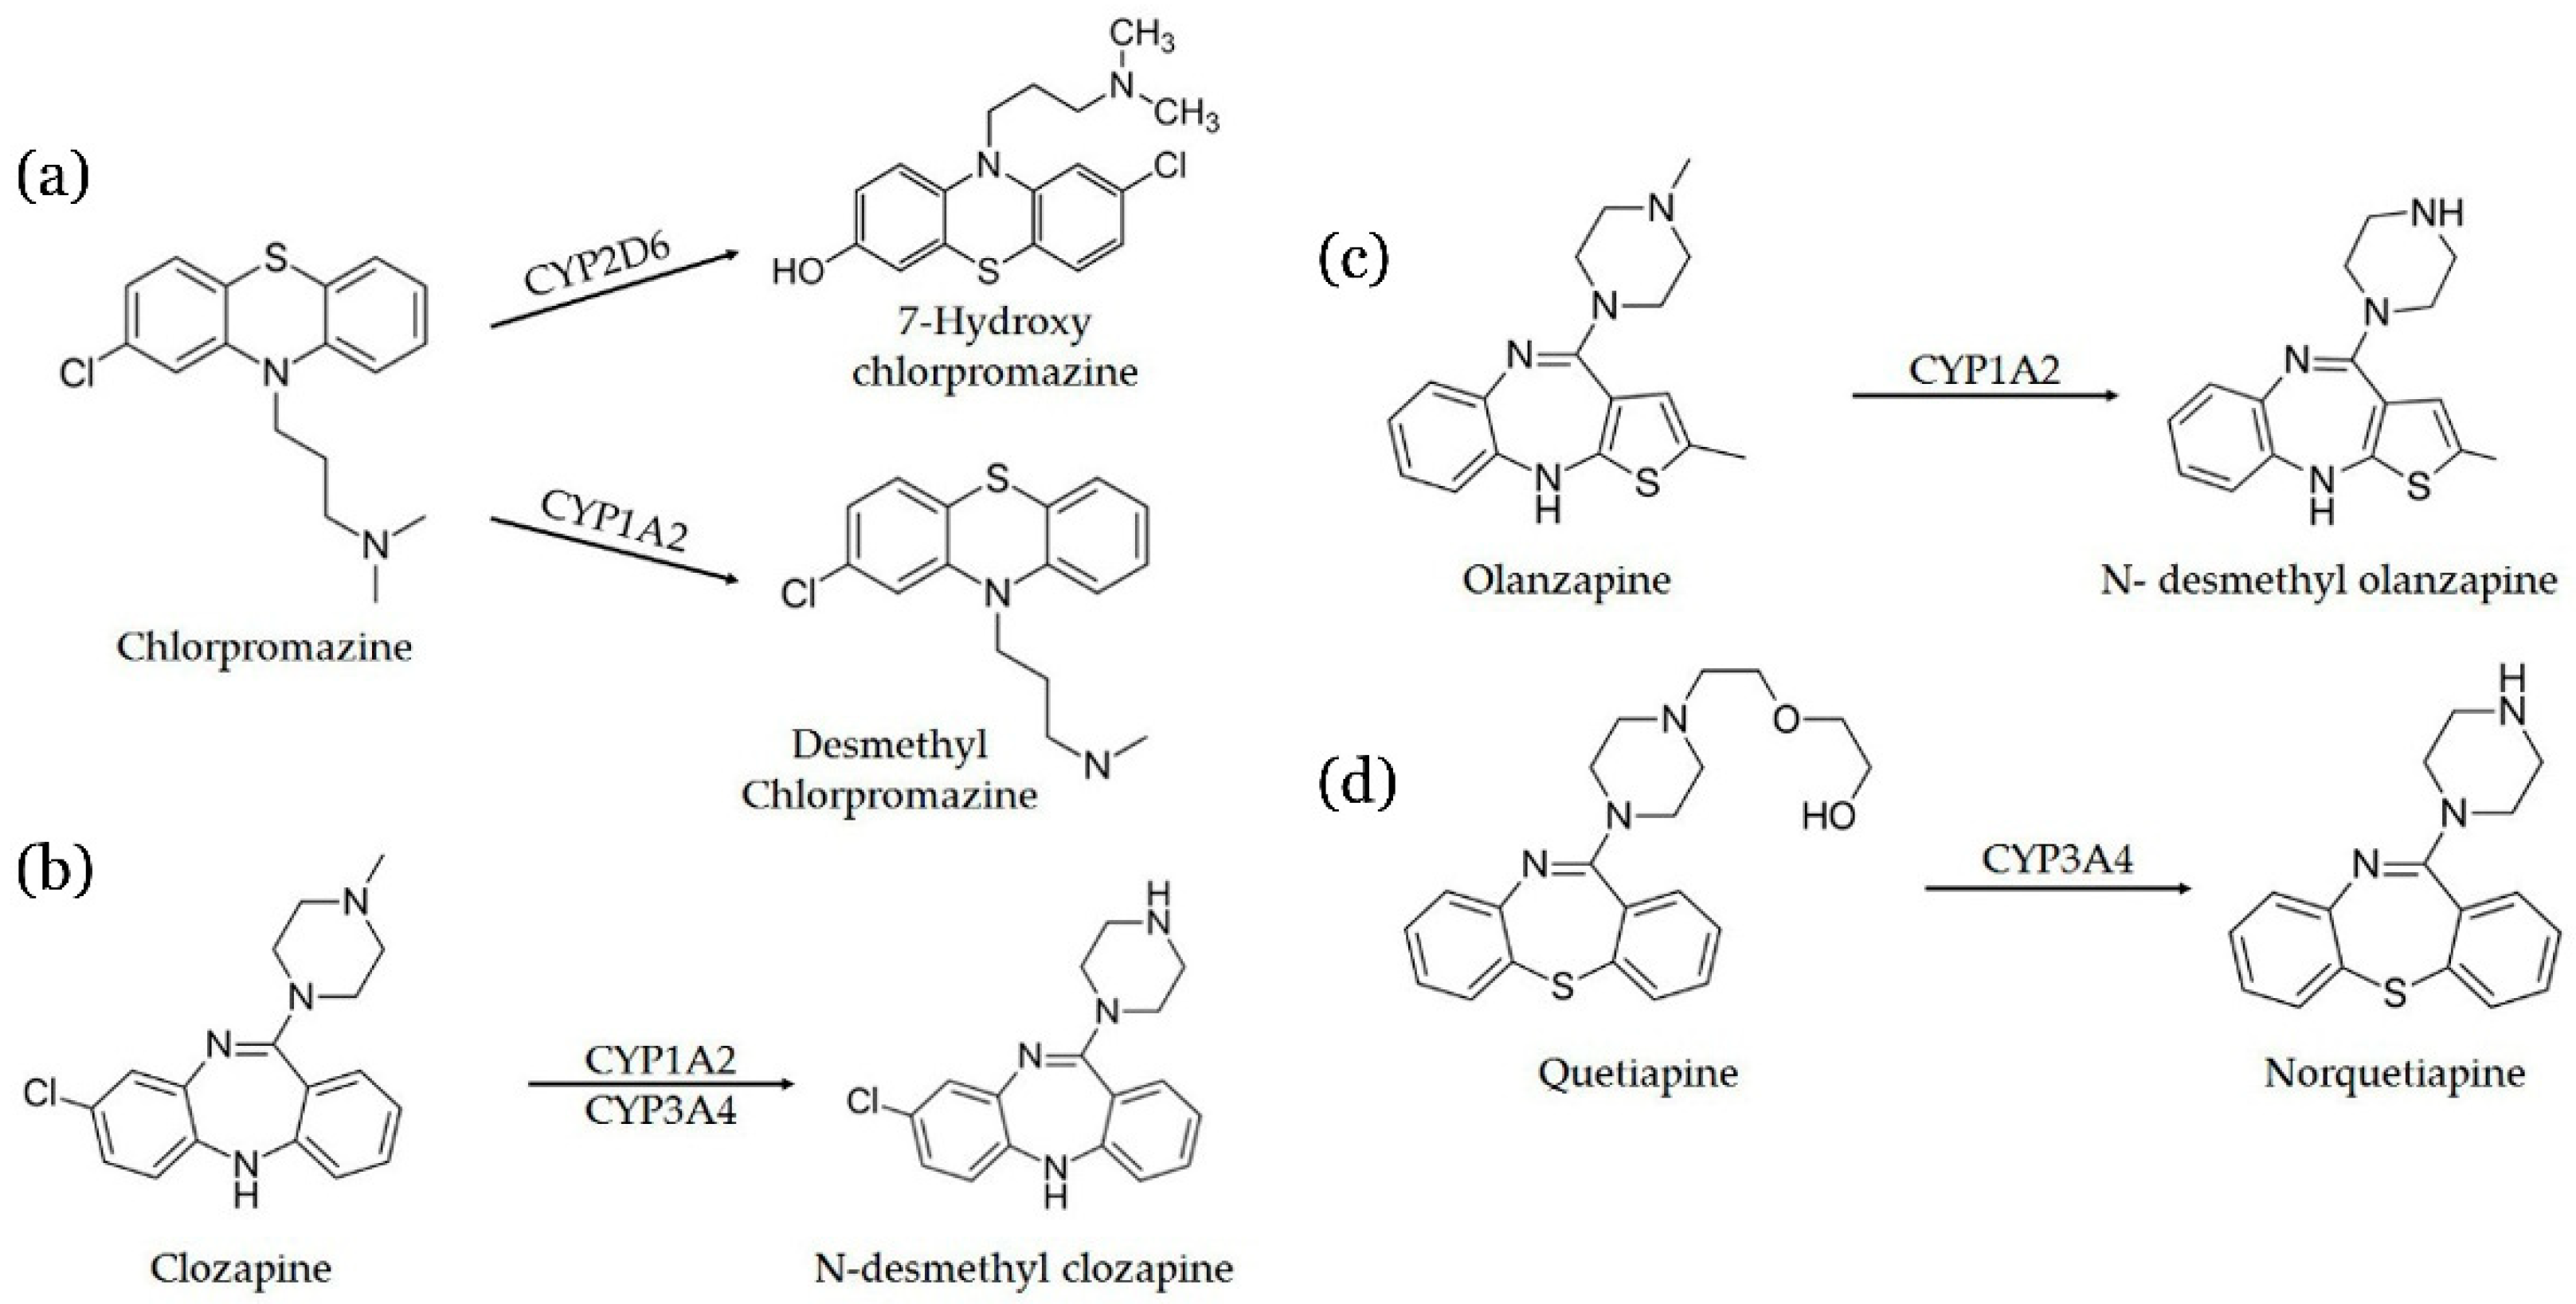
1. Introduction
2. Results and Discussion
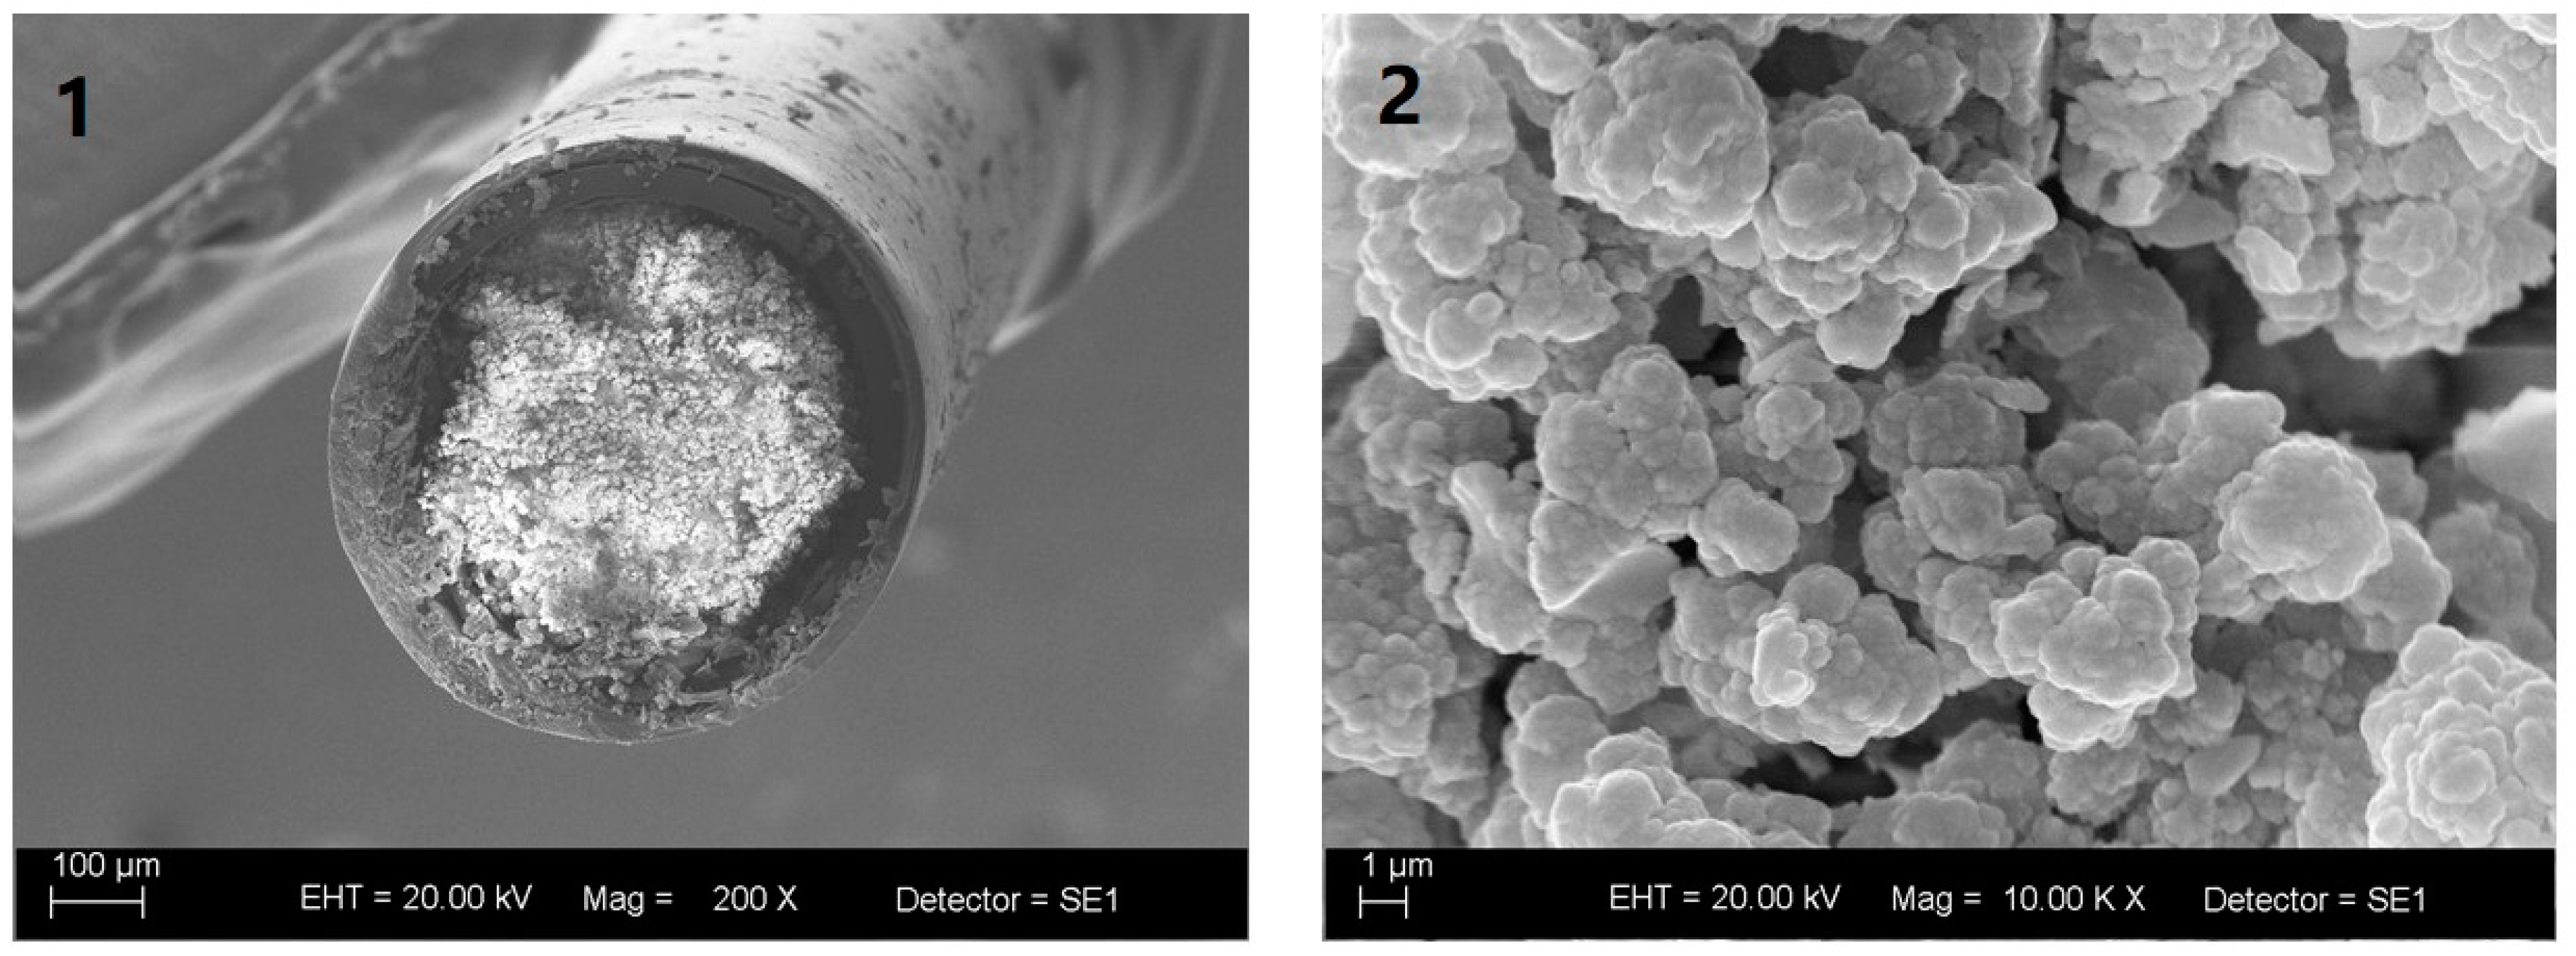
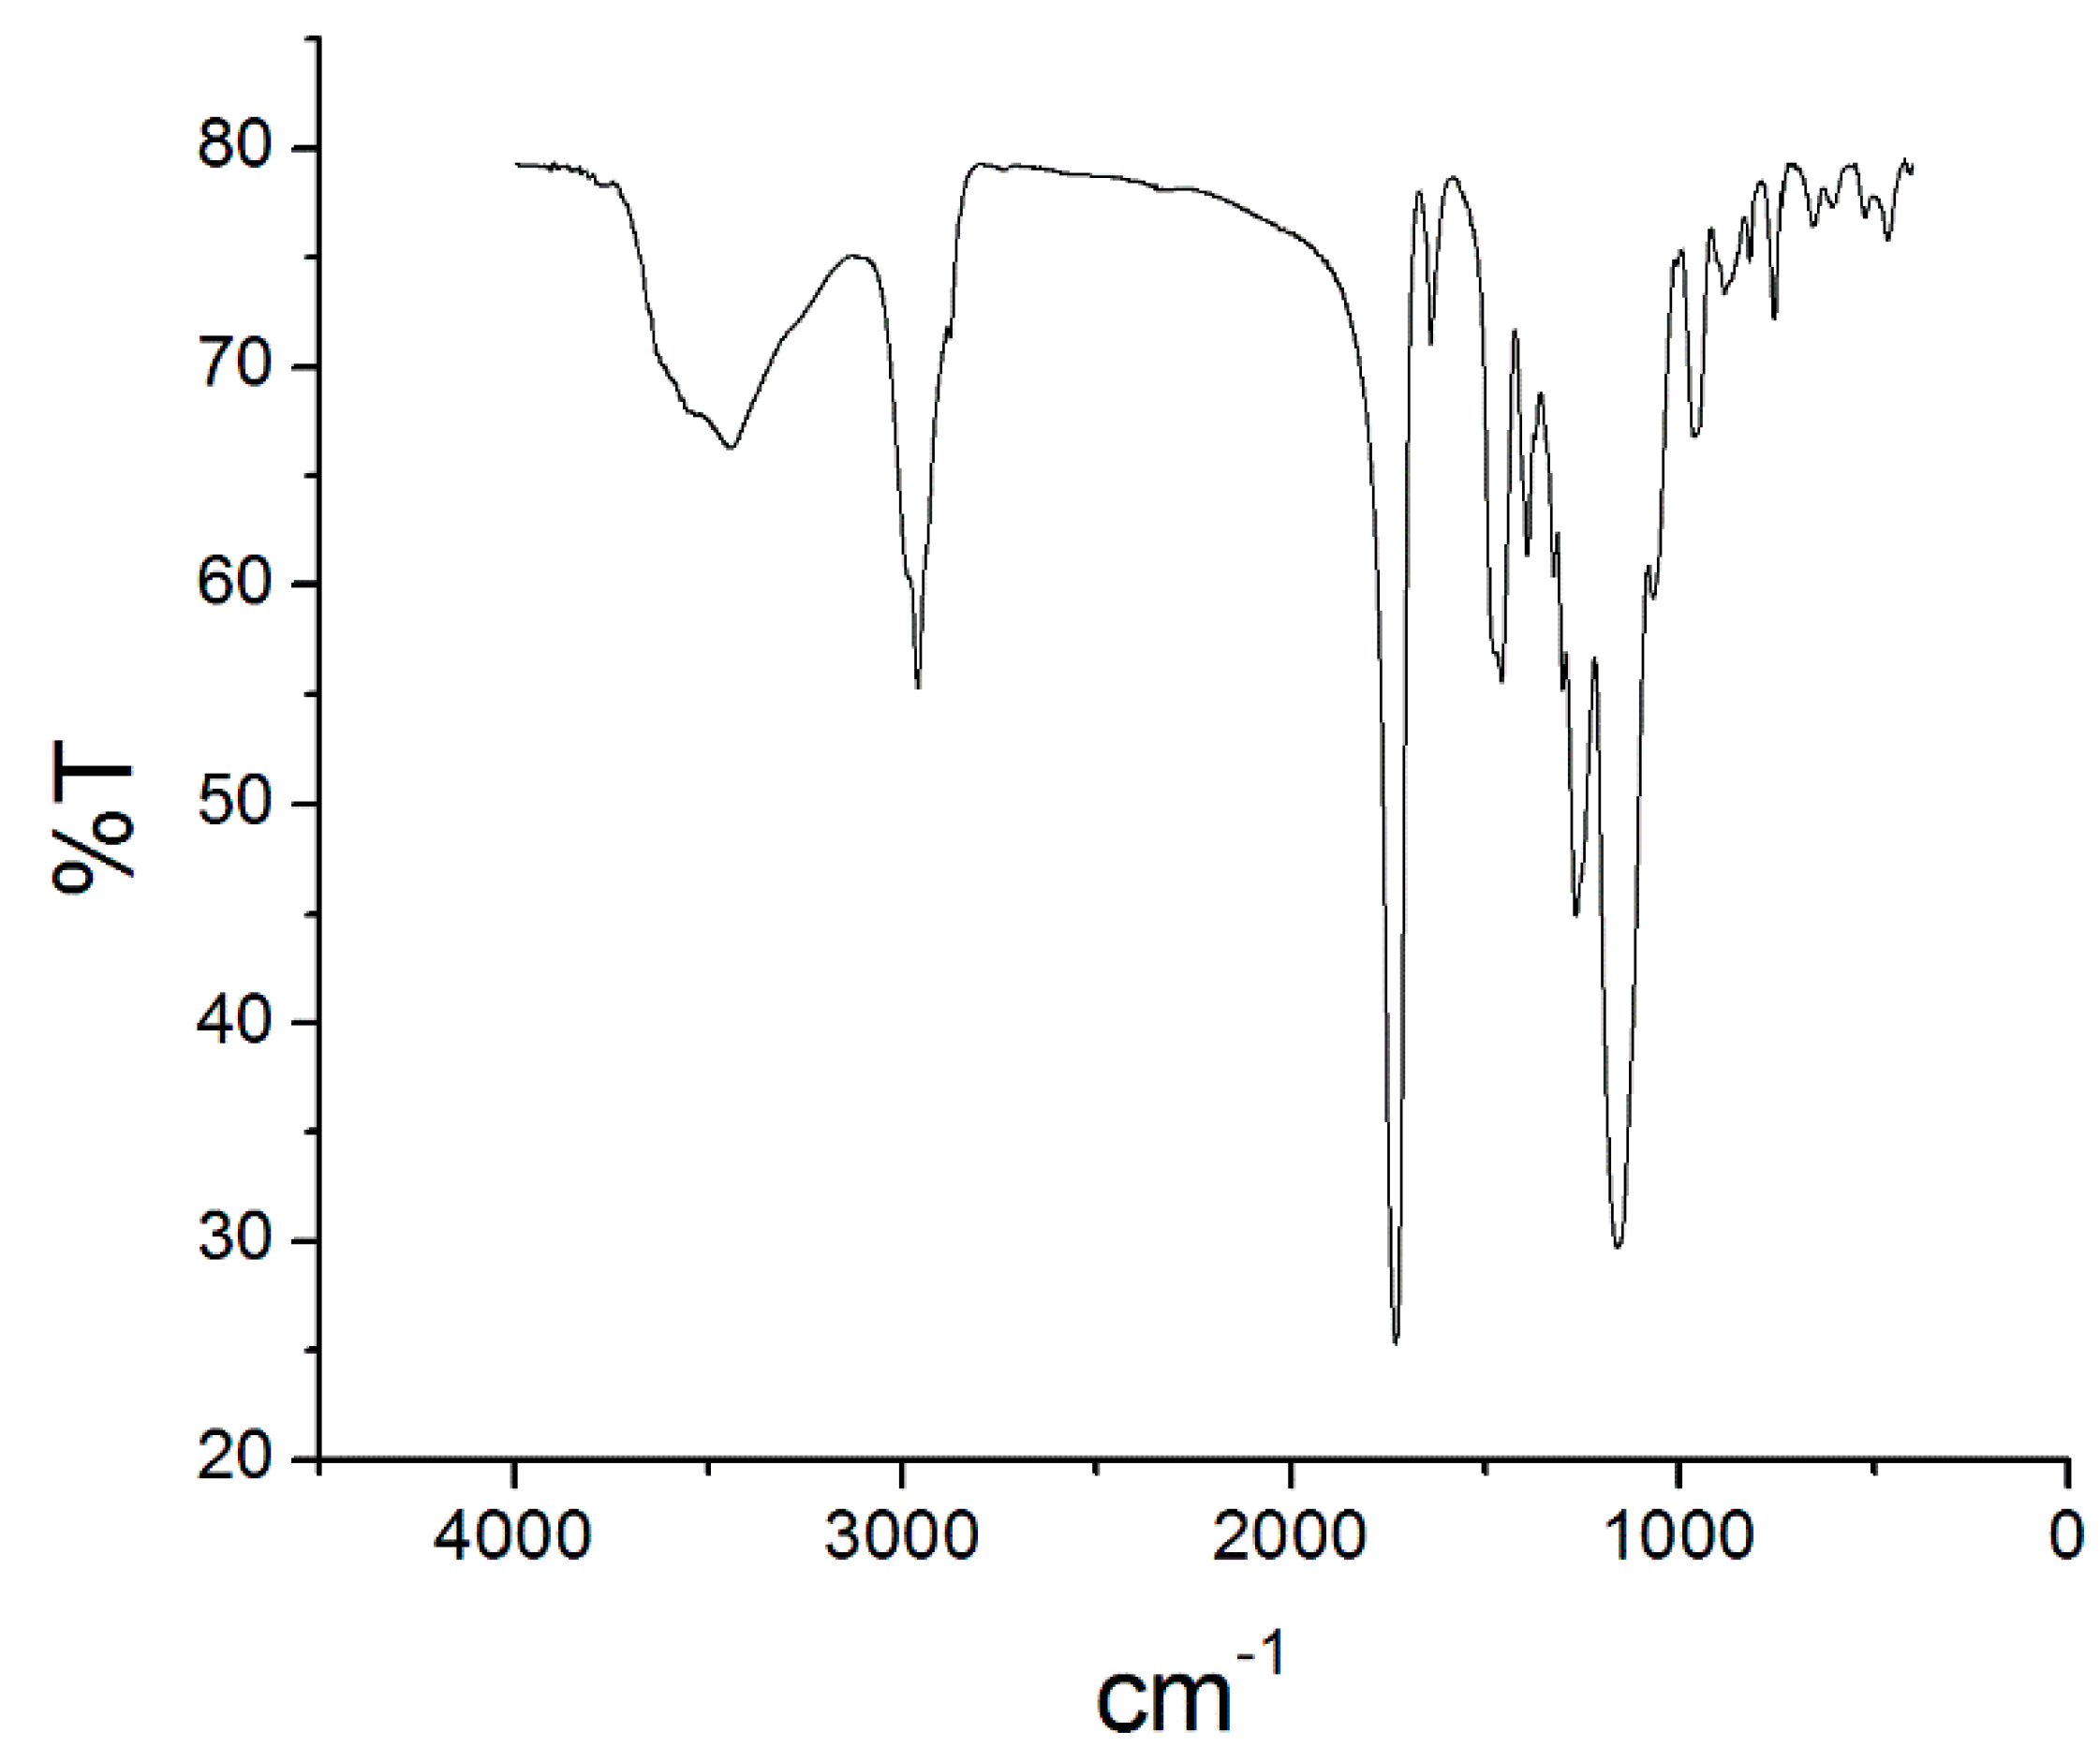
2.1. Organic Poly(Butyl Methacrylate-Co-Ethylene Glycol Dimethacrylate) Monolith Capillary Preparation and Characterization
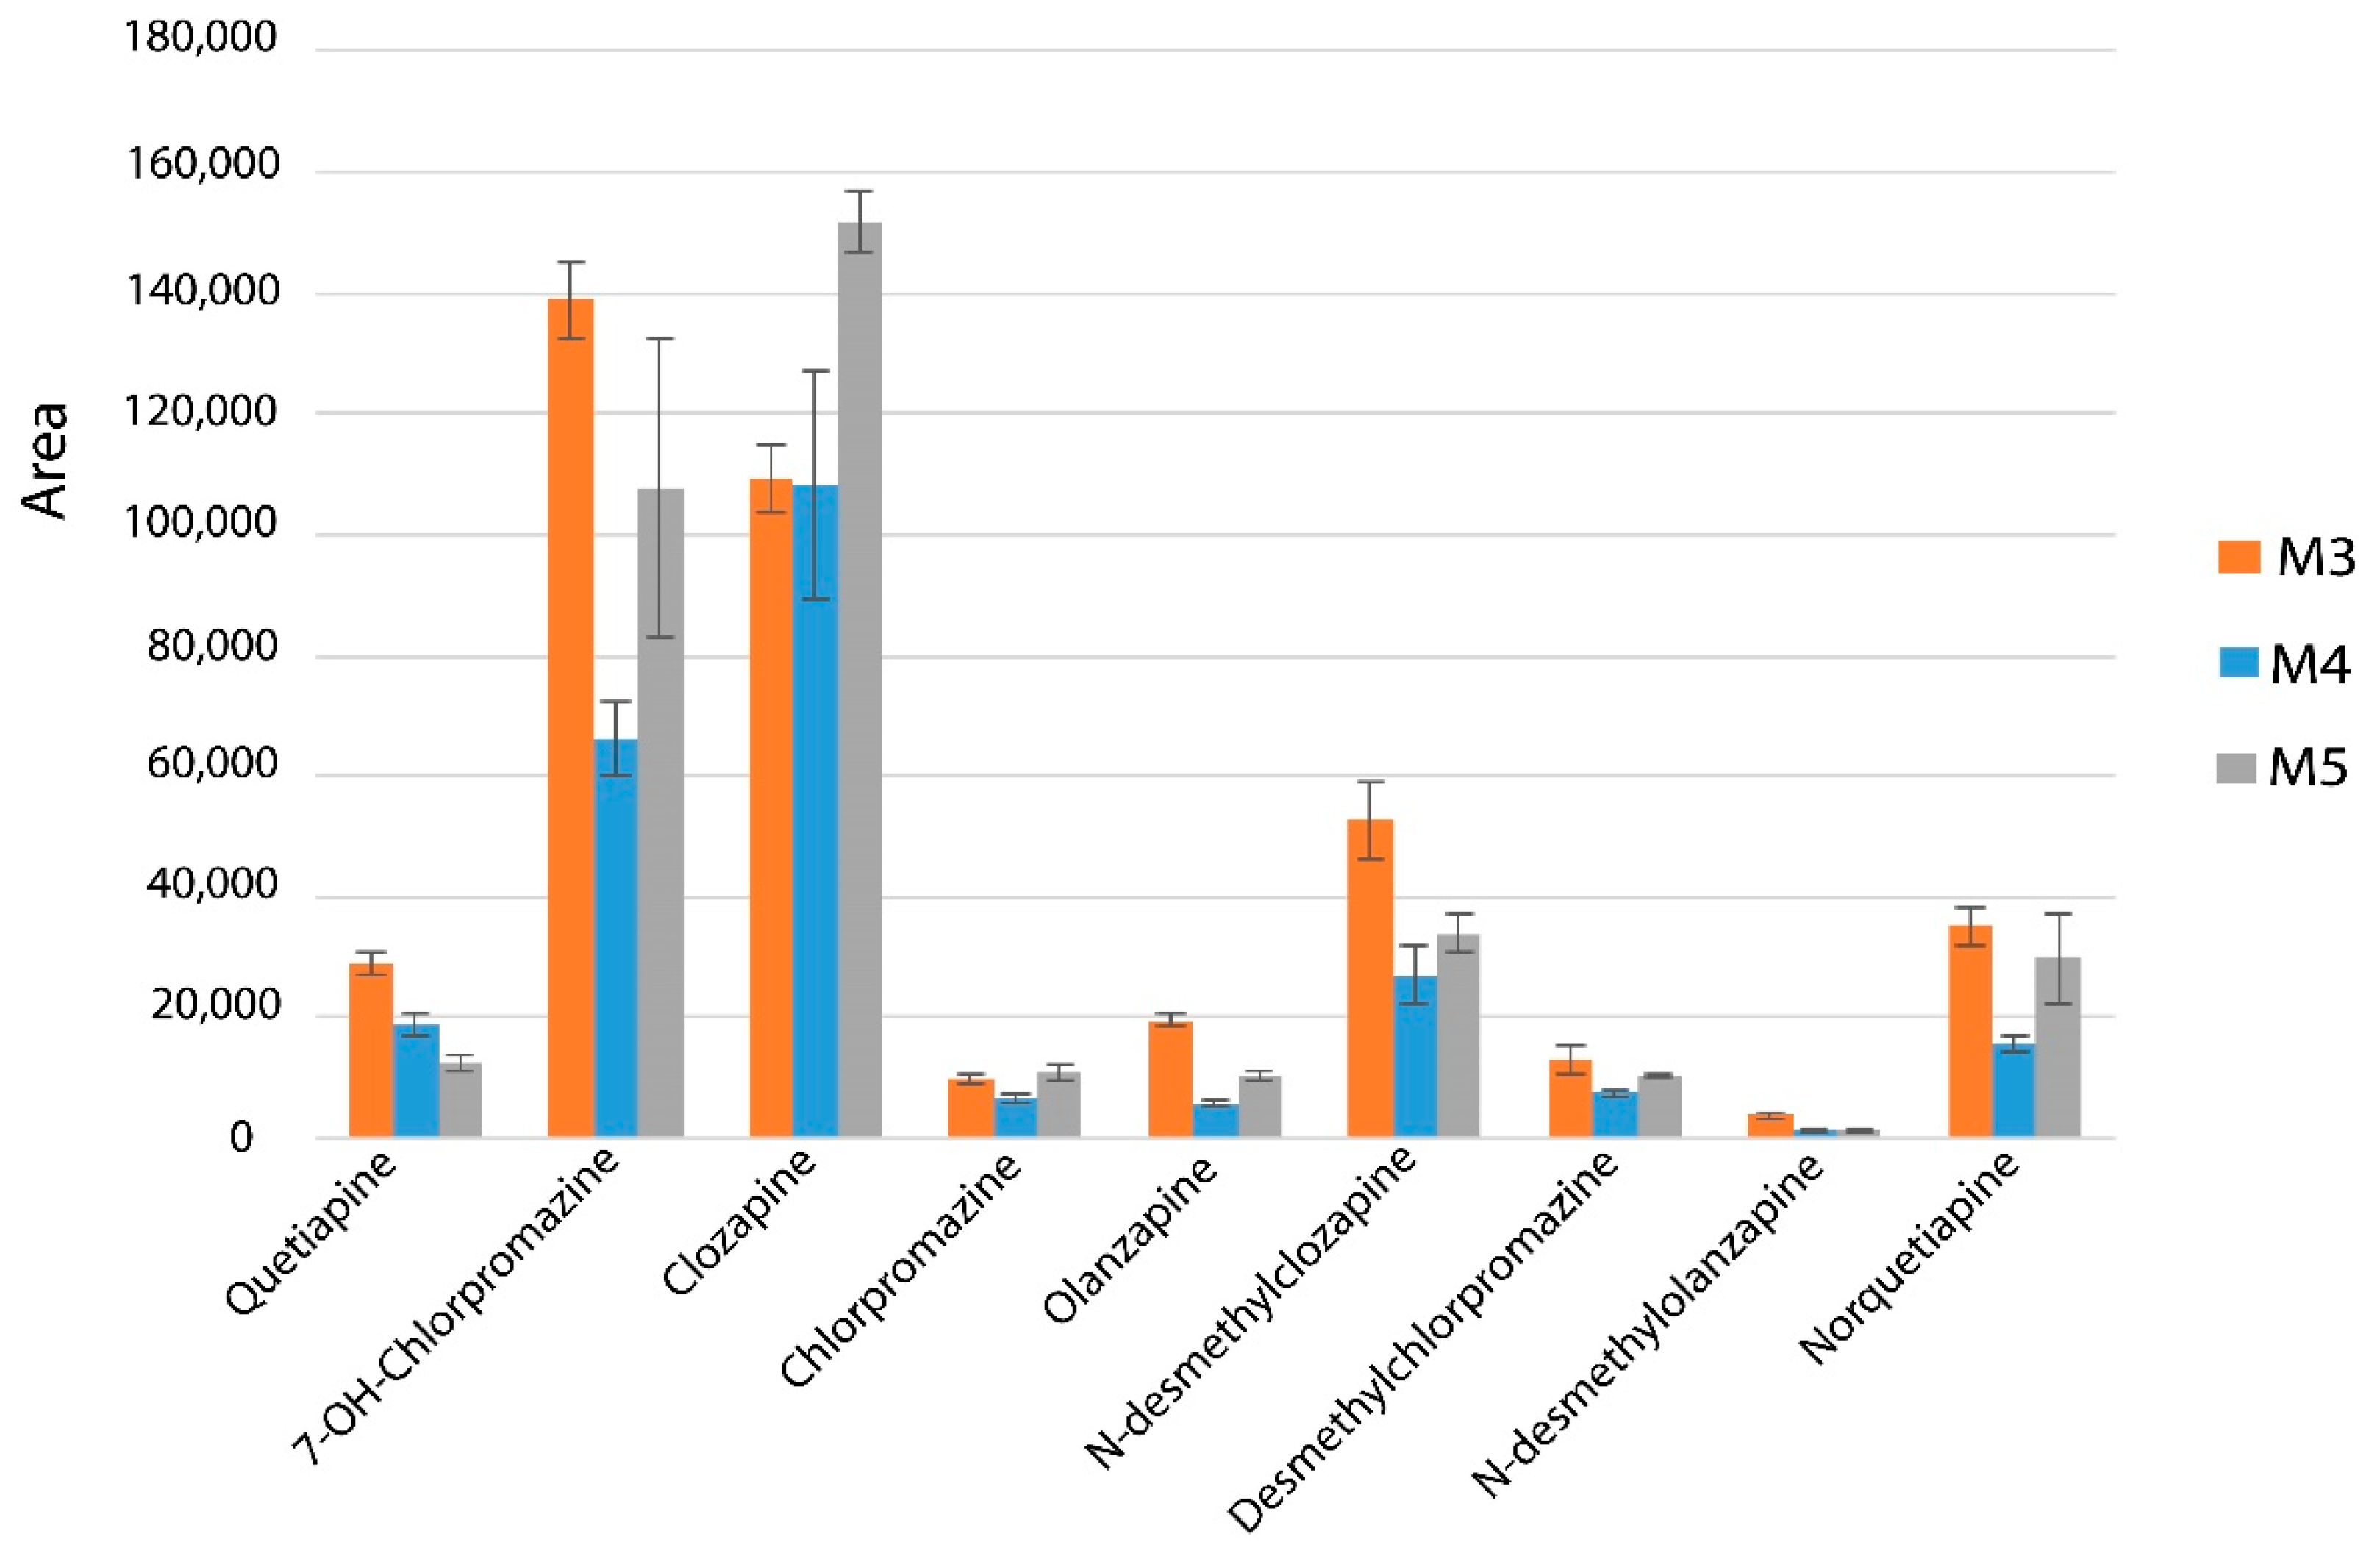
2.2. Plasma Sample Pre-Treatment
2.3. Analytical Validation
2.4. Determination of Antipsychotics and Their Metabolites in Plasma Samples from Schizophrenic Patients
3. Materials and Methods
3.1. Standards and Reagents
3.2. Organic Poly(Butyl Methacrylate-Co-Ethylene Glycol Dimethacrylate) Monolith Capillary Preparation
3.3. Organic Poly(Butyl Methacrylate-Co-Ethylene Glycol Dimethacrylate) Monolith Capillary Characterization
3.4. Plasma Samples
3.5. Plasma Sample Pre-Treatment
3.6. LC-MS/MS Conditions
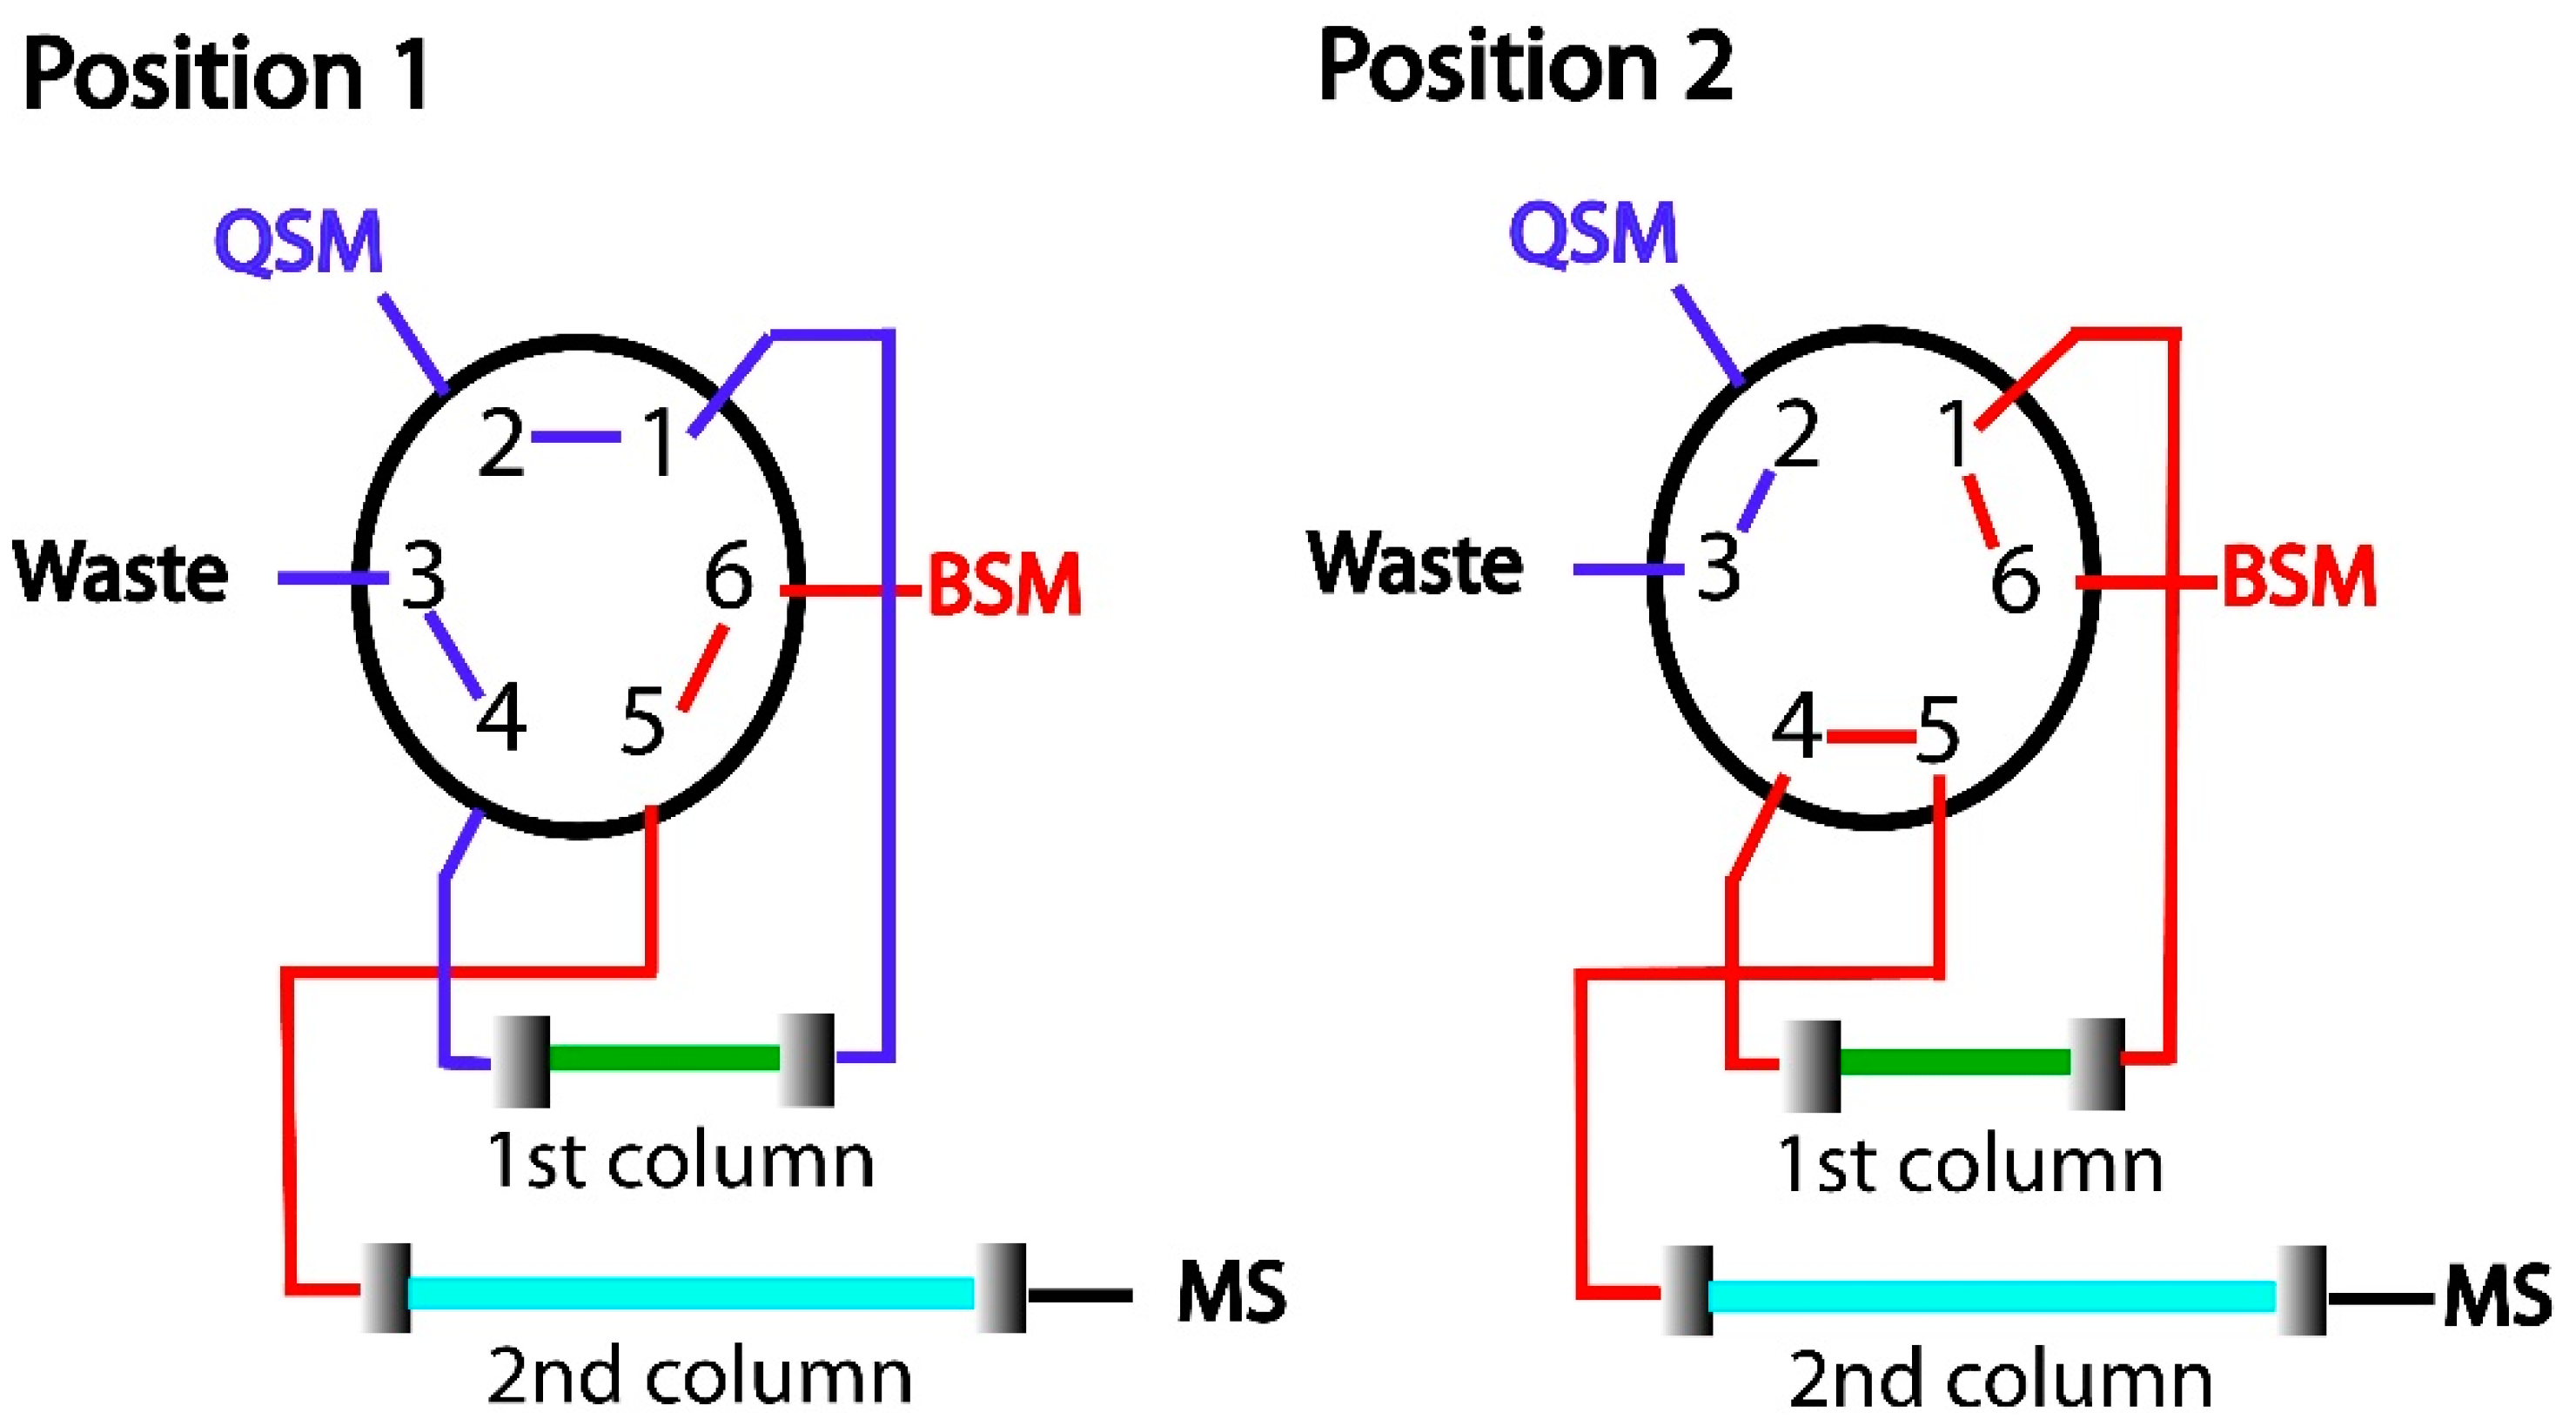
3.7. In-Tube SPME-UHPLC-MS/MS Configuration
3.8. Analytical Validation
4. Conclusions
Author Contributions
Funding
Conflicts of Interest
References
- Lieberman, J.A.; Perkins, D.; Belger, A.; Chakos, M.; Jarskog, F.; Boteva, K.; Gilmore, J. The early stages of schizophrenia: Speculations on pathogenesis, pathophysiology, and therapeutic approaches. Biol. Psychiatry 2001, 50, 884–897. [Google Scholar] [CrossRef]
- Seeman, P.; Kapur, S. Schizophrenia: More dopamine, more D2 receptors. Proc. Natl. Acad. Sci. USA 2000, 97, 7673–7675. [Google Scholar] [CrossRef] [PubMed]
- Patteet, L.; Morrens, M.; Maudens, K.E.; Niemegeers, P.; Sabbe, B.; Neels, H. Therapeutic drug monitoring of common antipsychotics. Ther. Drug Monit. 2012, 34, 629–651. [Google Scholar] [CrossRef] [PubMed]
- Baumann, P.; Hiemke, C.; Ulrich, S.; Eckermann, G.; Gaertner, I.; Gerlach, M.; Kuss, H.-J.; Laux, G.; Müller-Oerlinghausen, B.; Rao, M. The AGNP-TDM expert group consensus guidelines: Therapeutic drug monitoring in psychiatry. Pharmacopsychiatry 2004, 37, 243–265. [Google Scholar] [CrossRef] [PubMed]
- Queiroz, M.; Melo, L. Selective capillary coating materials for in-tube solid-phase microextraction coupled to liquid chromatography to determine drugs and biomarkers in biological samples: A review. Anal. Chim. Acta 2014, 826, 1–11. [Google Scholar] [CrossRef] [PubMed]
- Kataoka, H.; Narimatsu, S.; Lord, H.L.; Pawliszyn, J. Automated in-tube solid-phase microextraction coupled with liquid chromatography/electrospray ionization mass spectrometry for the determination of β-blockers and metabolites in urine and serum samples. Anal. Chem. 1999, 71, 4237–4244. [Google Scholar] [CrossRef]
- Kataoka, H. Automated sample preparation using in-tube solid-phase microextraction and its application–A review. Anal. Bioanal. Chem. 2002, 373, 31–45. [Google Scholar] [CrossRef]
- Domingues, D.S.; de Souza, I.D.; Queiroz, M.E.C. Analysis of drugs in plasma samples from schizophrenic patients by column-switching liquid chromatography-tandem mass spectrometry with organic–inorganic hybrid cyanopropyl monolithic column. J. Chromatogr. B 2015, 993, 26–35. [Google Scholar] [CrossRef]
- Marchioni, C.; de Souza, I.D.; Grecco, C.F.; Crippa, J.A.; Tumas, V.; Queiroz, M.E.C. A column switching ultrahigh-performance liquid chromatography-tandem mass spectrometry method to determine anandamide and 2-arachidonoylglycerol in plasma samples. Anal. Bioanal. Chem. 2017, 409, 3587–3596. [Google Scholar] [CrossRef]
- Chaves, A.R.; Queiroz, M.E.C. Immunoaffinity in-tube solid phase microextraction coupled with liquid chromatography with fluorescence detection for determination of interferon α in plasma samples. J. Chromatogr. B 2013, 928, 37–43. [Google Scholar] [CrossRef]
- Souza, I.D.; Melo, L.P.; Jardim, I.C.; Monteiro, J.C.; Nakano, A.M.S.; Queiroz, M.E.C. Selective molecularly imprinted polymer combined with restricted access material for in-tube SPME/UHPLC-MS/MS of parabens in breast milk samples. Anal. Chim. Acta 2016, 932, 49–59. [Google Scholar] [CrossRef] [PubMed]
- Xu, W.; Su, S.; Jiang, P.; Wang, H.; Dong, X.; Zhang, M. Determination of sulfonamides in bovine milk with column-switching high performance liquid chromatography using surface imprinted silica with hydrophilic external layer as restricted access and selective extraction material. J. Chromatogr. A 2010, 1217, 7198–7207. [Google Scholar] [CrossRef] [PubMed]
- Fan, Y.; Feng, Y.-Q.; Da, S.-L.; Shi, Z.-G. Poly (methacrylic acid–ethylene glycol dimethacrylate) monolithic capillary for in-tube solid phase microextraction coupled to high performance liquid chromatography and its application to determination of basic drugs in human serum. Anal. Chim. Acta 2004, 523, 251–258. [Google Scholar] [CrossRef]
- Fan, Y.; Feng, Y.-Q.; Zhang, J.-T.; Da, S.-L.; Zhang, M. Poly (methacrylic acid-ethylene glycol dimethacrylate) monolith in-tube solid phase microextraction coupled to high performance liquid chromatography and analysis of amphetamines in urine samples. J. Chromatogr. A 2005, 1074, 9–16. [Google Scholar] [CrossRef] [PubMed]
- Luo, X.; Li, G.; Hu, Y. In-tube solid-phase microextraction based on NH2-MIL-53 (Al)-polymer monolithic column for online coupling with high-performance liquid chromatography for directly sensitive analysis of estrogens in human urine. Talanta 2017, 165, 377–383. [Google Scholar] [CrossRef]
- Ma, Q.; Chen, M.; Shi, Z.G.; Feng, Y.Q. Preparation of a poly (N-isopropylacrylamide-co-ethylene dimethacrylate) monolithic capillary and its application for in-tube solid-phase microextrac-tion coupled to high-performance liquid chromatography. J. Sep. Sci. 2009, 32, 2592–2600. [Google Scholar] [CrossRef] [PubMed]
- Liu, K.; Aggarwal, P.; Lawson, J.S.; Tolley, H.D.; Lee, M.L. Organic monoliths for high-performance reversed-phase liquid chromatography. J. Sep. Sci. 2013, 36, 2767–2781. [Google Scholar] [CrossRef]
- Svec, F. Preparation and HPLC applications of rigid macroporous organic polymer monoliths. J. Sep. Sci. 2004, 27, 747–766. [Google Scholar] [CrossRef]
- Liu, W.; Qi, J.; Yan, L.; Jia, Q.; Yu, C. Application of poly (butyl methacrylate-co-ethylene glycol dimethacrylate) monolith microextraction coupled with high performance liquid chromatography to the determination of polycyclic aromatic hydrocarbons in smoked meat products. J. Chromatogr. B 2011, 879, 3012–3016. [Google Scholar] [CrossRef]
- Skoglund, C.; Bassyouni, F.; Abdel-Rehim, M. Monolithic packed 96-tips set for high-throughput sample preparation: Determination of cyclophosphamide and busulfan in whole blood samples by monolithic packed 96-tips and LC-MS. Biomed. Chromatogr. 2013, 27, 714–719. [Google Scholar] [CrossRef]
- Viklund, C.; Svec, F.; Fréchet, J.M.; Irgum, K. Monolithic,“molded”, porous materials with high flow characteristics for separations, catalysis, or solid-phase chemistry: Control of porous properties during polymerization. Chem. Mater. 1996, 8, 744–750. [Google Scholar] [CrossRef]
- Coufal, P.; Čihák, M.; Suchankova, J.; Tesařová, E.; Bosakova, Z.; Štulík, K. Methacrylate monolithic columns of 320 μm ID for capillary liquid chromatography. J. Chromatogr. A 2002, 946, 99–106. [Google Scholar] [CrossRef]
- Zhang, M.; Wei, F.; Zhang, Y.-F.; Nie, J.; Feng, Y.-Q. Novel polymer monolith microextraction using a poly (methacrylic acid-ethylene glycol dimethacrylate) monolith and its application to simultaneous analysis of several angiotensin II receptor antagonists in human urine by capillary zone electrophoresis. J. Chromatogr. A 2006, 1102, 294–301. [Google Scholar] [CrossRef] [PubMed]
- Smith, B.C. Infrared Spectral Interpretation: A Systematic Approach; CRC Press: Boca Raton, FL, USA, 1998. [Google Scholar]
- Coates, J. Interpretation of infrared spectra, a practical approach. Encycl. Anal. Chem. 2000, 12, 10815–10837. [Google Scholar]
- Gonçalves, J.L.; Alves, V.L.; Conceição, C.J.; Teixeira, H.M.; Câmara, J.S. Development of MEPS–UHPLC/PDA methodology for the quantification of clozapine, risperidone and their major active metabolites in human urine. Microchem. J. 2015, 123, 90–98. [Google Scholar] [CrossRef]
- Park, D.; Choi, H.; Jang, M.; Chang, H.; Woo, S.; Yang, W. Simultaneous determination of 18 psychoactive agents and 6 metabolites in plasma using LC–MS/MS and application to actual plasma samples from conscription candidates. Forensic Sci. Int. 2018, 288, 283–290. [Google Scholar] [CrossRef] [PubMed]
- Khelfi, A.; Azzouz, M.; Abtroun, R.; Reggabi, M.; Alamir, B. Determination of Chlorpromazine, Haloperidol, Levomepromazine, Olanzapine, Risperidone, and Sulpiride in Human Plasma by Liquid Chromatography/Tandem Mass Spectrometry (LC-MS/MS). Int. J. Anal. Chem. 2018, in press. [Google Scholar] [CrossRef] [PubMed]
- Ho, T.D.; Toledo, B.R.; Hantao, L.W.; Anderson, J.L. Chemical immobilization of crosslinked polymeric ionic liquids on nitinol wires produces highly robust sorbent coatings for solid-phase microextraction. Anal. Chim. Acta 2014, 843, 18–26. [Google Scholar] [CrossRef] [PubMed]
Sample Availability: not available. |


| Monolith | Monomer/Porogen (%m/m) | EGDMA:BMA (%m/m) | Porogens BUT:PRO (%m/m) | AIBN | Permeability |
|---|---|---|---|---|---|
| M1 | 40:60 | 70:30 | 25:65 | 1% | Poor |
| M2 | 40:60 | 55:45 | 30:60 | 1% | Poor |
| M3 | 35:65 | 40:60 | 57:43 | 1% | Good |
| M4 | 35:65 | 50:50 | 57:43 | 1% | Good |
| M5 | 35:65 | 30:70 | 57:43 | 1% | Good |
| Analyte | Precursor Ion (m/z) | Quantifier Ion (m/z) | Ce (eV) | DP (v) | Qualifier Ion (m/z) | Retention Time |
|---|---|---|---|---|---|---|
| Chlorpromazine | 319.0 | 85.9 | 38 | 18 | 57.9 | 9.27 |
| Chlorpromazine-d3 | 324.0 | 60.9 | 34 | 42 | 89.0 | 9.25 |
| Clozapine | 327.0 | 270.0 | 44 | 30 | 191.9 | 8.62 |
| Olanzapine | 313.0 | 256.0 | 22 | 20 | 84.0 | 5.95 |
| Quetiapine | 384.0 | 253.0 | 36 | 18 | 221.0 | 8.66 |
| Quetiapine-d8 | 392.2 | 225.9 | 38 | 48 | 257.8 | 8.64 |
| Desmethyl chlorpromazine | 304.9 | 72.0 | 30 | 14 | 43.9 | 9.19 |
| 7-hydroxy-chlorpromazine | 335.0 | 85.9 | 30 | 34 | 57.8 | 8.71 |
| N-desmethyl clozapine | 313.0 | 191.9 | 28 | 52 | 69.9 | 8.52 |
| N-desmethyl olanzapine | 299.0 | 197.9 | 26 | 28 | 212.9 | 5.46 |
| Norquetiapine | 296.0 | 209.9 | 54 | 26 | 138.9 | 8.61 |
| Analyte | Linearity | ||
|---|---|---|---|
| R2 | Internal Standart | Lack of Fit Test | |
| Chlorpromazine | 0.9986 | chlorpomazine-d3 | 0.848 |
| Clozapine | 0.9997 | quetiapine-d8 | 0.226 |
| Olanzapine | 0.9989 | quetiapine-d8 | 0.146 |
| Quetiapine | 0.9981 | quetiapine-d8 | 0.888 |
| Desmethyl chlorpromazine | 0.9975 | chlorpomazine-d3 | 0.420 |
| 7-hydroxy-chlorpromazine | 0.9992 | chlorpomazine-d3 | 0.166 |
| N-desmethyl clozapine | 0.9989 | quetiapine-d8 | 0.196 |
| N-desmethyl olanzapine | 0.9997 | quetiapine-d8 | 0.955 |
| Norquetiapine | 0.9985 | quetiapine-d8 | 0.115 |
| Analyte | Concentration (ng mL−1) | Accuracy | Precision | Matrix Effects (%CV) | ||
|---|---|---|---|---|---|---|
| Intra-Assay (%RSE) n = 5 | Inter-Assay | Intra-assay (%CV) n = 5 | Inter-Assay | |||
| Chlorpromazine | 10 | −19.4 | −18.9 | 1.7 | 0.9 | |
| 30 | 3.5 | 1.9 | 2.5 | 0.7 | 0.6 | |
| 200 | −3.1 | −10.9 | 4.8 | 7.8 | ||
| 300 | −0.1 | 0.4 | 7.7 | 0.7 | 12.1 | |
| 400 | −2.5 | 0.2 | 10.0 | 7.0 | ||
| Clozapine | 10 | 14.7 | 14,7 | 14.2 | 3.3 | |
| 30 | 14.6 | 6.7 | 9.1 | 12.1 | 3.6 | |
| 350 | −1.0 | −5.9 | 3.5 | 1.1 | ||
| 500 | −2.5 | −3.2 | 2.4 | 1.0 | 1.9 | |
| 700 | 1.0 | −0.7 | 0.7 | 3.8 | ||
| Olanzapine | 10 | 18.4 | 19.3 | 9.0 | 12.1 | |
| 30 | 13.3 | 9.7 | 3.2 | 3.7 | 6.7 | |
| 100 | −1.9 | −4.2 | 1.2 | 8.3 | ||
| 150 | 5.7 | 6.2 | 4.8 | 3.3 | 7.9 | |
| 200 | 2.5 | 1.8 | 3.5 | 1.0 | ||
| Quetiapine | 10 | −18.8 | −14.5 | 2.6 | 3.2 | |
| 30 | 13.6 | −10.5 | 7.7 | 1.6 | 1.5 | |
| 250 | −9.5 | −8.4 | 2.5 | 5.2 | ||
| 500 | 4.7 | 0.7 | 4.1 | 10.2 | 9.1 | |
| 600 | −1.4 | 0.3 | 2.0 | 8.1 | ||
| Desmethyl chlorpromazine | 10 | −6.3 | −9.5 | 1.7 | 4.5 | |
| 30 | −13.4 | −13.5 | 1.6 | 2.7 | 9.9 | |
| 100 | −2.2 | −2.1 | 3.1 | 3.6 | ||
| 150 | 4.6 | −1.8 | 2.4 | 6.8 | 10.6 | |
| 200 | −7.9 | −12.8 | 9.1 | 2.3 | ||
| 7-hydroxy-chlorpromazine | 10 | −5.0 | 8.8 | 11.9 | 3.6 | |
| 30 | 0,9 | −4.4 | 1.5 | 4.3 | 13.5 | |
| 100 | 2.0 | 0.4 | 8.3 | 2.7 | ||
| 150 | −3.9 | 5.5 | 3.0 | 6.6 | 14.3 | |
| 200 | 2.9 | 5.0 | 3.6 | 3.2 | ||
| N-desmethyl clozapine | 10 | 7.5 | 10.4 | 0.8 | 2.3 | |
| 30 | −8.8 | −0.1 | 9.1 | 7.3 | 2.1 | |
| 200 | −4.3 | −10.3 | 2.2 | 13.1 | ||
| 300 | 1.0 | 12.6 | 6.3 | 14.2 | 2.2 | |
| 500 | −1.7 | −2.5 | 1.3 | 10.0 | ||
| N-desmethyl olanzapine | 10 | 11.0 | 15.6 | 0.7 | 6.0 | |
| 25 | −1.3 | 4.3 | 13.5 | 5.1 | 5.3 | |
| 100 | −2.4 | −3.6 | 9.1 | 3.0 | ||
| 150 | 0.8 | 12.8 | 10.1 | 3.6 | 6.1 | |
| 200 | 1.0 | 4.3 | 3.5 | 8.6 | ||
| Norquetiapine | 10 | 19.9 | 18.4 | 4.1 | 3.4 | |
| 30 | 7.5 | 7.5 | 9.5 | 9.2 | 3.1 | |
| 100 | −4.6 | −5.4 | 4.4 | 1.5 | ||
| 150 | 0.04 | −6.1 | 6.7 | 11.7 | 5.3 | |
| 200 | 1.5 | −1.4 | 1.0 | 7.2 |
| Analytes | Matrix | Sample Amount (µL) | Chromatographic Separation (min) | Analytical Technique | LLOQ (ng mL−1) | References |
|---|---|---|---|---|---|---|
| Aripiprazole Olanzapine Paliperidone Ziprasidone | Plasma | 200 | 8 | Protein precipitation | 10.0 (olanzapine) | Park et al. 2018 [27] |
| chlorpromazine, haloperidol, levomepromazine, olanzapine, risperidone, and sulpiride | Plasma | 500 | 7 | SPE (Oasis HLB) | 13.2 (chlorpromazine) 2.9 (olanzapine) | Khelfi et al. 2018 [28] |
| Haloperidol, olanzapine, chlorpromazine, quetiapine, clozapine | Plasma | 200 | 10 | column switching LC-MS/MS (hybrid monolith with cyano groups) | 0.075–0.188 | Domingues et al. 2015 [8] |
| Clozapine, risperidone, and metabolites | Urine | 500 | 10 | MEPS (C18) UHPLC-PDA | 100.0 | Gonçalves et al. 2015 [26] |
| chlopromazine, clozapine, quetiapine, olanzapine and metabolites | Plasma | 300 | 4.5 | In-tube SPME-UHPLC-MS/MS | 10.0 | This work |
| Drugs | Therapeutic Drug Monitoring Interval (ng mL−1) | Plasma Concentrations | |||
|---|---|---|---|---|---|
| Patient 1 | Patient 2 | Patient 3 | Patient 4 | ||
| Chlorpromazine | 30–300 | - | - | - | 329 |
| Clozapine | 350–600 | - | - | 528 | - |
| Olanzapine | 20–80 | 85 | - | - | - |
| Quetiapine | 100–500 | - | 400 | - | - |
| Desmethyl chlorpromazine | - | - | - | - | 12 |
| 7-hydroxy-chlorpromazine | - | - | - | - | 40 |
| N-desmethyl clozapine | - | - | - | 328 | - |
| N-desmethyl olanzapine | - | 19 | - | - | |
| Norquetiapine | - | 61 | - | - | |
| QSM A = Water, B = Acetonitrile | BSM A = 10 mmol L−1 Ammonium acetate (0.1% Formic Acid) B = Acetonitrile | ||||
|---|---|---|---|---|---|
| T (min) | Pump | Flow Rate (µL min−1) | %A | Valve Position | Comments |
| 0.0 | QSM | 100 | 100 | 1 | Sample cleanup and drug pre-concentration into monolithic capillary |
| 0.0 | BSM | 100 | 15 | 1 | Analytical column conditioning |
| 2.0 | BSM | 100 | 80 | 2 | Analyte elution from the monolith column to the chromatographic column |
| 5.50 | BSM | 300 | 80 | 1 | Beginning of chromatography separation on the analytical column. |
| 5.50 | QSM | 100 | 0 | 1 | Cleanup of monolithic capillary |
| 13.00 | BSM | 100 | 15 | 1 | End of analytical separation and start of column conditioning for the next sample injection |
| 13.0 | QSM | 300 | 100 | 1 | Start of monolithic column conditioning for the next sample injection |
© 2019 by the authors. Licensee MDPI, Basel, Switzerland. This article is an open access article distributed under the terms and conditions of the Creative Commons Attribution (CC BY) license (http://creativecommons.org/licenses/by/4.0/).
Share and Cite
Beloti, L.G.M.; Miranda, L.F.C.; Queiroz, M.E.C. Butyl Methacrylate-Co-Ethylene Glycol Dimethacrylate Monolith for Online in-Tube SPME-UHPLC-MS/MS to Determine Chlopromazine, Clozapine, Quetiapine, Olanzapine, and Their Metabolites in Plasma Samples. Molecules 2019, 24, 310. https://doi.org/10.3390/molecules24020310
Beloti LGM, Miranda LFC, Queiroz MEC. Butyl Methacrylate-Co-Ethylene Glycol Dimethacrylate Monolith for Online in-Tube SPME-UHPLC-MS/MS to Determine Chlopromazine, Clozapine, Quetiapine, Olanzapine, and Their Metabolites in Plasma Samples. Molecules. 2019; 24(2):310. https://doi.org/10.3390/molecules24020310
Chicago/Turabian StyleBeloti, Luiz G. M., Luis F. C. Miranda, and Maria Eugênia C. Queiroz. 2019. "Butyl Methacrylate-Co-Ethylene Glycol Dimethacrylate Monolith for Online in-Tube SPME-UHPLC-MS/MS to Determine Chlopromazine, Clozapine, Quetiapine, Olanzapine, and Their Metabolites in Plasma Samples" Molecules 24, no. 2: 310. https://doi.org/10.3390/molecules24020310
APA StyleBeloti, L. G. M., Miranda, L. F. C., & Queiroz, M. E. C. (2019). Butyl Methacrylate-Co-Ethylene Glycol Dimethacrylate Monolith for Online in-Tube SPME-UHPLC-MS/MS to Determine Chlopromazine, Clozapine, Quetiapine, Olanzapine, and Their Metabolites in Plasma Samples. Molecules, 24(2), 310. https://doi.org/10.3390/molecules24020310