A Single Standard to Determine Multi-Components Method Coupled with Chemometric Methods for the Quantification, Evaluation and Classification of Notopterygii Rhizoma et Radix from Different Regions

 , and
, and
Abstract
:1. Introduction
2. Result and Discussion
2.1. Optimization of Extraction Conditions
2.2. Optimization of Chromatographic Conditions
2.3. Calculation of the Relative Response Factors
2.4. Method Validation
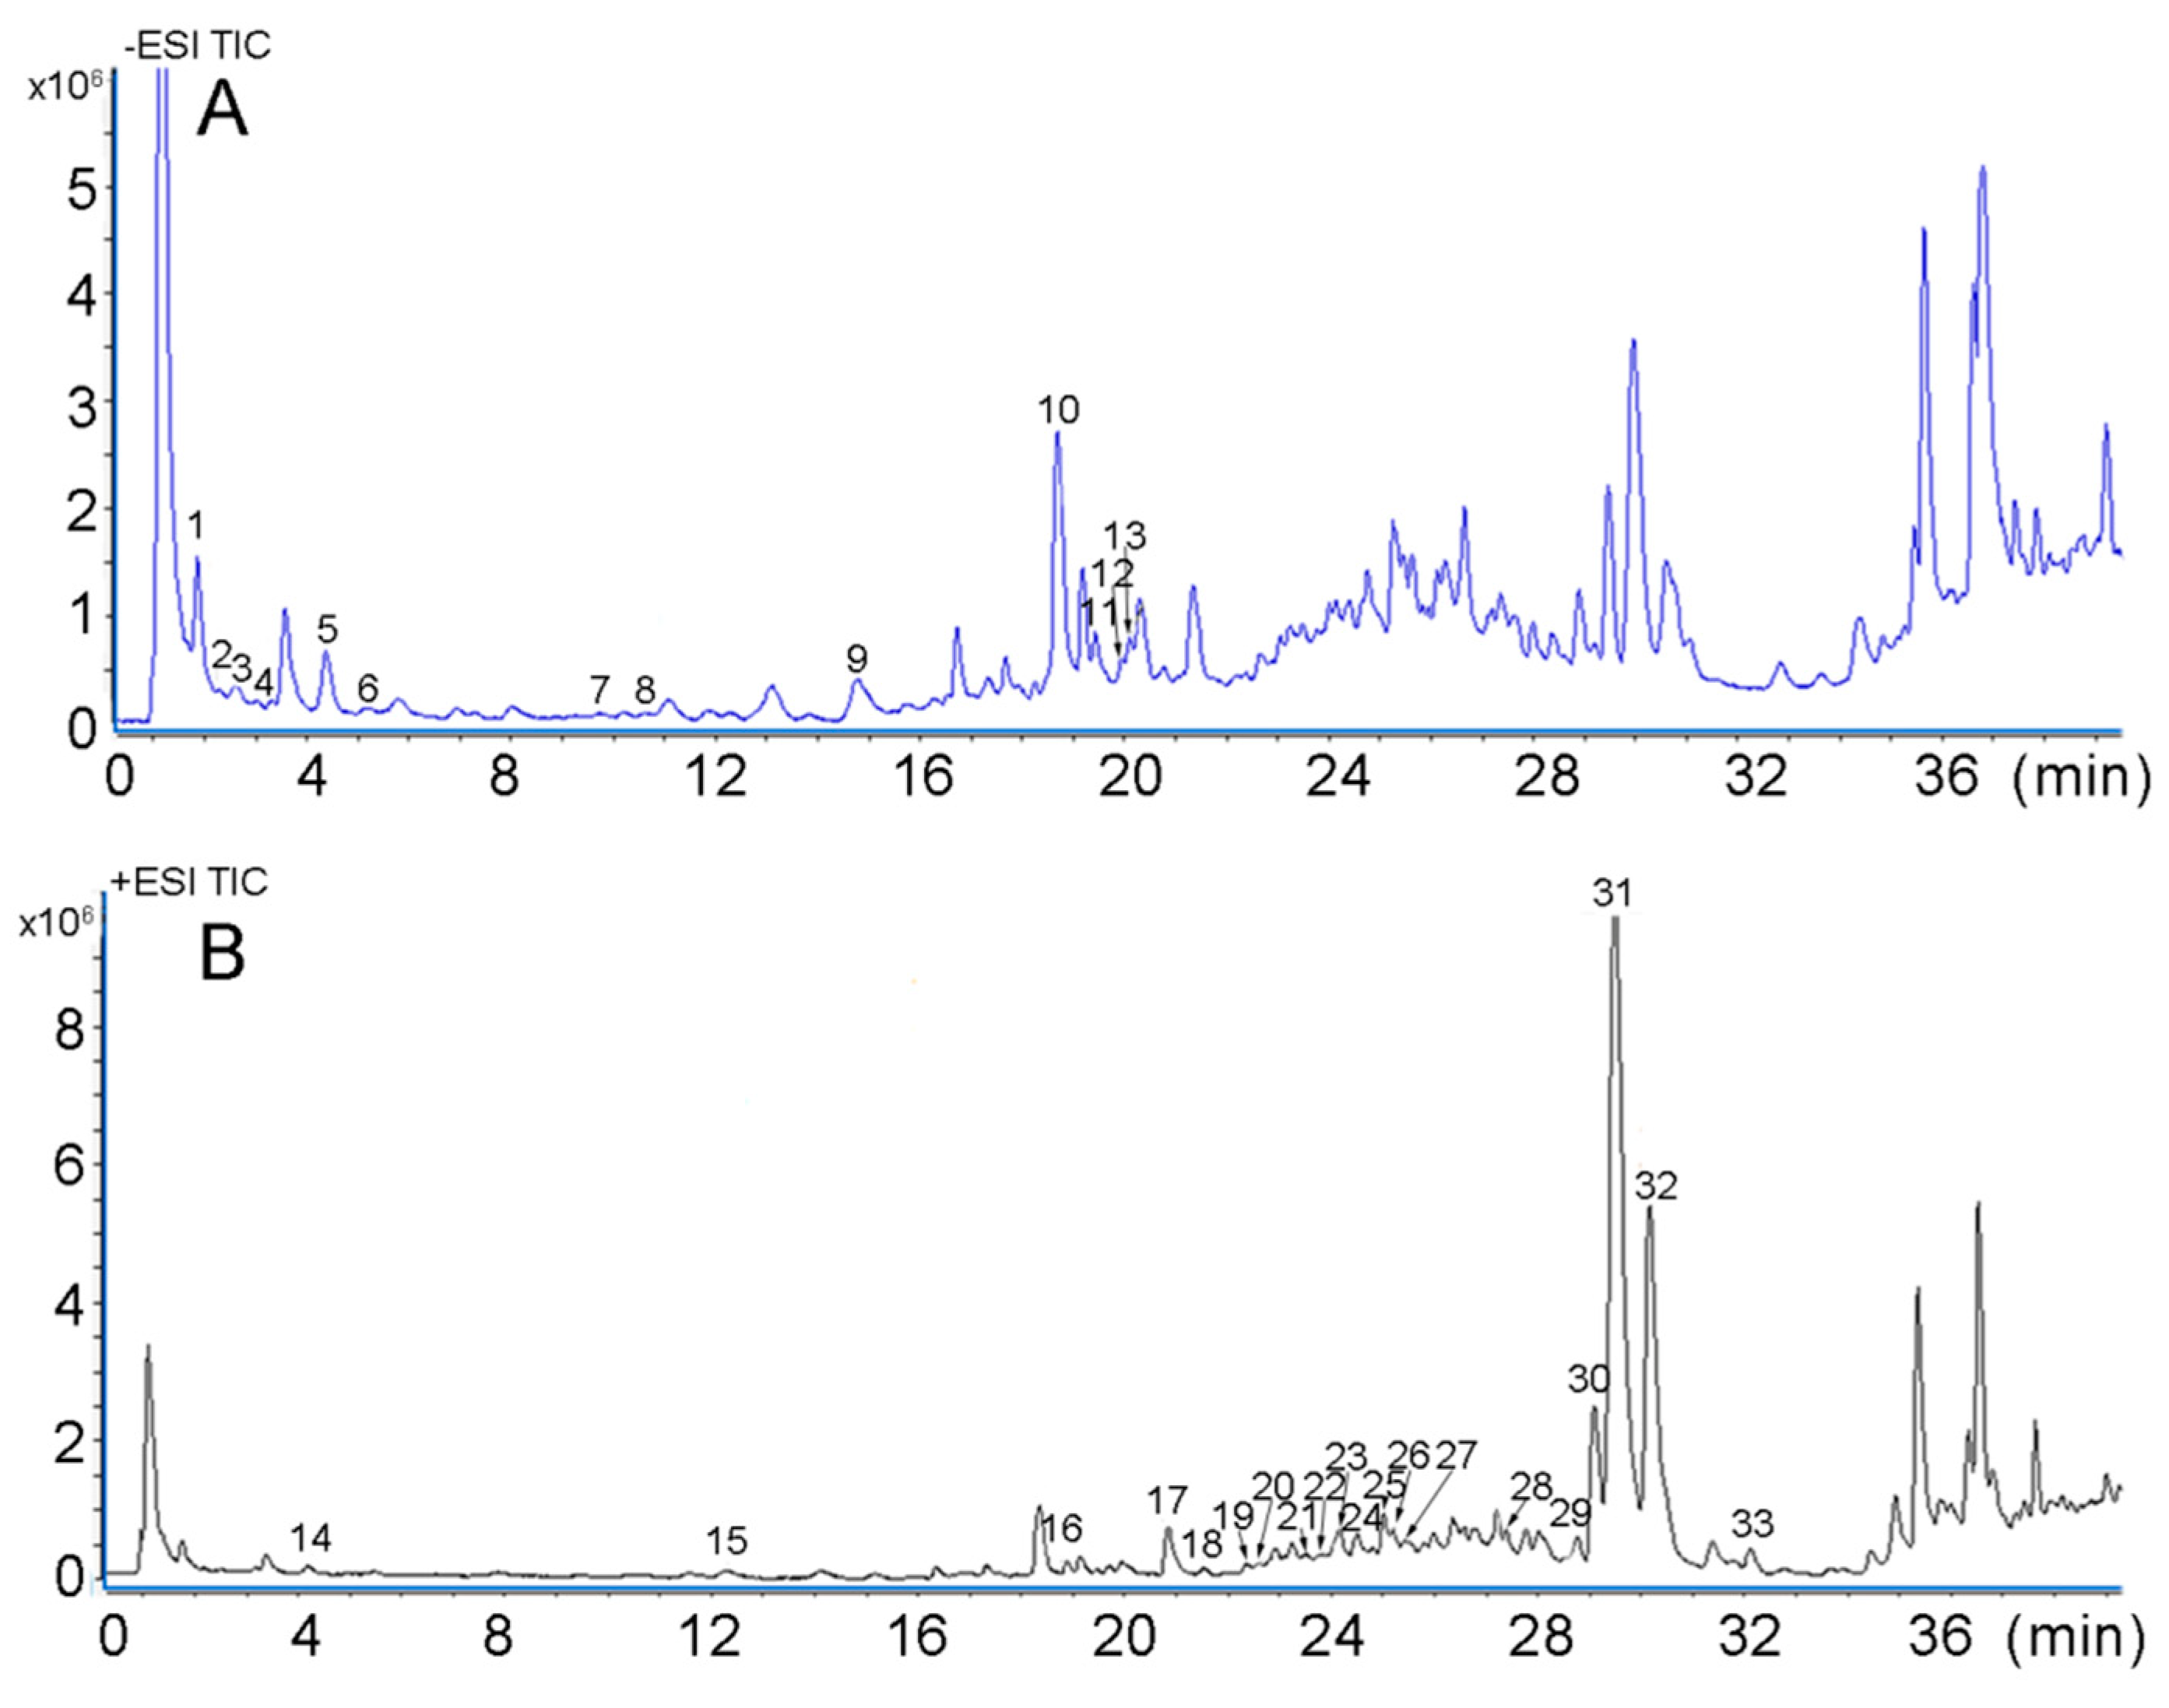
2.5. Identification of 33 Compounds in NRR Using UHPLC–Q–TOF–MS
2.6. Quantitative Analysis of 32 Batches of Samples
2.7. Multivariate Statistical Analysis
3. Materials and Methods
3.1. Chemicals and Materials
3.2. Preparation of Samples
3.3. Chromatographic Conditions
3.4. Calculation of Relative Response Factors
3.5. Method Validation
3.6. Data Analysis
4. Conclusions
Supplementary Materials
Author Contributions
Funding
Conflicts of Interest
References
- Wang, Y.P.; Huang, L.F. Comparison of two species of Notopterygium by GC-MS and HPLC. Molecules 2015, 20, 5062–5073. [Google Scholar] [CrossRef] [PubMed]
- Liu, X.; Kunert, O.; Blunder, M.; Fakhrudin, N.; Noha, S.M.; Malainer, C.; Schinkovitz, A.; Heiss, E.H.; Atanasov, A.G.; Kollroser, M.; et al. Polyyne hybrid compounds from Notopterygium incisum with peroxisome proliferator-activated receptor gamma agonistic effects. J. Nat. Prod. 2014, 77, 2513–2521. [Google Scholar] [CrossRef] [PubMed]
- Yue, Y.; Xue, H.; Wang, X.; Yang, Q.; Song, Y.; Li, X. High-expression β(1) adrenergic receptor/cell membrane chromatography method based on a target receptor to screen active ingredients from traditional Chinese medicines. J. Sep. Sci. 2014, 37, 244–249. [Google Scholar] [CrossRef] [PubMed]
- Kim, S.; Kim, K.Y.; Han, C.S.; Ki, K.S.; Min, K.J.; Zhang, X.; Whang, W.K. Simultaneous analysis of six major compounds in Osterici Radix and Notopterygii Rhizoma et Radix by HPLC and discrimination of their origins from chemical fingerprint analysis. Arch. Pharm. Res. 2012, 35, 691–699. [Google Scholar] [CrossRef] [PubMed]
- Cheng, T.F.; Jia, Y.R.; Zuo, Z.; Dong, X.; Zhou, P.; Li, P.; Li, F. Quality assessment of traditional Chinese medicine herb couple by high-performance liquid chromatography and mass spectrometry combined with chemometrics. J. Sep. Sci. 2016, 39, 1223–1231. [Google Scholar] [CrossRef]
- Xu, K.; Jiang, S.; Zhou, Y.; Zhang, Y.; Xia, B.; Xu, X.; Zhou, Y.; Li, Y.; Wang, M.; Ding, L. Discrimination of the seeds of Notopterygium incisum and Notopterygium franchetii by validated HPLC-DAD-ESI-MS method and principal component analysis. J. Pharm. Biomed. Anal. 2011, 56, 1089–1093. [Google Scholar] [CrossRef] [PubMed]
- Li, S.P.; Qiao, C.F.; Chen, Y.W.; Zhao, J.; Cui, X.M.; Zhang, Q.W.; Liu, X.M.; Hu, D.J. A novel strategy with standardized reference extract qualification and single compound quantitative evaluation for quality control of Panax notoginseng used as a functional food. J. Chromatogr. A 2013, 1313, 302–307. [Google Scholar] [CrossRef]
- Dong, S.; He, J.; Hou, H.; Shuai, Y.; Wang, Q.; Yang, W.; Sun, Z.; Li, Q.; Bi, K.; Liu, R. Quality assessment of Herba Leonuri based on the analysis of multiple components using normal- and reversed-phase chromatographic methods. J. Sep. Sci. 2017, 40, 4482–4494. [Google Scholar] [CrossRef]
- Ning, Z.; Liu, Z.; Song, Z.; Zhao, S.; Dong, Y.; Zeng, H.; Shu, Y.; Lu, C.; Liu, Y.; Lu, A. A single marker choice strategy in simultaneous characterization and quantification of multiple components by rapid resolution liquid chromatography coupled with triple quadrupole tandem mass spectrometry (RRLC-QqQ-MS). J. Pharm. Biomed. Anal. 2016, 124, 174–188. [Google Scholar] [CrossRef]
- Wang, C.Q.; Jia, X.H.; Zhu, S.; Komatsu, K.; Wang, X.; Cai, S.Q. A systematic study on the influencing parameters and improvement of quantitative analysis of multi-component with single marker method using notoginseng as research subject. Talanta 2015, 134, 587–595. [Google Scholar] [CrossRef]
- He, Y.; Li, Q.; Kaishun, B. Simultaneous determination of six active components by a single standard to determine multicomponents combined with fingerprint analysis for the quality control of Rhizoma Chuanxiong. J. Sep. Sci. 2015, 38, 1090–1099. [Google Scholar] [CrossRef] [PubMed]
- Cao, Y.; Yan, R.; Yang, L.; Guo, J.; Liu, H.; Zhang, J.; Yang, B.; Huang, L. Quality evaluation of semen oroxyli based on the determination of multiple components with a single reference standard. J. Chromatogr. Sci. 2013, 51, 477–484. [Google Scholar] [CrossRef] [PubMed]
- Zhang, Y.W.; Li, Q.; Lv, C.X.; Liu, X.J.; Chen, X.H.; Bi, K.S. Simultaneous determination of four active components in Alisma orientale (Sam.) Juz. by HPLC–DAD using a single reference standard. J. Pharm. Biomed. Anal. 2015, 5, 85–92. [Google Scholar] [CrossRef] [PubMed]
- Li, D.W.; Zhu, M.; Shao, Y.D.; Shen, Z.; Weng, C.C.; Yan, W.D. Determination and quality evaluation of green tea extracts through qualitative and quantitative analysis of multi-components by single marker (QAMS). Food. Chem. 2016, 197, 1112–1120. [Google Scholar] [CrossRef]
- Hou, J.J.; Wu, W.Y.; Da, J.; Yao, S.; Long, H.L.; Yang, Z.; Cai, L.Y.; Yang, M.; Liu, X.; Jiang, B.H.; et al. Ruggedness and robustness of conversion factors in method of simultaneous determination of multi-components with single reference standard. J. Chromatogr. A. 2011, 1218, 5618–5627. [Google Scholar] [CrossRef]
- Gao, X.Y.; Jiang, Y.; Lu, J.Q.; Tu, P.F. One single standard substance for the determination of multiple anthraquinone derivatives in rhubarb using high-performance liquid chromatography-diode array detection. J. Chromatogr. A 2009, 1216, 2118–2123. [Google Scholar] [CrossRef]
- Ge, A.H.; Ma, W.F.; Wang, C.P.; Li, J.; He, J.; Liu, E.W.; Adelakum, T.A.; Zhang, B.L.; Gao, X.M.; Chang, Y.X. Ultra high performance liquid chromatography with photodiode array detector and quadrupole time-of-flight tandem mass spectrometry coupled with discriminant analysis to evaluate Angelicae pubescentis radix from different regions. J. Sep. Sci. 2014, 37, 2523–2534. [Google Scholar] [CrossRef]
- Ding, M.Y.; Li, Z.; Yu, X.A.; Zhang, D.; Li, J.; Wang, H.; He, J.; Gao, X.M.; Chang, Y.X. A network pharmacology-integrated metabolomics strategy for clarifying the difference between effective compounds of raw and processed Farfarae flos by ultra high-performance liquid chromatography-quadrupole-time of flight mass spectrometry. J. Pharm. Biomed. Anal. 2018, 156, 349–357. [Google Scholar] [CrossRef]
- Biancolillo, A.; Marini, F. Chapter Four-Chemometrics Applied to Plant Spectral Analysis. Compr. Anal. Chem. 2018, 80, 69–104. [Google Scholar]
- Huang, W.P.; Tan, T.; Li, Z.F.; Yang, H.O.; Xu, X.; Zhou, B.; Feng, Y.L. Structural characterization and discrimination of Chimonanthus nitens Oliv. leaf from different geographical origins based on multiple Chromatographic analysis combined with chemometric methods. J. Pharm. Biomed. Anal. 2018, 154, 236–244. [Google Scholar] [CrossRef]
- He, J.; He, Y.; Zhang, C. Determination and Visualization of Peimine and Peiminine Content in Fritillaria thunbergii Bulbi Treated by Sulfur Fumigation Using Hyperspectral Imaging with Chemometrics. Molecules 2017, 22, 1402. [Google Scholar] [CrossRef] [PubMed]
- Xia, Y.G.; Song, Y.; Liang, J.; Guo, X.D.; Yang, B.Y.; Kuang, H.X. Quality Analysis of American Ginseng Cultivated in Heilongjiang Using UPLC-ESI−-MRM-MS with Chemometric Methods. Molecules 2018, 23, 2396. [Google Scholar] [CrossRef] [PubMed]
- Jiang, Z.Z.; Wang, Y.F.; Zheng, Y.F.; Yang, J.; Zhang, L. Ultra high performance liquid chromatography coupled with triple quadrupole mass spectrometry and chemometric analysis of licorice based on the simultaneous determination of saponins and flavonoids. J. Sep. Sci. 2016, 39, 2928–2940. [Google Scholar] [CrossRef] [PubMed]
- Soininen, T.H.; Jukarainen, N.; Auriola, S.O.; Julkunen, T.R.; Karjalainen, R.; Vepsalainen, J.J. Quantitative metabolite profiling of edible onion species by NMR and HPLC-MS. Food Chem. 2014, 165, 499–505. [Google Scholar] [CrossRef] [PubMed]
- Zhang, J.Y.; Zhang, Q.; Li, N.; Wang, Z.J.; Lu, J.Q.; Qiao, Y.J. Diagnostic fragment-ion-based and extension strategy coupled to DFIs intensity analysis for identification of chlorogenic acids isomers in Flos Lonicerae Japonicae by HPLC-ESI-MS(n). Talanta 2013, 104, 1–9. [Google Scholar] [CrossRef] [PubMed]
- Silina, Y.E.; Fink, S.C.; Hanselmann, R.G.; Peuschel, H.; Volmer, D.A. p-Coumaric acid, a novel and effective biomarker for quantifying hypoxic stress by HILIC-ESI-MS. Anal. Technol. Biomed. Life Sci. 2016, 1020, 6–13. [Google Scholar] [CrossRef] [PubMed]
- Pfeifer, I.; Murauer, A.; Ganzera, M. Determination of coumarins in the roots of Angelica dahurica by supercritical fluid chromatography. J. Pharm. Biomed. Anal. 2016, 129, 246–251. [Google Scholar] [CrossRef] [PubMed]
- Bai, Y.; Li, D.; Zhou, T.; Qin, N.; Li, Z.; Yu, Z.; Hua, H. Coumarins from the roots of Angelica dahurica with antioxidant and antiproliferative activities. J. Funct. Foods 2016, 20, 453–462. [Google Scholar] [CrossRef]
- Wang, L.H.; Chen, X.G.; Zhao, Y.K.; Hu, Z.D. Identification and determination of active components in Angelica dahurica Benth and its medicinal preparation by capillary electrophoresis. Talanta 2011, 54, 753–761. [Google Scholar]
- Zhao, A.H.; Zhang, B.; Yang, X.W. Simultaneous determination and pharmacokinetics of sixteen Angelicae dahurica coumarins in vivo by LC-ESI-MS/MS following oral delivery in rats. Phytomedicine 2016, 23, 1029–1036. [Google Scholar] [CrossRef]
- Kang, J.; Zhou, L.; Sun, J.; Han, J.; Guo, D.A. Chromatographic fingerprint analysis and characterization of furocoumarins in the roots of Angelica dahurica by HPLC/DAD/ESI-MSn technique. J. Pharm. Biomed. Anal. 2008, 47, 778–785. [Google Scholar] [CrossRef] [PubMed]
Sample Availability: Samples of the compounds chlorogenic acid, p-coumaric acid, scopoletin, ferulic acid, coumarin, nodakenin, bergaptol, psoralen, angelicin, 8-methoxypsoralen, bergapten, diosmetin, byakangelico, imperatorin, phelloptorin, osthole, notopterol, isoimperatorin and praeruptorin A are available from the authors. |


| Compounds | Regressive Equation | Line Range (µg mL−1) | r | Rf | LOD (µg mL−1) | LOQ (µg mL−1) | Repetition |
|---|---|---|---|---|---|---|---|
| RSD(%) | |||||||
| Chlorogenic acid | Y = 8509.311X − 113.31 | 0.2–50 | 0.9999 | 1 | 0.03 | 0.1 | 1.25 |
| p-Coumaric acid | Y = 7248.429X − 293.686 | 0.2–50 | 0.9996 | 0.783 | 0.06 | 0.2 | 2.39 |
| Scopoletin | Y = 9064.661X + 291.485 | 0.2–50 | 0.9998 | 2.234 | 0.06 | 0.2 | 1.81 |
| Ferulic acid | Y = 11890.98X − 1847.27 | 0.4–100 | 0.9999 | 1.291 | 0.06 | 0.2 | 2.36 |
| Coumarin | Y = 2289.637X + 10.744 | 0.4–100 | 0.9999 | 0.528 | 0.15 | 0.4 | 2.69 |
| Nodakenin | Y = 8779.59X − 291.147 | 0.4–100 | 0.9999 | 1.028 | 0.03 | 0.1 | 1.89 |
| Bergaptol | Y = 5205.188X − 195.825 | 0.2–50 | 0.9999 | 1.141 | 0.06 | 0.2 | 2.16 |
| Psoralen | Y = 5343.163X − 92.878 | 0.16–40 | 0.9999 | 1.163 | 0.05 | 0.15 | 4.09 |
| Angelicin | Y = 2935.177X − 2.095 | 0.16–40 | 0.9997 | 0.672 | 0.05 | 0.15 | 3.06 |
| 8-Methoxypsoralen | Y = 2590.638X + 61.142 | 0.1–25 | 0.9999 | 0.628 | 0.06 | 0.2 | 2.86 |
| Bergapten | Y = 5957.552X − 68.930 | 0.1–25 | 0.9999 | 1.329 | 0.03 | 0.1 | 1.63 |
| Diosmetin | Y = 10084.27X − 186.211 | 0.08–20 | 0.9998 | 2.187 | 0.02 | 0.08 | 3.17 |
| Byakangelico | Y = 3351.521X − 66.420 | 0.2–50 | 0.9998 | 0.751 | 0.08 | 0.2 | 1.16 |
| Imperatorin | Y = 2247.772X − 112.236 | 0.4–100 | 0.9999 | 0.5 | 0.12 | 0.4 | 2.02 |
| Phelloptorin | Y = 3329.094X + 50.928 | 0.1–25 | 0.9999 | 0.791 | 0.03 | 0.1 | 2.63 |
| Osthole | Y = 8868.786X + 12.322 | 0.32–80 | 0.9999 | 2.035 | 0.03 | 0.1 | 2.61 |
| Notopterol | Y = 4214.462X + 252.086 | 0.4–100 | 0.9999 | 1 | 0.06 | 0.2 | 1.77 |
| Isoimperatorin | Y = 2403.511X − 29.034 | 0.4–100 | 0.9999 | 0.547 | 0.06 | 0.2 | 1.67 |
| Praeruptorin A | Y = 5169.775X + 161.942 | 0.16–40 | 0.9999 | 1.272 | 0.05 | 0.15 | 2.63 |
| Compounds | Concentration (µg mL−1) | Intra-Day | Inter-Day | ||
|---|---|---|---|---|---|
| Accuracy (%) | RSD (%) | Accuracy (%) | RSD (%) | ||
| Chlorogenic acid | 0.3 | 98.2 | 3.94 | 98.9 | 2.83 |
| 3 | 97.1 | 2.02 | 98.0 | 2.20 | |
| 30 | 98.0 | 1.53 | 101 | 3.93 | |
| p-Coumaric acid | 0.25 | 97.1 | 2.60 | 92.8 | 5.65 |
| 2.5 | 109 | 2.08 | 110 | 2.69 | |
| 25 | 109 | 2.04 | 110 | 2.33 | |
| Scopoletin | 0.25 | 109 | 3.24 | 107 | 3.23 |
| 2.5 | 96.8 | 3.01 | 96.8 | 3.83 | |
| 25 | 95.4 | 3.34 | 95.7 | 2.32 | |
| Ferulic acid | 0.6 | 85.7 | 2.66 | 84.7 | 2.62 |
| 6 | 108 | 3.18 | 109 | 3.27 | |
| 60 | 114 | 1.35 | 114 | 2.01 | |
| Coumarin | 0.4 | 105 | 2.80 | 101 | 3.55 |
| 4 | 103 | 3.18 | 103 | 2.70 | |
| 40 | 102 | 3.44 | 102 | 2.89 | |
| Nodakenin | 0.6 | 100 | 2.75 | 99.3 | 2.14 |
| 6 | 106 | 1.13 | 106 | 1.33 | |
| 60 | 105 | 2.08 | 104 | 2.94 | |
| Bergaptol | 0.4 | 92.3 | 2.27 | 95.1 | 3.76 |
| 4 | 108 | 2.78 | 107 | 2.07 | |
| 40 | 107 | 1.39 | 105 | 4.14 | |
| Psoralen | 0.2 | 92.8 | 2.40 | 96.1 | 3.72 |
| 2 | 108 | 2.24 | 107 | 2.86 | |
| 20 | 107 | 2.92 | 109 | 2.94 | |
| Angelicin | 0.2 | 100 | 4.67 | 99.9 | 4.57 |
| 2 | 99.6 | 5.12 | 102 | 3.87 | |
| 20 | 101 | 3.85 | 101 | 4.34 | |
| 8-Methoxypsoralen | 0.2 | 105 | 1.83 | 106 | 3.23 |
| 2 | 97.3 | 3.19 | 96.7 | 3.50 | |
| 20 | 97.3 | 2.85 | 96.7 | 3.50 | |
| Bergapten | 0.2 | 101 | 2.36 | 99.4 | 3.02 |
| 2 | 106 | 4.08 | 103 | 4.42 | |
| 20 | 106 | 2.10 | 102 | 4.21 | |
| Diosmetin | 0.2 | 99.1 | 3.43 | 97.8 | 3.38 |
| 2 | 110 | 1.40 | 110 | 2.12 | |
| 20 | 109 | 2.52 | 108 | 4.69 | |
| Byakangelico | 0.4 | 101 | 4.52 | 98.7 | 3.96 |
| 4 | 106 | 1.87 | 105 | 2.25 | |
| 40 | 105 | 2.80 | 106 | 2.87 | |
| Imperatorin | 0.8 | 102 | 0.97 | 100 | 2.04 |
| 8 | 108 | 0.95 | 106 | 1.37 | |
| 80 | 108 | 1.80 | 107 | 1.75 | |
| Phelloptorin | 0.2 | 101 | 1.65 | 103 | 3.42 |
| 2 | 102 | 3.04 | 99.5 | 3.81 | |
| 20 | 99.0 | 4.42 | 98.2 | 5.09 | |
| Osthole | 0.5 | 101 | 1.12 | 102 | 2.07 |
| 5 | 103 | 1.82 | 102 | 2.14 | |
| 50 | 104 | 1.65 | 104 | 1.93 | |
| Notopterol | 0.6 | 108 | 2.24 | 107 | 2.57 |
| 6 | 94.9 | 4.55 | 101 | 3.14 | |
| 60 | 91.4 | 2.27 | 94.5 | 2.87 | |
| Isoimperatorin | 0.6 | 100 | 3.50 | 100 | 2.92 |
| 6 | 104 | 1.66 | 101 | 3.14 | |
| 60 | 104 | 6.32 | 102 | 4.41 | |
| Praeruptorin A | 0.2 | 109 | 4.58 | 108 | 3.26 |
| 2 | 92.2 | 3.01 | 93.9 | 2.99 | |
| 20 | 93.8 | 5.45 | 93.8 | 4.45 | |
| Compounds | Concentration (µg mL−1) | Stability | |
|---|---|---|---|
| Accuracy (%) | RSD (%) | ||
| Chlorogenic acid | 0.3 | 96.6 | 4.98 |
| 3 | 96.8 | 2.64 | |
| 30 | 95.4 | 1.70 | |
| p-Coumaric acid | 0.25 | 99.1 | 3.12 |
| 2.5 | 107 | 2.94 | |
| 25 | 113 | 5.66 | |
| Scopoletin | 0.25 | 103 | 5.46 |
| 2.5 | 96.5 | 4.25 | |
| 25 | 99.1 | 3.36 | |
| Ferulic acid | 0.6 | 83.2 | 4.54 |
| 6 | 114 | 2.84 | |
| 60 | 121 | 5.43 | |
| Coumarin | 0.4 | 102 | 5.05 |
| 4 | 104 | 5.47 | |
| 40 | 108 | 3.32 | |
| Nodakenin | 0.6 | 97.8 | 2.92 |
| 6 | 108 | 3.61 | |
| 60 | 108 | 3.13 | |
| Bergaptol | 0.4 | 98.5 | 1.85 |
| 4 | 107 | 3.22 | |
| 40 | 113 | 3.29 | |
| Psoralen | 0.2 | 98.0 | 4.82 |
| 2 | 108 | 3.56 | |
| 20 | 112 | 5.07 | |
| Angelicin | 0.2 | 96.6 | 4.67 |
| 2 | 104 | 4.13 | |
| 20 | 104 | 5.21 | |
| 8-Methoxypsoralen | 0.2 | 103 | 3.96 |
| 2 | 102 | 5.87 | |
| 20 | 101 | 3.79 | |
| Bergapten | 0.2 | 100 | 4.99 |
| 2 | 111 | 2.79 | |
| 20 | 111 | 5.03 | |
| Diosmetin | 0.2 | 101 | 4.32 |
| 2 | 113 | 5.68 | |
| 20 | 119 | 3.76 | |
| Byakangelico | 0.4 | 99.3 | 6.31 |
| 4 | 111 | 3.28 | |
| 40 | 107 | 2.94 | |
| Imperatorin | 0.8 | 98.8 | 3.80 |
| 8 | 110 | 4.29 | |
| 80 | 107 | 1.29 | |
| Phelloptorin | 0.2 | 100 | 4.21 |
| 2 | 99.1 | 2.93 | |
| 20 | 103 | 1.58 | |
| Osthole | 0.5 | 103 | 2.68 |
| 5 | 107 | 5.18 | |
| 50 | 103 | 4.83 | |
| Notopterol | 0.6 | 104 | 1.71 |
| 6 | 93.7 | 6.51 | |
| 60 | 91.5 | 3.22 | |
| Isoimperatorin | 0.6 | 99.0 | 3.04 |
| 6 | 101 | 3.77 | |
| 60 | 106 | 5.44 | |
| Praeruptorin A | 0.2 | 103 | 4.30 |
| 2 | 94.2 | 3.53 | |
| 20 | 92.1 | 3.32 | |
| Compounds | Origin | Added | SSMD | |
|---|---|---|---|---|
| Recovery (%) | RSD (%) | |||
| Chlorogenic acid | 3.47 | 2.80 | 102 | 3.00 |
| 3.50 | 109 | 4.37 | ||
| 4.20 | 98.5 | 3.26 | ||
| p-Coumaric acid | 1.09 | 0.80 | 122 | 2.62 |
| 1.00 | 124 | 3.30 | ||
| 1.20 | 119 | 6.29 | ||
| Scopoletin | 0.22 | 0.16 | 97.3 | 4.31 |
| 0.20 | 95.2 | 2.06 | ||
| 0.24 | 96.6 | 3.64 | ||
| Ferulic acid | 7.97 | 6.40 | 123 | 5.35 |
| 8.00 | 122 | 5.49 | ||
| 9.60 | 122 | 1.99 | ||
| Coumarin | 0.31 | 0.24 | 100 | 3.95 |
| 0.30 | 104 | 7.59 | ||
| 0.36 | 93.0 | 2.80 | ||
| Nodakenin | 7.93 | 6.40 | 107 | 3.01 |
| 8.00 | 113 | 6.18 | ||
| 9.60 | 108 | 4.45 | ||
| Bergaptol | 3.95 | 3.20 | 110 | 4.23 |
| 4.00 | 109 | 7.53 | ||
| 4.80 | 100 | 4.95 | ||
| Psoralen | 0.17 | 0.16 | 102 | 6.19 |
| 0.20 | 97.3 | 7.02 | ||
| 0.24 | 101 | 3.05 | ||
| Angelicin | 0.37 | 0.32 | 96.2 | 5.49 |
| 0.40 | 102 | 2.64 | ||
| 0.48 | 94.2 | 8.10 | ||
| 8-Methoxypsoralen | 0.40 | 0.32 | 90.8 | 1.23 |
| 0.40 | 95.9 | 7.64 | ||
| 0.48 | 87.9 | 4.55 | ||
| Bergapten | 0.20 | 0.16 | 101 | 5.76 |
| 0.20 | 108 | 4.56 | ||
| 0.24 | 106 | 5.85 | ||
| Diosmetin | 0.04 | 0.03 | 52.0 | 9.25 |
| 0.04 | 60.6 | 3.96 | ||
| 0.05 | 65.5 | 8.84 | ||
| Byakangelico | 2.68 | 2.40 | 105 | 6.82 |
| 3.00 | 108 | 4.64 | ||
| 3.60 | 106 | 7.47 | ||
| Imperatorin | 0.30 | 0.24 | 85.0 | 6.08 |
| 0.30 | 85.9 | 0.75 | ||
| 0.36 | 82.9 | 7.83 | ||
| Phelloptorin | 0.13 | 0.12 | 104 | 3.85 |
| 0.15 | 112 | 5.98 | ||
| 0.18 | 102 | 5.38 | ||
| Osthole | 27.40 | 24.00 | 104 | 2.43 |
| 30.00 | 109 | 5.11 | ||
| 36.00 | 91.1 | 7.64 | ||
| Notopterol | 48.42 | 40.00 | 85.6 | 6.93 |
| 50.00 | 89.0 | 3.51 | ||
| 60.00 | 89.7 | 2.75 | ||
| Isoimperatorin | 22.93 | 16.00 | 104 | 4.14 |
| 20.00 | 107 | 5.69 | ||
| 24.00 | 106 | 6.42 | ||
| Praeruptorin A | 0.32 | 0.24 | 96.8 | 6.48 |
| 0.30 | 103 | 6.90 | ||
| 0.40 | 103.0 | 3.96 | ||
| Peak No. | Rt (min) | m/z | M | Formula | Fragmentation | ppm | Identification |
|---|---|---|---|---|---|---|---|
| 1 | 1.5 | 115.0034 | [M − H]− | C4H4O4 | 99.9242,73.0302,53.0038 | 2.43 | fumaric acid |
| 2 | 2.3 | 353.0893 | [M − H]− | C16H18O9 | 233.0436, 205.0487,191.0553,127.0327 | −4.22 | neochlorogenic acid |
| 3 | 2.6 | 341.0885 | [M − H]− | C15H18O9 | 179.0347,135.044 | −2.03 | Caffeic acid 3-glucoside |
| 4 | 2.7 | 153.0186 | [M − H]− | C7H6O4 | 109.0287,91.0178 | 4.75 | 2,5-Dihydroxybenzoic acid |
| 5 | 4.3 | 353.0893 | [M − H]− | C16H18O9 | 191.0559,205.0487,135.045 | −4.22 | chlorogenic acid |
| 6 | 5.1 | 353.0882 | [M − H]− | C16H18O9 | 191.0559,205.0487 | −1.11 | cryptochlorogenin acid |
| 7 | 9.8 | 515.1195 | [M − H]− | C25H24O12 | 353.0916,191.0558,179.0349,161.0251,135.045 | 0.00 | isochlorogenic acid B |
| 8 | 10.7 | 163.0397 | [M − H]− | C9H8O3 | 119.0495,93.034 | 2.24 | p-Coumaric acid |
| 9 | 14.7 | 193.0507 | [M − H]− | C10H10O4 | 135.0411,133.0287,89.0324 | −0.35 | ferulic acid |
| 10 | 18.8 | 453.1405 | [M − H]− | C20H24O9 | 227.0703,89.0238 | −0.65 | nodakenin |
| 11 | 19.2 | 515.1206 | [M − H]− | C25H24O12 | 353.0916,191.0558,179.0349,161.0251,135.045 | -2.13 | isochlorogenic acid A |
| 12 | 20.3 | 515.1196 | [M − H]− | C25H24O12 | 353.0916,191.0558,179.0349,161.0251,135.046 | −0.19 | isochlorogenic acid C |
| 13 | 20.5 | 607.1672 | [M − H]− | C28H32O15 | 300.0596,284.0330 | −0.59 | diosmin-d3 |
| 14 | 4.2 | 163.0389 | [M + H]+ | C9H6O3 | 145.0482 | 0.44 | umbelliferone |
| 15 | 12.3 | 193.0492 | [M + H]+ | C10H8O4 | 94.0412,178.0243,150.0289,122.0363,66.0465 | 1.75 | Scopoletin |
| 16 | 18.2 | 207.0642 | [M + H]+ | C11H10O4 | 146.0484 | 4.78 | 6,7-Dimethoxy coumarin |
| 17 | 21.2 | 203.0348 | [M + H]+ | C11H6O4 | 147.0443,119.0502,91.0541,65.0387 | −4.53 | bergaptol |
| 18 | 21.9 | 187.039 | [M + H]+ | C11H6O3 | 131.0489 | −0.16 | psoralen |
| 19 | 22.2 | 187.0401 | [M + H]+ | C11H6O3 | 131.0490 | −4.17 | angelicin |
| 20 | 22.3 | 305.1025 | [M + H]+ | C16H16O6 | 203.0331,147.0433,131.0483,159.0438 | −1.76 | oxypeucedanin hydrate |
| 21 | 23.1 | 217.051 | [M + H]+ | C12H8O4 | 146.0453,161.0601 | −6.78 | 8-Methoxypsoralen |
| 22 | 24 | 247.0602 | [M + H]+ | C13H10O5 | 217.0112,189.0178,161.0230,133.0280 | −0.41 | pimpinellin |
| 23 | 24.1 | 217.0472 | [M + H]+ | C12H8O4 | 174.0305,146.0355,118.0408,131.0494,202.0249 | −0.76 | bergapten |
| 24 | 24.2 | 301.0721 | [M + H]+ | C16H12O6 | 217.0134,173.0284 | −5.12 | diosmetin |
| 25 | 24.8 | 247.0602 | [M + H]+ | C13H10O5 | 217.0112,189.0178,161.0230,133.0280 | −0.41 | isopimpinellin |
| 26 | 25 | 203.0339 | [M + H]+ | C11H6O4 | 119.0846,105.0698,91.0544 | −0.07 | xanthotol |
| 27 | 25.2 | 231.1016 | [M + H]+ | C14H14O3 | 147.0434,119.0488 | −0.13 | 7-(3-methylbut-2-enoxy)chromen-2-one |
| 28 | 27.7 | 271.0969 | [M + H]+ | C16H14O4 | 203.0328,147.0433,91.0545 | −1.54 | imperatorin |
| 29 | 28.0 | 301.1092 | [M + H]+ | C17H16O5 | 217.0144,189.0173,173.0281,218.0197,162.0312 | −7.16 | phelloptorin |
| 30 | 28.5 | 245.1190 | [M + H]+ | C15H16O3 | 189.1097,131.0491 | −2.19 | osthole |
| 31 | 29.1 | 377.1369 | [M + Na]+ | C21H22O5 | 203.0345,147.0412,91.0529,159.0391,131.0506 | −2.7 | notopterol |
| 32 | 30.1 | 271.0976 | [M + H]+ | C16H14O4 | 203.0329,147.0437,91.0545,159.0433,131.0486 | −4.31 | isoimperatorin |
| 33 | 31.6 | 409.1277 | [M + H]+ | C21H22O7 | 409.1277 | −4.99 | praeruptorin A |
| Constant (mg g−1) SSMD | Compounds | ||||||||||||||||||||
|---|---|---|---|---|---|---|---|---|---|---|---|---|---|---|---|---|---|---|---|---|---|
| Chlorogenic Acid | p-Coumaric Acid | Scopoletin | Ferulic Acid | Coumarin | Nodakenin | Bergaptol | Psoralen | Angelicin | 8-Methoxypsoralen | Bergapten | Diosmetin | Byakangelico | Imperatorin | Phelloptorin | Osthole | Notopterol | Isoimperatorin | Praeruptorin A | Discrimination | Score | |
| 1Sichuan(chengdu) | 0.55 | 0.20 | 0.00 | 0.75 | 0.02 | 1.82 | 0.15 | 0.01 | 0.02 | 0.02 | 0.01 | 0.00 | 0.49 | 0.00 | 0.12 | 4.53 | 2.46 | 1.44 | 0.12 | IR | |
| 2Sishuan(meishan) | 3.05 | 0.75 | 0.03 | 2.53 | 0.03 | 1.56 | 0.22 | 0.08 | 0.06 | 0.09 | 0.06 | 0.00 | 1.25 | 0.05 | 0.04 | 7.08 | 8.92 | 4.33 | 0.00 | 1 | 3.562 |
| 3Sichuan(leshan) | 0.34 | 0.10 | 0.02 | 0.80 | 0.00 | 0.83 | 0.40 | 0.02 | 0.02 | 0.06 | 0.03 | 0.00 | 0.24 | 0.05 | 0.03 | 2.62 | 4.42 | 2.25 | 0.03 | 1 | 0.556 |
| 4Sichuan(ya’an) | 0.26 | 0.22 | 0.03 | 0.66 | 0.00 | 0.75 | 0.13 | 0.02 | 0.06 | 0.04 | 0.01 | 0.30 | 0.43 | 0.37 | 0.14 | 2.80 | 4.89 | 3.41 | 0.03 | 1 | 0.966 |
| 5Sichuan(guanghan) | 0.79 | 0.08 | 0.00 | 0.87 | 0.07 | 0.96 | 0.12 | 0.00 | 0.03 | 0.07 | 0.16 | 0.02 | 0.67 | 104.51 | 0.04 | 0.30 | 1.17 | 22.81 | 0.44 | 1 | 2.087 |
| 6Sichuan(mianyang) | 0.77 | 0.14 | 0.03 | 1.15 | 0.02 | 5.63 | 0.33 | 0.04 | 0.09 | 0.10 | 0.17 | 3.12 | 1.39 | 2.53 | 0.21 | 2.17 | 3.71 | 4.51 | 0.00 | 1 | 2.304 |
| 7Sichuan(luzhou) | 0.24 | 0.31 | 0.02 | 0.81 | 0.02 | 1.36 | 0.33 | 0.03 | 0.02 | 0.06 | 0.03 | 0.02 | 0.50 | 0.32 | 0.04 | 4.81 | 5.99 | 3.99 | 0.02 | 1 | 1.912 |
| 8Shanxi | 0.15 | 0.56 | 0.00 | 0.03 | 0.00 | 0.16 | 0.15 | 0.04 | 0.49 | 0.59 | 0.04 | 0.00 | 0.10 | 0.20 | 0.10 | 0.16 | 3.67 | 0.54 | 1.38 | 2 | −1.599 |
| 9Gansu | 0.71 | 0.17 | 0.03 | 0.86 | 0.02 | 1.24 | 0.21 | 0.04 | 0.02 | 0.06 | 0.04 | 0.02 | 0.43 | 0.10 | 0.03 | 2.26 | 3.66 | 2.16 | 0.03 | 1 | 0.227 |
| 10Gansu | 1.08 | 0.05 | 0.08 | 0.66 | 0.04 | 29.73 | 1.53 | 0.03 | 0.20 | 0.15 | 0.14 | 0.03 | 3.18 | 0.12 | 0.61 | 0.06 | 0.19 | 31.07 | 0.00 | 2 | −2.789 |
| 11Sichuan(yibin) | 1.76 | 0.53 | 0.04 | 1.21 | 0.01 | 0.78 | 0.15 | 0.05 | 0.13 | 0.11 | 0.02 | 0.00 | 0.73 | 0.11 | 0.03 | 4.50 | 5.04 | 1.98 | 0.00 | 1 | 1.586 |
| 12Sichuan(xinjin) | 0.10 | 0.03 | 0.00 | 0.29 | 0.01 | 0.36 | 0.63 | 0.02 | 0.01 | 0.07 | 0.02 | 0.28 | 0.07 | 0.14 | 0.04 | 0.59 | 2.25 | 3.29 | 0.00 | 1 | −0.602 |
| 13Sichuan(bazhong) | 0.17 | 0.04 | 0.00 | 0.49 | 0.03 | 23.17 | 2.91 | 0.01 | 0.13 | 0.13 | 0.15 | 5.96 | 3.12 | 0.34 | 0.57 | 0.44 | 0.82 | 22.57 | 0.06 | 1 | 2.009 |
| 14Sichuan(neijiang) | 0.34 | 0.15 | 0.00 | 0.88 | 0.00 | 0.70 | 0.09 | 0.04 | 0.02 | 0.10 | 0.02 | 0.02 | 0.61 | 0.02 | 0.03 | 3.20 | 5.63 | 1.21 | 0.24 | 1 | 0.967 |
| 15Sichuan(ziyang) | 1.28 | 0.44 | 0.03 | 1.08 | 0.01 | 0.81 | 0.34 | 0.03 | 0.06 | 0.09 | 0.03 | 0.00 | 0.69 | 0.22 | 0.03 | 4.01 | 5.86 | 2.26 | 0.00 | 1 | 1.531 |
| 16Yunnan(kunming) | 1.59 | 0.14 | 0.03 | 0.61 | 0.01 | 28.10 | 0.81 | 0.03 | 0.27 | 0.12 | 0.28 | 0.28 | 2.23 | 0.51 | 0.37 | 0.05 | 0.19 | 26.10 | 0.00 | 2 | −2.528 |
| 17Qinhai | 2.75 | 0.25 | 0.03 | 0.93 | 0.01 | 16.61 | 0.22 | 0.03 | 0.16 | 0.07 | 0.22 | 0.01 | 0.33 | 0.00 | 0.96 | 1.10 | 1.76 | 10.29 | 0.00 | 2 | −1.399 |
| 18Sichuan | 0.88 | 0.23 | 0.05 | 0.88 | 0.02 | 5.06 | 0.62 | 0.08 | 0.04 | 0.22 | 0.03 | 0.01 | 0.28 | 4.71 | 0.09 | 6.23 | 0.85 | 3.93 | 0.36 | 1 | 1.264 |
| 19Sichuan | 0.32 | 0.22 | 0.04 | 0.86 | 0.01 | 4.43 | 1.72 | 0.02 | 0.04 | 0.11 | 0.00 | 0.03 | 0.36 | 6.96 | 0.06 | 4.55 | 2.69 | 4.88 | 0.00 | 1 | 1.208 |
| 20Sichuan | 0.33 | 0.31 | 0.00 | 0.00 | 0.00 | 0.10 | 0.31 | 0.03 | 0.02 | 0.21 | 0.01 | 0.00 | 0.03 | 0.02 | 0.00 | 0.14 | 0.54 | 2.83 | 0.73 | IR | |
| 21Sichuan | 0.37 | 0.14 | 0.05 | 0.81 | 0.01 | 1.36 | 0.79 | 0.07 | 0.04 | 0.16 | 0.03 | 0.25 | 0.34 | 0.41 | 0.04 | 3.18 | 0.59 | 2.14 | 0.00 | IR | |
| 22Shandong(taishan) | 1.52 | 0.26 | 0.03 | 1.12 | 0.07 | 1.23 | 0.17 | 0.07 | 0.06 | 0.15 | 0.06 | 0.00 | 0.28 | 0.45 | 0.02 | 2.35 | 1.94 | 0.89 | 0.83 | IR | |
| 23Neimeng | 0.17 | 1.04 | 0.03 | 0.09 | 0.03 | 0.14 | 0.16 | 0.05 | 1.71 | 0.26 | 0.06 | 0.01 | 0.10 | 0.40 | 0.32 | 0.16 | 1.39 | 3.04 | 2.78 | 2 | −2.897 |
| 24Gansu | 0.31 | 0.06 | 0.02 | 0.55 | 0.03 | 8.56 | 0.38 | 0.00 | 0.08 | 0.07 | 0.04 | 0.00 | 0.46 | 0.07 | 0.06 | 0.65 | 0.79 | 6.26 | 0.00 | 2 | −1.451 |
| 25Gansu | 0.80 | 0.11 | 0.00 | 1.19 | 0.01 | 15.06 | 0.81 | 0.03 | 0.20 | 0.08 | 0.09 | 0.03 | 1.54 | 0.00 | 0.13 | 2.06 | 2.29 | 12.18 | 0.00 | 2 | −0.756 |
| 26Anhui | 0.15 | 0.12 | 0.02 | 0.41 | 0.01 | 0.46 | 0.43 | 0.05 | 0.01 | 0.51 | 0.06 | 0.01 | 0.17 | 0.61 | 0.02 | 1.86 | 4.12 | 2.63 | 4.35 | 2 | −2.526 |
| 27Sichuan | 0.29 | 0.75 | 0.00 | 2.37 | 0.04 | 1.04 | 0.45 | 0.03 | 0.02 | 0.06 | 0.05 | 0.00 | 0.64 | 0.00 | 0.04 | 4.67 | 6.80 | 11.25 | 0.00 | 1 | 2.017 |
| 28Sichuan | 0.11 | 0.06 | 0.00 | 0.51 | 0.01 | 0.56 | 0.23 | 0.00 | 0.01 | 0.02 | 0.04 | 0.01 | 0.14 | 0.09 | 0.00 | 1.39 | 0.71 | 0.85 | 0.02 | IR | |
| 29Tianjin | 0.19 | 0.41 | 0.02 | 0.61 | 0.01 | 0.60 | 0.17 | 0.03 | 0.02 | 0.08 | 0.00 | 0.01 | 0.56 | 0.03 | 0.03 | 3.37 | 0.52 | 0.84 | 0.00 | IR | |
| 30Shanxi | 0.49 | 0.06 | 0.00 | 1.28 | 0.00 | 32.45 | 3.06 | 0.02 | 0.13 | 0.15 | 0.31 | 0.03 | 0.54 | 0.28 | 0.52 | 0.04 | 3.16 | 0.04 | 0.00 | IR | |
| 31Shanxi | 1.68 | 0.22 | 0.00 | 1.06 | 0.08 | 49.95 | 3.10 | 0.03 | 0.25 | 0.14 | 0.30 | 0.06 | 3.30 | 0.41 | 0.66 | 0.01 | 6.16 | 0.02 | 0.00 | 2 | −2.453 |
| 32Shanxi | 0.74 | 0.15 | 0.00 | 1.47 | 0.00 | 71.70 | 3.93 | 0.03 | 0.30 | 0.34 | 0.25 | 0.05 | 2.24 | 0.64 | 0.62 | 0.01 | 7.13 | 0.06 | 0.00 | 2 | −3.236 |
| RD (%) | Compounds | ||||||||||||||||||
|---|---|---|---|---|---|---|---|---|---|---|---|---|---|---|---|---|---|---|---|
| Chlorogenic Acid | p-Coumaric acid | Scopoletin | Ferulic Acid | Coumarin | Nodakenin | Bergaptol | Psoralen | Angelicin | 8-Methoxypsoralen | Bergapten | Diosmetin | Byakangelico | Imperatorin | Phelloptorin | Osthole | Notopterol | Isoimperatorin | Praeruptorin A | |
| 1Sichuan(chengdu) | 1.34 | 8.09 | 0.00 | 7.53 | 1.51 | 1.79 | 1.98 | 6.42 | 0.11 | 4.43 | 8.52 | 0.00 | 1.95 | 0.00 | 2.26 | 0.10 | 3.15 | 0.63 | 4.55 |
| 2Sishuan(meishan) | 1.54 | 9.82 | 2.58 | 9.24 | 0.82 | 1.76 | 2.79 | 3.08 | 0.09 | 2.91 | 0.88 | 0.00 | 2.21 | 7.56 | 0.01 | 0.10 | 3.32 | 0.68 | 0.00 |
| 3Sichuan(leshan) | 1.18 | 5.56 | 7.85 | 7.69 | 4.74 | 1.56 | 3.59 | 2.65 | 0.13 | 1.36 | 0.81 | 0.00 | 1.52 | 6.69 | 1.89 | 0.10 | 3.25 | 0.66 | 1.70 |
| 4Sichuan(ya’an) | 1.05 | 8.29 | 1.86 | 7.21 | 3.12 | 1.52 | 1.55 | 2.73 | 0.09 | 0.25 | 6.65 | 5.03 | 1.90 | 1.61 | 2.46 | 0.10 | 3.27 | 0.68 | 5.42 |
| 5Sichuan(guanghan) | 1.41 | 4.81 | 0.00 | 7.87 | 0.15 | 1.62 | 1.33 | 0.00 | 0.00 | 2.31 | 2.04 | 5.23 | 2.07 | 3.00 | 0.04 | 0.06 | 2.90 | 0.71 | 6.21 |
| 6Sichuan(mianyang) | 1.40 | 7.04 | 4.28 | 8.37 | 1.78 | 1.92 | 3.37 | 0.92 | 0.13 | 3.15 | 2.09 | 5.64 | 2.22 | 2.80 | 2.76 | 0.10 | 3.23 | 0.68 | 0.00 |
| 7Sichuan(luzhou) | 1.02 | 8.91 | 8.55 | 7.71 | 1.68 | 1.73 | 3.37 | 0.33 | 0.20 | 1.23 | 1.58 | 4.33 | 1.96 | 1.37 | 0.52 | 0.10 | 3.29 | 0.68 | 11.5 |
| 8Shanxi | 0.70 | 9.60 | 0.00 | 7.93 | 2.92 | 0.18 | 1.99 | 0.58 | 0.19 | 4.87 | 0.13 | 0.00 | 0.25 | 0.48 | 2.07 | 0.02 | 3.23 | 0.49 | 6.63 |
| 9Gansu | 1.39 | 7.69 | 3.24 | 7.85 | 2.10 | 1.70 | 2.66 | 0.19 | 0.09 | 1.78 | 0.49 | 5.85 | 1.89 | 1.85 | 1.02 | 0.10 | 3.23 | 0.65 | 3.34 |
| 10Gansu | 1.46 | 1.32 | 3.37 | 7.21 | 0.55 | 1.97 | 4.34 | 0.09 | 0.17 | 3.77 | 1.92 | 0.06 | 2.31 | 1.33 | 3.22 | 0.13 | 0.27 | 0.71 | 0.00 |
| 11Sichuan(yibin) | 1.50 | 9.55 | 0.46 | 8.45 | 3.72 | 1.54 | 1.87 | 1.71 | 0.15 | 3.21 | 2.31 | 0.00 | 2.09 | 1.77 | 0.89 | 0.10 | 3.27 | 0.65 | 0.00 |
| 12Sichuan(xinjin) | 0.27 | 5.56 | 0.00 | 3.87 | 4.11 | 1.03 | 3.95 | 3.48 | 1.19 | 2.10 | 2.10 | 4.98 | 0.51 | 0.60 | 0.35 | 0.08 | 3.13 | 0.67 | 0.00 |
| 13Sichuan(bazhong) | 0.79 | 1.50 | 0.00 | 6.26 | 1.15 | 1.96 | 4.46 | 8.53 | 0.15 | 3.60 | 2.00 | 5.68 | 2.31 | 1.49 | 3.20 | 0.07 | 2.69 | 0.71 | 2.15 |
| 14Sichuan(neijiang) | 1.18 | 7.26 | 0.00 | 7.89 | 0.00 | 1.48 | 0.21 | 0.48 | 0.25 | 3.07 | 1.92 | 5.34 | 2.03 | 14.9 | 1.06 | 0.10 | 3.28 | 0.61 | 5.67 |
| 15Sichuan(ziyang) | 1.48 | 9.35 | 2.12 | 8.27 | 3.36 | 1.55 | 3.40 | 0.03 | 0.08 | 2.72 | 1.33 | 0.00 | 2.07 | 0.70 | 2.37 | 0.10 | 3.29 | 0.66 | 0.00 |
| 16Yunnan(kunming) | 1.50 | 7.05 | 5.04 | 6.99 | 3.24 | 1.97 | 4.10 | 1.08 | 0.18 | 3.40 | 2.35 | 4.98 | 2.28 | 1.98 | 3.07 | 0.19 | 0.37 | 0.71 | 0.00 |
| 17Qinhai | 1.53 | 8.51 | 4.61 | 7.99 | 2.77 | 1.96 | 2.74 | 1.58 | 0.16 | 1.86 | 2.24 | 9.19 | 1.75 | 0.00 | 3.31 | 0.09 | 3.06 | 0.70 | 0.00 |
| 18Sichuan | 1.43 | 8.41 | 1.05 | 7.89 | 1.66 | 1.91 | 3.94 | 3.05 | 0.04 | 4.26 | 0.64 | 8.12 | 1.65 | 2.90 | 1.89 | 0.10 | 2.72 | 0.68 | 6.07 |
| 19Sichuan | 1.15 | 8.31 | 0.14 | 7.84 | 4.02 | 1.90 | 4.37 | 5.46 | 0.03 | 3.18 | 0.00 | 0.78 | 1.80 | 2.93 | 0.97 | 0.10 | 3.17 | 0.69 | 0.00 |
| 20Sichuan | 1.17 | 8.93 | 0.00 | 0.00 | 0.00 | 1.45 | 3.31 | 0.83 | 0.14 | 4.20 | 5.78 | 0.00 | 4.30 | 14.6 | 0.00 | 0.00 | 2.33 | 0.67 | 6.46 |
| 21Sichuan | 1.22 | 7.08 | 0.88 | 7.72 | 6.91 | 1.73 | 4.08 | 2.75 | 0.02 | 3.85 | 1.74 | 4.90 | 1.77 | 1.73 | 0.60 | 0.10 | 2.43 | 0.65 | 0.00 |
| 22Shandong(taishan) | 1.49 | 8.63 | 5.39 | 8.33 | 0.13 | 1.70 | 2.28 | 2.60 | 0.08 | 3.82 | 0.65 | 0.00 | 1.64 | 1.85 | 6.03 | 0.10 | 3.09 | 0.57 | 6.50 |
| 23Neimeng | 0.76 | 10.0 | 4.01 | 7.60 | 1.08 | 0.45 | 2.13 | 1.31 | 0.20 | 4.40 | 0.66 | 9.98 | 0.39 | 1.72 | 3.01 | 0.02 | 2.98 | 0.67 | 6.73 |
| 24Gansu | 1.15 | 2.38 | 7.27 | 6.64 | 1.12 | 1.94 | 3.53 | 0.00 | 0.12 | 1.97 | 0.54 | 0.00 | 1.92 | 3.82 | 0.90 | 0.08 | 2.67 | 0.69 | 0.00 |
| 25Gansu | 1.41 | 6.26 | 0.00 | 8.42 | 4.82 | 1.96 | 4.10 | 1.32 | 0.17 | 2.41 | 1.48 | 0.86 | 2.24 | 0.00 | 2.37 | 0.09 | 3.14 | 0.70 | 0.00 |
| 26Anhui | 0.65 | 6.61 | 9.07 | 5.55 | 6.25 | 1.23 | 3.65 | 1.92 | 0.88 | 4.81 | 0.84 | 10.5 | 1.18 | 2.15 | 3.21 | 0.09 | 3.25 | 0.67 | 6.77 |
| 27Sichuan | 1.12 | 9.81 | 0.00 | 9.19 | 0.69 | 1.65 | 3.70 | 0.73 | 0.14 | 1.66 | 0.17 | 0.00 | 2.05 | 0.00 | 0.12 | 0.10 | 3.30 | 0.70 | 0.00 |
| 28Sichuan | 0.40 | 3.04 | 0.00 | 6.41 | 5.84 | 1.36 | 2.88 | 0.00 | 0.43 | 7.53 | 0.44 | 14.4 | 0.94 | 2.36 | 0.00 | 0.09 | 2.59 | 0.57 | 5.53 |
| 29Tianjin | 0.85 | 9.29 | 9.33 | 6.99 | 4.56 | 1.40 | 2.25 | 1.02 | 0.21 | 2.46 | 0.00 | 11.4 | 2.00 | 12.7 | 1.08 | 0.10 | 2.30 | 0.57 | 0.00 |
| 30Shanxi | 1.30 | 2.74 | 0.00 | 8.53 | 0.00 | 1.97 | 4.47 | 3.15 | 0.16 | 3.85 | 2.40 | 1.64 | 1.99 | 1.13 | 3.18 | 0.25 | 3.20 | 2.07 | 0.00 |
| 31Shanxi | 1.50 | 8.27 | 0.00 | 8.24 | 0.06 | 1.97 | 4.47 | 1.81 | 0.18 | 3.73 | 2.38 | 2.39 | 2.31 | 1.73 | 3.24 | 2.19 | 3.29 | 4.11 | 0.00 |
| 32Shanxi | 1.40 | 7.37 | 0.00 | 8.72 | 9.90 | 1.97 | 4.50 | 0.51 | 0.19 | 4.61 | 2.29 | 1.69 | 2.28 | 2.19 | 3.22 | 2.70 | 3.30 | 1.41 | 0.00 |
© 2019 by the authors. Licensee MDPI, Basel, Switzerland. This article is an open access article distributed under the terms and conditions of the Creative Commons Attribution (CC BY) license (http://creativecommons.org/licenses/by/4.0/).
Share and Cite
Yu, X.-A.; Li, J.; Azietaku, J.T.; Liu, W.; He, J.; Chang, Y.-X. A Single Standard to Determine Multi-Components Method Coupled with Chemometric Methods for the Quantification, Evaluation and Classification of Notopterygii Rhizoma et Radix from Different Regions. Molecules 2019, 24, 3574. https://doi.org/10.3390/molecules24193574
Yu X-A, Li J, Azietaku JT, Liu W, He J, Chang Y-X. A Single Standard to Determine Multi-Components Method Coupled with Chemometric Methods for the Quantification, Evaluation and Classification of Notopterygii Rhizoma et Radix from Different Regions. Molecules. 2019; 24(19):3574. https://doi.org/10.3390/molecules24193574
Chicago/Turabian StyleYu, Xie-An, Jin Li, John Teye Azietaku, Wei Liu, Jun He, and Yan-Xu Chang. 2019. "A Single Standard to Determine Multi-Components Method Coupled with Chemometric Methods for the Quantification, Evaluation and Classification of Notopterygii Rhizoma et Radix from Different Regions" Molecules 24, no. 19: 3574. https://doi.org/10.3390/molecules24193574
APA StyleYu, X.-A., Li, J., Azietaku, J. T., Liu, W., He, J., & Chang, Y.-X. (2019). A Single Standard to Determine Multi-Components Method Coupled with Chemometric Methods for the Quantification, Evaluation and Classification of Notopterygii Rhizoma et Radix from Different Regions. Molecules, 24(19), 3574. https://doi.org/10.3390/molecules24193574