Article

Identification of Chemical Markers for the Discrimination of Radix Angelica sinensis Grown in Geoherb and Non-Geoherb Regions Using UHPLC-QTOF-MS/MS Based Metabolomics

1
School of Pharmacy, Lanzhou University, Lanzhou 730000, China
2
College of Pharmacy, Nankai University, State Key Laboratory of Medicinal Chemical Biology, Tianjin 300350, China
3
School of Chinese Materia Medica, Beijing University of Chinese Medicine, Beijing 100029, China
*
Author to whom correspondence should be addressed.
Molecules 2019, 24(19), 3536; https://doi.org/10.3390/molecules24193536
Submission received: 19 July 2019 / Revised: 11 September 2019 / Accepted: 28 September 2019 / Published: 30 September 2019

Abstract

:
This research aimed to discover chemical markers for discriminating radix Angelica sinensis (RAS) from different regions and to explore the differences of RAS in the content of four active compounds and anti-inflammatory activities on lipopolysacchride (LPS)-induced RAW264.7 cells and calcium antagonists on the HEK 293T cells of RAS. Nine compounds were selected as characteristic chemical markers by ultra-high-performance liquid chromatography-quadrupole/time-of-flight mass spectrometry (UHPLC-QTOF-MS/MS), based on metabolomics, in order to rapidly discriminate RAS from geoherb and non-geoherb regions. The contents of senkyunolide I and butylidenephthalide in geoherb samples were higher than those in non-geoherb samples, but the contents of ferulic acid and levistolide A were lower in the geoherb samples. Furthermore, the geoherbs showed better nitric oxide (NO) inhibitory and calcium antagonistic activities than the non-geoherbs. These results demonstrate the diversity in quality of RAS between geoherbs and non-geoherbs.

1. Introduction

The radix of Angelica sinensis (Oliv.) Diels (RAS) has played an important role in traditional Chinese medicine (TCM) for thousands of years, due to its functions of replenishing and invigorating the blood, stopping pain, and moistening the intestines [1]. Phthalides and their dimers, phenolic acids, polysaccharides, and flavonoids are reported as the main constituents of RAS [2]. It was confirmed that RAS can be used to treat inflammation [3], cancer [4], cardiovascular disease [5], and Alzheimer’s disease [6]. The Min County of Gansu Province is the traditional geoherb region of RAS, due to its superior qualities, and RAS from this region is popularly used in clinical practice [7].
Metabolomics, a new branch of systems biology, is a powerful tool for the comprehensive profiling and comparison of metabolites. Liquid chromatography–mass spectrometry (LC–MS) and gas chromatography–mass spectrometry (GC–MS) are the routine analysis methods in metabolomics studies. It was reported that β-ocimene, α-pinene, 3-methylbutanal, heptanes, and butanal are potential markers to distinguish RAS between geoherb and non-geoherb regions, using automated headspace solvent-free micro-extraction/gas chromatography–mass spectrometry (HS-SFME/GC–MS) [8]. Wang et al. found eighteen metabolites in the growth periods of RAS using ultra-high-performance liquid chromatography/time-of-flight mass spectrometry (UHPLC-TOF-MS) [9]. Ten major bioactive components were reported as chemical markers with the effect of different drying methods of RAS using UHPLC-QTOF-MS/MS [10]. (3Z)-6-sulfite-ligustilide and (3E)-6-sulfite-ligustilide are potential characteristic chemical markers for inspecting sulfur-fumigated RAS among commercial RAS samples by UHPLC-QTOF-MS/MS [11]. Li et al. found nine potential metabolite biomarkers in the plasma and nine potential metabolite biomarkers in spleen homogenates on the hematopoietic function of RAS in a blood-deficiency mouse model by GC–MS [12]. To our knowledge, RAS from geoherbs is sold at high prices and has a similar appearance in TCM markets. Meanwhile, studies on the discrimination of RAS between geoherbs and non-geoherbs by LC–MS are still rare, although there are many reports on RAS that were based on metabolomics. Therefore, it is necessary to find a method to rapidly identify geoherb RAS.
There were many recent studies on the determination of the content in RAS samples. The content of ferulic acid was highest in samples collected in Yunnan, followed by the Gansu and Sichuan Provinces [13]. Shi et al. simultaneously determined the content of seven active components in RAS, before and after sulfur fumigation, by UHPLC, and concluded that sulfur fumigation decreased the content of ferulic acid, ligustilide, n-butylidenephthalide, senkyunolide A, senkyunolide H, senkyunolide I, and levistilide A [14].
Inflammatory processes are normal physiological immune functions [15], and many inflammatory disorders exist, such as infection, metabolic diseases, cancers, and aging, in which excessive inflammation occurs [16]. Macrophages, which are essential immune cells, induce inflammation by producing NO, prostaglandin E2, and pro-inflammatory cytokines. The anti-inflammatory mechanism of RAS is speculated to directly or indirectly inhibit target cells secreting TNF-α, IL-6, IL-lβ, IL-2, and NO, promoting anti-inflammatory cytokine release [17]. Li et al. found that essential oil extracted from RAS had a certain inhibitory effect on early and late inflammatory reactions, as well as showing inhibitory activities on the writhing reaction of mice caused by chemical substances [18].
Hypertension is one of the major chronic diseases which causes serious damage to human health. Calcium channel blockers are commonly used to treat hypertension because of their remarkable efficacy [19]. RAS, with the function of promoting blood circulation and removing stasis, could be used as a treatment for hypertension in the elderly. Furthermore, the extracts of RAS could reduce blood pressure through certain receptors and channels, reducing renin–angiotensin activity and lowering lipids and viscosity in modern pharmacology [20]. The volatile oil of RAS could inhibit the contraction of vascular smooth muscle induced by potassium chloride. Its antihypertensive effects on hypertension-model mice was demonstrated, and its inhibitory effects on both receptor-operated Ca2+ channels and voltage-operated Ca2+ channels mediating aortic smooth muscle contractions were proved [21].
In this study, the UHPLC-QTOF-MS/MS method, based on metabolomics, was applied to comprehensively characterize the chemical components of RAS, in order to find characteristic chemical markers between geoherbs and non-geoherbs. In order to explore the differences in content and activity further, we quantified four active compounds and evaluated their anti-inflammatory activities on LPS-induced RAW264.7 cells and calcium antagonists on the HEK 293T cells.

2. Results and Discussion

2.1. Characteristic Chemical Markers Analysis by UHPLC-QTOF-MS/MS

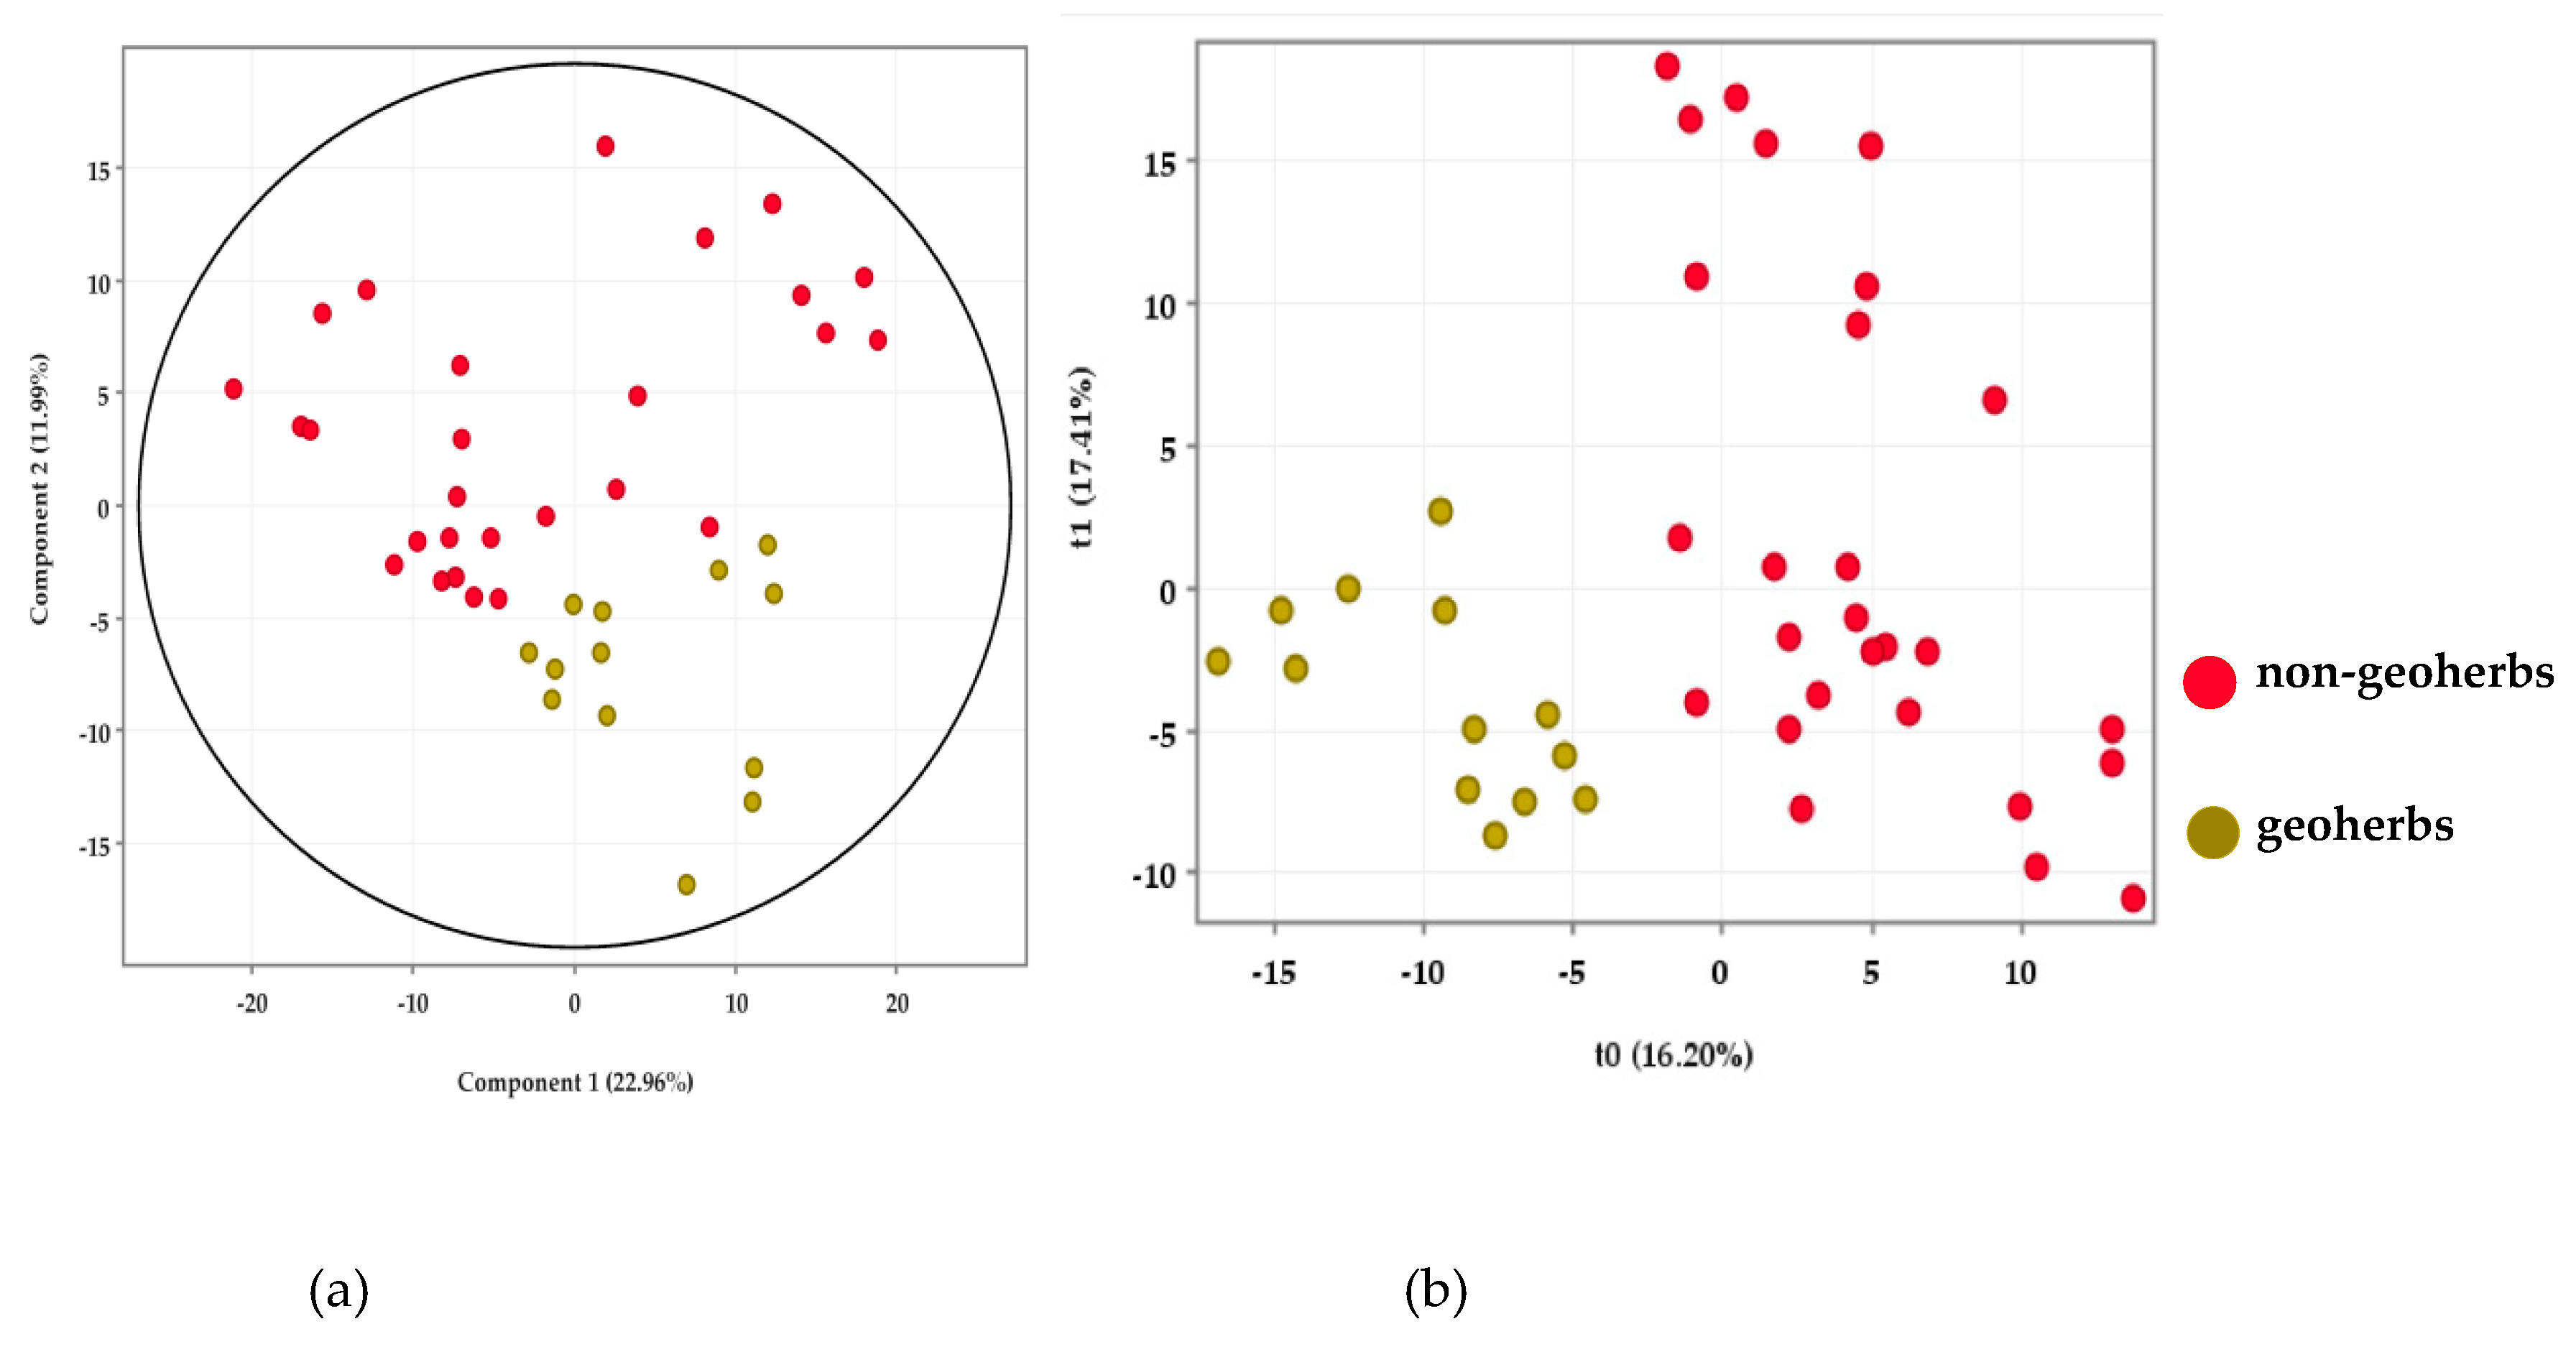
2.1.1. Multivariate Data Analysis

In order to examine the chemical differences between geoherbs and non-geoherbs, an unsupervised pattern recognition of the principal component analysis (PCA) was operated. The PCA scores (Figure 1a) show an obvious separation. The samples from the non-geoherb regions presented relative dispersion, which could be related to the fact that they came from distinct geographical regions.
In partial least squares–discriminant analysis (PLS–DA) modelling (Figure 1b), the samples from geoherb and non-geoherb regions were sorted into two groups. It is obvious that the composition of RAS from geoherb regions was distinctively different from that of those from non-geoherb regions. The result was basically consistent with that of the PCA. Environmental factors, including altitude, sunlight, soil, water, temperature, and topography, all have a great influence on the qualities of geoherbs [21]. Consequently, the relationship between quality of RAS and geographical factors can be studied in the future. The R2X, R2Y, and Q2Y of the PLS–DA model were 0.444, 0.972, and 0.442, respectively. The permutation result validated the stability and reliability of this PLS–DA model.
It was possible to select markers that contributed significantly to the grouping by setting the Variable Importance for Projection (VIP) value greater than 1.5 and the p-value less than 0.05 in the Moderated t-Test. A total of nine markers, M1M9, were, therefore, obtained (see Figure 1c and Table 1), and they were highlighted in the PCA loadings (Supplemental Figure S1).
It can be seen from the heatmap that most characteristic chemical markers had low content in the non-geoherbs. It was interesting that the content of the marker ions m/z 130.0868, 313.1074, 387.1074, 563.1888, 641.2017, 751.2359, and 1067.2065 were lower in non-geoherbs and that the content of marker ions m/z 131.0490 and 163.0752 were lower in geoherbs. Furthermore, the content of M1 (m/z 387.1074, Rt 5.523 min) was particularly high in samples from Min County, while its content was significantly lower in the non-geoherbs. Therefore, m/z 387.1074 was selected as the most important compound for discriminating RAS between geoherbs and non-geoherbs.
To confirm the existence of M1 in the RAS samples and compare the intensity of the peak in RAS from geoherbs and non-geoherbs, the typical ion at m/z 387.1074 in positive mode was selected as the diagnostic ion for extraction ion analysis. In the geoherb region samples, the intensity of the peaks at m/z 387.1074 in positive mode reached up to 105 (Supplemental Figure S2).
M7 showed a protonated molecular ion [M + H]+ at m/z 313.1074 and a molecular ion [M + H − H2O]+ at m/z 177.0547. Its MS/MS spectrum gave fragment ions at m/z 145.0285 and 117.0341, which are the characteristic fragment ions of ferulic acid. Therefore, M7 was tentatively assigned as ferulate [22]. M9 was tentatively assigned as glutamine, based on the fragment ions at m/z 130.0868 and 84.0808 [23].

2.1.2. Identification of Major Compounds Detected in RAS

As shown in Figure 2 and Table 2, there were 30 peaks in the mixed solution of all RAS samples, 16 of which were unambiguously or tentatively identified. The structures of eight compounds—chlorogenic acid (3), ferulic acid (4), senkyunolide I (6), senkyunolide A (14), butylphthalide (16), butylidenephthalide (17), z-ligustilide (18), and levistolide A (30)—were identified by comparing their accurate masses and retention times with those of the standard compounds. Peaks 1, 2, 5, 7, 8, and 26–28 were also tentatively assigned by comparison of their MS/MS data with the database or the literature [22]. The structures of the main compounds in RAS are listed in Figure 3, and the MS/MS spectra of compounds detected in RAS are presented in Supplemental Figure S3.
The MS of compound 1 showed a protonated molecular ion [M + H]+ at m/z 205.0972 and [M + Na]+ at m/z 227.0787 in positive mode. Its MS/MS gave an abundant product ion [M + H − NH3]+ at m/z 188.0707 and a weak product ion at m/z 170.0601 [M + H − NH3 − H2O]+. Its MS/MS also showed a fragment ion at m/z 118.0654, which indicated that it has an indole group. Furthermore, its tR (3.497 min) suggested that it has relatively high hydrophilicity. Therefore, compound 1 was tentatively assigned as tryptophan [22].
Compound 2 produced an abundant protonated molecular ion [M + H]+ at m/z 163.0392. Product ions at m/z 135.0433 [M + H − CO]+, 107.0491 [M + H − 2 CO]+, and 89.0386 [M + H − 3 CO]+ were also observed. The loss of a series of CO peaks is characteristic of coumarin compounds, and 117.0337 [M + H − CO − H2O]+ suggested the presence of one hydroxyl. Thus, compound 2 was tentatively assigned as umbelliferone, which was consistent with the data of the MassBank database (https://massbank.eu/).
Compound 3 presented a protonated molecular ion [M + H]+ at m/z 355.1028 in the positive mode. Thus, its molecular mass was inferred to be 354 Da, which implicated an empirical molecular formula of C16H18O9. Its MS/MS gave fragment ions at m/z 163.0387 [M + H − C7H12O6]+ and 135.0442 [M + H − C7H12O6 − CO]+. It was seen to be identical to chlorogenic acid, by comparison with the standard compound.
Compound 4 showed a molecular ion [M + H − H2O]+ at m/z 177.0550. It also yielded fragment ions at m/z 149.0612 [M + H − H2O − CO]+. Its MS/MS gave a fragment ion at m/z 117.0334 [M + H − H2O − C2H4O2]+, and a product ion at m/z 89.0385 was obtained by the loss of CO of 117.0334. It was determined to be identical to ferulic acid by the characteristic fragment ions and the same retention time as the standard compound.
Compound 5 showed a molecular ion [M + H − H2O]+ at m/z 499.1269, and a characteristic fragment ion 163.0386 was C9H7O3. Thus, compound 5 was tentatively assigned as dicaffeoylquinic acid, by referring to data in the literature [22].
Compounds 6 and 7 both showed [M + H − H2O]+ ion at m/z 207. The MS/MS spectrum gave fragment ions at m/z 189 [M + H − 2 H2O]+ and 165 [M + H − H2O − CO − CH2]+. They were identified as senkyunolide I and senkyunolide H, respectively, by comparing their published MS/MS data [22].
Compound 14 was assigned as senkyunolide A, based on a protonated molecular ion [M + H]+ at m/z 193.1221 and fragment ions at m/z 175.1105 [M + H − H2O]+, 147.1162 [M + H − H2O − CO]+, and 119.0848 [M + H − H2O − 2 CO]+.
Compounds 16 and 18 showed a protonated molecular ion [M + H]+ at m/z 191. Their MS/MS gave product ions at m/z 173 [M + H − H2O]+, 145 [M + H − H2O − CO]+, and 117 [M + H − H2O − 2 CO]+. Therefore, compounds 16 and 18 were identified as butylphthalide and Z-ligustilide, respectively, by comparison with the standard compounds.
Compound 17 was identified as butylidenephthalide, based on a protonated molecular ion [M + H]+ at m/z 189.0912 and fragment ions at m/z 171.0800 [M + H − H2O]+, 153.0695 [M + H − 2 H2O]+, and 143.0868 [M + H − H2O − CO]+.
Compounds 2628 all showed a protonated molecular ion [M + H]+ at m/z 381 in the positive ion mode, and their MS/MS all gave the same fragment ions at m/z 191 and 173 as ligustilide. Thus, they were tentatively assigned as ligustilide dimers [22].
Compound 30 presented a protonated molecular ion [M + H]+ at m/z 381.2064, and its MS/MS gave fragment ions at m/z 191.1063 [M + H − ligustilide]+, 173.0962 [M + H − ligustilide − H2O]+, and 145.1009 [M + H − ligustilide − H2O − CO]+. Thus, compound 30 was identified as levistolide A, by comparison with the standard compound.

2.2. Determination of Four Active Compounds in RAS

It was reported that ferulic acid has antidiabetic, hepatoprotective, anticancer, anti-apoptotic, and anti-aging properties [24]. Phthalides are considered to be major bioactive compounds, possessing various activities with anti-tumor, neuroprotective, nephroprotective, analgesic, and anti-angiogenic effects [25]. Therefore, ferulic acid, senkyunolide I, butylidenephthalide, and levistolide A were determined as chemical compounds, which may be used for the quality assessment of RAS, due to their favorable bioactivities.
As shown in Table 3, the average content of ferulic acid in non-geoherbs (samples 1–27) was higher than that in geoherbs (samples 28–40). The result was basically consistent with that of [13]. The average content of levistolide A in samples from non-geoherbs was also much higher than that in geoherbs. Here, we have demonstrated that both senkyunolide I and butylidenephthalide were higher in geoherbs than in non-geoherbs.

2.3. Anti-Inflammatory Activity

As shown in Figure 4, the anti-inflammatory activities of RAS from different regions were evaluated by NO production. The average NO inhibition rate of samples from the geoherb regions was 41.53%, and the average of NO inhibition rate of samples from the non-geoherb regions was 39.93%, at a concentration of 5 μg/mL. The p-value was less than 0.05 between the two groups, as determined by an independent sample t-test (IBM SPSS Statistics 22), which indicated that the average NO inhibition rate of samples from geoherb regions was higher than that of samples from non-geoherb regions. Moreover, the NO inhibition rates of samples from the geoherb regions were better than the positive control (quercetin). Sample 25, from Zhang County, showed the highest NO inhibitory activity. In the future, the sample number can be expanded to study RAS anti-inflammatory activities.

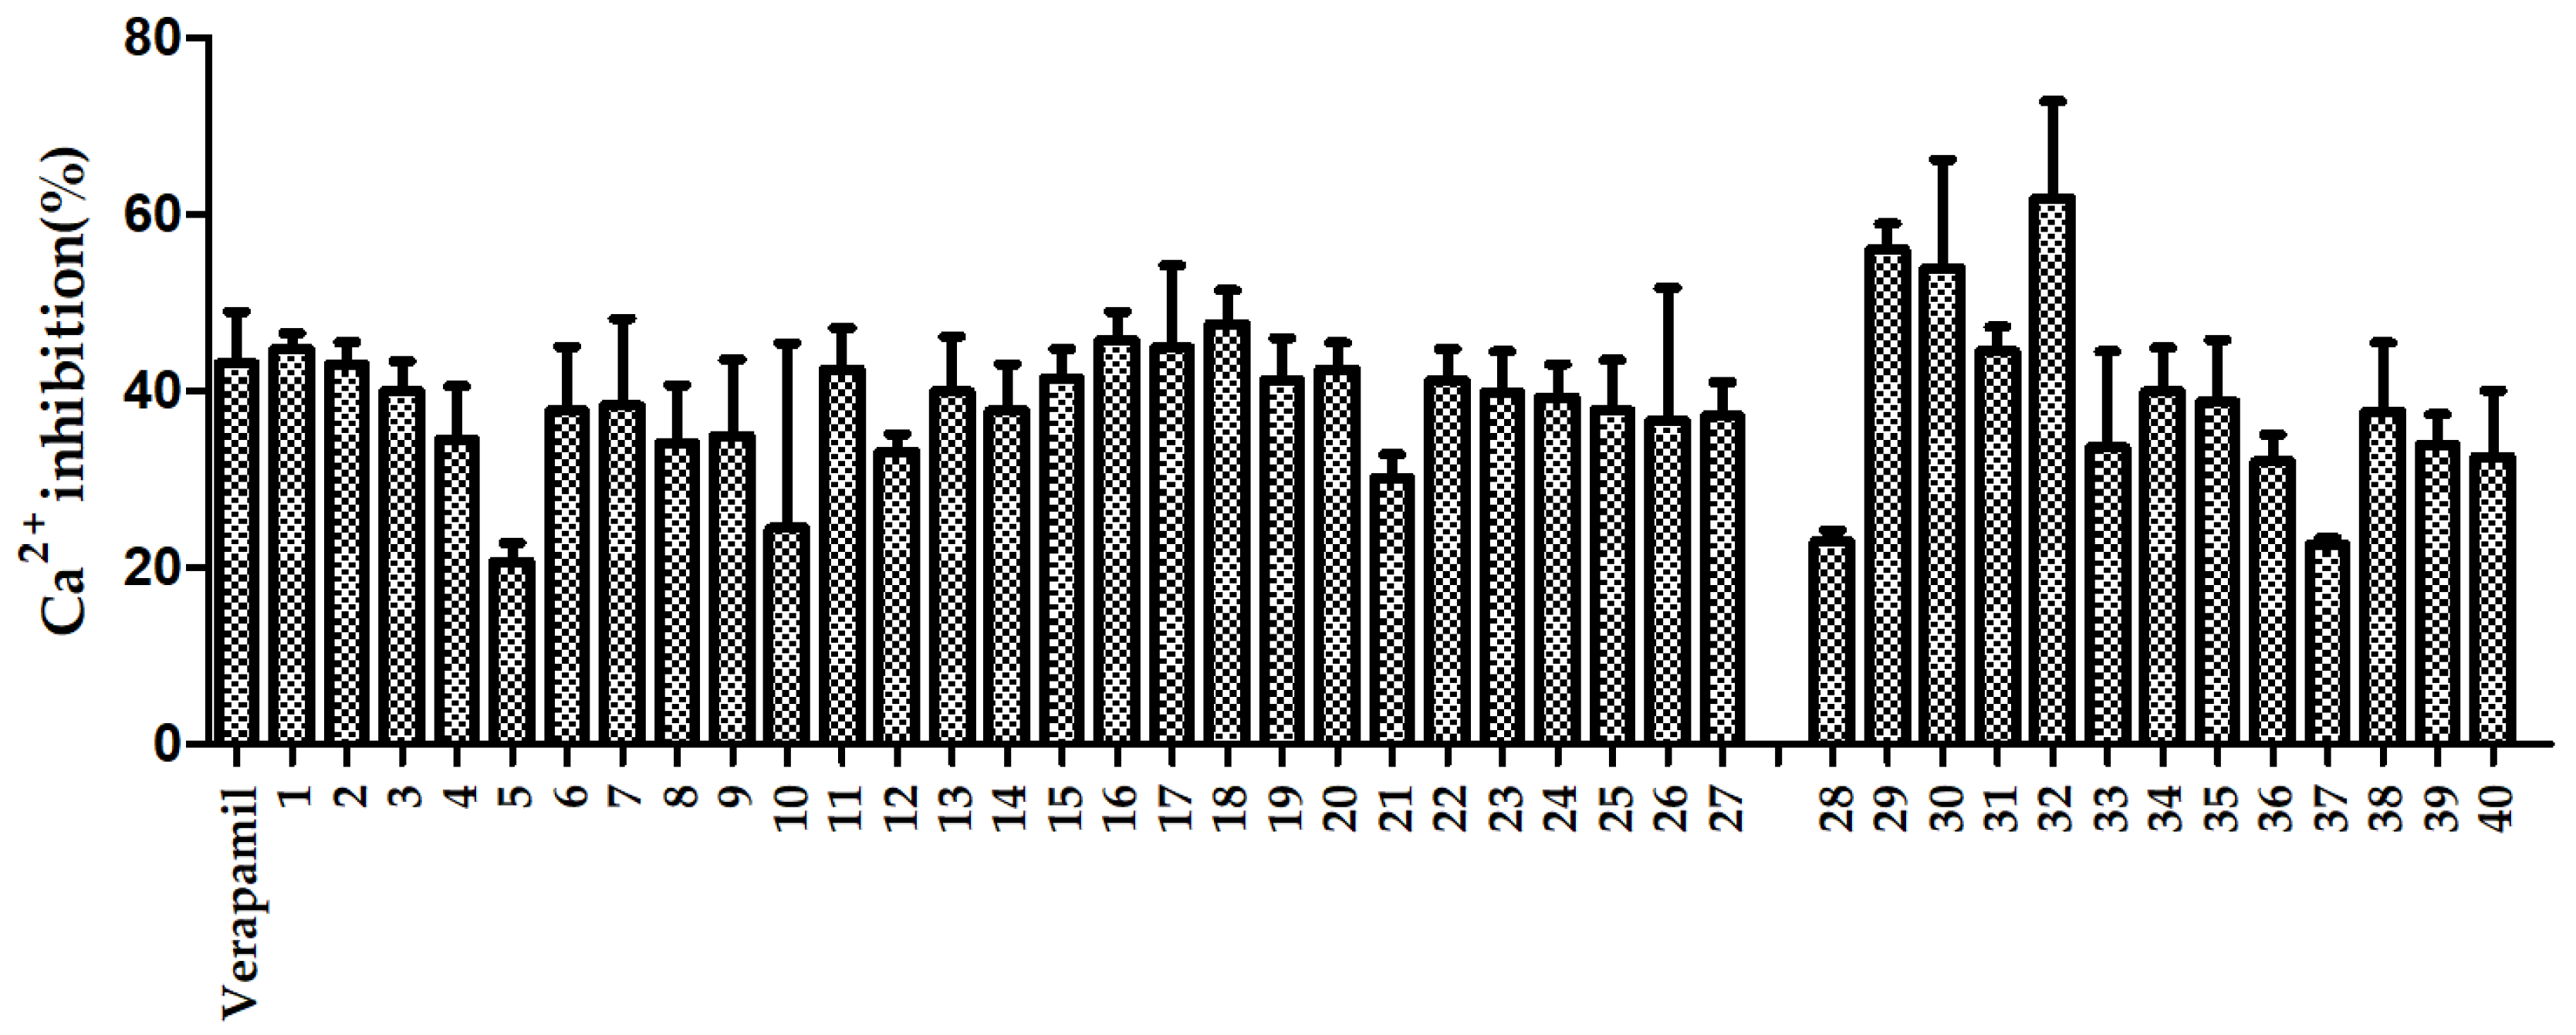
2.4. Calcium Antagonistic Activity

The calcium antagonistic activities of RAS extracts were assessed using Ca2+ inhibition rates, and the results are shown in Figure 5. The average Ca2+ inhibition rates in the geoherb region samples and the non-geoherb region samples were 39.28% and 38.22%, respectively, at a concentration of 10 μg/mL. Samples from geoherbs exerted a higher Ca2+ inhibition activity than samples from non-geoherbs, and a significant difference was found between them (p < 0.05). Sample 32, from Min County, had the highest Ca2+ inhibition rate, and sample 5, from Huzhu County, had the lowest Ca2+ inhibition rate. The Ca2+ inhibition rates of the samples from geoherbs varied greatly. Similarly, the sample number could be increased, in the future, to further study the relationship between Ca2+ inhibition activity and region.

3. Experimental

3.1. Chemicals and Reagents

MS-grade acetonitrile and MS-grade methanol were purchased from Mreda (Beijing, China). MS-grade water and MS-grade formic acid were obtained from Merck (Darmstadt, Germany). Eight standard compounds, ferulic acid, z-ligustilide, butylphthalide, butylidenephthalide, Chlorogenic acid, levistilide A, senkyunolide I, and senkyunolide A, were purchased from Chengdu Pufei De Biotech Co., Ltd (Chengdu, China).

3.2. Plant Materials

A total of 40 samples of RAS were collected from the Gansu, Qinghai, Hubei, and Yunnan Provinces of China. Detailed information is listed in Supplementary Table S1. All of the plant materials were identified as Radix Angelica sinensis by the author Zhigang Yang.

3.3. UHPLC-QTOF-MS/MS Analysis

3.3.1. Sample Solutions

All samples (100 mesh) were weighed (0.2 g) and extracted with 20.0 mL of 70% methanol in an ultrasonic cleaner at room temperature for 30 minutes. After standing for one hour, the supernatant was centrifuged and filtered at 5000 rpm for 2 min. The filtrates were stored in a refrigerator at 4 °C, for later analysis.

3.3.2. Standard Compound Solutions

The standard compounds were accurately weighed and dissolved by methanol to the final concentration of 10 μg/mL.

3.3.3. Liquid Chromatography Conditions

UHPLC analysis was performed using an Agilent 1290 InfinityⅡequipped with a quaternary pump system and an auto-sampler. The chromatography separation was achieved with a Waters CORTECS UPLC C18 column (2.1 mm × 100 mm, 1.6 μm) and maintained at 35 °C throughout the run. The mobile phases were (A) 0.1% formic acid in water and (B) 0.1% formic acid in acetonitrile. The UHPLC elution conditions were optimized, as follows: 0 min 97% A, 2 min 95% A, 5.5 min 50% A, 12 min 35% A, 13 min 0% A, 16 min 0% A, 16.1 min 97% A, and 18 min 97% A, with a flow rate of 0.4 mL/min. The injection volume was 2 μL.

3.3.4. Mass Spectrometry Conditions

The Agilent 6560 Q-TOF mass spectrometer was equipped with an Agilent jet stream electrospray source. Mass spectra were acquired in positive ionization mode with a scan range of 50–1700 Da. The mass spectrometer was operated with the following parameters: nebulizer at 20 psig, capillary voltage at 3500 V, drying gas at 225 °C, drying gas flow at 5 L/min, sheath gas at 400 °C, sheath gas flow at 12 L/min, nozzle voltage at 500 V, and data acquisition at the rate of 1 spectrum/s. MS/MS spectra were used to obtain fragments and identify compounds. The mass spectrometry was tuned to meet the detection requirements of compounds at an accuracy of ±2 ppm before the analysis. Two reference masses (121.050873 and 922.009798) were selected for the autocalibration throughout the run.

3.3.5. Data Processing

All raw data, collected by the Agilent Data Acquisition software (version B.08.00), were imported into the Profinder software (version B.08.00) in the early stage. The samples were grouped by geoherb or non-geoherb region. Choosing the wizard of the batch recursive feature extraction (small molecules/peptides) and following the wizard step by step, the main parameters were listed, as follows. Peaks filters: use peaks with height ≥500 counts; binning and alignment: RT tolerance = 0.00% ± 0.1 min; mass tolerance = ± 10.00 ppm + 2.00 mDa; molecular feature extraction (MFE) and extraction of ion chromatograph (EIC) filters: score ≥80% and 100%, respectively, of the file in at least one sample group in minimum filter matches. The absolute heights in the MFE and EIC filters were 500 and 8000, respectively. The processed data were exported to CEF format and entered into the Agilent Mass Profiler Professional software (MPP, version 14.9, Agilent, Palo Alto, CA, USA), for later analysis.
In MPP, all samples were grouped by geoherb or non-geoherb region. The filter parameter of retaining entities that appeared in at least 100% of the samples, in at least one condition, was set. Then, unsupervised pattern recognition the PCA and supervised pattern recognition the PLS–DA were performed to analyze the intrinsic variations of the data. The characteristic chemical markers were selected by VIP value > 1.5 and p-value < 0.05 in the Moderated t-Test.

3.4. Determination of Four Active Compounds in RAS

3.4.1. RAS Sample Solutions

An accurately weighed 0.5 g of RAS powder was introduced into a 50 mL volumetric flask and 50 mL 70% methanol was added. The volume was made up to 70% methanol after ultrasonic treatment at room temperature for 30 min. The extract was filtered with a 0.22 μm membrane filter. An aliquot of 4 μL of solution was used as the injection in the UHPLC analysis.

3.4.2. Preparation of Standard Solutions for Linearity and Calibration

An accurately weighed 1.46 mg of ferulic acid standard compounds was introduced into a 25 mL volumetric flask and was made up to volume with methanol; this was used as calibration solution one. Accurately weighed 2.91, 7.37, and 2.0 mg of levistilide A, butylidenephthalide, and senkyunolide I standard compounds, respectively, were separately transferred into a 50 mL volumetric flask, and methanol was added up to volume; this was used as calibration solution two. The samples were monitored at a wavelength of 276 nm for levistilide A and senkyunolide I, and 322 nm for ferulic acid and butylidenephthalide. Peak areas against content were plotted to obtain the calibration curves of the standard compounds. The R2 value of each standard compound was higher than 0.999 in the linear range.

3.4.3. Liquid Chromatography Conditions

The contents of seven active compounds were determined using an Agilent 1290 InfinityⅡ consisting of a quaternary pump system and an auto-sampler. Chromatography separation was achieved with a Waters CORTECS UPLC C18 column (2.1 mm × 100 mm, 1.6 μm) and maintained at 35 °C during the run. The mobile phases were (A) 1% formic acid in water and (B) acetonitrile. A linear solvent gradient of A-B was optimized as follows: 0 min 93% A, 0.8 min 90% A, 3.5 min 75% A, 5.5 min 56% A, 9.1 min 47% A, 9.6 min 35% A, 10.6 min 32% A, 11.6 min 32% A, and 11.61 min 0% A, with a flow rate of 0.4 mL/min. The injection volume was 4 μL. The detection wavelength of DAD (Diode Array Detection) was 190–400 nm.

3.5. Anti-Inflammatory Activity

3.5.1. Extracts of RAS

RAS powders (100 mesh) were weighed (to approximately 5.0 g) and extracted with 40.0 mL of 80% ethanol, followed by sonication two times. The obtained extracts were mixed together and allowed to concentrate in a rotary evaporator. The residue was dissolved in methanol.

3.5.2. Cell Culture

The RAW264.7 macrophage cell line was purchased from National Infrastructure of Cell Line Resource. Cells were cultured at 37 °C/5% CO2 in Dulbecco’s Modified Eagle Medium (DMEM, 10% fetal bovine serum, 1% penicillin, and streptomycin). DMEM was replaced every two days, and cells were allowed to subculture when they reached 80%–90% confluency.

3.5.3. NO Determination

RAW264.7 cells were plated in 96-well culture plates and followed four different treatments—DMSO (negative group), LPS (1 μg/mL, model group), LPS + quercetin (5 μg/mL, positive group), and LPS + extracts of RAS (5 μg/mL, treatment group)—for NO determination. Nitrite (NO2) in the culture medium was measured as an indicator of NO production, using the Griess reaction. All agents were added at the same time, and the groups were treated for 24 h. After treatment with the same concentrations of extracts of RAS and quercetin, the supernatant of the cells was mixed with an equal volume of Griess reagent, and absorbance of the mixture was measured at 540 nm. The experiments were repeated three times independently.

3.6. Calcium Antagonistic Activity

3.6.1. Cell Culture

The HEK 293T cells were purchased from the American Type Culture Collection (Rockville, MD, USA) and were cultured at 37 °C/5% CO2 in DMEM (high glucose) with 10% fetal bovine serum and 1% streptomycin–ampicillin.

3.6.2. Cell Administration

The HEK 293T cells were plated in 96-well plates and co-transfected with the Ca2+ luciferase reporter plasmid PGL 4.30 (100 ng/well) and a Renilla plasmid (10 ng/well) in the serum-free medium when the degree of cell confluence reached 50%–70%. Then, serum-containing DMEM (high glucose) was added. Transfection was performed for 22 h using PEI liposome 2000 (1 mg/mL) as a transfection reagent. The experiment was operated using different treatments of blank medium (negative group), 1 × 10⁻³ mol/L ionomycin and 1 mg/mL phorbol ester (model group), verapamil (1 × 10⁻⁵ mol/L, positive group), and extracts of RAS (1 × 10⁻⁵ kg/L, treatment group). After six hours of administration, the cells were collected for gene reporter detection, according to the ratio of the relative fluorescence intensity (Ca2+ fluorescence value/Renilla fluorescence value). The experiments were repeated three times independently.

4. Conclusions

A total of 37 compounds were detected, and nine characteristic chemical markers were selected for discriminating RAS from different regions by UHPLC-QTOF-MS/MS. The average contents of senkyunolide I and butylidenephthalide in geoherb samples were higher, but the average contents of ferulic acid and levistolide A were lower than those in non-geoherb samples. Meanwhile, the geoherbs showed higher anti-inflammatory and calcium-antagonistic activities than the non-geoherbs. Significantly, M1, with the typical ion at m/z 387.1074 in positive mode, made the greatest contribution to the grouping and, so, could be used as a diagnostic ion in extraction ion analysis. These results indicated that RAS from geoherb regions and non-geoherb regions showed diversity, and it is possible to discriminate RAS from different regions rapidly.

Supplementary Materials

The following data are available online. Origin of the RAS samples (Table S1). The PCA loadings, highlighting the markers M1M9 (Figure S1). Extracted ion chromatogram at m/z 387.1074 (positive mode) of RAS from geoherbs (a) and non-geoherbs (b) (Figure S2). The MS/MS spectra of compounds detected in RAS (Figure S3).

Author Contributions

Z.Y. conceived and designed the experiments. K.Z. conducted UHPLC-QTOF-MS/MS analysis and content determination. M.Y., L.C., M.J. and G.B. conducted calcium antagonistic activity. S.H., L.W., and H.D. evaluated the anti-inflammatory activity. L.Z., L.S., H.B. and G.W. collected the plant material and conducted the early treatment. K.Z. and Z.Y. shared the processes of analyzing the data and writing the manuscript.

Funding

This work was supported by the National Key R&D Program of China (2016YFE0129000); the Key R&D Program of Tianjin (18YFYZCG00060); Research Project of Gansu Provincial Administration of Traditional Chinese Medicine (GZK-2015-21); and the Fundamental Research Funds for the Central Universities (lzujbky-2017-k26).

Acknowledgments

The authors are thankful to the School of Pharmacy, Lanzhou University, College of Pharmacy, Nankai University, and School of Chinese Materia Medica, Beijing University of Chinese Medicine.

Conflicts of Interest

The authors declare no conflicts of interest.

References

  1. The State Pharmacopoeia Commission of P.R. China. Pharmacopoeia of the People’s Republic of China; China Medicine Science and Technology Press: Beijing, China, 2015; pp. 133–134. [Google Scholar]
  2. Li, X.; Zhang, L.H.; Wang, X.X.; Yang, W.; Jin, Y.Q.; Lv, G.H. Research progress on chemical constituents and pharmacological effects of Angelica sinensis. J. Chin. Mater. Med. 2013, 36, 1023–1028. [Google Scholar] [CrossRef]
  3. Yao, W.L.; Zhang, L.; Hua, Y.L.; Ji, P.; Li, P.L.; Li, J.X.; Zhong, L.J.; Zhao, H.F.; Wei, Y.M. The investigation of anti-inflammatory activity of volatile oil of Angelica sinensis by plasma metabolomics approach. Int. Immunopharmacol. 2015, 29, 269–277. [Google Scholar] [CrossRef] [PubMed]
  4. Su, Z.Y.; Khor, T.O.; Shu, L.; Lee, J.H.; Saw, C.L.; Wu, T.Y.; Huang, Y.; Suh, N.; Yang, C.S.; Conney, A.H.; et al. Epigenetic reactivation of Nrf2 in murine prostate cancer TRAMP C1 cells by natural phytochemicals Z-ligustilide and Radix Angelica sinensis via promoter CpG demethylation. Chem. Res. Toxicol. 2013, 26, 477–485. [Google Scholar] [CrossRef] [PubMed]
  5. Tsai, N.M.; Chen, Y.L.; Lee, C.C.; Lin, P.C. The natural compound n-butylidenephthalide derived from Angelica sinensis inhibits malignant brain tumor growth in vitro and in vivo3. J. Neurochem. 2006, 99, 1251–1262. [Google Scholar] [CrossRef] [PubMed]
  6. Ho, C.C.; Kumaran, A.; Hwang, L.S. Bio-assay guided isolation and identification of anti-Alzheimer active compounds from the root of Angelica sinensis. Food Chem. 2009, 114, 246–252. [Google Scholar] [CrossRef]
  7. Zhao, Z.Z.; Guo, P.; Brand, E. The formation of daodi medicinal materials. J. Ethnopharmacol. 2012, 140, 476–481. [Google Scholar] [CrossRef] [PubMed]
  8. Tan, H.S.; Hu, D.D.; Song, J.Z.; Xu, Y.; Cai, S.F.; Chen, Q.L.; Meng, Q.W.; Li, S.L.; Chen, S.L.; Mao, Q.; et al. Distinguishing Radix Angelica sinensis from different regions by HS-SFME/GC-MS. Food Chem. 2015, 186, 200–206. [Google Scholar] [CrossRef]
  9. Qian, Y.Y.; Wang, Y.L.; Sa, R.; Yan, H.; Pan, X.B.; Yang, Y.W.; Sun, Y.J. Metabolic fingerprinting of Angelica sinensis during growth using UPLC-TOF-MS and chemometrics data analysis. Chem. Cent. J. 2013, 7, 42–51. [Google Scholar] [CrossRef]
  10. Bai, Y.J.; Kong, M.; Xu, J.D.; Zhang, X.L.; Zhou, S.S.; Wang, X.N.; Liu, L.F.; Li, S.L. Effect of different drying methods on the quality of Angelica Sinensis Radix evaluated through simultaneously determining four types of major bioactive components by high performance liquid chromatography photodiode array detector and ultra-high performance liquid chromatography quadrupole time-of-flight mass spectrometry. J. Pharm. Biomed. Anal. 2014, 94, 77–83. [Google Scholar] [CrossRef]
  11. Bai, Y.J.; Xu, J.D.; Kong, M.; Gao, Q.; Liu, L.F.; Li, S.L. Discovery of characteristic chemical markers for inspecting sulfur-fumigated Radix Angelica sinensis by ultra-high performance liquid chromatography—Quadrupole/time-of-flight mass spectrometry based metabolomics and chemical profiling approach. Food Res. Int. 2015, 76, 387–394. [Google Scholar] [CrossRef]
  12. Li, P.L.; Sun, H.G.; Hua, Y.L.; Ji, P.; Zhang, L.; Li, J.X.; Wei, Y.M. Metabolomics study of hematopoietic function of Angelica sinensis on blood deficiency mice model. J. Ethnopharamacol. 2015, 166, 261–269. [Google Scholar] [CrossRef] [PubMed]
  13. Jin, L.; Jin, Y.; Zhang, X.F.; Wang, Z.H.; Wu, D.; Cui, Z.J.; Ma, Y.; Li, Y.D. Comparison of the Contents of Ferulic Acid in Angelica sinensis from Different Regions. J. TCVM 2013, 2, 12–13. [Google Scholar] [CrossRef]
  14. Shi, X.X.; Li, Y. Content Determination of 7 Kinds of Active Components in Angelica sinensis before and after Sulfur Fumigation by UPLC Simultaneously. J. Chin. Pharm. 2018, 29, 2389–2393. [Google Scholar] [CrossRef]
  15. Kongkatitham, V.; Muangnoi, C.; Kyokong, N.; Thaweesest, W.; Likhitwitayawuid, K.; Rojsitthisak, P.; Sritularak, B. Anti-oxidant and anti-inflammatory effects of new bibenzyl derivatives from Dendrobium parishii in hydrogen peroxide and lipopolysaccharide treated RAW264.7 cells. Phytochem. Lett. 2018, 24, 31–38. [Google Scholar] [CrossRef]
  16. Xie, C.F.; Li, X.T.; Zhu, J.Y.; Wu, J.S.; Geng, S.S.; Zhong, C.Y. Magnesium isoglycyrrhizinate suppresses LPS-induced inflammation and oxidative stress through inhibiting NF-κB and MAPK pathways in RAW264.7 cells. Bioorgan. Med. Chem. 2019, 27, 516–524. [Google Scholar] [CrossRef]
  17. Zhang, L. Metabonomics Research on Volatile Oils of Raw Angelica and Its Different Processed Products Intervenein LPS Inflammation Rats Based on LC-QTOF-MS. Master’s Thesis, Gansu Agricultural University, Lanzhou, China, May 2015. [Google Scholar]
  18. Liu, L.N.; Jia, M.; Mei, Q.B.; Cheng, J.F.; Yang, T.H.; Wang, Q.W. Anti -inflammatory and Analgesic Actions of Essential Oil Extracted from Radix Angelica Sinensis by Ethanol. J. China Pharm. 2002, 13, 526–527. [Google Scholar] [CrossRef]
  19. Lu, Y.; Deng, Y.; Liu, W.; Jiang, M.; Bai, G. Searching for calcium antagonists for hypertension disease therapy from Moutan Cortex, using bioactivity integrated UHPLC-QTOF-MS. Phytochem. Anal. 2019, 30, 456–463. [Google Scholar] [CrossRef]
  20. Ji, L.F.; Shi, X.H.; Chen, B.B.; Wang, L.H.; Yi, L. Study on the mechanism of lowering blood pressure of Angelica sinensis extracts. Lishizhen Med. Mater. Med. Res. 2016, 27, 1965–1967. [Google Scholar] [CrossRef]
  21. Wu, G.T.; Du, L.D.; Gao, Y.J.; Jing, Q.; Pang, L.; Li, Y.D.; Ren, Y. Antihypertensive and vasoactive effects of Angelica volatile on mice. J. Chin. Hosp. Pharm. 2014, 13, 1045–1049. [Google Scholar] [CrossRef]
  22. Wu, Y.Y.; Wang, L.; Liu, G.X.; Xu, F.; Shang, M.Y.; Cai, S.Q. Characterization of principal compositions in the roots of Angelica sinensis by HPLC-ESI-MSn and chemical comparison of its different parts. J. Chin. Pharm. Sci. 2014, 23, 393–402. [Google Scholar] [CrossRef]
  23. Han, Y.Z.; Jiang, Y.; Lin, M.; Li, Y.; Li, M.; Liu, Q. Determination of glutamine in human plasma by liquid chromatography-tandem mass spectrometry. J. Shenyang Pharm. Univ. 2016, 33, 572–576. [Google Scholar] [CrossRef]
  24. Umre, R.; Ganeshpurkar, A.; Ganeshpurkar, A.; Ganeshpurkar, A.; Pandey, S.; Pandey, V.; Shrivastava, A.; Dubey, N. In vitro, in vivo and in silico antiulcer activity of ferulic acid. Future J. Pharm. Sci. 2018, 4, 248–253. [Google Scholar] [CrossRef]
  25. Lv, J.L.; Zhang, L.B.; Guo, L.M. Phthalide dimers from Angelica sinensis and their COX-2 inhibition activity. Fitoterapia 2018, 129, 102–107. [Google Scholar] [CrossRef] [PubMed]
Sample Availability: Samples of RAS are available from the authors.
Figure 1. PCA scores (a), PLS–DA scores (b), and heatmap of nine characteristic chemical markers (c).
Molecules 24 03536 g001aMolecules 24 03536 g001b
Figure 2. Total ion of chromatography (TIC) in a mixed solution of all RAS samples.
Molecules 24 03536 g002
Figure 3. Structures of main compounds in RAS.
Molecules 24 03536 g003
Figure 4. NO inhibition rates of extracts of RAS from non-geoherbs (1–27) and geoherbs (28–40).
Molecules 24 03536 g004
Figure 5. Ca2+ inhibition rates of extracts of RAS from non-geoherbs (1–27) and geoherbs (28–40).
Molecules 24 03536 g005
Table 1. Tentative markers for discriminating radix Angelica sinensis (RAS) from geoherbs and non-geoherbs.
Compoundm/z (ESI+)Rt (min)Tentative FormulaVIPMS/MS Fragment Ion (m/z)Identification
M1387.10745.523C20H18O88.739371.2273, 283.1760, 177.1127, 133.0857, 89.0597, 45.0338Unknown
M2563.18886.583C38H26O52.184481.2603, 305.1541, 207.1018, 133.0865, 89.0597, 45.0337Unknown
M3163.07527.600C10H10O22.032131.0476, 103.0546, 77.0385Unknown
M4641.20176.976C36H32O111.923323.0893, 291.0971, 83.0855, 45.0337Unknown
M5131.04907.598C6H10O31.908115.0535, 103.0538Unknown
M6751.23598.176C24H46O261.860557.1798, 395.1120, 163.0749, 131.0493, 103.0535Unknown
M7313.10746.218C18H16O51.678177.0547, 145.0285, 117.0341Ferulate
M81067.20655.609 1.565551.0790Unknown
M9130.0868 [M + H − NH3]+0.802C5H10N2O31.53684.0808, 56.0497Glutamine
Table 2. Mass data of compounds detected in RAS.
PeakIdentificationRt (min)Formulam/z (ESI+)MS/MS Fragment Ion (m/z)
1Tryptophan3.497C11H12N2O2188.0707 [M + H − NH3]+170.0601, 118.0654
2Umbelliferone4.547C9H6O3163.0392135.0433, 117.0337, 107.0491, 89.0386
3Chlorogenic acid4.568C16H18O9355.1028163.0387, 135.0442
4Ferulic acid5.487C10H10O4177.0550 [M + H − H2O]+149.0612, 117.0334, 89.0385
5Dicaffeoylquinic acid5.549C25H24O12499.1269 [M + H − H2O]+163.0386
6Senkyunolide I5.893C12H16O4207.1015 [M +H − H2O]+189.0909, 165.0549
7Senkyunolide H5.948C12H16O4207.0991 [M + H − H2O]+189.0893, 165.0538
8Ferulate6.218C18H16O5313.1074177.0547, 145.0285, 117.0341
9Unknown7.375C18H36O3318.2994 [M + NH4]+256.2620, 88.0757
10Unknown7.532C16H22O4279.1590191.1075, 105.0325, 71.0493
11Unknown7.628C10H10O2163.0756131.0476, 103.0546, 77.0385
12Unknown7.850C24H22O7423.1418229.0840, 189.0901
13Unknown8.006C18H20O5316.2849299.2822, 256.2624, 60.0446
14Senkyunolide A8.163C12H16O2193.1221175.1105, 147.1162, 119.0848
15Unknown8.749C27H46O9514.3166355.2881, 184.0728, 100.1122
16Butylphthalide8.758C12H14O2191.1067173.0959, 145.1008, 117.0697
17Butylidenephthalide8.942C12H12O2189.0912171.0800, 153.0695, 143.0868
18Z-ligustilide9.152C12H14O2191.1066173.0964, 145.1015, 117.0701
19Unknown9.738C30H47O7520.3391337.2703, 184.0733
20Unknown10.002C30H47O7520.3393337.2733, 184.0732
21Unknown10.317C32H50O12627.3358541.2505, 465.2823
22Unknown10.643C32H50O12627.3351465.2816, 447.2724
23Unknown10.783C27H43O7480.3112100.1123
24Unknown11.152C27H43O7480.3112100.1123
25Unknown11.640C30H50O12603.3350441.2839, 423.2710
26Ligustilide dimer12.208C24H28O4381.2064191.1064, 173.0952
27Ligustilide dimer12.429C24H28O4381.2064191.1064, 173.0957
28Ligustilide dimer12.749C24H28O4381.2064191.1068, 173.0963
29Unknown13.047C27H43O7480.3112100.1120
30Levistolide A13.152C24H28O4381.2064191.1063, 173.0962, 145.1009
Table 3. The contents of four compounds in RAS (mg/g).
Sample No.Ferulic AcidSenkyunolide IButylidenephthalideLevistolide A
11.09760.14810.08240.0724
20.97900.14230.08920.0830
30.92660.16770.12380.0746
41.65560.10750.06500.0828
51.01530.22110.20260.0697
61.27510.20590.17630.0856
70.81650.19050.19360.0627
81.35970.25900.18040.0877
91.32310.23110.14690.0985
101.60480.24700.14650.1274
112.32980.36670.23470.2981
122.15770.20240.17520.2405
131.16670.67940.21210.2356
142.21310.21260.18180.2642
151.28550.28230.13160.2611
160.86580.27670.18670.9618
171.48060.23650.21910.0999
180.78510.70210.22310.0646
191.85460.28320.18920.1267
201.23250.19880.13370.0858
211.04230.32940.21520.0788
221.30930.27040.13250.0949
231.54880.31200.21030.1424
240.96380.27520.14130.1096
251.60030.30400.17470.1242
261.09520.34700.15760.0898
271.49200.26160.17340.1294
average1.3510 ± 0.42100.2763 ± 0.13480.1666 ± 0.04420.1575 ± 0.1749
281.42530.19770.19680.0725
291.03640.19990.19190.0702
300.97710.36620.16360.0807
311.01690.32010.17370.0791
320.62100.30310.12430.0766
331.13750.31560.16160.0926
341.04210.34860.22230.0614
351.31070.32170.21630.0757
361.09170.18020.19660.0721
371.57450.22590.13420.1149
381.64680.27430.18680.1104
390.91110.56170.23410.0678
401.32090.23430.15910.0977
average1.1625 ± 0.28410.2961 ± 0.10060.1816 ± 0.03300.0825 ± 0.0165

