Intermolecular Non-Covalent Carbon-Bonding Interactions with Methyl Groups: A CSD, PDB and DFT Study


Abstract
1. Introduction
2. Materials and Methods
2.1. General Information on Database Analyses
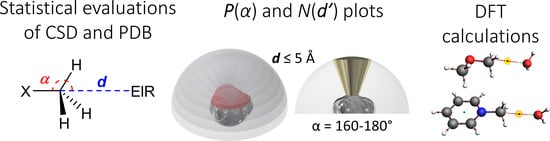
2.2. Methodology to Generate P(α) Plots
2.3. Methodology to Generate N(d’) Plots
2.4. Computational Methods
3. Results and Discussion
3.1. P(α) Plots
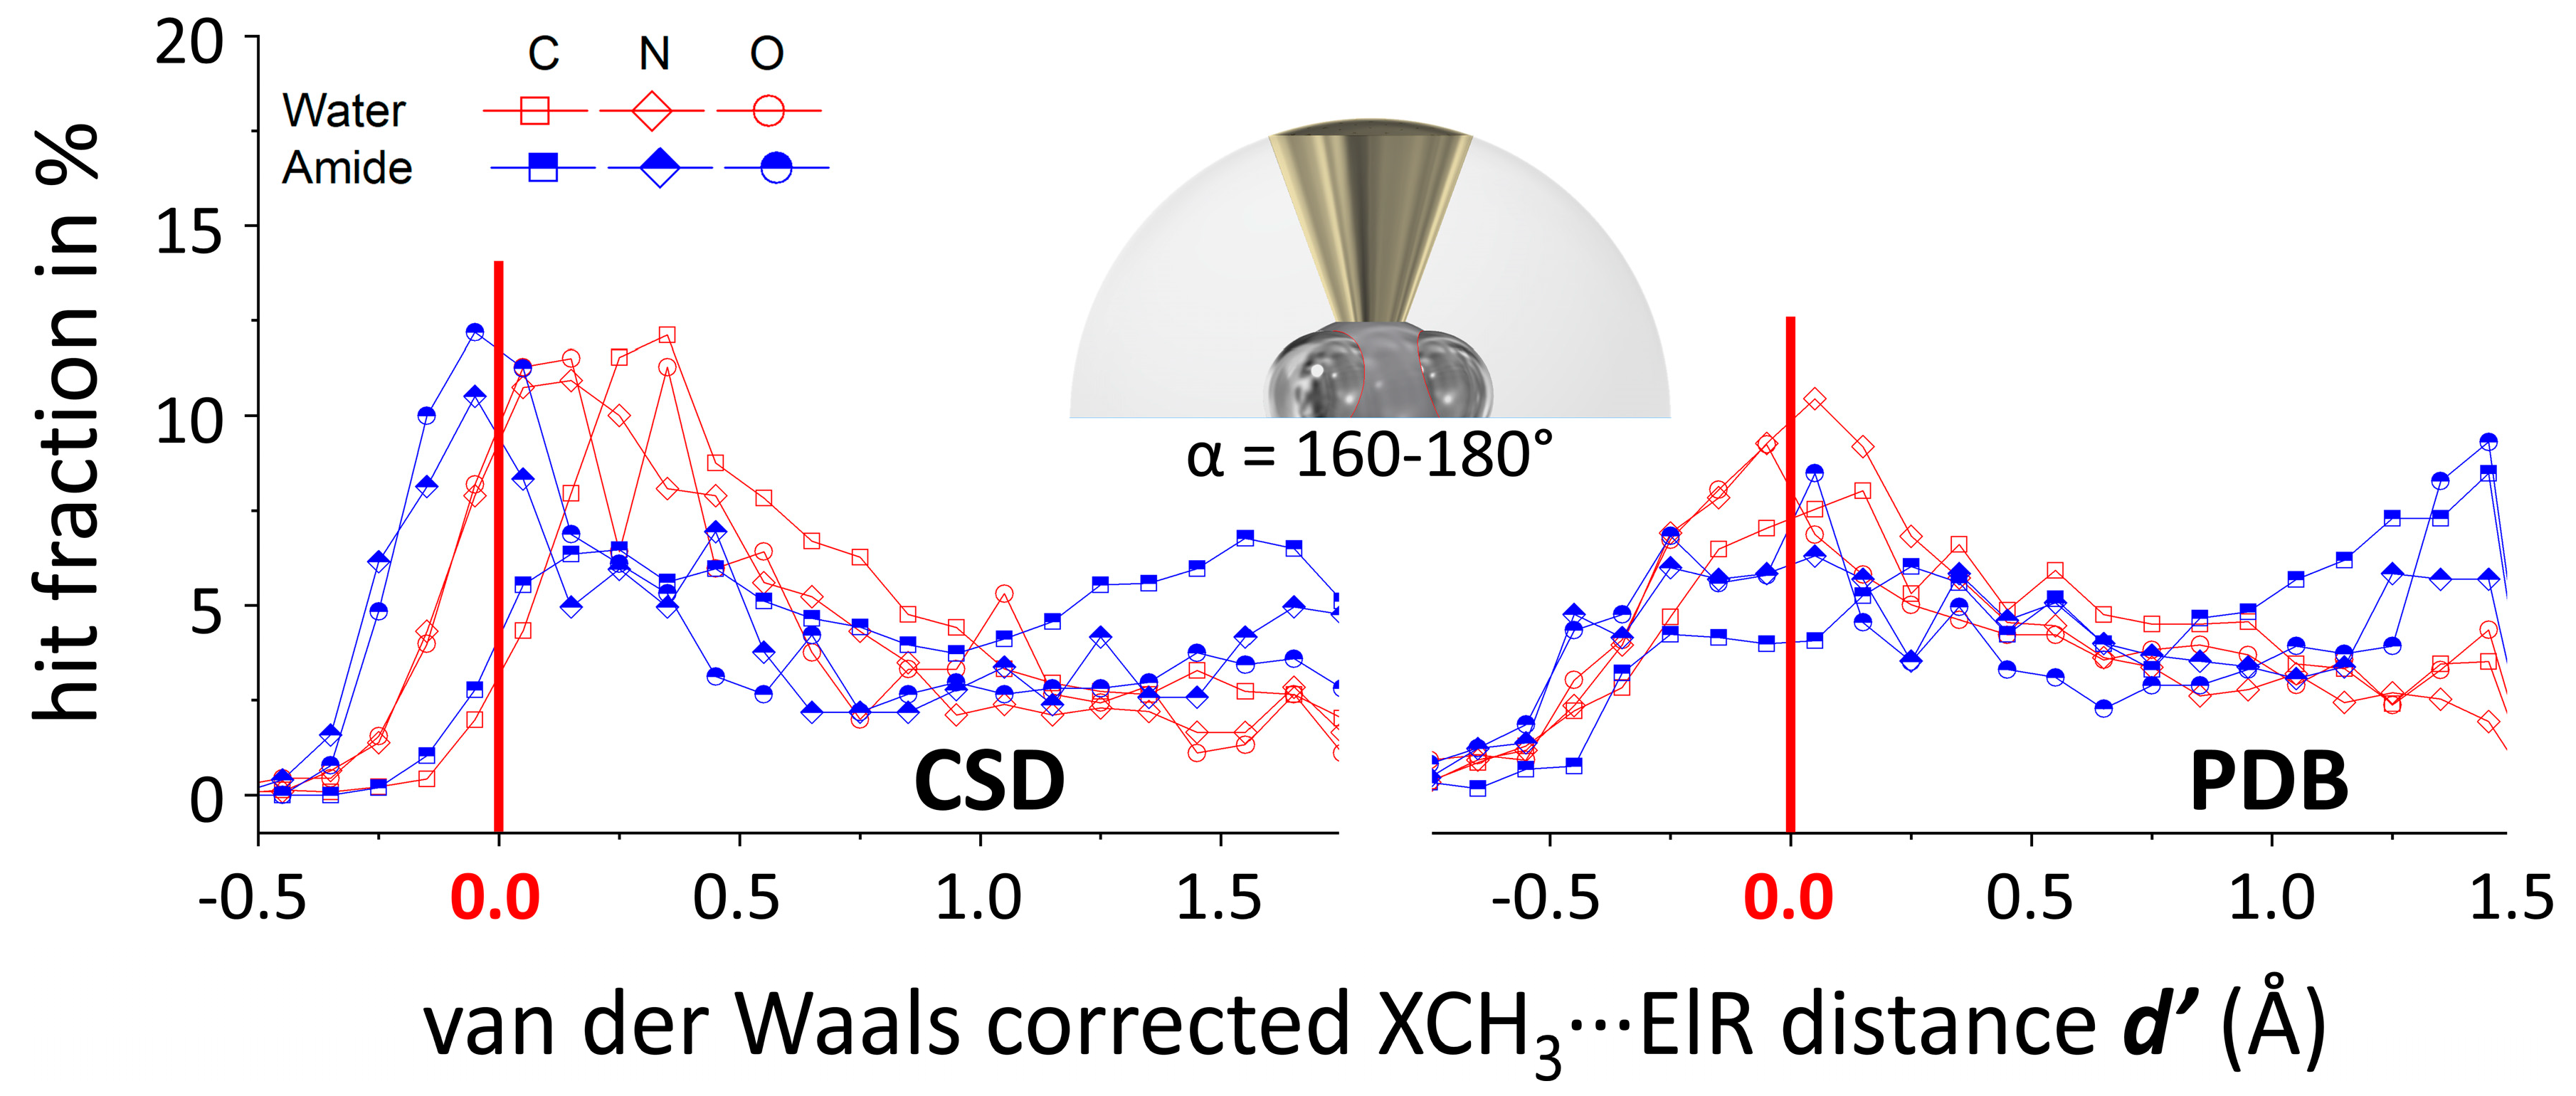
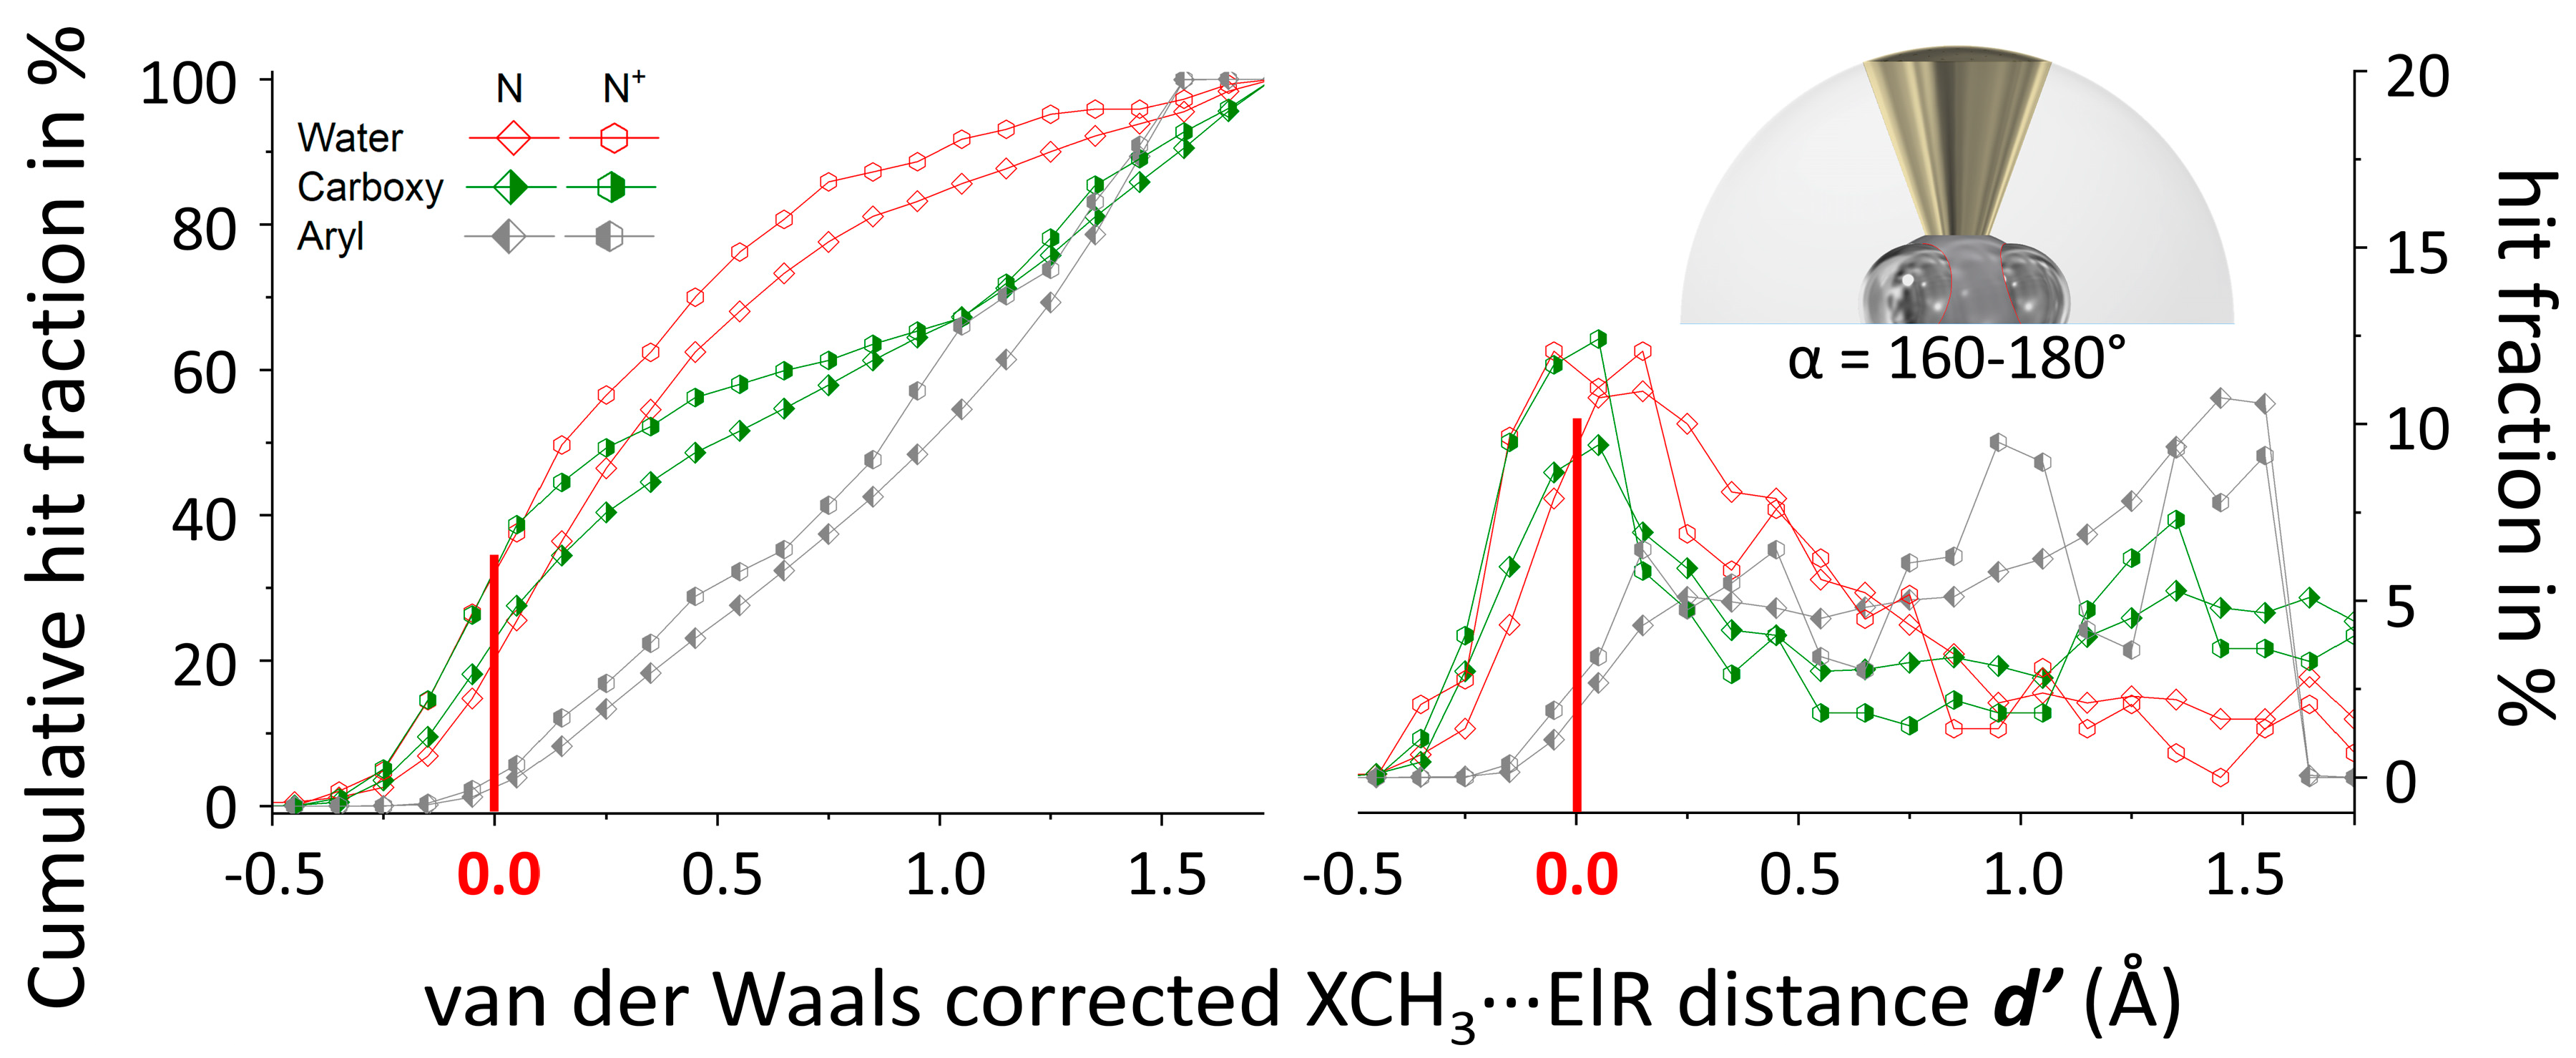
3.2. N(d’) plots
3.3. Computations
3.4. General Discussion
4. Summary and Conclusions
Supplementary Materials
Funding
Conflicts of Interest
References
- Lehn, J.M. Supramolecular Chemistry: Concepts and Perspectives, 1st ed.; Wiley VCH: Weinheim, Germany, 1995. [Google Scholar]
- Clark, T. σ-Holes. WIREs Comput. Mol. Sci. 2013, 3, 13–20. [Google Scholar] [CrossRef]
- Politzer, P.; Murray, J.S.; Clark, T. Halogen bonding and other σ-hole interactions: A perspective. Phys. Chem. Chem. Phys. 2013, 15, 11178–11189. [Google Scholar] [CrossRef] [PubMed]
- Bauza, A.; Mooibroek, T.J.; Frontera, A. The bright future of unconventional σ/π-hole interactions. Chem. Phys. Chem. 2015, 16, 2496–2517. [Google Scholar] [CrossRef] [PubMed]
- Crabtree, R.H. Hypervalency, secondary bonding and hydrogen bonding: Siblings under the skin. Chem. Soc. Rev. 2017, 46, 1720–1729. [Google Scholar] [CrossRef] [PubMed]
- Grabowski, S.J. Hydrogen Bonding: New Insights; Springer: Heidelberg, Germany, 2006. [Google Scholar]
- Bauza, A.; Mooibroek, T.J.; Frontera, A. Tetrel-bonding interaction: Rediscovered supramolecular force? Angew. Chem. Int. Ed. 2013, 52, 12317–12321. [Google Scholar] [CrossRef] [PubMed]
- Bauza, A.; Mooibroek, T.J.; Frontera, A. Tetrel bonding interactions. Chem. Rec. 2016, 16, 473–487. [Google Scholar] [CrossRef] [PubMed]
- Bauza, A.; Frontera, A.; Mooibroek, T.J. 1,1,2,2-Tetracyanocyclopropane (TCCP) as supramolecular synthon. Phys. Chem. Chem. Phys. 2016, 18, 1693–1698. [Google Scholar] [CrossRef]
- Bauza, A.; Mooibroek, T.J.; Frontera, A. Influence of ring size on the strength of carbon bonding complexes between anions and perfluorocycloalkanes. Phys. Chem. Chem. Phys. 2014, 16, 19192–19197. [Google Scholar] [CrossRef]
- Bauza, A.; Mooibroek, T.J.; Frontera, A. Non-covalent sp3 carbon bonding with ArCF3 is analogous to CH-π interactions. Chem. Commun. 2014, 50, 12626–12629. [Google Scholar] [CrossRef]
- Scholfield, M.R.; van der Zanden, C.M.; Carter, M.; Ho, P.S. Halogen bonding (X-bonding): A biological perspective. Protein Sci. 2013, 22, 139–152. [Google Scholar] [CrossRef]
- Cavallo, G.; Metrangolo, P.; Milani, R.; Pilati, T.; Priimagi, A.; Resnati, G.; Terraneo, G. The halogen bond. Chem. Rev. 2016, 116, 2478–2601. [Google Scholar] [CrossRef] [PubMed]
- Auffinger, P.; Hays, F.A.; Westhof, E.; Ho, P.S. Halogen bonds in biological molecules. Proc. Natl. Acad. Sci. USA 2004, 101, 16789–16794. [Google Scholar] [CrossRef] [PubMed]
- Berman, H.M.; Westbrook, J.; Feng, Z.; Gilliland, G.; Bhat, T.N.; Weissig, H.; Shindyalov, I.N.; Bourne, P.E. The Protein Data Bank. Nucleic Acids Res. 2000, 28, 235–242. [Google Scholar] [CrossRef] [PubMed]
- Voth, A.R.; Khuu, P.; Oishi, K.; Ho, P.S. Halogen bonds as orthogonal molecular interactions to hydrogen bonds. Nat. Chem. 2009, 1, 74–79. [Google Scholar] [CrossRef] [PubMed]
- Hardegger, L.A.; Kuhn, B.; Spinnler, B.; Anselm, L.; Ecabert, R.; Stihle, M.; Gsell, B.; Thoma, R.; Diez, J.; Benz, J.; et al. Systematic investigation of halogen bonding in protein-ligand interactions. Angew. Chem. Int. Ed. 2011, 50, 314–318. [Google Scholar] [CrossRef] [PubMed]
- Zhang, Q.; Xu, Z.J.; Shi, J.Y.; Zhu, W.L. Underestimated halogen bonds forming with protein backbone in protein data bank. J. Chem Inf. Model. 2017, 57, 1529–1534. [Google Scholar] [CrossRef] [PubMed]
- Ho, P.S. Halogen bonding in medicinal chemistry: From observation to prediction. Future Med. Chem. 2017, 9, 637–640. [Google Scholar] [CrossRef] [PubMed]
- Mendez, L.; Henriquez, G.; Sirimulla, S.; Narayan, M. Looking back, looking forward at halogen bonding in drug discovery. Molecules 2017, 22, 1397. [Google Scholar] [CrossRef] [PubMed]
- Voth, A.R.; Hays, F.A.; Ho, P.S. Directing macromolecular conformation through halogen bonds. Proc. Natl. Acad. Sci. USA 2007, 104, 6188–6193. [Google Scholar] [CrossRef] [PubMed]
- Danelius, E.; Andersson, H.; Jarvoll, P.; Lood, K.; Grafenstein, J.; Erdelyi, M. Halogen bonding: A powerful tool for modulation of peptide conformation. Biochemistry 2017, 56, 3265–3272. [Google Scholar] [CrossRef] [PubMed]
- Murray, J.S.; Lane, P.; Clark, T.; Riley, K.E.; Politzer, P. σ-holes, π-holes and electrostatically-driven interactions. J. Mol. Model. 2012, 18, 541–548. [Google Scholar] [CrossRef] [PubMed]
- Murrayrust, P.; Burgi, H.B.; Dunitz, J.D. Chemical reaction paths. 5. SN1 reaction of tetrahedral molecules. J. Am. Chem. Soc. 1975, 97, 921–922. [Google Scholar] [CrossRef]
- Choudhary, A.; Gandla, D.; Krow, G.R.; Raines, R.T. Nature of Amide Carbonyl-Carbonyl Interactions in Proteins. J. Am. Chem. Soc. 2009, 131, 7244–7246. [Google Scholar] [CrossRef] [PubMed]
- Bartlett, G.J.; Choudhary, A.; Raines, R.T.; Woolfson, D.N. n → π* interactions in proteins. Nat. Chem. Biol. 2010, 6, 615–620. [Google Scholar] [CrossRef] [PubMed]
- Newberry, R.W.; Bartlett, G.J.; VanVeller, B.; Woolfson, D.N.; Raines, R.T. Signatures of n → π* interactions in proteins. Protein Sci. 2014, 23, 284–288. [Google Scholar] [CrossRef]
- Schottel, B.L.; Chifotides, H.T.; Dunbar, K.R. Anion-π interactions. Chem. Soc. Rev. 2008, 37, 68–83. [Google Scholar] [CrossRef]
- Mooibroek, T.J.; Gamez, P. Anion-arene and lone pair-arene interactions are directional. Cryst. Eng. Comm. 2012, 14, 1027–1030. [Google Scholar] [CrossRef]
- Frontera, A.; Gamez, P.; Mascal, M.; Mooibroek, T.J.; Reedijk, J. Putting anion-π interactions into perspective. Angew. Chem. Int. Ed. 2011, 50, 9564–9583. [Google Scholar] [CrossRef]
- Mooibroek, T.J.; Gamez, P.; Reedijk, J. Lone pair-π interactions: A new supramolecular bond? Cryst. Eng. Comm. 2008, 10, 1501–1515. [Google Scholar] [CrossRef]
- Burgi, H.B. Stereochemistry of reaction paths as determined from crystal-structure data - relationship between structure and energy. Angew. Chem. Int. Ed. 1975, 14, 460–473. [Google Scholar] [CrossRef]
- Doppert, M.T.; van Overeem, H.; Mooibroek, T.J. Intermolecular π-Hole / n→π* interactions with carbon monoxide ligands in crystal structures. Chem. Commun. 2018, 54, 12049–12052. [Google Scholar] [CrossRef] [PubMed]
- Ruigrok van der Werve, A.; van Dijk, Y.R.; Mooibroek, T.J. π-Hole / n→π* interactions with acetonitrile in crystal structures. Chem. Commun. 2018, 54, 10742–10745. [Google Scholar] [CrossRef] [PubMed]
- Lewinski, J.; Bury, W.; Justyniak, W. Significance of intermolecular S center dot center dot center dot C(π) interaction involving M-S and -C=O centers in crystal structures of metal thiolate complexes. Eur. J. Inorg. Chem. 2005. [Google Scholar] [CrossRef]
- Echeverria, J. The n → π* interaction in metal complexes. Chem. Commun. 2018, 54, 3061–3064. [Google Scholar] [CrossRef]
- Gamez, P.; Mooibroek, T.J.; Teat, S.J.; Reedijk, J. Anion binding involving π-acidic heteroaromatic rings. Acc. Chem. Res. 2007, 40, 435–444. [Google Scholar] [CrossRef] [PubMed]
- Gamez, P. The anion-π interaction: Naissance and establishment of a peculiar supramolecular bond. Inorg. Chem. Front. 2014, 1, 35–43. [Google Scholar] [CrossRef]
- Echeverria, J. Intermolecular Carbonyl ··· Carbonyl Interactions in Transition-Metal Complexes. Inorg. Chem. 2018, 57, 5429–5437. [Google Scholar] [CrossRef]
- Mooibroek, T.J. Coordinated nitrate anions can be directional π-hole donors in the solid state: A CSD study. Cryst. Eng. Comm. 2017, 19, 4485–4488. [Google Scholar] [CrossRef]
- Bauza, A.; Frontera, A.; Mooibroek, T.J. NO3– anions can act as Lewis acid in the solid state. Nat. Commun. 2017, 8, 14522. [Google Scholar] [CrossRef]
- Bauza, A.; Frontera, A.; Mooibroek, T.J. π-Hole interactions involving nitro compounds: Directionality of nitrate esters. Cryst. Growth Des. 2016, 16, 5520–5524. [Google Scholar] [CrossRef]
- Franconetti, A.; Frontera, A.; Mooibroek, T.J. Intramolecular π-hole interactions with nitro aromatics. Cryst. Eng. Comm. 2019. [Google Scholar] [CrossRef]
- Bauza, A.; Frontera, A.; Mooibroek, T.J. π-Hole Interactions Involving Nitro Aromatic Ligands Within Protein Structures. Chem. Eur. J. 2019. [Google Scholar] [CrossRef]
- Li, W.; Spada, L.; Tasinato, N.; Rampino, S.; Evangelisti, L.; Gualandi, A.; Cozzi, P.G.; Melandri, S.; Barone, V.; Puzzarini, C. Theory Meets Experiment for Noncovalent Complexes: The Puzzling Case of Pnicogen Interactions. Angew. Chem. Int. Ed. 2018, 57, 13853–13857. [Google Scholar] [CrossRef] [PubMed]
- Grabowski, S.J. Tetrel bond-sigma-hole bond as a preliminary stage of the S(N)2 reaction. Phys. Chem. Chem. Phys. 2014, 16, 1824–1834. [Google Scholar] [CrossRef] [PubMed]
- Bauza, A.; Frontera, A. RCH3 center dot center dot center dot O Interactions in Biological Systems: Are They Trifurcated H-Bonds or Noncovalent Carbon Bonds? Crystals 2016, 6, 26. [Google Scholar] [CrossRef]
- Mani, D.; Arunan, E. The X-C ··· Y (X = O/F, Y = O/S/F/Cl/Br/N/P) ’carbon bond’ and hydrophobic interactions. Phys. Chem. Chem. Phys. 2013, 15, 14377–14383. [Google Scholar] [CrossRef] [PubMed]
- Scheiner, S. Ability of IR and NMR Spectral Data to Distinguish between a Tetrel Bond and a Hydrogen Bond. J. Phys. Chem. A 2018, 122, 7852–7862. [Google Scholar] [CrossRef]
- Trievel, R.C.; Scheiner, S. Crystallographic and Computational Characterization of Methyl Tetrel Bonding in S-Adenosylmethionine-Dependent Methyltransferases. Molecules 2018, 23, 2965. [Google Scholar] [CrossRef]
- Sethio, D.; Oliveira, V.; Kraka, E. Quantitative Assessment of Tetrel Bonding Utilizing Vibrational Spectroscopy. Molecules 2018, 23, 2763. [Google Scholar] [CrossRef]
- Scheiner, S. Systematic Elucidation of Factors That Influence the Strength of Tetrel Bonds. J. Phys. Chem. A 2017, 121, 5561–5568. [Google Scholar] [CrossRef]
- Laconsay, C.J.; Galbraith, J.M. A valence bond theory treatment of tetrel bonding interactions. Comput. Theor. Chem. 2017, 1116, 202–206. [Google Scholar] [CrossRef]
- Wei, Y.X.; Li, H.B.; Cheng, J.B.; Li, W.Z.; Li, Q.Z. Prominent enhancing effects of substituents on the strength of π···σ-hole tetrel bond. Int. J. Quantum Chem. 2017, 117, e25448. [Google Scholar] [CrossRef]
- Mani, D.; Arunan, E. The X-C ··· π (X = F, Cl, Br, CN) Carbon Bond. J. Phys. Chem. A 2014, 118, 10081–10089. [Google Scholar] [CrossRef] [PubMed]
- Mundlapati, V.R.; Sahoo, D.K.; Bhaumik, S.; Jena, S.; Chandrakar, A.; Biswal, H.S. Noncovalent Carbon-Bonding Interactions in Proteins. Angew. Chem. Int. Ed. 2018, 57, 16496–16500. [Google Scholar] [CrossRef] [PubMed]
- Varadwaj, P.R.; Varadwaj, A.; Jin, B.Y. Significant evidence of C ··· O and C center dot center dot center dot C long-range contacts in several heterodimeric complexes of CO with CH3-X, should one refer to them as carbon and dicarbon bonds! Phys. Chem. Chem. Phys. 2014, 16, 17238–17252. [Google Scholar] [CrossRef] [PubMed]
- Garcia-Llinas, X.; Bauza, A.; Seth, S.K.; Frontera, A. Importance of R-CF3 center dot center dot center dot O Tetrel Bonding Interactions in Biological Systems. J. Phys. Chem. A 2017, 121, 5371–5376. [Google Scholar] [CrossRef] [PubMed]
- Thomas, S.P.; Pavan, M.S.; Row, T.N.G. Experimental evidence for ’carbon bonding’ in the solid state from charge density analysis. Chem. Commun. 2014, 50, 49–51. [Google Scholar] [CrossRef] [PubMed]
- Allen, F.H. The Cambridge Structural Database: A quarter of a million crystal structures and rising. Acta Crystallogr. Sect. B-Struct. Sci. 2002, 58, 380–388. [Google Scholar] [CrossRef] [PubMed]
- Groom, C.R.; Bruno, I.J.; Lightfoot, M.P.; Ward, S.C. The Cambridge Structural Database. Acta Crystallogr. Sect. B-Struct. Sci. 2016, 72, 171–179. [Google Scholar] [CrossRef] [PubMed]
- Bruno, I.J.; Cole, J.C.; Edgington, P.R.; Kessler, M.; Macrae, C.F.; McCabe, P.; Pearson, J.; Taylor, R. New software for searching the Cambridge Structural Database and visualizing crystal structures. Acta Crystallogr. Sect. B-Struct. Sci. 2002, 58, 389–397. [Google Scholar] [CrossRef]
- Hendlich, M.; Bergner, A.; Gunther, J.; Klebe, G. Relibase: Design and development of a database for comprehensive analysis of protein-ligand interactions. J. Mol. Biol. 2003, 326, 607–620. [Google Scholar] [CrossRef]
- Mooibroek, T.J.; Gamez, P. Directional character of solvent- and anion-pentafluorophenyl supramolecular interactions. Cryst. Eng. Comm. 2012, 14, 3902–3906. [Google Scholar] [CrossRef]
- Mooibroek, T.J.; Gamez, P. How directional are D-H center dot center dot center dot phenyl interactions in the solid state (D = C, N, O)? CrystEngComm 2012, 14, 8462–8467. [Google Scholar] [CrossRef]
- Mooibroek, T.J.; Gamez, P. Halogen ··· phenyl supramolecular interactions in the solid state: Hydrogen versus halogen bonding and directionality. CrystEngComm 2013, 15, 1802–1805. [Google Scholar] [CrossRef]
- Mooibroek, T.J.; Gamez, P. Halogen bonding versus hydrogen bonding: What does the Cambridge Database reveal? Cryst. Eng. Comm. 2013, 15, 4565–4570. [Google Scholar] [CrossRef]
- Bauza, A.; Mooibroek, T.J.; Frontera, A. Directionality of π-holes in nitro compounds. Chem. Commun. 2015, 51, 1491–1493. [Google Scholar] [CrossRef] [PubMed]
- Allen, F.H.; Kennard, O.; Watson, D.G.; Brammer, L.; Orpen, A.G.; Taylor, R. Tables of bond lengths determined by X-ray and neutron-diffraction. 1. Bond lengths in organic compounds. J. Chem. Soc. Perkin Trans. 2 1987, S1–S19. [Google Scholar] [CrossRef]
- Bondi, A. van der Waals Volumes and Radii. J. Phys. Chem. 1964, 68, 441–452. [Google Scholar] [CrossRef]
- Lee, C.T.; Yang, W.T.; Parr, R.G. Development of the Colle-Salvetti correlation-energy formula into a functional of the electron density. Phys. Rev. B 1988, 37, 785–789. [Google Scholar] [CrossRef]
- Becke, A.D. Density-functional exchange-energy approximation with correct asymptotic-behaviour. Phys. Rev. A 1988, 38, 3098–3100. [Google Scholar] [CrossRef]
- Grimme, S.; Antony, J.; Ehrlich, S.; Krieg, H. A consistent and accurate ab initio parametrization of density functional dispersion correction (DFT-D) for the 94 elements H-Pu. J. Chem. Phys. 2010, 132, 154104. [Google Scholar] [CrossRef]
- Weigend, F.; Ahlrichs, R. Balanced basis sets of split valence, triple zeta valence and quadruple zeta valence quality for H to Rn: Design and assessment of accuracy. Phys. Chem. Chem. Phys. 2005, 7, 3297–3305. [Google Scholar] [CrossRef]
- Weigend, F. Accurate Coulomb-fitting basis sets for H to Rn. Phys. Chem. Chem. Phys. 2006, 8, 1057–1065. [Google Scholar] [CrossRef]
- te Velde, G.; Bickelhaupt, F.M.; Baerends, E.J.; Guerra, C.F.; van Gisbergen, S.J.A.; Snijders, J.G.; Ziegler, T. Chemistry with ADF. J. Comput. Chem. 2001, 22, 931–967. [Google Scholar] [CrossRef]
- Bader, R.F.W. Atoms in Molecules. Acc. Chem. Res. 1985, 18, 9–15. [Google Scholar] [CrossRef]
- Bickelhaupt, F.M.; Baerends, E.J. Kohn-Sham density functional theory: Predicting and understanding chemistry. In Reviews in Computational Chemistry, Vol 15; Lipkowitz, K.B., Boyd, D.B., Eds.; Wiley-Vch, Inc.: New York, NY, USA, 2000; Volume 15, pp. 1–86. [Google Scholar]
- van der Lubbe, S.C.C.; Guerra, C.F. The Nature of Hydrogen Bonds: A Delineation of the Role of Different Energy Components on Hydrogen Bond Strengths and Lengths. Chem. Asian J. 2019, 14, 2760–2769. [Google Scholar] [CrossRef]
- Schubert, H.L.; Blumenthal, R.M.; Cheng, X.D. Many paths to methyltransfer: A chronicle of convergence. Trends Biochem.Sci. 2003, 28, 329–335. [Google Scholar] [CrossRef]
- Foster, J.W.; Moat, A.G. Nicotinamide Adenosine-dinucleotide Biosynthesis and Pyridine-nucleotide Cycle Metabilism in Microbial Systems. Microbiol. Rev. 1980, 44, 83–105. [Google Scholar]
- Pollak, N.; Dolle, C.; Ziegler, M. The power to reduce: Pyridine nucleotides - small molecules with a multitude of functions. Biochem. J. 2007, 402, 205–218. [Google Scholar] [CrossRef]


| Interacting X–CH3: | Water–O | Dimethylacetamide (dma) – C=O | ||||||
|---|---|---|---|---|---|---|---|---|
| adduct | α (°) | ΔE | E/O/D in % | adduct | α (°) | dE | E/O/D in % | |
| Me–CH3 | 1a | 170a | −1.2 | 32/22/46% | 1b | 122f | −2.8 | 26/16/58% |
| Me2N–CH3 | 2a | 174b | −0.8 | 36/18/45% | 2b | 173b | −1.6 | 33/22/44% |
| MeO–CH3 | 3a | 175 b | −1.2 | 48/17/35% | 3b | 164f | −3.2 | 27/16/56% |
| Me2P–CH3 | 4a | 167a | −1.2 | 28/32/41% | 4b | 91d | −4.2 | 45/21/33% |
| MeS–CH3 | 5a | 177 b | −1.0 | 44/17/38% | 5b | 100d | −3.7 | 46/21/32% |
| Me2C+–CH3 | 6a | 75c | −12.6 | 66/22/12% | 6b | 109c | −82.4 | 43/55/2% |
| Me3N+–CH3 | 7a | 173b | −7.8 | 73/15/12% | 7b | 170b | −14.7 | 70/19/10% |
| Me2O+–CH3 | 8a | 176b | −9.1 | 72/18/10% | 8b | 175b | −17.6 | 69/22/8% |
| Me3P+–CH3 | 9a | 55d | −8.2 | 69/14/18% | 9b | 71d | −21.7 | 64/23/13% |
| Me2S+–CH3 | 10a | 168b | −7.6 | 73/15/12% | 10a | 170b | −15.0 | 70/20/10% |
| PyN+–CH3 | 11a | 170b | −7.3 | 73/15/12% | 11b | 175b | −14.2 | 71/19/10% |
| 12a | 93d | −10.6 | 70/22/9% | 12b | 91d | −20.3 | 65/27/8% | |
| 13a | 68e | −9.0 | 70/14/16% | 13b | 74e | −18.2 | 64/21/15% | |
| I–CH3g | 14a | 175b | −1.6 | 53/18/28% | 14b | 175b | −3.0 | 52/20/28% |
| 15a | 84d | −3.8 | 55/23/21% | |||||
| F3C–CH3 g | 16a | 179b | −1.8 | 59/13/27% | 16b | 175b | −3.4 | 59/15/26% |
| 17a | 76d | −3.8 | 60/15/24% | |||||
| N≡C–CH3 g | 18a | 158b | −2.3 | 65/13/23% | 18b | 172b | −4.3 | 62/15/23% |
| 19a | 68d | −5.1 | 63/19/18% | |||||
| O2N–CH3 g | 20a | 165b | −2.8 | 66/13/21% | 20b | 179b | −4.9 | 64/15/21% |
| 21a | 86d | −6.4 | 63/25/12% | |||||
© 2019 by the author. Licensee MDPI, Basel, Switzerland. This article is an open access article distributed under the terms and conditions of the Creative Commons Attribution (CC BY) license (http://creativecommons.org/licenses/by/4.0/).
Share and Cite
Mooibroek, T.J. Intermolecular Non-Covalent Carbon-Bonding Interactions with Methyl Groups: A CSD, PDB and DFT Study. Molecules 2019, 24, 3370. https://doi.org/10.3390/molecules24183370
Mooibroek TJ. Intermolecular Non-Covalent Carbon-Bonding Interactions with Methyl Groups: A CSD, PDB and DFT Study. Molecules. 2019; 24(18):3370. https://doi.org/10.3390/molecules24183370
Chicago/Turabian StyleMooibroek, Tiddo J. 2019. "Intermolecular Non-Covalent Carbon-Bonding Interactions with Methyl Groups: A CSD, PDB and DFT Study" Molecules 24, no. 18: 3370. https://doi.org/10.3390/molecules24183370
APA StyleMooibroek, T. J. (2019). Intermolecular Non-Covalent Carbon-Bonding Interactions with Methyl Groups: A CSD, PDB and DFT Study. Molecules, 24(18), 3370. https://doi.org/10.3390/molecules24183370