
Therapeutic Effects of Anthocyanins for Vision and Eye Health

Abstract
1. Introduction
2. BCA Properties, Bioavailability and Distribution in Eye Tissues
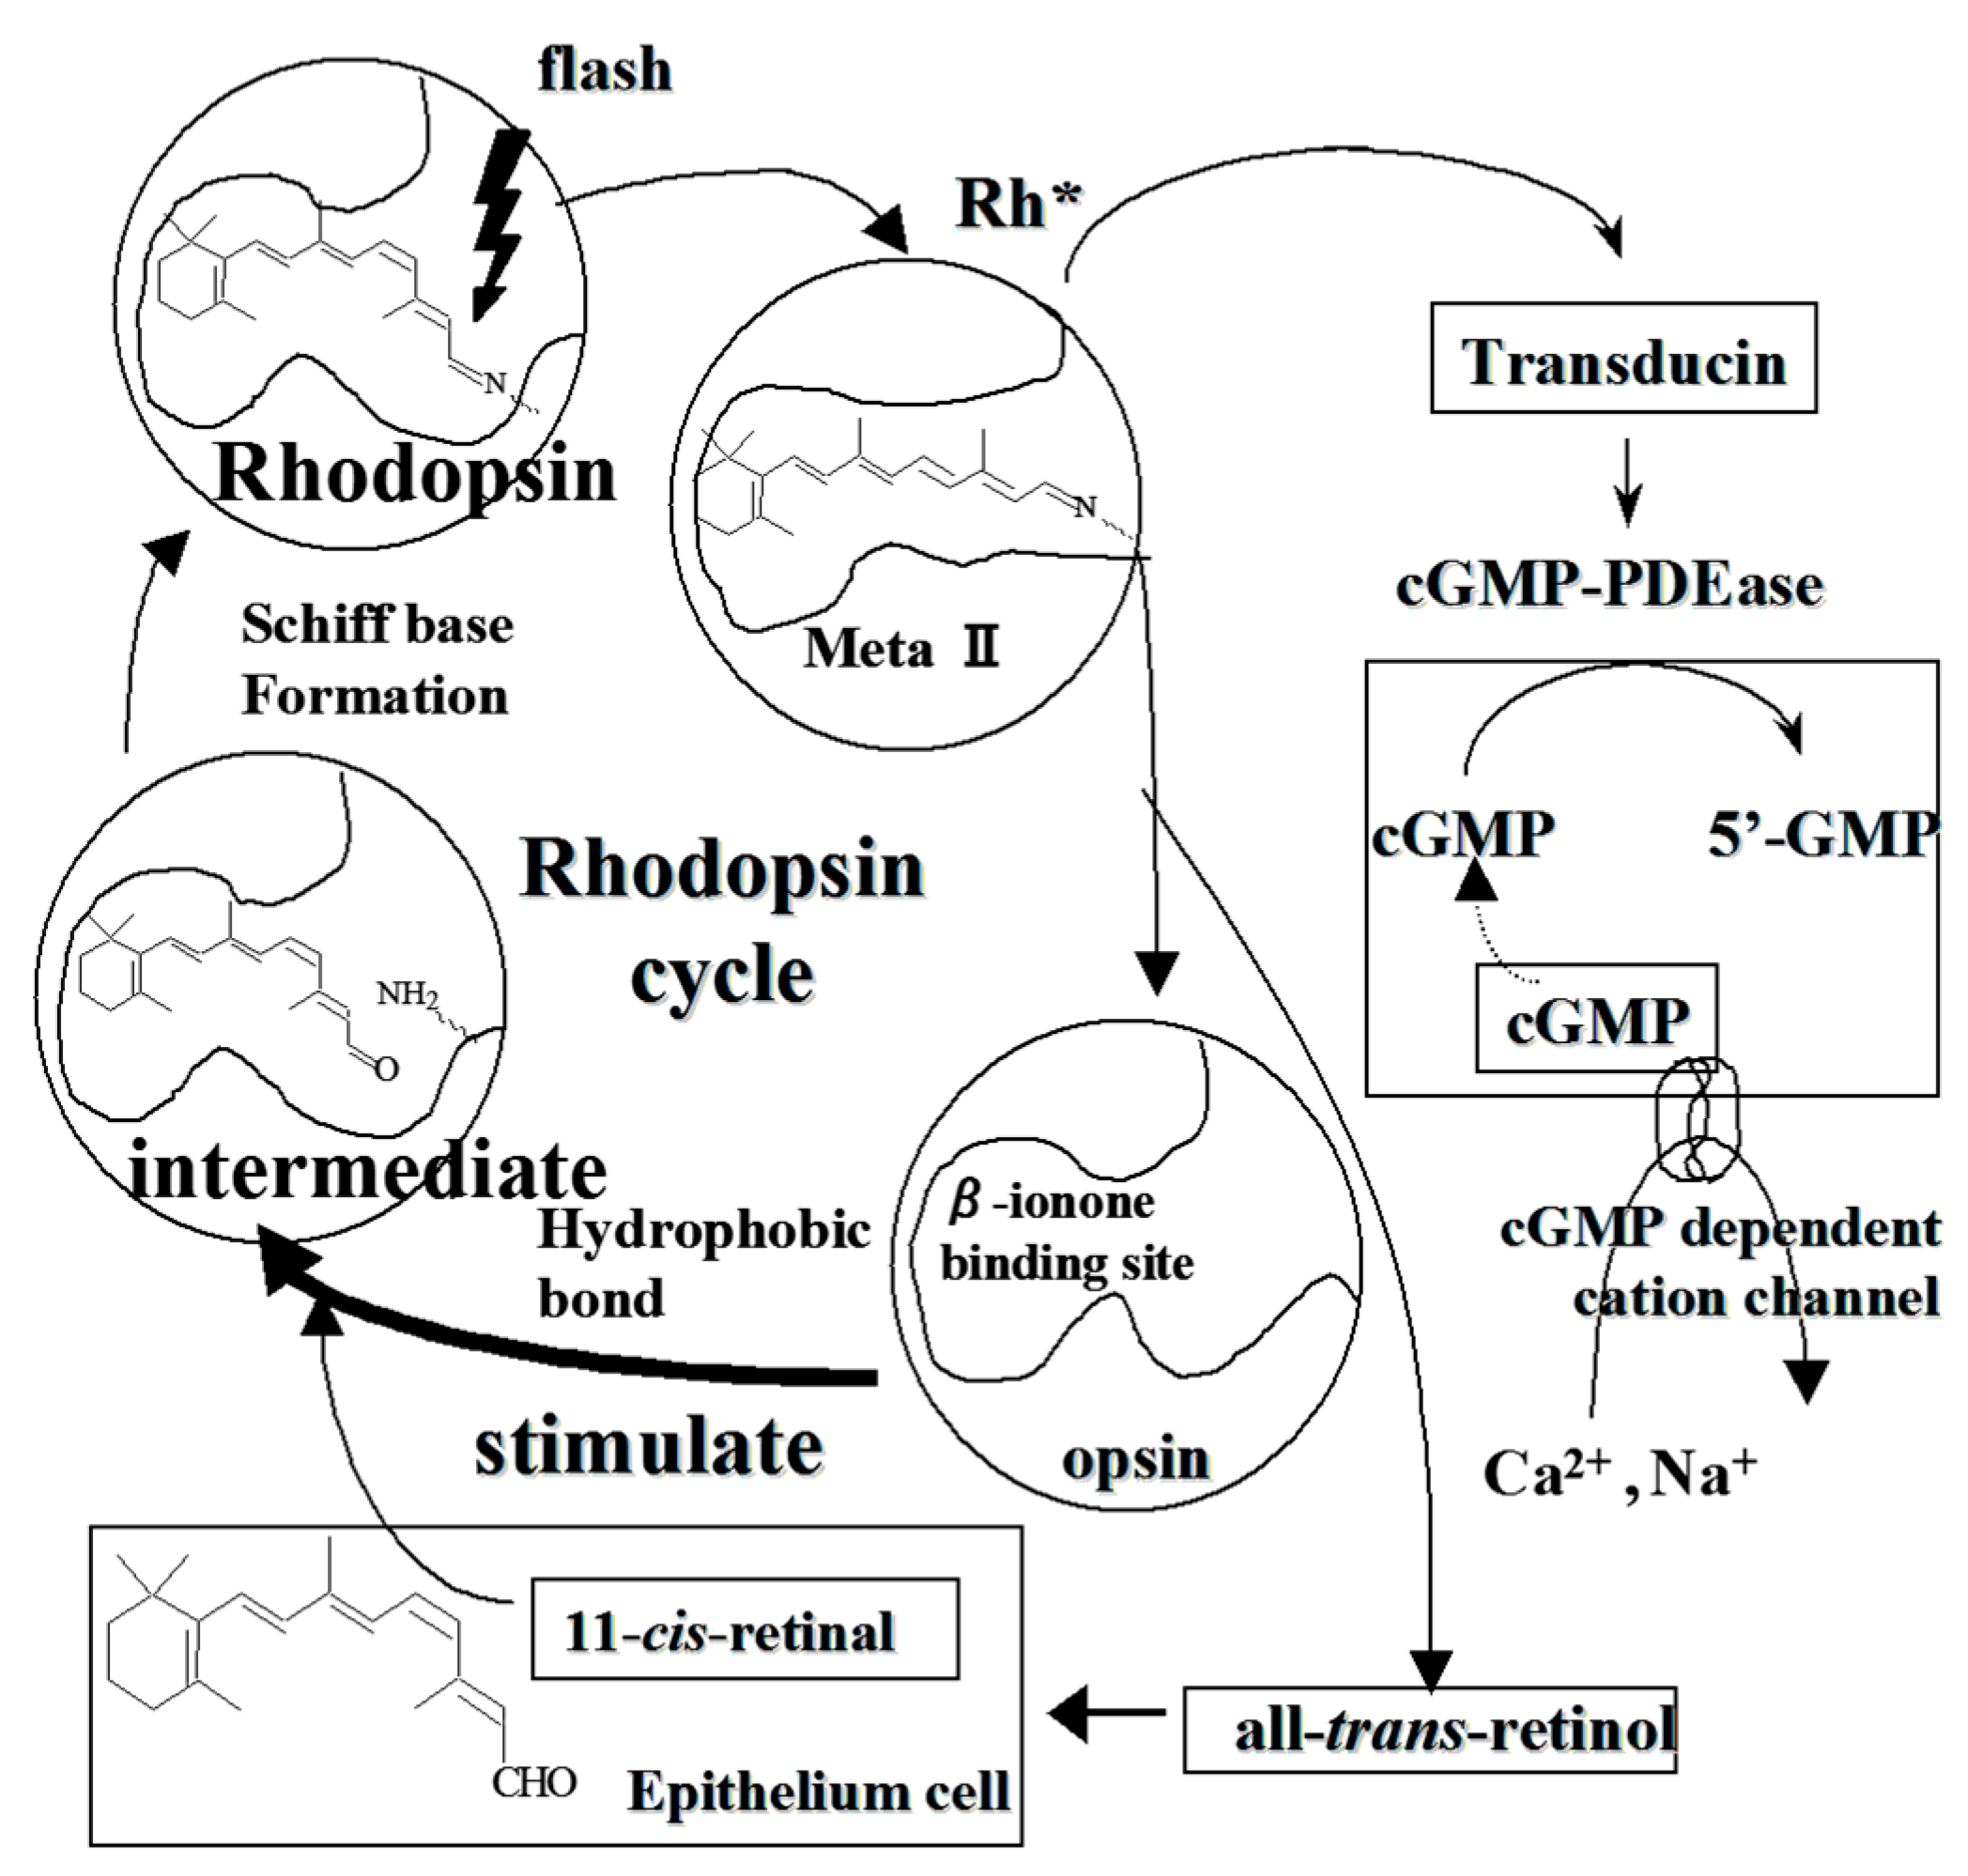
3. Stimulatory on Rhodopsin Regeneration by Cyanidin Glycosides
4. Key Effect of Anthocyanin in Ophthalmologic Field
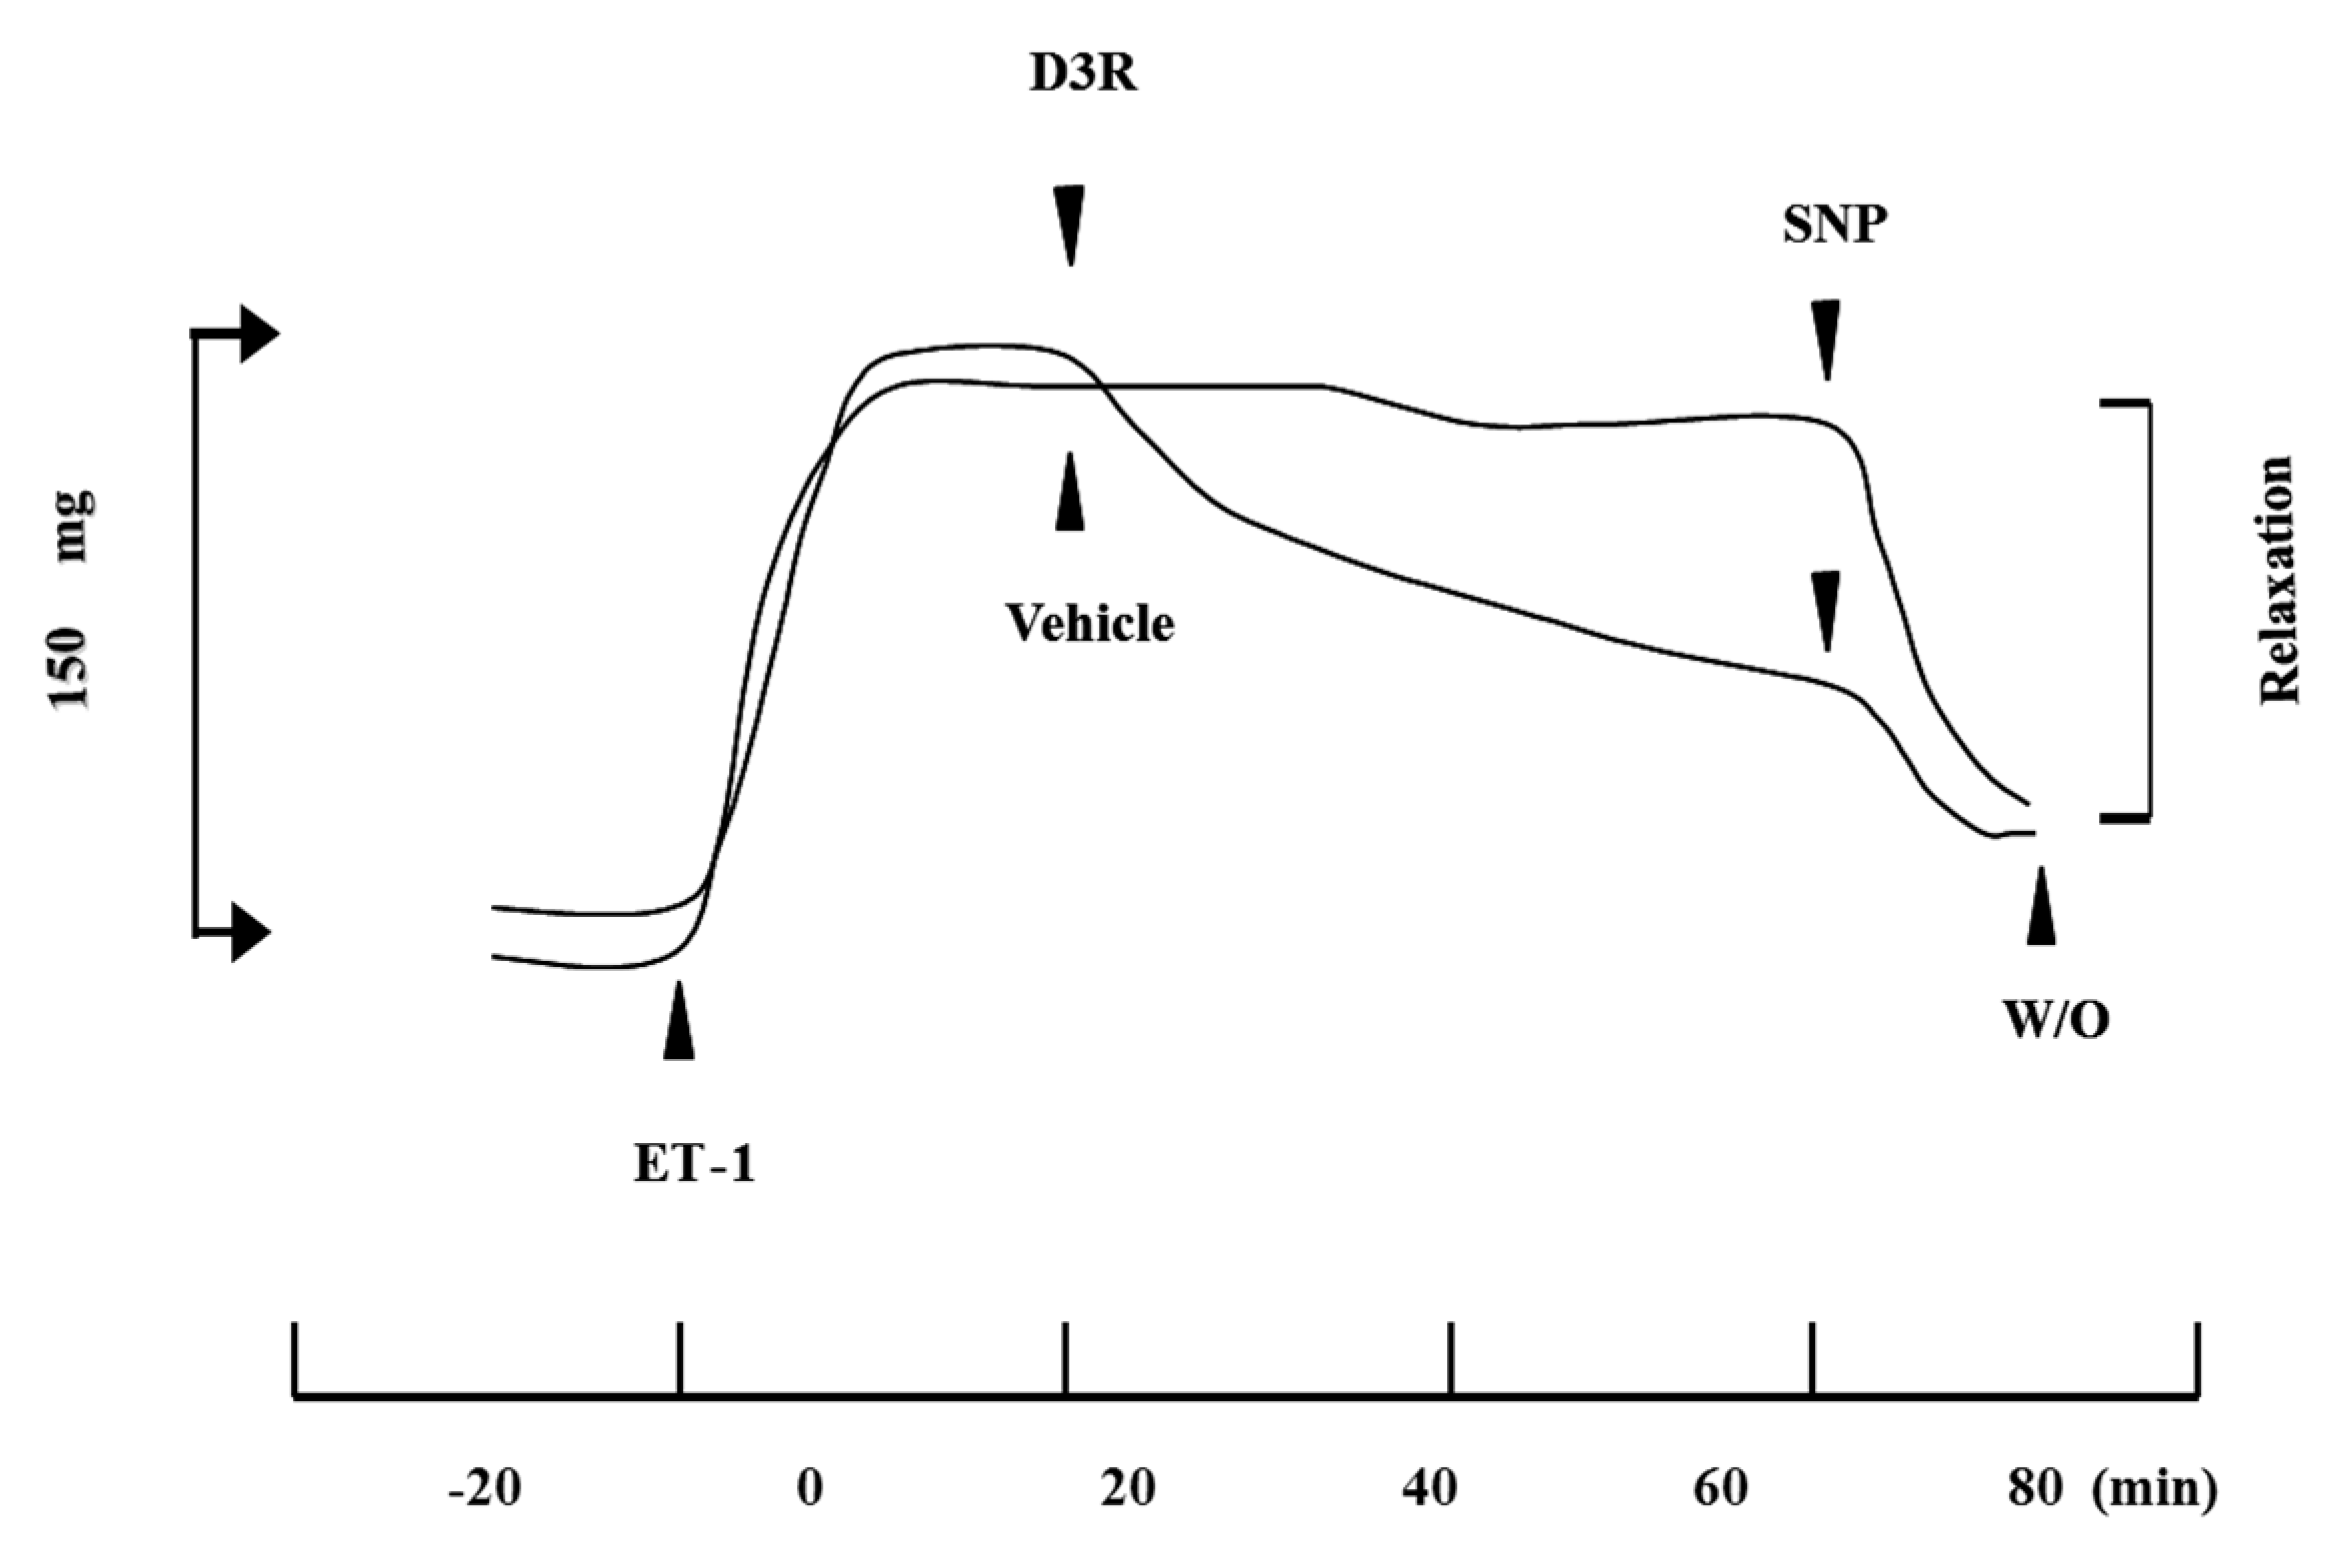
4.1. Ciliary Muscle Relaxation Induced by Anthocyanins
4.2. D3R Has an Inhibitory Effect against CM Contraction
4.3. Myosin Regulatory Light Chain (RLC) Phosphorylation and Cyclic
4.4. Endothelin Receptor Binding Assay in Ciliary Muscle
4.5. Summary of Anthocyanin Effect for Ciliary Smooth Muscle Relaxation
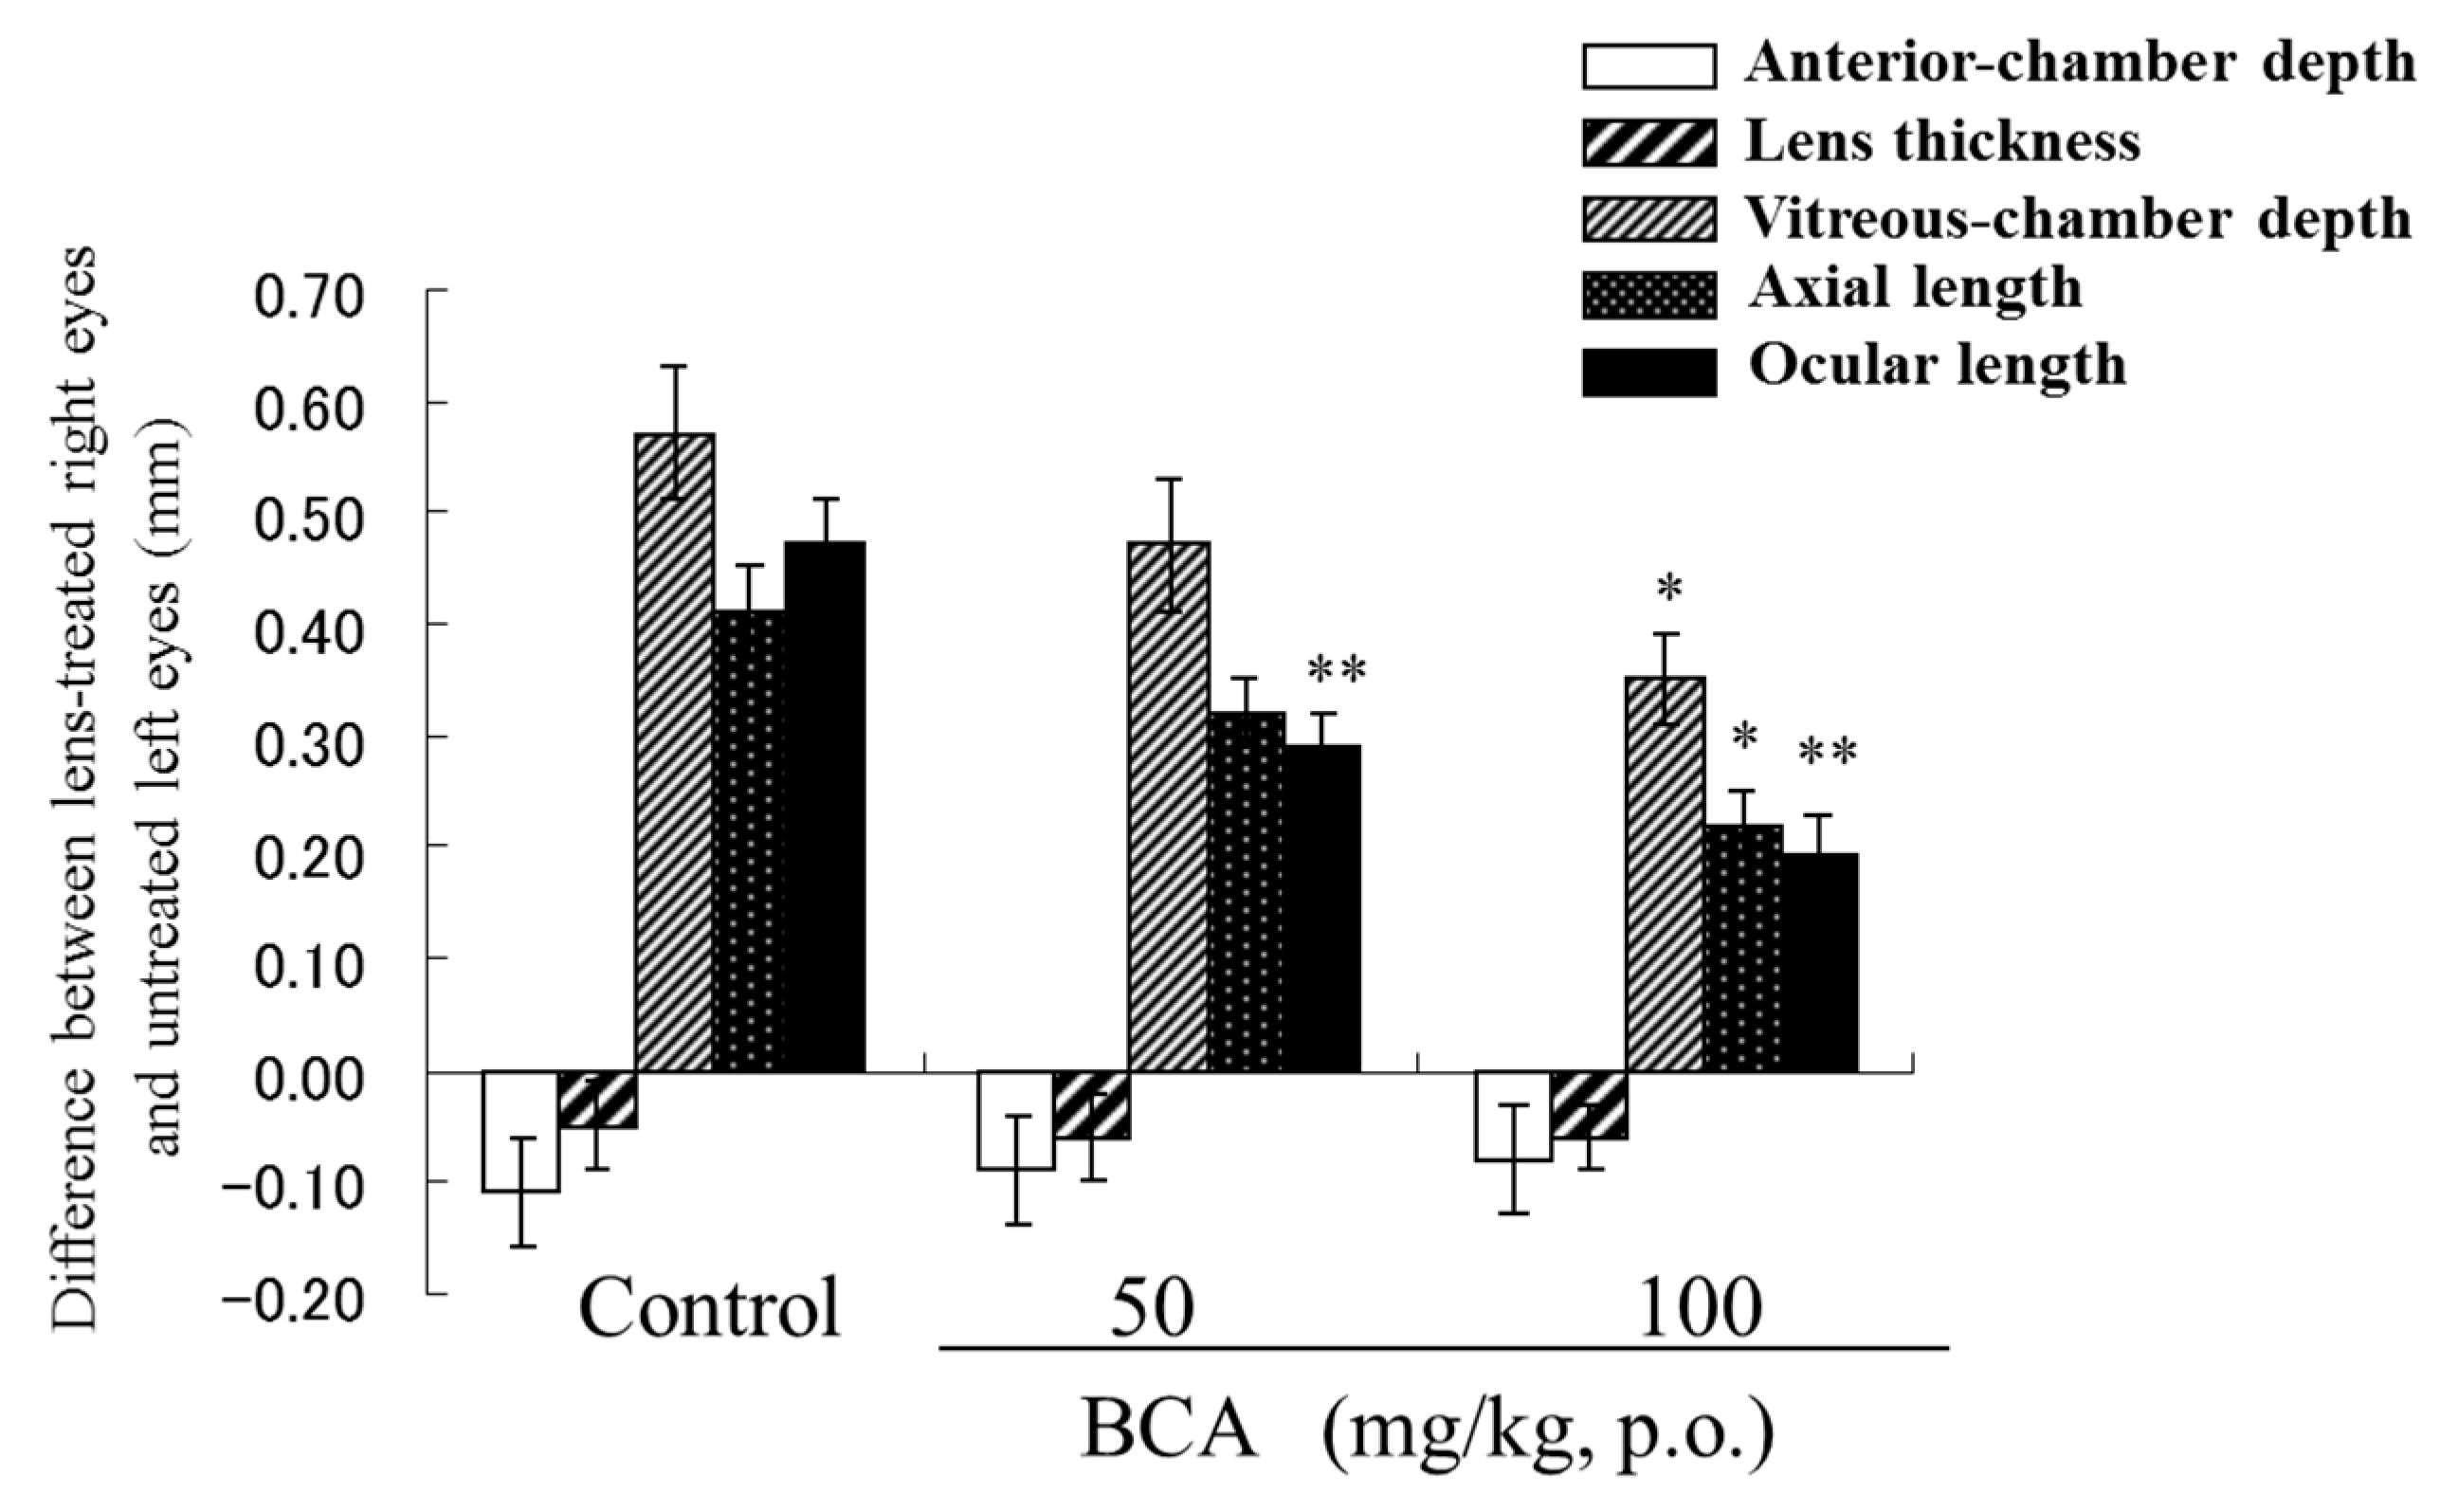
5. Prevention of Myopia in a Negative Lens Fitted Chick Model
6. Dark Adaptation Study
7. Transient Refractive Alteration Study
8. Clinical Study of AC Effects in Glaucoma Patients
9. Conclusions
Author Contributions
Funding
Conflicts of Interest
References
- Tyrrell, R.A.; Leibowitz, H.W. The relation of vergence effort to reports of visual fatigue following prolonged near work. Hum. Factors 1990, 32, 341–357. [Google Scholar] [CrossRef] [PubMed]
- Murata, K.; Araki, S.; Yokoyama, K.; Yamashita, K.; Okumatsu, T.; Sakou, S. Accumulation of VDT work-related visual fatigue assessed by visual evoked potential, near point distance and critical flicker fusion. Ind. Health 1996, 34, 61–69. [Google Scholar] [CrossRef] [PubMed]
- Morazzoni, P.; Bombardelli, E. Vaccinim myrtillus L. Fitoterapia 1996, 67, 3–29. [Google Scholar]
- Tsuda, T.; Osawa, T. Anthocyanin. J. Eye 2008, 25, 1393–1395. [Google Scholar]
- Jayle, G.E.; Aubert, L. Action of anthocyanin glycosides on the scopic and mesopic vision of the normal subject. Therapie 1964, 19, 171–185. [Google Scholar] [PubMed]
- Canter, P.H.; Ernst, E. Anthocyanosides of Vaccinium myrtillus (bilberry) for night vision—A systematic review of placebo-controlled trials. Surv. Ophthalmol. 2004, 49, 38–50. [Google Scholar] [CrossRef] [PubMed]
- Kalt, W.; Hanneken, A.; Milbury, P.; Tremblay, F. Recent research on polyphenolics in vision and eye health. J. Agric. Food Chem. 2010, 58, 4001–4007. [Google Scholar] [CrossRef] [PubMed]
- Matsumoto, H.; Hanamura, S.; Kawakami, T.; Sato, Y.; Hirayama, M. Preparative-scale isolation of four anthocyanin components of black currant (Ribes nigrum L.) fruits. J. Agric. Food Chem. 2001, 49, 1541–1545. [Google Scholar] [CrossRef] [PubMed]
- Matsumoto, H.; Kamm, K.E.; Stull, J.T.; Azuma, H. Delphinidin-3-rutinoside relaxes the bovine ciliary smooth muscle through activation of ETB receptor and NO/cGMP pathway. Exp. Eye Res. 2005, 80, 313–322. [Google Scholar] [CrossRef]
- Tokoro, T. Developmental mechanism of low myopia and therapeutic possibilities. A review. Nippon Ganka Gakkai Zasshi 1998, 102, 796–812. [Google Scholar] [PubMed]
- Beauregard, C.; Liu, Q.; Chiou, G.C. Effects of nitric oxide donors and nitric oxide synthase substrates on ciliary muscle contracted by carbachol and endothelin for possible use in myopia prevention. J. Ocul. Pharmacol. Ther. 2001, 17, 1–9. [Google Scholar] [CrossRef] [PubMed]
- Matsumoto, H.; Nakamura, Y.; Tachibanaki, S.; Kawamura, S.; Hirayama, M. Stimulatory effect of cyanidin 3-glycosides on the regeneration of rhodopsin. J. Agric. Food Chem. 2003, 51, 3560–3563. [Google Scholar] [CrossRef] [PubMed]
- Iida, H.; Nakamura, Y.; Matsumoto, H.; Takeuchi, Y.; Harano, S.; Ishihara, M.; Katsumi, O. Effect of black-currant extract on negative lens-induced ocular growth in chicks. Ophthalmic Res. 2010, 44, 242–250. [Google Scholar] [CrossRef] [PubMed]
- Iida, H.; Nakamura, Y.; Matsumoto, H.; Kawahata, K.; Koga, J.; Katsumi, O. Differential effects of black currant anthocyanins on diffuser-or negative lens-induced ocular elongation in chicks. J. Ocul. Pharmacol. Ther. 2013, 29, 604–609. [Google Scholar] [CrossRef] [PubMed]
- Nakaishi, H.; Matsumoto, H.; Tominaga, S.; Hirayama, M. Effects of black currant anthocyanoside intake on dark adaptation and VDT work-induced transient refractive alteration in healthy humans. Altern. Med. Rev. 2000, 5, 553–562. [Google Scholar] [PubMed]
- Ohguro, H.; Ohguro, I.; Katai, M.; Tanaka, S. Two-year randomized, placebo-controlled study of black currant anthocyanins on visual field in glaucoma. Ophthalmologica 2012, 228, 26–35. [Google Scholar] [CrossRef] [PubMed]
- Yoshida, K.; Ohguro, I.; Ohguro, H. Black currant anthocyanins normalized abnormal levels of serum concentrations of endothelin-1 in patients with glaucoma. J. Ocul. Pharmacol. Ther. 2013, 29, 480–487. [Google Scholar] [CrossRef] [PubMed]
- Kuntz, S.; Rudloff, S.; Asseburg, H.; Borsch, C.; Frohling, B.; Unger, F.; Dold, S.; Spengler, B.; Rompp, A.; Kunz, C. Uptake and bioavailability of anthocyanins and phenolic acids from grape/blueberry juice and smoothie in vitro and in vivo. Br. J. Nutr. 2015, 113, 1044–1055. [Google Scholar] [CrossRef] [PubMed]
- Mueller, D.; Jung, K.; Winter, M.; Rogoll, D.; Melcher, R.; Richling, E. Human intervention study to investigate the intestinal accessibility and bioavailability of anthocyanins from bilberries. Food Chem. 2017, 231, 275–286. [Google Scholar] [CrossRef] [PubMed]
- Rohrig, T.; Kirsch, V.; Schipp, D.; Galan, J.; Richling, E. Absorption of anthocyanin rutinosides after consumption of a blackcurrant (Ribes nigrum L.) Extract. J. Agric. Food Chem. 2019, 67, 6792–6797. [Google Scholar] [CrossRef] [PubMed]
- Matsumoto, H.; Inaba, H.; Kishi, M.; Tominaga, S.; Hirayama, M.; Tsuda, T. Orally administered delphinidin 3-rutinoside and cyanidin 3-rutinoside are directly absorbed in rats and humans and appear in the blood as the intact forms. J. Agric. Food Chem. 2001, 49, 1546–1551. [Google Scholar] [CrossRef] [PubMed]
- Borges, G.; Roowi, S.; Rouanet, J.M.; Duthie, G.G.; Lean, M.E.; Crozier, A. The bioavailability of raspberry anthocyanins and ellagitannins in rats. Mol. Nutr. Food Res. 2007, 51, 714–725. [Google Scholar] [CrossRef] [PubMed]
- Vitaglione, P.; Donnarumma, G.; Napolitano, A.; Galvano, F.; Gallo, A.; Scalfi, L.; Fogliano, V. Protocatechuic acid is the major human metabolite of cyanidin-glucosides. J. Nutr. 2007, 137, 2043–2048. [Google Scholar] [CrossRef] [PubMed]
- Czank, C.; Cassidy, A.; Zhang, Q.; Morrison, D.J.; Preston, T.; Kroon, P.A.; Botting, N.P.; Kay, C.D. Human metabolism and elimination of the anthocyanin, cyanidin-3-glucoside: A (13)C-tracer study. Am. J. Clin. Nutr. 2013, 97, 995–1003. [Google Scholar] [CrossRef] [PubMed]
- Matsumoto, H.; Nakamura, Y.; Iida, H.; Ito, K.; Ohguro, H. Comparative assessment of distribution of blackcurrant anthocyanins in rabbit and rat ocular tissues. Exp. Eye Res. 2006, 83, 348–356. [Google Scholar] [CrossRef] [PubMed]
- Ansari, J.A.; Naz, S.; Tarar, O.M.; Siddiqi, R.; Haider, M.S.; Jamil, K. Binding effect of proline-rich-proteins (PRPs) on in vitro antimicrobial activity of the flavonoids. Braz. J. Microbiol. 2015, 46, 183–188. [Google Scholar] [CrossRef] [PubMed][Green Version]
- Burns, M.E.; Baylor, D.A. Activation, deactivation, and adaptation in vertebrate photoreceptor cells. Annu. Rev. Neurosci. 2001, 24, 779–805. [Google Scholar] [CrossRef] [PubMed]
- Emeis, D.; Kuhn, H.; Reichert, J.; Hofmann, K.P. Complex formation between metarhodopsin II and GTP-binding protein in bovine photoreceptor membranes leads to a shift of the photoproduct equilibrium. FEBS Lett. 1982, 143, 29–34. [Google Scholar] [CrossRef]
- Tachibanaki, S.; Imai, H.; Mizukami, T.; Okada, T.; Imamoto, Y.; Matsuda, T.; Fukada, Y.; Terakita, A.; Shichida, Y. Presence of two rhodopsin intermediates responsible for transducin activation. Biochemistry 1997, 36, 14173–14180. [Google Scholar] [CrossRef]
- Virmaux, N.; Bizec, J.C.; Nullans, G.; Ehret, S.; Mandel, P. Modulation of rod cyclic GMP-phosphodiesterase activity by anthocyanidin derivatives. Biochem. Soc. Trans. 1990, 18, 686–687. [Google Scholar] [CrossRef]
- Bastide, P.; Rouher, F.; Tronche, P. Rhodopsin and anthocyanosides. Apropos of various experimental facts. Bull. Des Soc. D’ophtalmologie De Fr.
- Fain, G.L.; Matthews, H.R.; Cornwall, M.C.; Koutalos, Y. Adaptation in vertebrate photoreceptors. Physiol. Rev. 2001, 81, 117–151. [Google Scholar] [CrossRef] [PubMed]
- Thieme, H.; Stumpff, F.; Ottlecz, A.; Percicot, C.L.; Lambrou, G.N.; Wiederholt, M. Mechanisms of action of unoprostone on trabecular meshwork contractility. Investig. Ophthalmol. Vis. Sci. 2001, 42, 3193–3201. [Google Scholar]
- Prasanna, G.; Dibas, A.I.; Yorio, T. Cholinergic and adrenergic modulation of the Ca2+ response to endothelin-1 in human ciliary muscle cells. Investig. Ophthalmol. Vis. Sci. 2000, 41, 1142–1148. [Google Scholar]
- Kamikawatoko, S.; Tokoro, T.; Azuma, H.; Hamasaki, H.; Ishida, A. The effects of endothelin-1 on isolated bovine ciliary muscles. Exp. Eye Res. 1995, 61, 559–564. [Google Scholar] [CrossRef]
- Azuma, H.; Masuda, H.; Sato, J.; Niwa, K.; Tokoro, T. A possible role of endogenous inhibitor for nitric oxide synthesis in the bovine ciliary muscle. Exp. Eye Res. 1997, 64, 823–830. [Google Scholar] [CrossRef]
- Goh, Y.; Hotehama, Y.; Mishima, H.K. Characterization of ciliary muscle relaxation induced by various agents in cats. Investig. Ophthalmol. Vis. Sci. 1995, 36, 1188–1192. [Google Scholar]
- Seeram, N.P.; Momin, R.A.; Nair, M.G.; Bourquin, L.D. Cyclooxygenase inhibitory and antioxidant cyanidin glycosides in cherries and berries. Phytomed. Int. J. Phytother. Phytopharm. 2001, 8, 362–369. [Google Scholar] [CrossRef]
- Berridge, M.J. Smooth muscle cell calcium activation mechanisms. J. Physiol. 2008, 586, 5047–5061. [Google Scholar] [CrossRef]
- Allen, B.G.; Walsh, M.P. The biochemical basis of the regulation of smooth-muscle contraction. Trends Biochem. Sci. 1994, 19, 362–368. [Google Scholar] [CrossRef]
- Walsh, M.P. The Ayerst Award Lecture 1990. Calcium-dependent mechanisms of regulation of smooth muscle contraction. Biochem. Cell Biol. 1991, 69, 771–800. [Google Scholar] [CrossRef]
- Ikebe, M.; Hartshorne, D.J. Phosphorylation of smooth muscle myosin at two distinct sites by myosin light chain kinase. J. Biol. Chem. 1985, 260, 10027–10031. [Google Scholar]
- Ikebe, M.; Hartshorne, D.J.; Elzinga, M. Identification, phosphorylation, and dephosphorylation of a second site for myosin light chain kinase on the 20,000-dalton light chain of smooth muscle myosin. J. Biol. Chem. 1986, 261, 36–39. [Google Scholar]
- Hartshorne, D.J.; Ito, M.; Erdodi, F. Role of protein phosphatase type 1 in contractile functions: Myosin phosphatase. J. Biol. Chem. 2004, 279, 37211–37214. [Google Scholar] [CrossRef]
- Lau, K.S.; Grange, R.W.; Chang, W.J.; Kamm, K.E.; Sarelius, I.; Stull, J.T. Skeletal muscle contractions stimulate cGMP formation and attenuate vascular smooth muscle myosin phosphorylation via nitric oxide. FEBS Lett. 1998, 431, 71–74. [Google Scholar] [CrossRef]
- Nathanson, J.A.; McKee, M. Identification of an extensive system of nitric oxide-producing cells in the ciliary muscle and outflow pathway of the human eye. Investig. Ophthalmol. Vis. Sci. 1995, 36, 1765–1773. [Google Scholar]
- Masuda, H.; Tamaoki, S.; Goto, M.; Ishida, A.; Kamikawatoko, S.; Tokoro, T.; Azuma, H. Nitric oxide-induced ciliary muscle relaxation during contraction with endothelin-1 is mediated through elevation of cyclic GMP. Curr. Eye Res. 1997, 16, 1245–1251. [Google Scholar] [CrossRef]
- Kamikawatoko, S.; Tokoro, T.; Ishida, A.; Masuda, H.; Hamasaki, H.; Sato, J.; Azuma, H. Nitric oxide relaxes bovine ciliary muscle contracted by carbachol through elevation of cyclic GMP. Exp. Eye Res. 1998, 66, 1–7. [Google Scholar] [CrossRef]
- Russell, F.D.; Skepper, J.N.; Davenport, A.P. Detection of endothelin receptors in human coronary artery vascular smooth muscle cells but not endothelial cells by using electron microscope autoradiography. J. Cardiovasc. Pharmacol. 1997, 29, 820–826. [Google Scholar] [CrossRef]
- Mutti, D.O.; Zadnik, K.; Adams, A.J. Myopia. The nature versus nurture debate goes on. Investig. Ophthalmol. Vis. Sci. 1996, 37, 952–957. [Google Scholar]
- Schaeffel, F.; Glasser, A.; Howland, H.C. Accommodation, refractive error and eye growth in chickens. Vis. Res. 1988, 28, 639–657. [Google Scholar] [CrossRef]
- Wildsoet, C.; Wallman, J. Choroidal and scleral mechanisms of compensation for spectacle lenses in chicks. Vis. Res. 1995, 35, 1175–1194. [Google Scholar] [CrossRef]
- Wildsoet, C. Neural pathways subserving negative lens-induced emmetropization in chicks—insights from selective lesions of the optic nerve and ciliary nerve. Curr. Eye Res. 2003, 27, 371–385. [Google Scholar] [CrossRef]
- McFadden, S.A.; Howlett, M.H.; Mertz, J.R.; Wallman, J. Acute effects of dietary retinoic acid on ocular components in the growing chick. Exp. Eye Res. 2006, 83, 949–961. [Google Scholar] [CrossRef]
- Rohrer, B.; Spira, A.W.; Stell, W.K. Apomorphine blocks form-deprivation myopia in chickens by a dopamine D2-receptor mechanism acting in retina or pigmented epithelium. Vis. Neurosci. 1993, 10, 447–453. [Google Scholar] [CrossRef]
- Iida, H.; Nakamura, Y.; Matsumoto, H.; Kawahata, K.; Koga, J.; Katsumi, O. Effect of black currant anthocyanins on elongation of ocular components in chick myopia models: Specific structures of anthocyanins are essential for inhibitory effect of ocular elongation. Investig. Ophthalmol. Vis. Sci. 2011, 52, 6297. [Google Scholar]
- Grandjean, E.; Vigliani, E. Ergonomic Aspect of VDTs; Taylor and Francis Co.: London, UK, 1980. [Google Scholar]
- Institute, J.P. Uchida-Kraepelin Psychological Test Data Book; Kaneko-shobo: Tokyo, Japan, 1990; pp. 104–121. [Google Scholar]
- Kirshner, B.; Guyatt, G. A methodological framework for assessing health indices. J. Chronic Dis. 1985, 38, 27–36. [Google Scholar] [CrossRef]
- Yamaguchi, K.; Horibe, M.; Uozato, H.; Shimizu, K. Change in axial length and anterior chamber depth according to near work. Jpn. Orthopt. J. 2005, 34, 115–119. [Google Scholar] [CrossRef]
- Shields, M.B.; Shields, M.B. Textbook of Glaucoma; Williams & Wilkins Baltimore: Baltimore, MD, USA, 1992. [Google Scholar]
- Anderson, D.R.; Drance, S.M.; Schulzer, M. Natural history of normal-tension glaucoma. Ophthalmology 2001, 108, 247–253. [Google Scholar] [CrossRef]
- Ohguro, I.; Ohguro, H.; Nakazawa, M. Effects of anthocyanins in black currant on retinal blood flow circulation of patients with normal tension glaucoma. A pilot study. Hirosaki Med. J. 2007, 59, 23–32. [Google Scholar]
- Sato, E.A.; Ohtake, Y.; Shinoda, K.; Mashima, Y.; Kimura, I. Decreased blood flow at neuroretinal rim of optic nerve head corresponds with visual field deficit in eyes with normal tension glaucoma. Graefe's Arch. Clin. Exp. Ophthalmol. 2006, 244, 795–801. [Google Scholar] [CrossRef]
- Logan, J.F.; Rankin, S.J.; Jackson, A.J. Retinal blood flow measurements and neuroretinal rim damage in glaucoma. Br. J. Ophthalmol. 2004, 88, 1049–1054. [Google Scholar] [CrossRef][Green Version]
- Yaoeda, K.; Shirakashi, M.; Fukushima, A.; Funaki, S.; Funaki, H.; Abe, H.; Tanabe, N. Relationship between optic nerve head microcirculation and visual field loss in glaucoma. Acta Ophthalmol. Scand. 2003, 81, 253–259. [Google Scholar] [CrossRef]


| Ocular Tissues or Body Fluid | Intraperitoneal Administration in Rat | Intravenously Administration in Rabb | ||
|---|---|---|---|---|
| AC of Tissue (μg/g Tissue) | Distribution Ratio (%) | AC of Tissue (μg/g Tissue) | Distribution Ratio (%) | |
| Aqueous humor | 6.72 | 0.88 | 1.19 ± 0.21 | 10.54 |
| Cornea | 20.62 | 3.67 | 0.55 ± 0.05 | 4.89 |
| Sclera | 245.04 | 89.09 | 3.02 ± 0.09 | 26.73 |
| Choroid | 3.00 ± 0.06 | 26.57 | ||
| Ciliary body | 12.93 | 1.39 | 2.04 ± 0.28 | 18.07 |
| Iris | 1.11 ± 0.08 | 9.81 | ||
| Retina | 6.89 | 4.76 | 0.27 ± 0.02 | 2.41 |
| Vitreous | 0.60 | 0.14 | 0.11 ± 0.02 | 0.98 |
| Lens | 0.36 | 0.06 | 0.00 ± 0.00 | 0.00 |
| Plasma * | 2.30 ± 0.76 | 12.42 ± 1.25 | ||
| Control * | +C3R * | |
|---|---|---|
| k2 (s−1) | 1.0 × 10⁻² | 1.1 × 10⁻² |
| km (M) | 2.6 × 10⁻⁵ | 1.1 × 10⁻⁵ |
| Treatment | Concentration | n | Contraction (%) (Average ± SE) |
|---|---|---|---|
| control | 21 | 54.9 ± 3.3 a | |
| D3R | 10 mM | 21 | 42.2 ± 3.2 |
| D3R + NOARG | 10 mM + 10 mM | 12 | 63.7 ± 7.1 a |
| D3R + NOARG+l-Arg | 10 mM + 10 mM + 10 mM | 12 | 42.7 ± 4.2 |
| Carboxy-PTIO | 30 mM | 10 | 54.4 ± 2.1 |
| D3R + Carboxy-PTIO | 10 mM + 30 mM | 10 | 55.2 ± 3.2 a |
| ODQ | 10 mM | 11 | 56.1 ± 5.4 |
| D3R + ODQ | 10 mM + 10 mM | 11 | 58.5 ± 5.5 a |
| BQ788 | 10 μM | 12 | 81.0 ± 8.2 |
| D3R + BQ788 | 10 mM + 10 μM | 12 | 73.4 ± 9.6 a |
| propranolol | 10 mM | 9 | 61.3 ± 3.6 |
| D3R + propranolol | 10 mM + 10 mM | 8 | 48.7 ± 3.4 b |
| iberiotoxin | 10 μM | 12 | 64.6 ± 3.0 |
| D3R + iberiotoxin | 10 mM + 10 μM | 12 | 45.7 ± 4.8 c |
| indomethacin | 10 mM | 12 | 70.3 ± 5.3 |
| D3R + indomethacin | 10 mM + 10 mM | 12 | 52.4 ± 5.2 d |
| Treatment | Concentration | Contraction (%) (Average ± SE) | Phosphorylated-Ratio (%) (Average ± SE) |
|---|---|---|---|
| control | 54.9 ± 3.3 a | 47.2 ± 13.1 a | |
| D3R | 10 mM | 42.2 ± 3.2 | 36.0 ± 13.6 |
| D3R + NOARG | 10 mM + 10 mM | 63.7 ± 7.1 a | 50.1 ± 4.2 a |
| D3R + NOARG + l-Arg | 10 mM + 10 mM+ 10 mM | 42.7 ± 4.2 b | 38.2 ± 3.7 c |
| Dose of BCA | Dark Adaptation Value, Mean ± SD of Log Asb; (p value) (1) | |||
|---|---|---|---|---|
| mg/subject | Before Intake | After Intake | Change | p value (2) |
| 0 (placebo) | 2.056 ± 0.209 (1.000) | 2.018 ± 0.218 (1.000) | −0.038 ± 0.106 (1.000) | 0.244 |
| 12.5 | 2.026 ± 0.147 (0.457) | 2.004 ± 0.195 (0.457) | −0.023 ± 0.138 (0.733) | 0.583 |
| 25 | 2.016 ± 0.170 (0.234) | 1.980 ± 0.197 (0.264) | −0.037 ± 0.112 (0.983) | 0.28 |
| 50 | 2.038 ± 0.186 (0.686) | 1.923 ± 0.167 (0.014) | −0.115 ± 0.131 (0.171) | 0.011 |
| Item & Statement | BCA | Placebo | ||||
|---|---|---|---|---|---|---|
| Before | After 2 | Change 2 | Before | After 2 | Change 2 | |
| Refraction values | −0.432 ± 0.602 | −0.402 ± 0.643 a | −0.030 ± 0.252 (a),c | −0.384 ± 0.536 | −0.503 ± 0.579 b | 0.119 ± 0.278 (b), (c) |
| Flicker value, Hz | 34.95 ± 3.16 | 34.39 ± 3.51 | 0.56 ± 1.15 | 34.72 ± 2.99 | 34.13 ± 2.90 | 0.59 ± 1.22 |
| Asthenopia symptoms (VAS mm) | ||||||
| head & neck | 12.70 ± 13.45 | 40.08 ± 24.86 | 27.38 ± 18.39 | 8.34 ± 11.87 | 44.09 ± 26.09 | 35.75 ± 24.96 |
| arm | 10.21 ± 17.82 | 36.15 ± 25.86 | 25.94 ± 29.61 | 4.32 ± 6.27 | 41.76 ± 29.33 | 37.44 ± 28.43 |
| eye | 14.72 ± 15.55 | 47.31 ± 24.72 | 32.59 ± 18.94 (a) | 14.59 ± 17.98 | 56.72 ± 25.24 | 42.14 ± 19.52 (b) |
| shoulder | 15.12 ± 15.65 | 49.66 ± 27.97 | 34.54 ± 25.75 | 10.95 ± 17.42 | 54.31 ± 29.31 | 43.36 ± 30.91 |
| low back | 10.63 ±15.92 | 29.79 ± 27.15 a | 19.16 ± 22.74 (a) | 7.35 ± 9.25 | 42.83 ± 33.55 b | 35.48 ± 30.87 (b) |
| Treatment | Before (Average ± SE) | After 6 Month (Average ± SE) |
|---|---|---|
| Sup. temp. rim (RE) | 507.7 ± 174.3 | 638.6 a ± 191.2 |
| Inf. temp. rim (RE) | 393.6 ± 138.0 | 582.2 b ± 177.8 |
| Sup. temp. retina (RE) | 457.6 ± 140.6 | 595.1 b ± 171.5 |
| Inf. Temp. retina (RE) | 377.0 ± 80.5 | 519.1 b ± 130.0 |
| Sup. temp. rim (LE) | 442.4 ± 214.3 | 662.4 b ± 185.3 |
| Inf. temp. rim (LE) | 466.5 ± 216.3 | 653.7 b ± 260.9 |
| Sup. temp. retina (LE) | 375.0 ± 75.9 | 442.2 b ± 80.1 |
| inf. temp. rim (LE) | 444.9 ± 100.9 | 546.9 a ± 185.8 |
© 2019 by the authors. Licensee MDPI, Basel, Switzerland. This article is an open access article distributed under the terms and conditions of the Creative Commons Attribution (CC BY) license (http://creativecommons.org/licenses/by/4.0/).
Share and Cite
Nomi, Y.; Iwasaki-Kurashige, K.; Matsumoto, H. Therapeutic Effects of Anthocyanins for Vision and Eye Health. Molecules 2019, 24, 3311. https://doi.org/10.3390/molecules24183311
Nomi Y, Iwasaki-Kurashige K, Matsumoto H. Therapeutic Effects of Anthocyanins for Vision and Eye Health. Molecules. 2019; 24(18):3311. https://doi.org/10.3390/molecules24183311
Chicago/Turabian StyleNomi, Yuri, Keiko Iwasaki-Kurashige, and Hitoshi Matsumoto. 2019. "Therapeutic Effects of Anthocyanins for Vision and Eye Health" Molecules 24, no. 18: 3311. https://doi.org/10.3390/molecules24183311
APA StyleNomi, Y., Iwasaki-Kurashige, K., & Matsumoto, H. (2019). Therapeutic Effects of Anthocyanins for Vision and Eye Health. Molecules, 24(18), 3311. https://doi.org/10.3390/molecules24183311