Article

Effects of Complex DNA and MVs with GTF Extracted from Streptococcus mutans on the Oral Biofilm

Department of Bacteriology I, National Institute of Infectious Diseases, Shinjuku-ku, Tokyo 162-8640, Japan
*
Author to whom correspondence should be addressed.
Molecules 2019, 24(17), 3131; https://doi.org/10.3390/molecules24173131
Submission received: 12 June 2019 / Revised: 7 August 2019 / Accepted: 27 August 2019 / Published: 28 August 2019
(This article belongs to the Section Bioorganic Chemistry)

Abstract

:
Streptococcus mutans is one of the principal pathogens for the development of dental caries. Oral biofilms formed by S. mutans are constructed of insoluble glucan formation induced by the principal enzymes, GTF-I and GTF-SI, in sucrose-containing conditions. However, as another means of biofilm formation, extracellular DNA (eDNA) and membrane vesicles (MVs) are also contributors. To explore the roles of eDNA and MVs for biofilm formation, short and whole size pure DNAs, two types of sub-purified DNAs and MVs were extracted from S. mutans by beads destruction, treatment of proteinase K, and ultracentrifugation of culture supernatant, and applied into the biofilm formation assay using the S. mutans UA159 gtfBC mutant, which lost GTF-I and GTF-SI, on a human saliva-coated 96 well microtiter plate in sucrose-containing conditions. Sub-purified DNAs after cell lysis by beads destruction for total 90 and 180 s showed a complex form of short-size DNA with various proteins and MVs associated with GTF-I and GTF-SI, and induced significantly higher biofilm formation of the S. mutans UA159.gtfBC mutant than no sample (p < 0.05). Short-size pure DNA without proteins induced biofilm formation but whole-size pure DNA did not. Moreover, the complex form of MV associated with GTFs and short-size DNA showed significantly higher biofilm formation of initial colonizers on the human tooth surface such as Streptococcus mitis than no sample (p < 0.05). The short-size DNAs associated with MVs and GTFs are important contributors to the biofilm formation and may be one of additional targets for the prevention of oral biofilm-associated diseases.

1. Introduction

The formation of oral biofilms is the most important physical biological activity of oral bacteria and provides survival conditions for bacteria in the oral cavity when the physical removal of the bacteria is attempted by oral brushing and rinsing [1,2,3]. More than 700 species of oral microorganisms have been detected in the oral cavity, and some colonizers attach to the tooth surface, interact with each other, aggregate, and form complex bacteria biofilms [4,5,6]. In oral biofilm bacteria, Streptococcus mutans is a type of bacteria that attaches to the tooth surface and is one of the principal pathogens for the development of dental caries [7,8]. S. mutans has been shown to produce acids, exhibit a high degree of acid tolerance, produce bacteriocins, possess high-affinity systems for the assimilation of many carbohydrate sources such as glucan and fructan, and form sticky biofilms [9].
Water-insoluble glucan synthesized using GtfB (GTF-I)- and GtfC (GTF-SI)-glucosyltransferases, which are encoded by gtfB and gtfC, promote adhesion to tooth surfaces, aggregation of bacterial cells within the biofilm, and mature biofilm formation with complex bacteria in conditions supplemented with sucrose [10]. Surface-associated glucan-binding proteins (Gbps; GbpA, GbpB, GbpC, and GbpD) also mediate aggregation and biofilm formation by their affinity for glucan, thereby promoting plaque formation that contributes to the cariogenicity of S. mutans [11,12]. Furthermore, many other factors that may be responsible for biofilm formation have been reported: Aggregation by salivary agglutinins [13], extracellular DNA (eDNA) as the biofilm matrix [14,15], and dead cells [16]. Cell lysis provides bacterial adherence, aggregation, accumulation, and increasing biofilm biomass through the release of eDNA into the extracellular matrix [17,18]. Cell lysis is a vital process in releasing membrane vesicles (MVs) in gram-positive bacteria. MVs deliver virulence factors to host cells and induce immune responses and facilitate biofilm formation [19,20,21]. Bacillus subtilis, Streptococcus pneumoniae, S. mutans, and Staphylococcus aureus MVs contain several virulence factors, such as GTF-I and GTF-SI, GbpC, toxins, and peptidoglycan [19,22,23].
The insoluble glucan-independent biofilm of S. mutans was formed by increasing eDNA in primarily low pH conditions [24]. The degradation of eDNA by the addition of DNase I results in a significant decrease in biofilm formation [19,24]. eDNA is environmentally obtained from plaque in the oral cavity that is taken without targeting a particular species. Among eDNA, genomic DNA released from dead cells has important functions as an attachment factor for surfaces and an adhesive factor among biofilm bacteria during the initial stage of biofilm formation [15,25]. Recently, we reported that the presence of raffinose and small amounts of sucrose induced fructan synthesis by fructosyltransferase and aggregated eDNA into the biofilm in S. mutans [26]. Raffinose and a small amount of sucrose have cooperative effects, and this induction of biofilm formation depends on supportive elements, which mainly consist of eDNA and fructan.
To clarify the roles of eDNA, four types of DNA (short and whole sizes pure DNA, and two types of sub-purified DNAs) and MVs were extracted from S. mutans and applied into the biofilm formation assay using the S. mutans UA159 gtfBC mutant, which lost GTF-I and GTF-SI in sucrose-containing conditions. Sub-purified short size DNA associated with various proteins and MVs significantly induced GTF-dependent biofilm formation, but pure whole size DNA without proteins did not. In contrast, short-size pure DNA induced significant GTF-independent biofilm formation in S. mutans UA159 gtfBC mutant. This study suggests that short size DNAs associated with MVs and GTF are important for the formation of biofilms by pathogenic factors and may be one of the additional targets for the prevention of oral biofilm-associated diseases.

2. Materials and Methods

2.1. Bacterial Strains and Culture Conditions

Twenty eight strains in 17 bacterial species and two fungus species were used for experiments. S. mutans UA159, S. mutans UA159 gtfBC mutant (UA159.gtfBC) [27], GS-5, MT8148, Streptococcus sanguinis ATCC10556, ST205, ST134, Streptococcus gordonii ATCC 10558, Streptococcus mitis ATCC 6249, ATCC 903, Streptococcus oralis ATCC 35037, Streptococcus anginosus ATCC 33397, Streptococcus intermedius ATCC 27335, Streptococcus pyogenes K32, K33, Streptococcus pneumoniae GTC 261, Streptococcus salivarius JCM5907, ATCC 9759, HT9R, Actinomyces naeslundii X600, Actinomyces oris MG1, Neisseria flavescens ATCC 13120, Neisseria cinerea 23-1, Neisseria mucosa 16-2, and Neisseria subflava #2 were maintained and grown in brain heart infusion (BHI) broth (Becton/Dickinson, Sparks, MD) at 37 °C in a 5% CO2 aerobic atmosphere (Gas pack: Mitsubishi Gas Chemical Co., Inc. Tokyo, Japan). Candida albicans SC5314, SC5312, Staphylococcus aureus Cowan I and ATCC 6538P were maintained and grown in BHI at 37 °C in an aerobic atmosphere. Tryptic soy broth without dextrose (TSB), Todd-Hewitt broth (THB), and BHI (Becton/Dickinson) with 0.25% glucose or 0.25% sucrose were used for biofilm formation, growth curves, aggregation assays, and observation of cell viability.

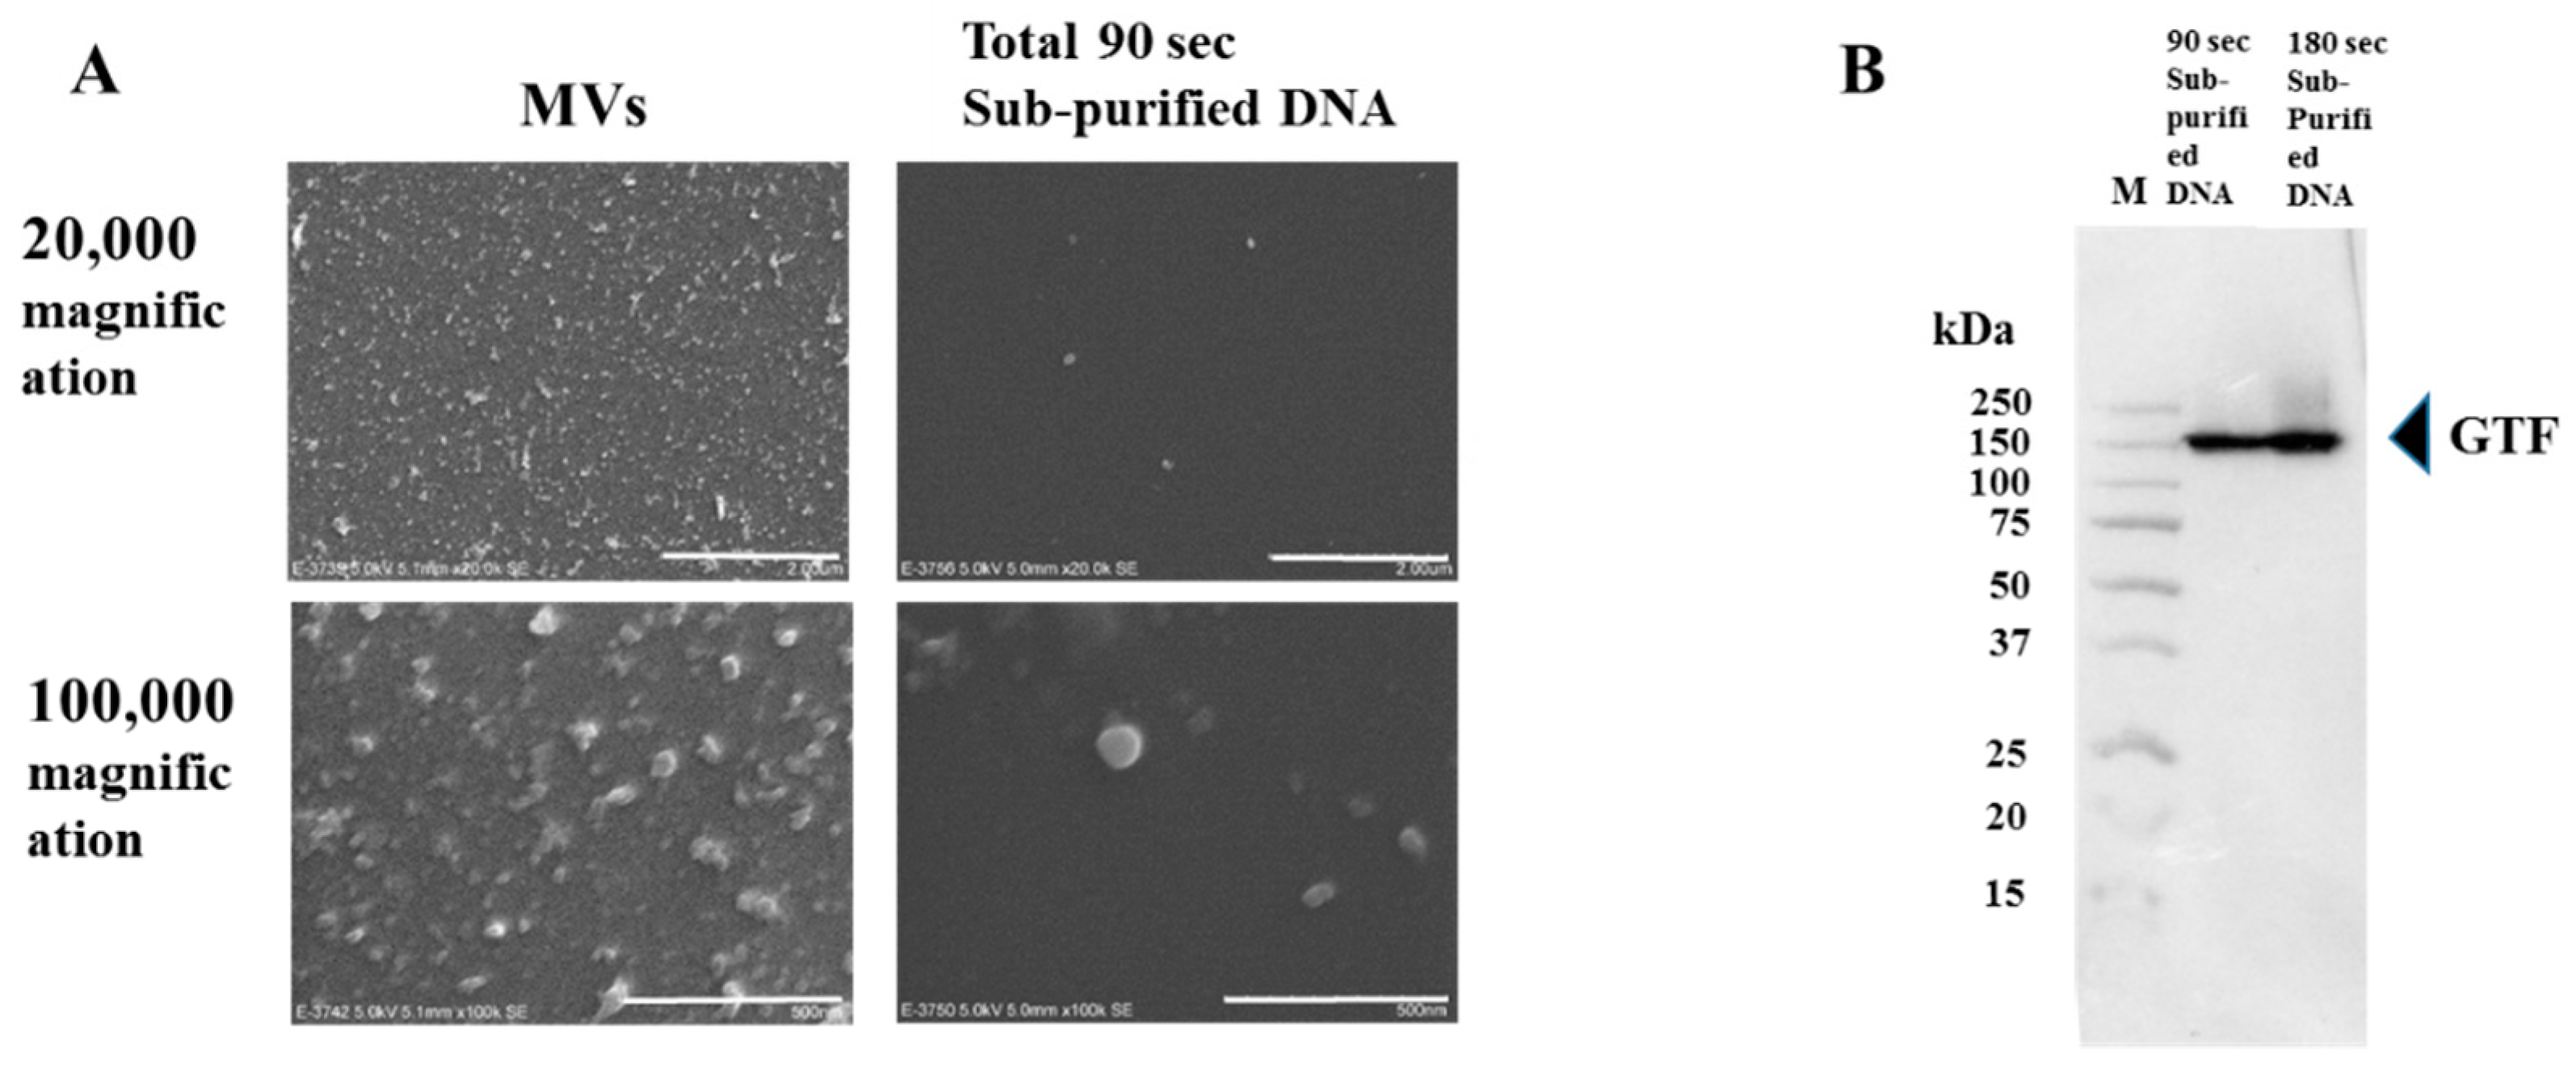
2.2. Extraction of Four Types of DNA

Four types of DNA (whole-size and short-size pure DNAs, and sub-purified DNAs after a total 90 and 180 s beads destruction) were extracted from S. mutans UA159 cultured in an aerobic atmosphere containing 5% CO2 (Gas Pack, Mitsubishi Gas Chemical Company) and BHI at 37 °C. For extraction of whole-size pure DNA, the cells were harvested by centrifugation at 6000× g after an overnight culture in 500 mL of BHI. The pellets were frozen overnight, and the next day, the pellets were suspended in lysozyme solution (2 mg/mL of lysozyme, 50 mM of glucose, 10 mM of cyclohexane diamine tetra acetate, and 25 mM of Tris-HCl, pH 8.0), incubated for 1 h and treated with proteinase K for 1 h at 37 °C. The full-size DNA was purified by a spin column in the DNeasy® Blood and Tissue Kit (Qiagen, Venlo, Netherlands). As samples for sub-purified DNAs, the first (90 s destruction) and second types (180 s destruction) of subpurified DNA were extracted from whole cells harvested by centrifugation at 6000× g after an overnight culture in 500 mL of BHI. The pellets were frozen overnight, and the next day, they were suspended in lysozyme solution. The suspension was incubated at 37 °C for 1 h, and these samples were transferred to a 2-mL tube containing 0.5 g of 0.1-mm diameter glass beads. The suspension was shaken on a TissueLyser (Qiagen) for a total of 90 s (one set: 30 s of bead beating + 60 s cooling interval at 4 °C × three times) or 180 s (one set: 60 s of bead beating + 60 s cooling interval at 4 °C × three times) to homogenize the cells. These destroyed cells were centrifugally separated into solution samples and cell debris. The supernatants were collected for partial purification of the DNA. The subpurified DNA was precipitated with 70% (v/v) ethanol. The samples were washed with 70% (v/v) ethanol three times and used as DNA with proteins in subpurified DNA samples divided for a total of 90 s and a total of 180 s destruction. For the fourth type (short-size pure DNA) of DNA, we prepared DNA samples where we removed the proteins by phenol-chloroform extraction from the subpurified DNA (DNA associated with protein). Equal amounts of phenol:chloroform:isoamyl alcohol (25:24:1) were added to the subpurified DNA solution from the cells that were destroyed for 180 s. After centrifugation (4 °C, 14,000× g, 5 min), the aqueous phase was transferred into a 1.5 mL eppendorf tube. These procedures were repeated two times. After that, the DNA in the aqueous solution was precipitated with 70% (v/v) ethanol. The sample was washed with 70% (v/v) ethanol three times. To completely remove the proteins from subpurified DNA treated with phenol-chloroform, the subpurified DNA was treated with proteinase K for 1 h at 37 °C, precipitated, and washed with 70% (v/v) ethanol. Subpurified DNA treated with phenol-chloroform and proteinase K was extracted as short-size pure DNA and compared with whole-size pure DNA and two types of DNA with proteins in subpurified DNAs. Concentrations of DNA samples were measured by the NanoDrop Lite spectrophotometer. DNA in subpurified DNAs was visually analyzed to observe binding of MVs by a scanning electron microscope.

2.3. Extraction of MVs

S. mutans strains were cultured in 900 mL of BHI medium at 37 °C for 24 h. Preparation of MVs was performed as described previously with some modifications [28]. Culture supernatants were separated by centrifugation (6000× g, 20 min) and categorized as >10 kDa or >50 kDa. MVs (>10 kDa or >50 kDa) in supernatants were concentrated by centrifugal filters (Amicon Ultra 4, Merck kGaA, Darmstadt, Germany or VIVASPIN 20, Sartorius, Stone House, United Kingdom). Briefly, the concentrated MVs were filtered through polyvinylidene difluoride (PVDF) filter membranes (Merck kGaA) with pore sizes of 0.45 µm and 0.22 μm. The MV samples were ultracentrifuged (150,000× g, 2 h), and pellets were suspended as the first sample with sterile phosphate buffered saline (PBS; pH 7.2). In contrast, after ultracentrifugation, the supernatant was used as a culture supernatant sample without MVs. MVs were visually observed with a scanning electron microscope (Regulus 8220, Hitachi High-Technologies, Tokyo, Japan). The protein concentration of MV samples was determined using the Bio-Rad Protein Assay Kit (Bio-Rad Laboratories, Inc., Hercules, CA, USA). The double-stranded DNA (dsDNA) and RNA concentrations of MVs were measured by absorptiometry using a NanoDrop Lite spectrophotometer (Thermo Fisher Scientific, Waltham, MA, USA).

2.4. Human Saliva Collection

Whole saliva samples were collected from three healthy human volunteers (25–55 years old) after stimulation by chewing paraffin gum and pooled into ice-chilled sterile bottles over a period of 5 min. The samples were clarified by centrifugation at 10,000× g for 10 min at 4 °C, sterilized using 0.22 µm and 0.45 µm Millex-GP Filter Unit (Merck kGaA), and coated onto wells in 96-well polystyrene microtiter plates (Sumitomo Bakelite, Tokyo, Japan) for biofilm formation assays. This study was approved by the ethics committee of National Institute of Infectious Diseases for usage human saliva in coating plate (IRB approval number: 801). Prior to enrolment, written informed consent was obtained from each subject based on the code of ethics of the World Medical Association (declaration of Helsinki).

2.5. Biofilm Formation

Biofilms from each strain were developed in 96-well polystyrene microtiter plates (Sumitomo Bakelite), which were previously coated with human saliva. Biofilm formation assays were performed using a previous procedure at 4 °C overnight [29]. Overnight cultures of S. mutans UA159.gtfBC and various bacteria in BHI medium were inoculated at a ratio of 1:100 in 200 µL of TSB with 0.25% sucrose with and without various concentrations of eDNA, MVs, and culture supernatants, from UA159. The plates were incubated at 37 °C in 5% CO2 aerobic conditions for 16 h. In the biofilm formation using DNA, S. mutans UA159.gtfBC was inoculated at a ratio of 1:100 in 200 µL of TSB, THB, and BHI with 0.25% glucose or 0.25% sucrose with and without various concentrations of various types of DNA from UA159. After incubation, the planktonic cells were removed by washing with distilled water, and the adherent cells were stained as a biofilm formation level with 0.25% safranin for 15 min. After washing with distilled water two times, safranin was extracted from biofilm with 70% (v/v) ethanol. Biofilms were quantified by measuring the absorbance of the stained biofilms at 492 nm.

2.6. SDS-PAGE and Native-PAGE

Prior to electrophoretic analysis, MVs and the culture supernatants were diluted with an equal volume of native-PAGE or SDS-PAGE buffer (0.06 M of Tris-HCl (Amersham Pharmacia Biotech, Buckinghamshire, UK), pH 6.8, 20% glycerol (Wako Pure Chemical Industries Ltd., Osaka, Japan), 0% or 1% (wt/vol) SDS (Wako), 0% or 1% 2-mercaptoethanol (2-ME, Merck kGaA), and 0.0012% bromophenol blue (Wako)). The SDS-PAGE samples were heated at 100 °C for 5 min just prior to loading on the gel. The native-PAGE or SDS-PAGE samples were then ran on a 12.5% polyacrylamide gel (e-PAGEL, ATTO Corp., Tokyo, Japan) in 0.025 M of Tris-HCl, 192 mM of glycine (Wako) and 0% or 0.1% (wt/vol) SDS. Electrophoretic separation of the proteins was carried out for 70 min at 25 mA. Gels were stained with Coomassie Brilliant Blue (CBB) and ethidium bromide to observe the proteins and DNA, respectively.

2.7. Western Blotting

DNA with proteins were lysed by adding an equal volume of 1 × SDS sample buffer (2% SDS, 50 mM Tris-HCl (pH 6.8), 10% glycerol, 2.5% 2-ME, and 0.1% bromophenol blue) and boiling for 5 min at 95 °C. Equal amounts of each protein sample were then separated by 12.5% acrylamide SDS-PAGE. Subsequently, proteins were transferred onto Immobilon PVDF membranes (Millipore, Bedford, MA) and blocked with 2.5% skim milk in TBST (50 mM Tris, 2.7 mM KCl, 0.138 M NaCl, 0.05% Tween 20, pH 7.6) for 1 h at room temperature. The membranes were probed with anti-GTF antisera [30] from rabbit diluted overnight at 4 °C or with a control non-immunized antibody (Wako) diluted 1:15,000 in 1.25% skim milk/TBST for 1 h at room temperature. HRP-labeled anti-goat secondary antibody (Merck kGaA) was used to detect the antibodies. Optical emission signals on the proteins were produced by enhanced chemiluminescence (ECL Western Blotting Substrate, Thermo Scientific, Southfield, MI, USA) and detected by different time exposures to X-ray film (FUJI FILM, Kanagawa, Japan).

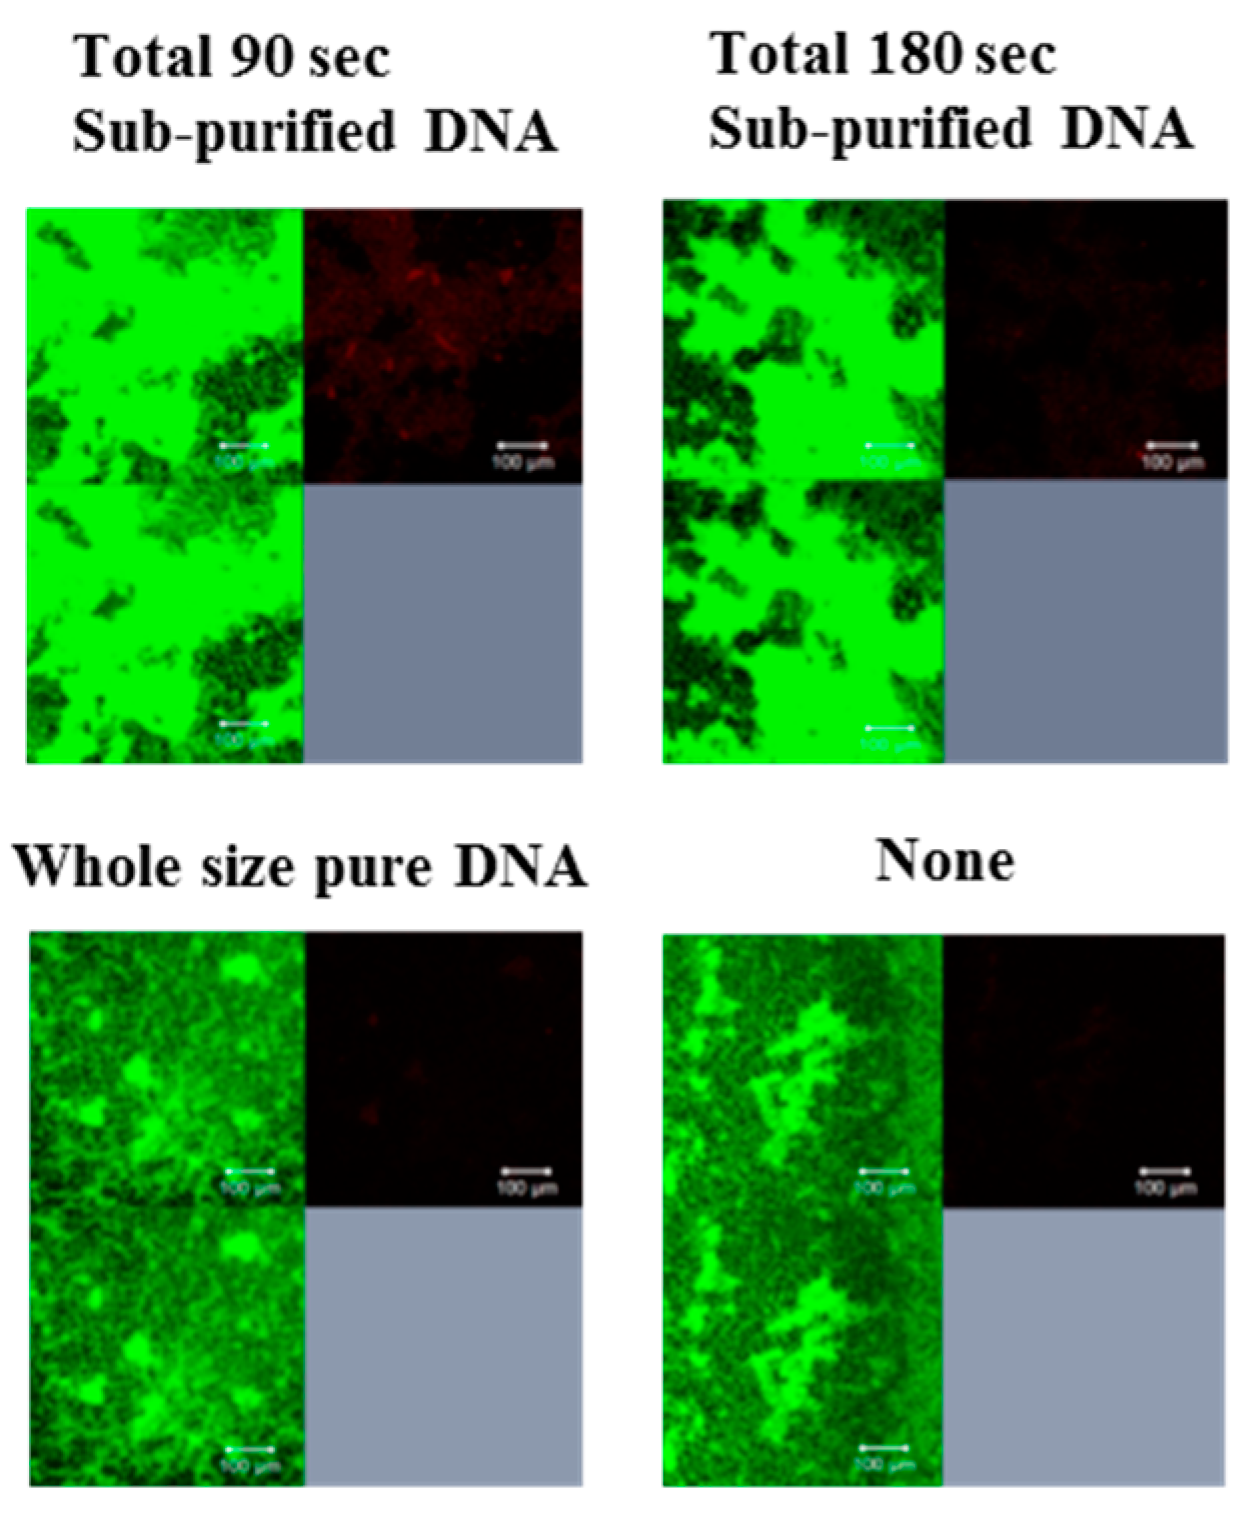
2.8. Observation of Live/Dead Cells and Glucan in Biofilm Formation

The biofilm was stained by the FilmTracer Live/Dead Biofilm Viability Kit (Molecular Probes, Inc., Eugene, OR, USA) where SYTO 9 and propidium iodide were added to the biofilms at final concentrations of 5 µM and 30 µM, respectively. The polysaccharides were labeled with Alexa Fluor 647-dextran conjugate (Molecular Probes, Invitrogen Corp., Carlsbad, CA, USA) [31] for red fluorescence, while the nucleic acids in the bacterial cells were labeled with SYTO 9 to produce green fluorescence.
Biofilms were incubated with the dyes at room temperature for 20–40 min before being imaged by a confocal microscope, LSM700 Meta NLO CLSM (Carl Zeiss Inc., Thornwood, NY, USA). Confocal images for the biofilm formation were visually observed by ZEN (Carl Zeiss) analysis software.

2.9. Statistical Analyses

The biofilm formation levels were expressed as the mean ± standard deviation. In the biofilm assay, the statistical significance of differences between the bacteria with and without various concentrations of MVs or eDNA were determined using one-way analysis of variance (ANOVA) and Bonferroni correction (IBM SPSS statistics 24, IBM corporation, Armonk, NY, USA). p-values less than 0.05 were considered statistically significant. All experiments were repeated independently three times.

3. Results

3.1. Effects of Various Types of DNA on Biofilm Formation

Short DNA fragments are associated with MVs and may support biofilm formation by MVs. To confirm the role of short DNA fragments in biofilm formation, whole-size pure and short-size pure DNAs were extracted from S. mutans UA159. Furthermore, subpurified DNA samples were also extracted as DNA with proteins. At first, we observed DNA and proteins by SDS-PAGE with ethidium bromide and CBB staining in pure DNAs and two types of subpurified DNAs. In the SDS-PAGE and CBB staining, various protein bands were observed in subpurified DNA samples after cell lysis by bead destruction for total 90 and 180 s but not in whole-size pure DNA and subpurified DNA (short-size pure DNA) treated with phenol-chloroform and proteinase K (Figure 1A, center). There were fewer protein bands in subpurified DNA treated with phenol and chloroform than the subpurified DNA without treatments.
In SDS-PAGE and ethidium bromide staining, various short DNA fragments between the 17 kDa and 22 kDa protein markers were observed in all subpurified DNA samples (Figure 1A left). In contrast, the whole-size DNA was observed as a pure DNA. In electrophoresis using an agarose gel and ethidium bromide staining, large and small DNA fragments were observed in whole-size pure DNA and the four subpurified DNA samples, respectively (Figure 1A right). Therefore, sub-purified DNA after beads destruction for total 90 and 180 s indicated short-size fragments with different-size proteins, and subpurified DNA for 180 s treated with phenol and chloroform and proteinase K indicated short-size pure DNA without proteins.

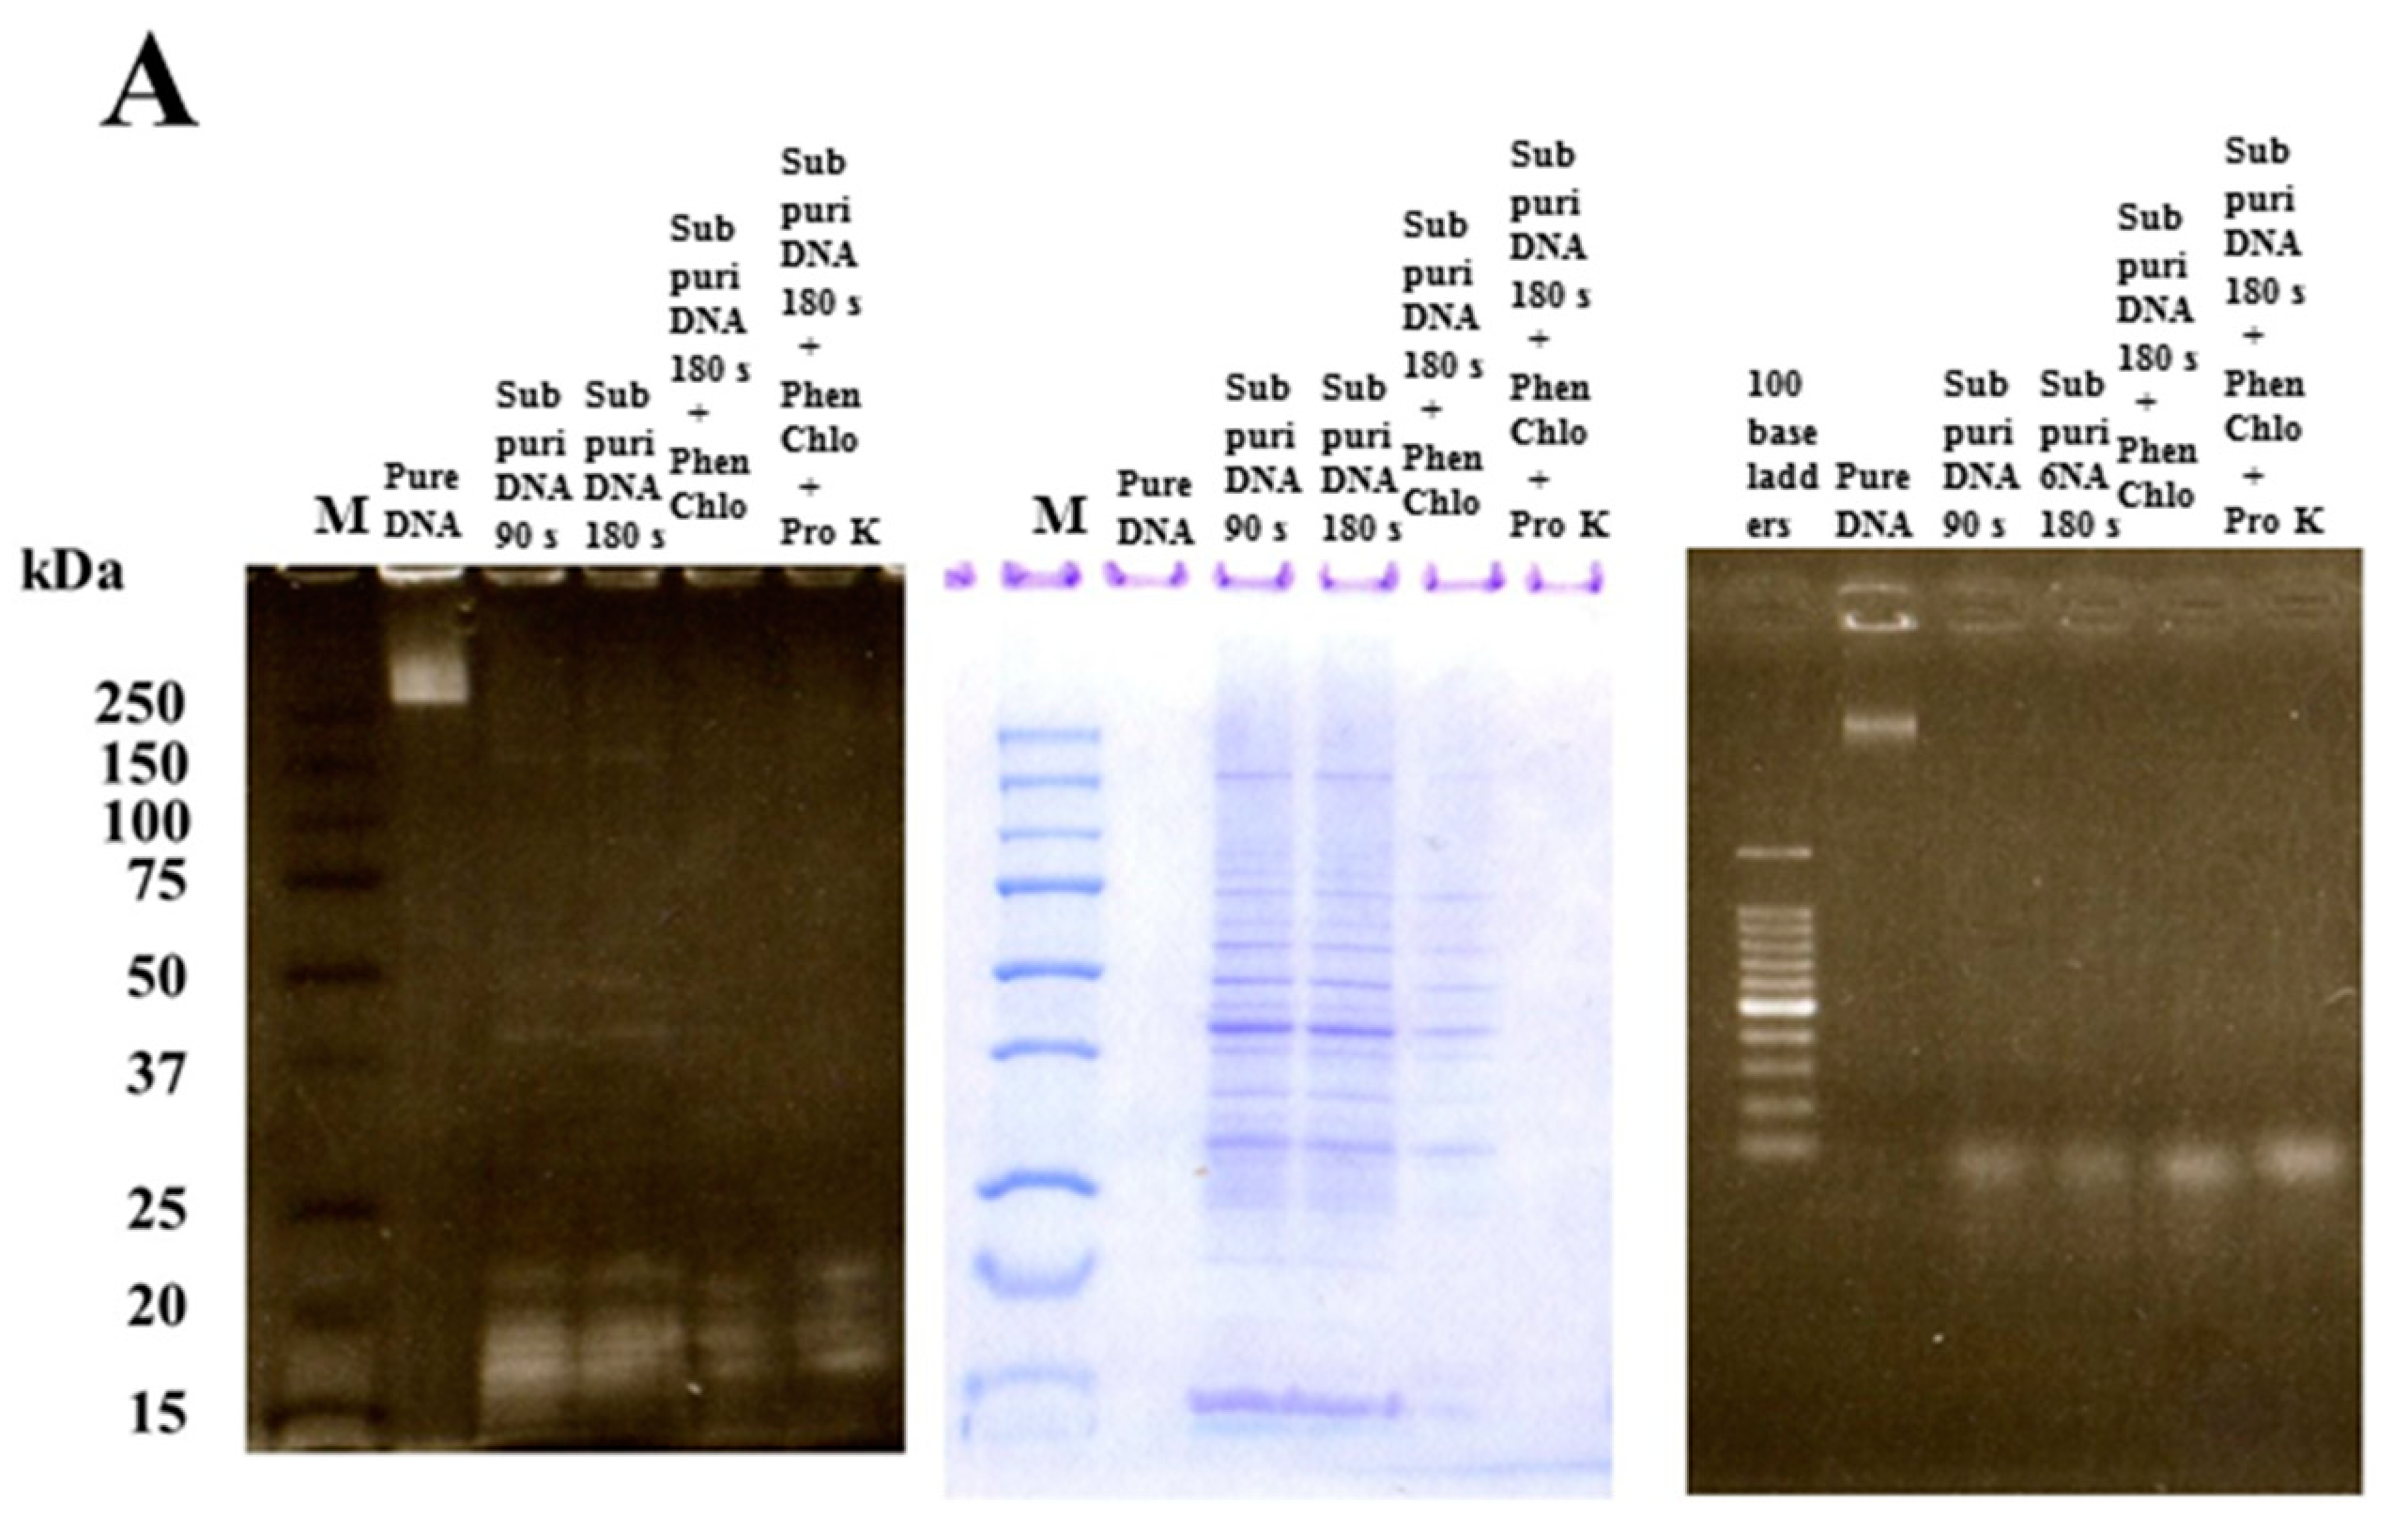
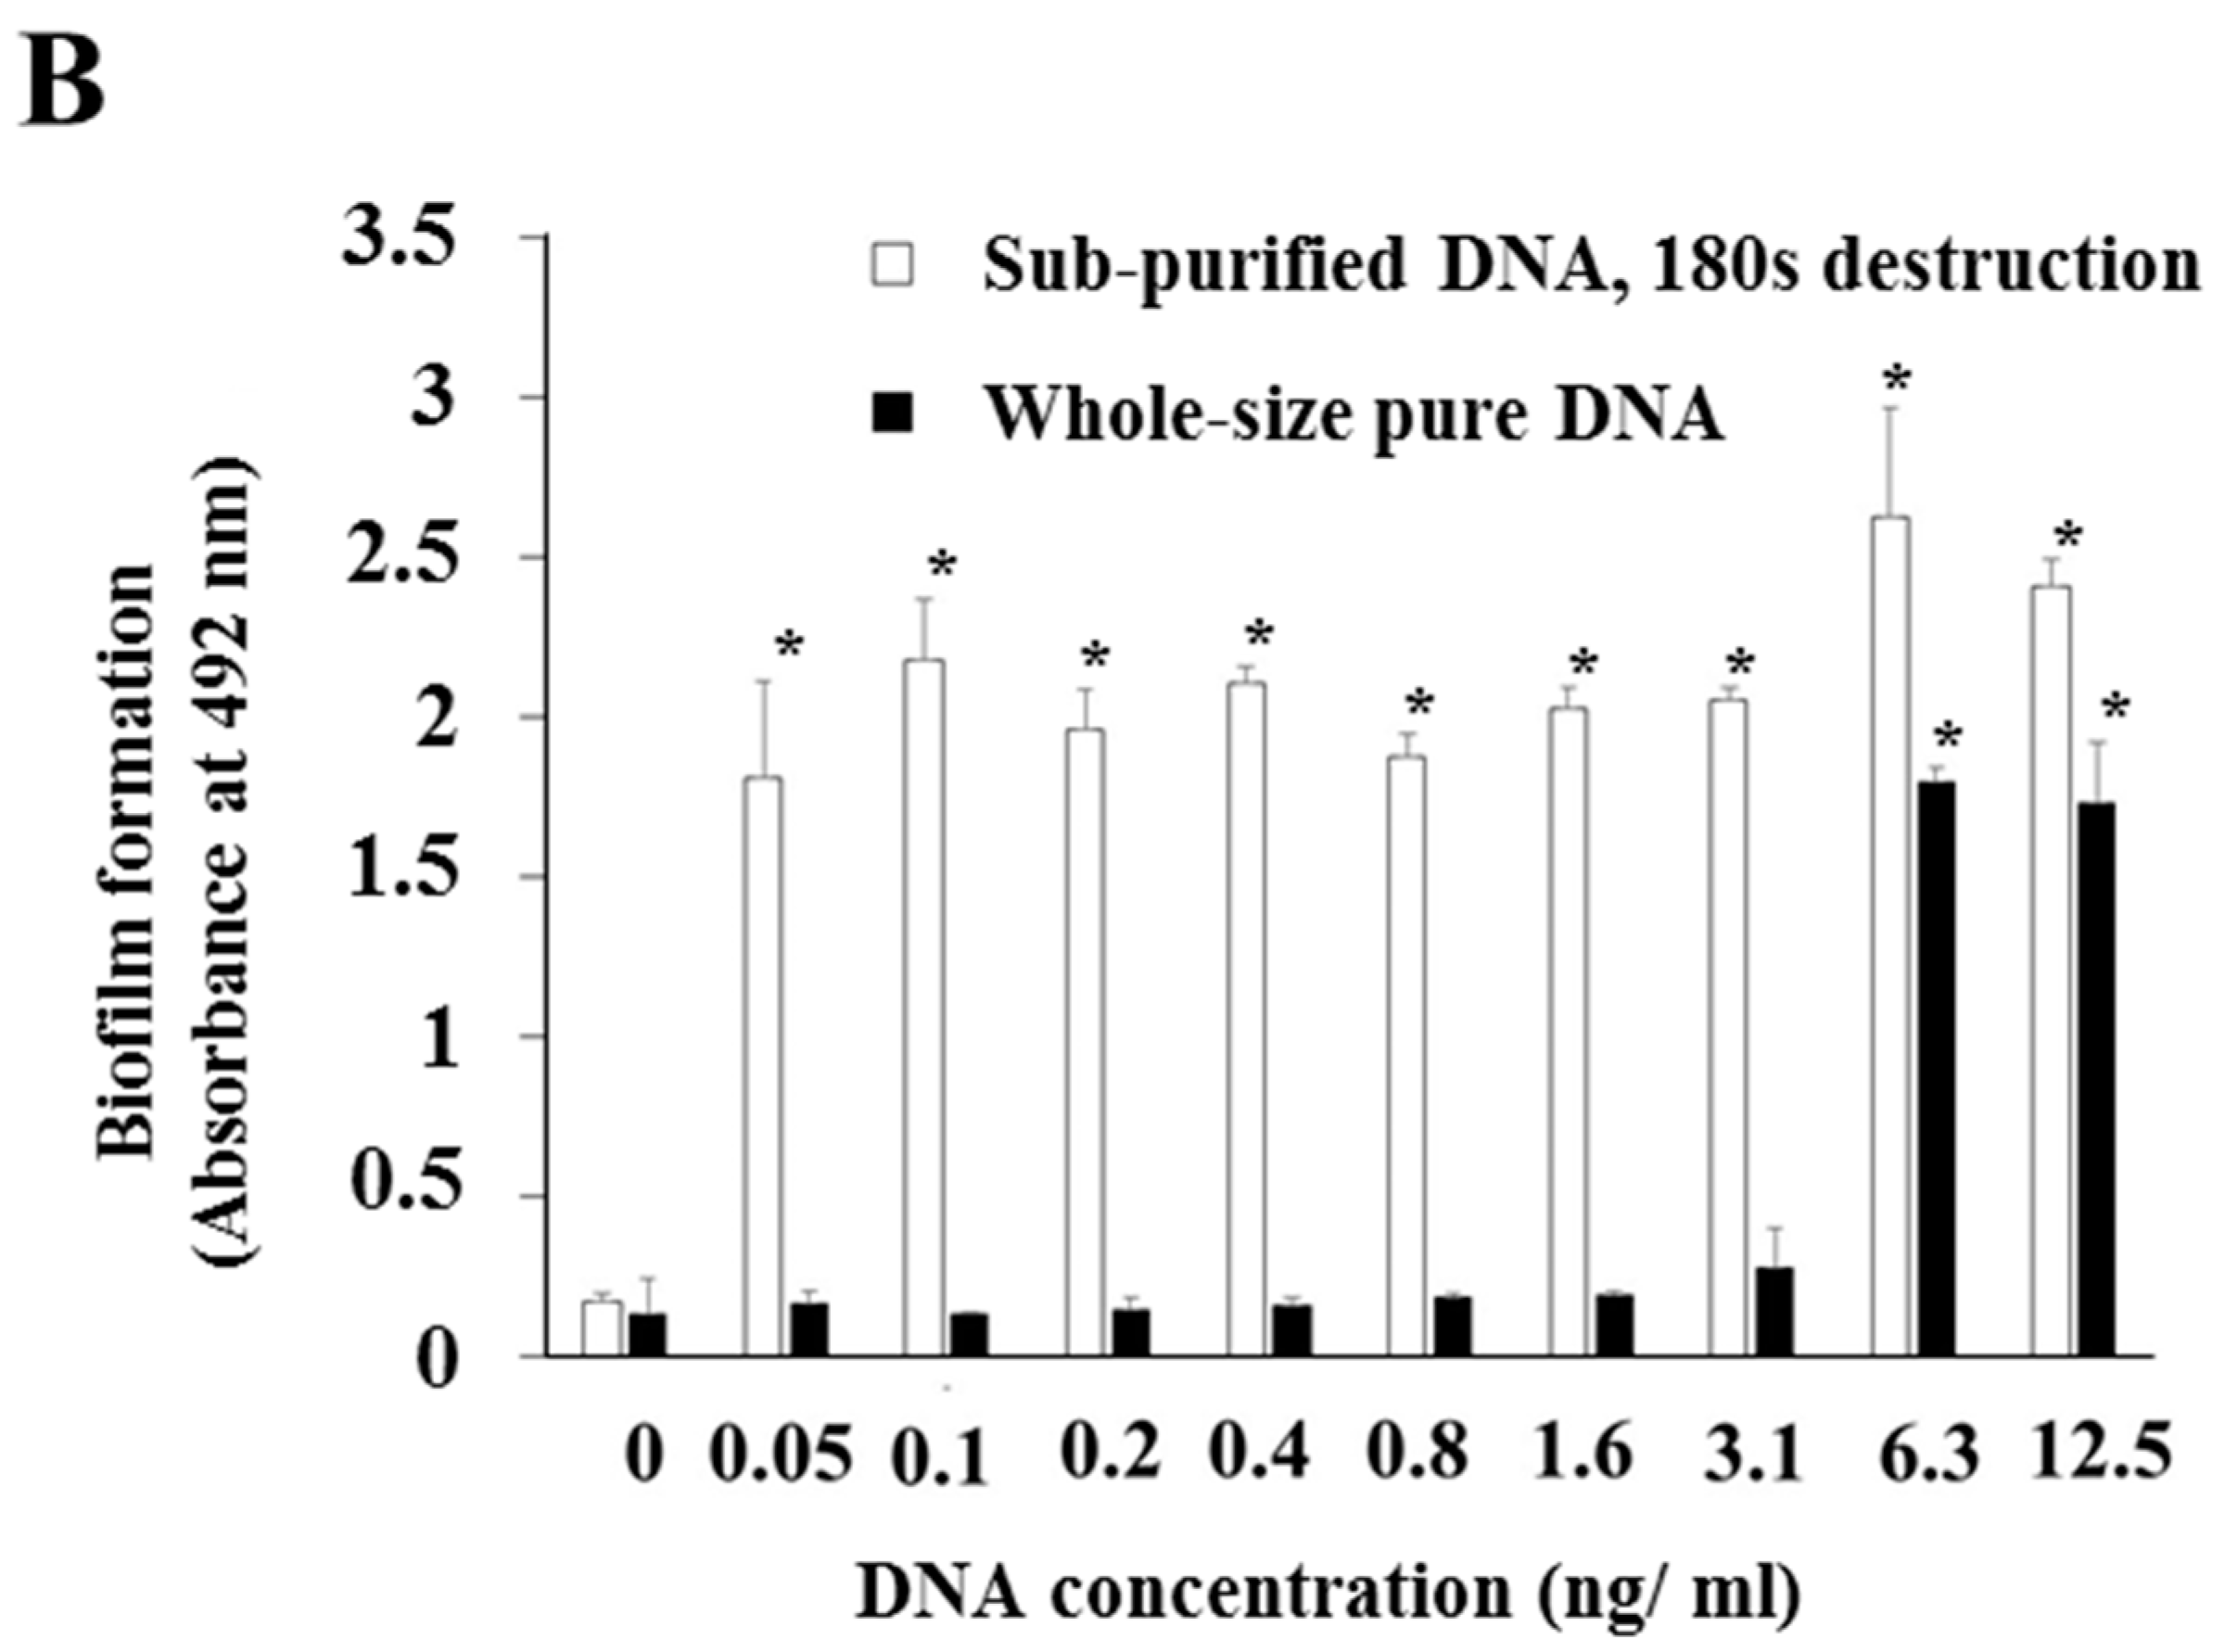
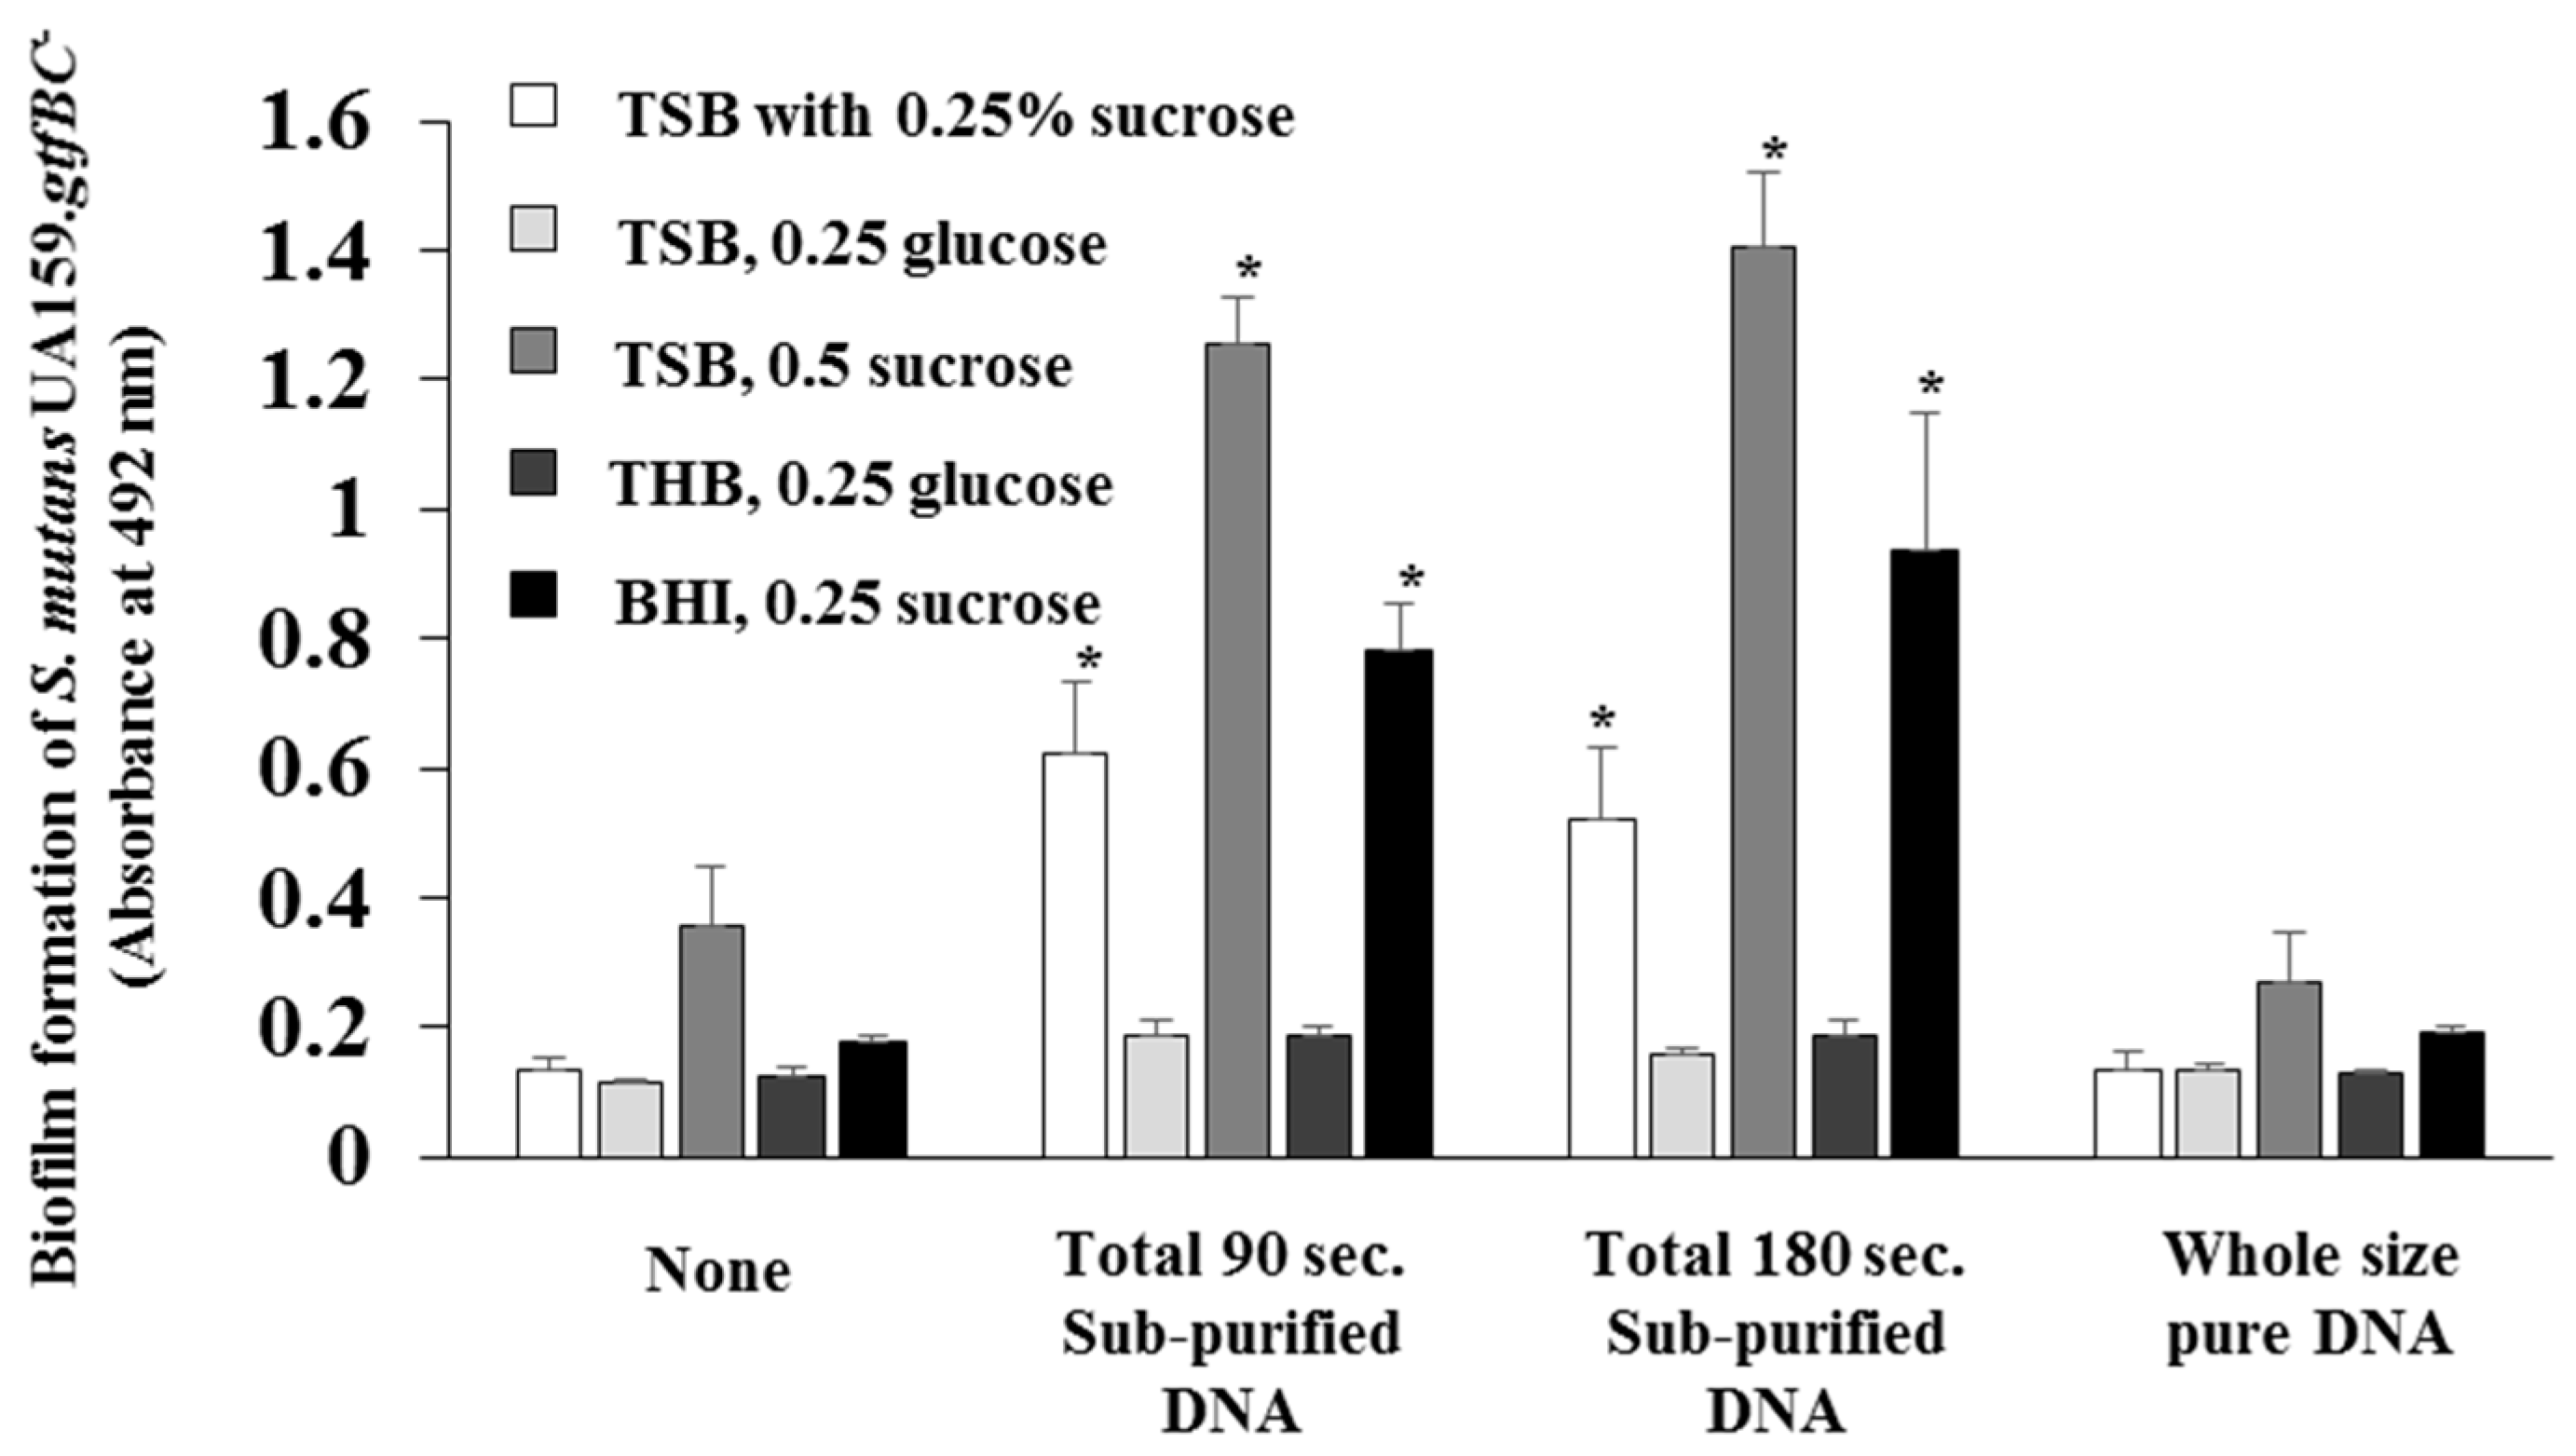
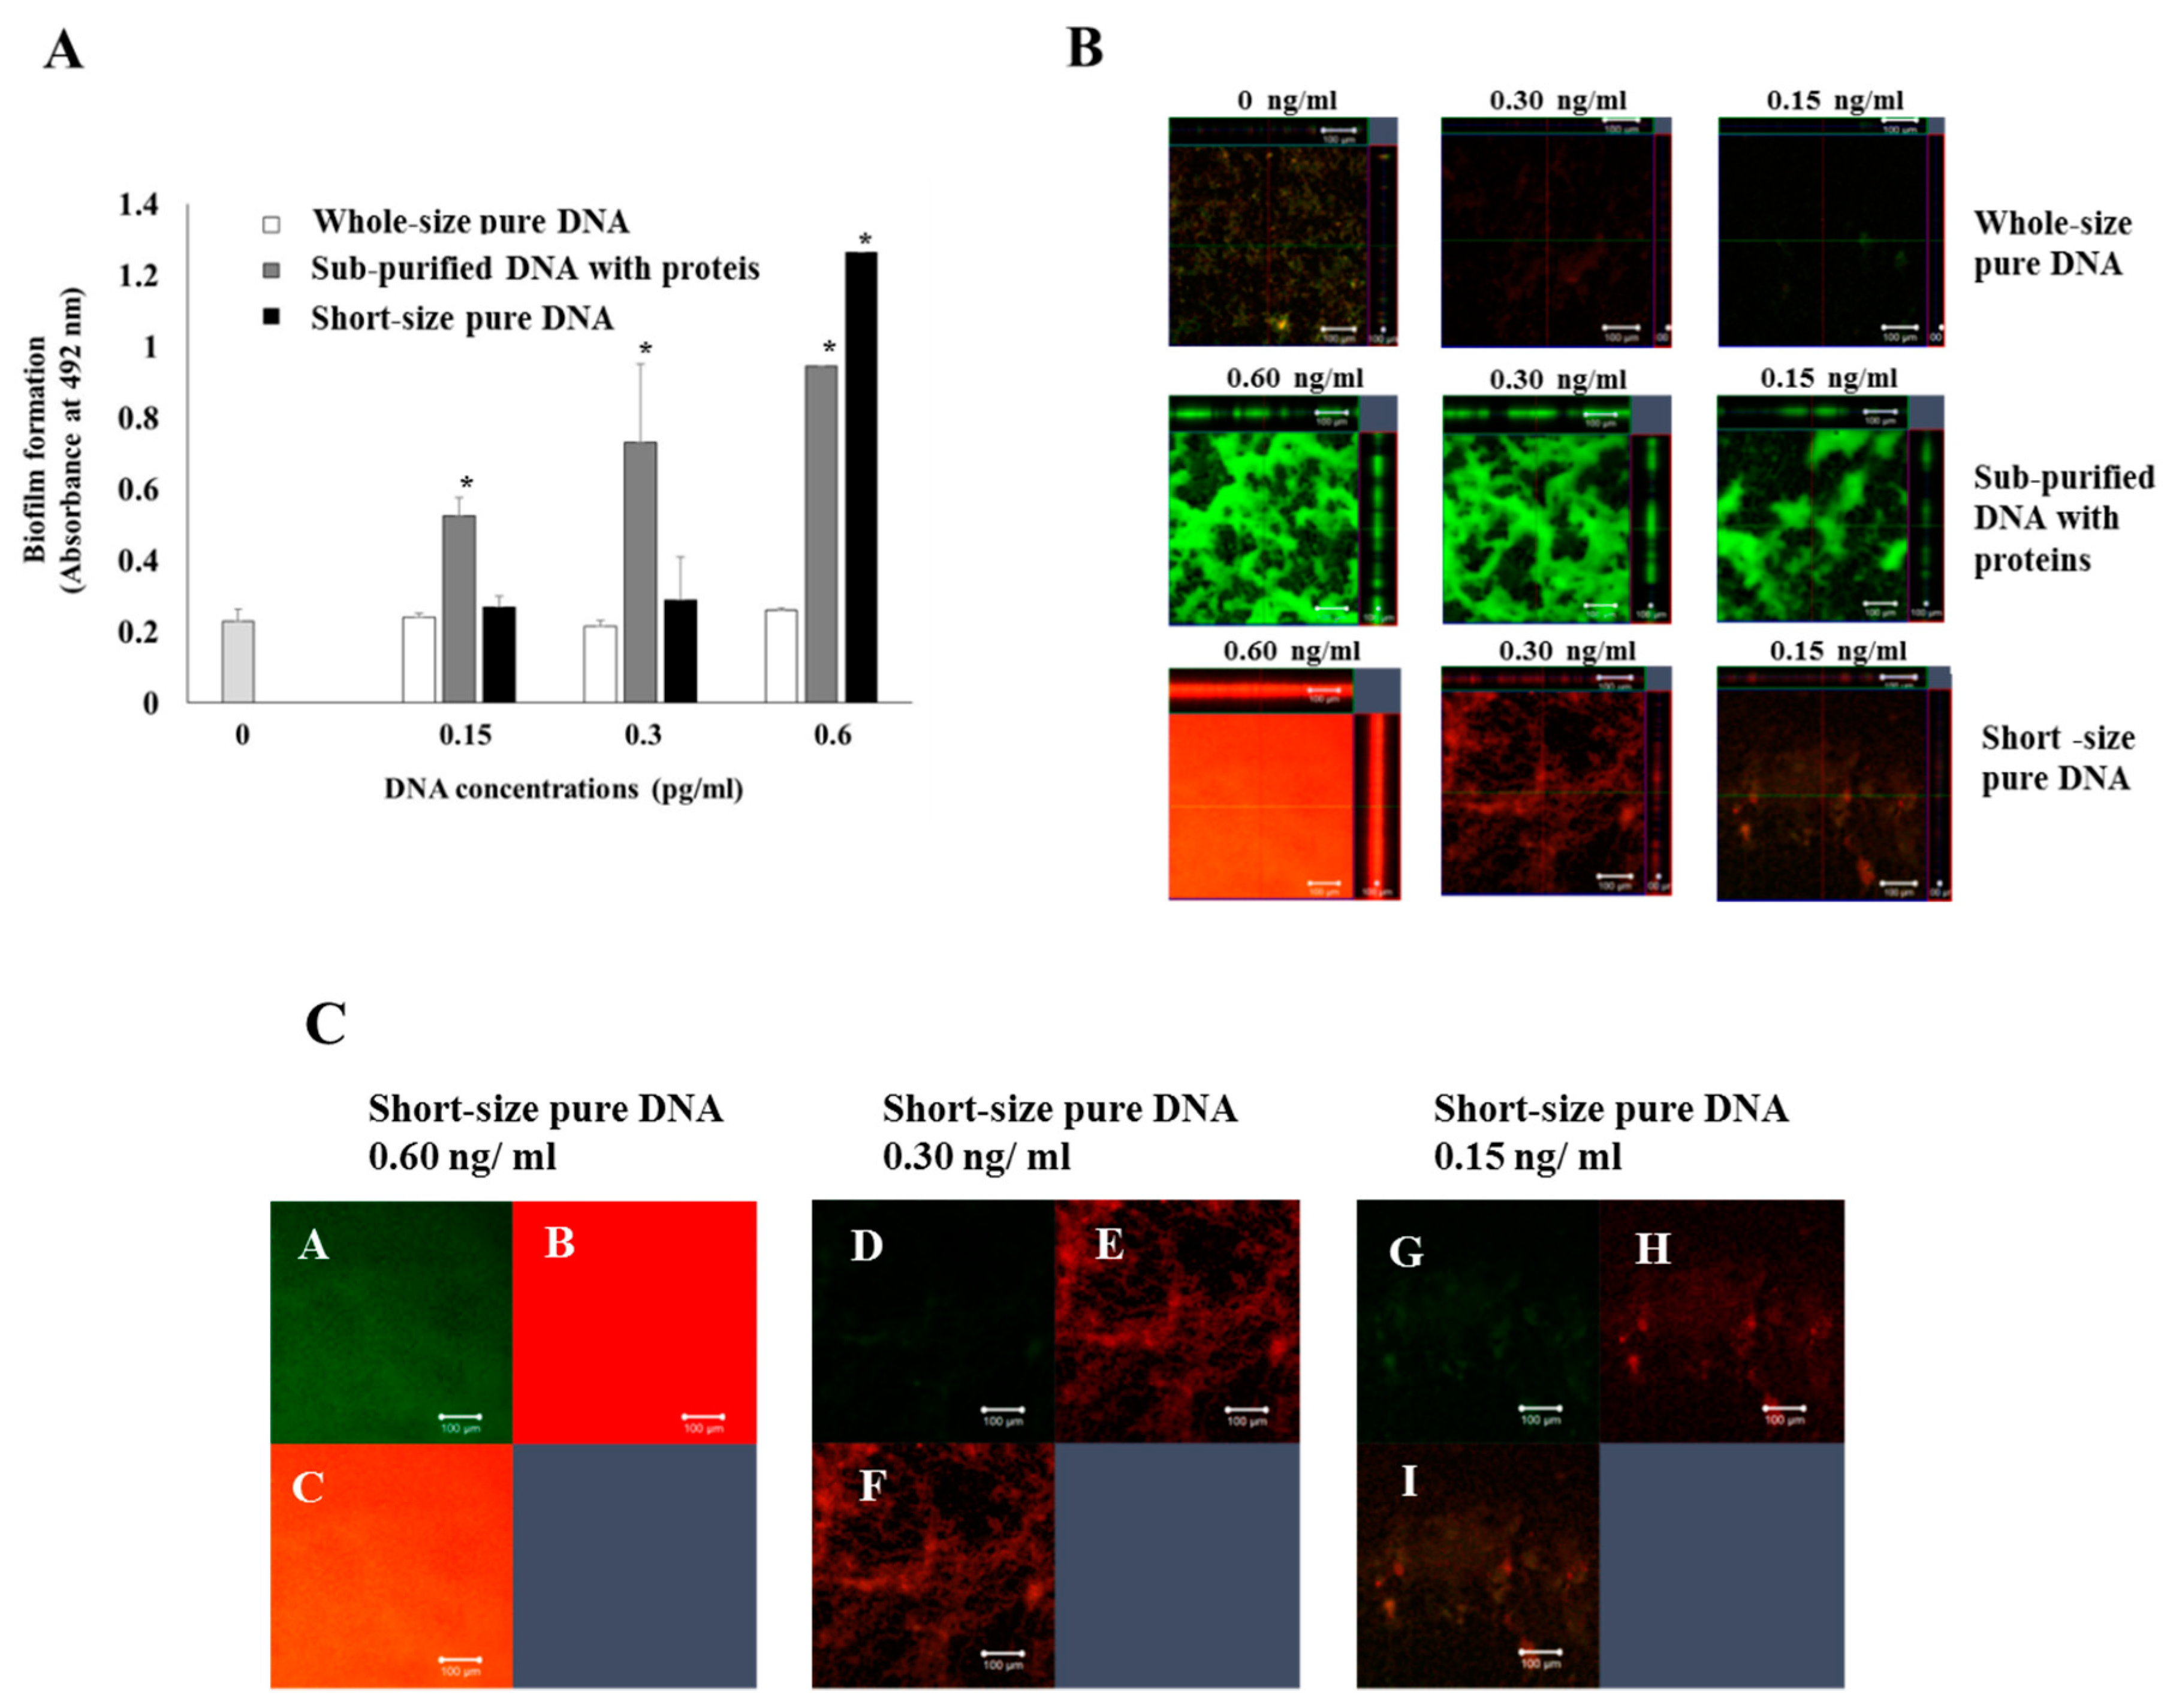
3.2. Effects of DNA with Proteins and Whole-Size Pure DNA on Biofilm Formation

The effects of DNA with proteins in sub-purified DNA for 180 s destruction and whole-size pure DNA on biofilm formation were examined using S. mutans UA159.gtfBC in TSB with 0.25% sucrose. Low concentrations (0.05 ng/mL) of DNA with proteins induced significant biofilm formation, and the higher biofilm levels continued up to 12.5 ng/mL (Figure 1B). However, whole-size pure DNA did not induce biofilm formation at 0.05–3.1 ng/mL and induced significant biofilm formation at more than 6.3 ng/mL DNA (Figure 1B). There is a possibility that DNA with proteins contains GTF because it induced the biofilm formation of S. mutans UA159.gtfBC.
To confirm the effects of glucan on the biofilm formation induced by DNA with proteins, observation of glucan synthesis was performed, and the significant production of glucan (red color area) was identified in the biofilm formation induced by DNA with proteins (bead destruction for 90 and 180 s; Figure 2). Moreover, to confirm GTF activities in DNA with proteins in biofilm formation in sucrose conditions (substrate to produce glucan, TSB with 0.25% and 0.5% sucrose, and BHI with 0.25% sucrose) and glucose (non-substrate to produce glucan, TSB and THB with 0.25% glucose), biofilm formations were observed. DNA with proteins significantly induced biofilm formation in sucrose conditions but not in glucose conditions (Figure 3).
There is a possibility that DNA with proteins is linked with the presence of GTF. GTF attached to MVs and formed a complex with short DNA fragments. Therefore, observation of the presence of MVs on DNA with proteins was performed by a scanning electron microscope. Some MVs were found in DNA with proteins (Figure 4A). To confirm the presence of GTF in subpurified DNA, western blotting using anti-GTF serum was performed. Anti-GTF antiserum reacted to 156 kDa bands in sub-purified DNAs (Figure 4B). Therefore, short DNA fragments were produced by bead destruction and bound to GTF attached to MVs.
To compare the biofilm formation abilities between short DNA fragments with and without proteins in detail, these DNA samples were added to the biofilm formation assay using S. mutans UA159.gtfBC. Short-size pure DNA induced significant biofilms at 0.6 ng/mL but not at 0.15 and 0.3 ng/mL, concentrations at which subpurified DNA indicated the significant biofilm formation but not in full-size pure DNA (Figure 5A). Therefore, short-size pure DNA was more susceptible to significant biofilm formation than full-size pure DNA but lower than sub-purified DNA with proteins. To elucidate the mechanisms for biofilm formation, live/dead cell staining was performed. The biofilms formed by sub-purified DNA with proteins were principally constructed by live cells at all concentrations (Figure 5B). In contrast, the biofilms formed by short-size pure DNA were constructed by live and dead cells at 0.6 ng/ mL (Figure 5C). This indicated that many short-size pure DNAs were physically attached to S. mutans UA159.gtfBC and induced attachment and biofilm formation of S. mutans UA159.gtfBC on the well surface. Therefore, characteristics of biofilms induced by sub-purified DNA with proteins were different from those induced by short-size pure DNA fragments. The characteristics of biofilms induced by sub-purified DNA with proteins were similar to the GTF-dependent biofilm formation of S. mutans in sucrose conditions. We hypothesized that MVs attached to GTF, which is shown in Figure 4, were associated with biofilm formation by sub-purified DNA with proteins.

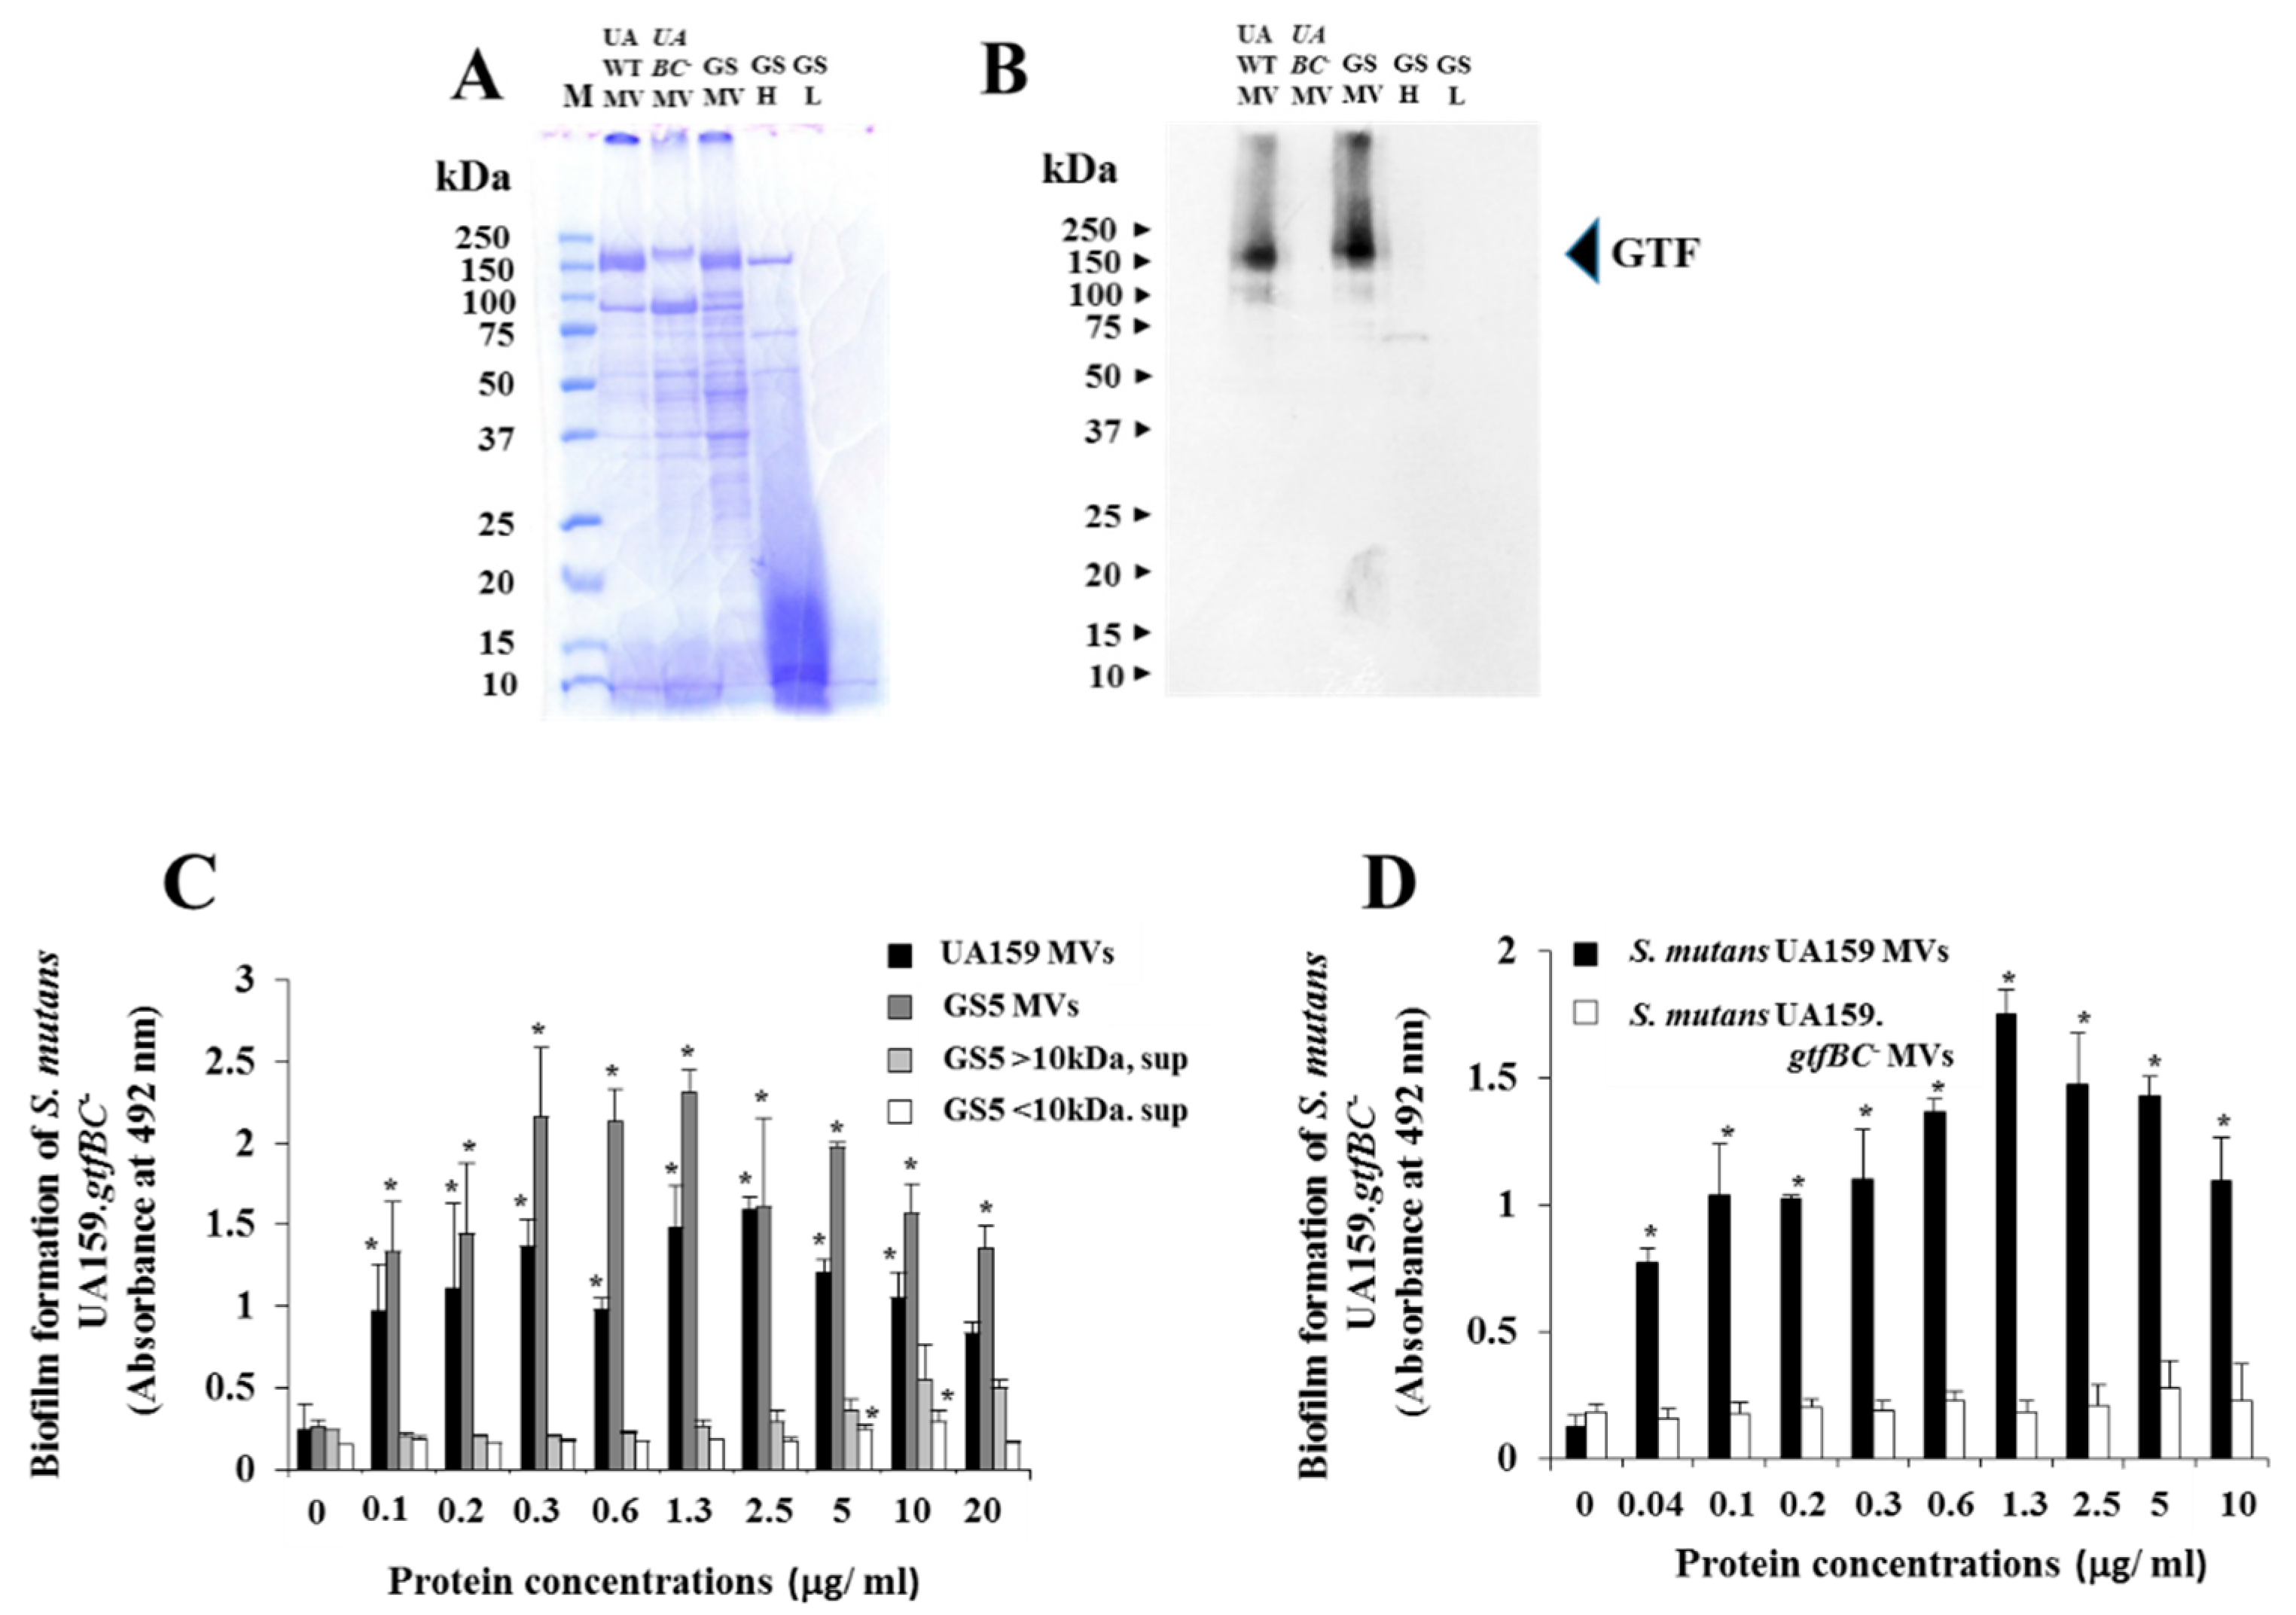
3.3. Effects of GTF-I and GTF-SI on MVs on the Biofilm Formation of S. Mutans

To explore the protein components of the MVs, SDS-PAGE and CBB staining were performed for MVs from S. mutans UA159 and GS-5 laboratory strains. One hundred fifty-six kDa and 90 kDa protein bands were observed as the main proteins, and various small bands were also observed (Figure 6A). Culture supernatant without MVs from S. mutans GS-5 was removed by ultracentrifugation, and >10 kDa proteins (GSH) were concentrated by centrifugal filters and analyzed using SDS-PAGE. The proteins mainly showed smears at the 15, 50, 70, and 156 kDa bands, but the <10 kDa sample (GSL) did not show clear bands. GTF-I and GTF-SI are the main components for insoluble glucan synthesis related to biofilm formation in S. mutans. To confirm the presence of GTF-I and GTF-SI on MVs, MVs from S. mutans UA159.gtfBC were extracted and compared with MVs from S. mutans UA159 and GS-5 in SDS-PAGE. The 156 kDa bands disappeared; in contrast, the 90 kDa band increased in S. mutans UA159.gtfBC (Figure 6A). To identify GTF in the MV samples, Western blotting using anti-GTF antiserum from rabbit, which reacted to the 156 kDa band in both GTF-I and GTF-SI [31], was performed. Strong signals corresponding to the 156 kDa protein band were detected in MVs from UA159 and GS-5, and a weak signal corresponding to the 75 kDa band was detected in the culture supernatant without MVs, >10 kDa proteins but not in UA159.gtfBC (Figure 6B). However, clear signals were not detected in the culture supernatant without MVs in the <10 kDa proteins (Figure 6B). We confirmed that MVs included GTF as the main protein. To study the activities of MVs in biofilm formation, MVs from UA159, UA159.gtfBC, GS-5, and culture supernatant without MVs samples were added to the biofilm formation assay using UA159.gtfBC in TSB with 0.25% sucrose. MVs from UA159 and GS-5 induced significantly higher biofilms at more than 0.1 μg/mL than no sample (p < 0.05), but the culture supernatant without MVs samples did not (Figure 6C). The biofilm formation slowly increased in a dose-dependent manner and reached a peak at 10 μg/mL, but its level was lower in the culture supernatant without MVs with >10 kDa proteins than in biofilm levels with 0.1 μg/mL MVs (Figure 6C). The biofilm formation by culture supernatant sample without MVs from UA159 was also similar to those from GS-5 (data not shown). MVs from UA159.gtfBC did not show significant biofilm formation (Figure 6D).
To remove deposits that were weakly and accidentally attached with MVs, MVs (MVW) were washed with sterile PBS in ultracentrifugation. To remove eDNA bound to MVs, the washed MVs (MVWD) were pretreated by 100 units/mL DNase I at 37 °C for 1 h and washed with sterile PBS to remove free DNase I by ultracentrifugation again. After washing with PBS and treatment of DNase I, the main protein at 156 kDa of GTF was maintained (Supplemental Figure S1A). To confirm the presence of eDNA in MV samples, the SDS-PAGE gel was stained by ethidium bromide. Bands in the bottom area at less than 10 kDa through 12.5% acrylamide gel fluoresced in MV, MVW, and MVWD (Supplemental Figure S1B). It was found that the MVs bound to short size DNA and RNA. To observe the native protein status of MVs, native-PAGE was performed. All proteins did not show clear bands and showed smeared bands (Supplemental Figure S1C). In particular, the smeared bands disappeared after washing in MVW. When stained with ethidium bromide, the DNA or RNA in MV and MVW that remained near the stacking gel groove fluoresced (Supplemental Figure S1D). It was confirmed that DNA and RNA were almost attached to MVs that remained in the gel groove. Concentrations of dsDNA and RNA were quantitatively measured by a NanoDropTM Lite UV-Vis spectrophotometer in MV samples. High concentrations of dsDNA and RNA were observed in independent MV1 and MV2 concentrated by centrifugal filters for >10 kDa and >50 kDa, respectively (Supplemental Figure S2). In the MV2W and MV2WD, the concentrations of dsDNA and RNA decreased considerably. MVs made complexes with dsDNA and RNA. The biofilm formation activities of MVW or MVWD to S. mutans UA159.gtfBC and Actinomyces naeslundii × 600 were observed and compared with those in MF and GSsup >50 (Supplemental Figure S3). The biofilm formation activities of MVW and MVWD were similar to those of MV at more than 0.63 μg/mL. These results indicated that complex DNA, RNA and MVs attached with GTF had activities to biofilm formation of S. mutans and A. naeslundii.
To determine the effects of MVs on the biofilm formation of various microorganisms in oral biofilm bacteria, other microorganisms including C. albicans were inoculated into the biofilm formation assay involving MVs from UA159 or UA159.gtfBC in TSB with 0.25% sucrose. MVs from UA159 up-regulated the biofilm formation of initial colonizers on the tooth surface [32], such as S. mitis, S. oralis, S. sanguinis, S. gordonii, A. naeslundii, and Actinomyces oris, but MVs from UA159.gtfBC did not up-regulated biofilm formation excepting for A. naeslundii (Table 1). MVs from UA159 did not stimulate other bacteria, such as S. salivarius and Neisseria sp., or the Streptococcus milleri group, such as S. anginosus, S. intermedius, S. pyogenes, C. albicans, and S. aureus. Therefore, MVs specifically induced the biofilm formation by multiple oral bacterial species including initial colonizers depending on GTF-I and GTF-SI.
The data indicate the mean ± standard deviation (SD) of triplicate experiments in the biofilm formation assessed by absorbance at 492 nm. The independent experiments were performed three times, with similar results obtained in each. The asterisks indicated a significant difference between the two groups (ANOVA with Bonferroni correction; *: p < 0.05, UA159 MVs vs. no sample or UA159.gtfBC MVs). UP and DOWN: The biofilm formation was significantly enhanced and reduced by addition of UA159 MVs.

4. Discussion

Insoluble glucans synthesized by GTF-I and GTF-SI is the principal components for the development of pathogenic biofilms associated with dental caries [8,10,33,34]. Moreover, eDNA interaction with GTF-I and GTF-SI has important roles in glucan production, S. mutans colonization and biofilm matrix assembly [18,35]. eDNA has been found in high amounts in the matrix of biofilms involving insoluble glucan [19]. eDNA is a byproduct of autolysis [36,37] and is secreted with MVs [19]. Synthesis of peptidoglycan affects production of GTFs and the release of eDNA and MVs [38]. MVs produced from the cytoplasmic membrane are linked to their release in physiological formation or cell lysis during cell growth and are associated with GTF-I and GTF-SI and DNA release.
Extra cellular DNA is one of the contributors to biofilm formation and has important functions in the attachment and an aggregation of bacteria on the surface for initial stage of the biofilm formation [15,25]. In this study, sub-purified DNA with proteins induced significant biofilm formation of S. mutans UA159.gtfBC live cells in conditions without insoluble glucan and with soluble glucan and fructan. Previous reports showed that the presence of fructan and eDNA and the absence of insoluble glucan induced significant S. mutans biofilm formation on human saliva-coated hydroxyapatite disks in raffinose-supplemented conditions [26]. Therefore, soluble polysaccharides, such as fructan, are required for eDNA-dependent biofilm formation in conditions without insoluble glucan. However, an opportunity and function for producing DNA is unknown and actually is required in the attachment of aggregated single cells on the surfaces during the initial stage. Moreover, this report suggested that the hydrophobicity on the cell surface of S. mutans is important for the production of eDNA in the conditions supplemented with a small amount (0.0075% (w/v)) of sucrose [26] and 0.25% raffinose. Small amounts of insoluble glucan, which are synthesized in the condition, may contribute to the up-regulation of hydrophobicity on the cell surface and induce cell aggregation and accumulation. In a previous report, it was suggested that dietary sucrose and starch enhance release of eDNA into the matrix during S. mutans biofilm formation [35]. In addition, eDNA increased glucan synthesis by GtfB adsorbed on the saliva-coated hydroxyapatite and S. mutans surface [33]. These reports indicate the interaction between eDNA and glucan resulting in elements for biofilm formation systems such as aggregation and adherence. The origin of DNA in biofilms could be from the genomic DNA due to the cell lysis of the subpopulation by active secretion [39,40,41]. Therefore, bacterial eDNA is naturally produced and plays a role in appropriate conditions for aggregating bacteria to each other and the adherence of cells on the surface.
This present study indicated that extracellular MVs with GTFs were associated with short size DNA and contributed the biofilm formation of other bacterial species. This complex strongly induced the GTF-dependent biofilm formation of not only S. mutans UA159.gtfBC but also early colonizers on the tooth surface, such as S. mitis, S. oralis, S. sanguinis, S. gordonii, and Actinomyces spp. [32]. In a previous report, eDNA increased glucan synthesis by GTF-I adsorption on saliva-coated hydroxyapatite and the S. mutans surface [33]. Therefore, this formation of MVs and eDNA may be helpful for the effects of GTF-I and GTF-SI on biofilm formation by bacterial species, which were present as S. mutans-independent oral biofilm bacteria in a previous paper [32]. The cargo of the vesicle reflects the physical state of the cell at the time of death rather than being the consequence of a specific sorting mechanism [22]. Rainey et al. indicated that changes in gene expression in acidic pH might lead to activated secretion of MVs and eDNA [41]. Kawarai et al. showed that changes from neutral pH primary conditions to slightly low pH conditions caused glucan-independent and eDNA-dependent biofilm formation of S. mutans in conditions with sucrose [26]. eDNA has multiple functions due to the involvement of acid-base interaction in the attachment and aggregation of bacteria on the surface for the initial stage of biofilm formation [15,25]. S. mutans, which is a late colonizer on the tooth surface, produces eDNA after long-recognized primary colonizers, such as S. mitis, S. oralis, and S. sanguinis, and reinforces their attachment and colonization.
Investigators reported that the major components of the biofilm matrix of Staphylococcus aureus are proteins and eDNA that depend on a drop in pH during growth in the presence of glucose [42,43]. Other investigators suggested that some extracellular DNA and amyloid-like complexes closely interacted within the biofilm matrix [44]. Biofilm formation depended on the presence of both DNA and proteins in sub-purified DNA but not in purified whole size DNA without proteins. It was clarified that various proteins attached to short size DNA are important for eDNA-dependent biofilm formation. Pure short DNA fragments, in which proteins and MVs were removed by proteinase K, induced higher biofilm formation than full-size DNA at an appropriate concentration. Affinities of short DNA fragments to bacterial cells may have arisen because of the shorter size and removal of proteins. Shorter size and pure DNA have physical benefits for penetration because of the depressions on the MVs with GTFs. Oligonucleotides are strong polyelectrolytes carrying a univalent negative charge per base at pH > 2 that contain nitrogenous bases that are hydrophobic in nature [45]. Both electrostatic and hydrophobic interactions are major driving forces for short chain 20-mer pyrimidinic homo-ss-DNA adsorption at solid–liquid interfaces [46]. When MVs are produced during cell growth, short eDNA fragments may interact with MVs with GTFs under the electrostatic and hydrophobic interactions. Cell lysis by bead destruction for 90 and 180 s induced short DNA fragments that attached to MVs and GTF. This suggests that cell lysis leads to the production of the complex of MVs, DNA, and GTF in natural growth.
Recently, Koo et al. provided a rational for multi-targeted therapies that are aimed at disrupting the complex biofilm microenvironment involving in S. mutans [47]. Extra cellular polysaccharides such as glucan, GTF, glucan binding protein, quorum sensing, and eDNA were picked up and summarized as target. Short size DNAs and complex form of short size DNA associated with GTF and MVs presented in this study are important factors for the formation of biofilms by oral multi-species microorganisms and may be one of additional targets for the prevention of oral biofilm-associated diseases. However, our study does not fully elucidate the production mechanisms of short size DNA and MVs. Further study of the mechanism of decreasing from whole size to short size DNA, the bonding of DNA and GTF on the MVs and production of MVs are necessary to understand the eDNA and MVs-dependent biofilm formation.

5. Conclusions

Cell lysis of Streptococcus mutans by bead destruction for 90 and 180 s induced short DNA fragments that attached to membrane vesicles (MVs) and glucosyltransferases (GTFs). This suggests that cell lysis leads to the production of the complex of MVs, DNA, and GTFs in natural growth. Pure short DNA fragments, in which proteins and MVs were removed by proteinase K, induced higher biofilm formation of S. mutans than full-size DNA. The complex of MVs, DNA, and GTFs induced the GTFs-dependent biofilm formation of early colonizers on the tooth surface. The short size DNAs associated with MVs and GTFs are important contributors for the formation of biofilms by oral pathogen and may be one of additional targets for the prevention of oral biofilm-associated diseases.

Supplementary Materials

The following are available online, Figure S1: Effects of DNase I on biofilm of S. mutans formed by MVs, Figure S2: Biofilm formations by MV, MVW, MVWD and GSsup > 50, Figure S3: Quantitative analysis of double strand DNA and RNA in MVs.

Author Contributions

Conceptualization, H.S.; Data curation, T.N., Y.I., S.H.; Formal analysis, H.S., T.N., Y.I.; Funding acquisition, H.S.; Methodology, H.S., R.N., M.O.; Supervision, H.S., M.O.; Writing—original draft, H.S; Writing—review & editing, H.S., R.N., M.O.

Funding

This work was supported in part by Grants-in-Aid for the Development of Scientific Research (21390506, 24659821 and 16K11537) from the Ministry of Education, Science, Sports and Culture of Japan and by the Research Program on Emerging and Re-emerging Infectious Diseases from the Japan Agency for Medical Research and Development, AMED (40105502).

Acknowledgments

We would like to thank American Journal Experts (https://www.aje.com) for English language editing.

Conflicts of Interest

The authors declare that the research was conducted in the absence of any commercial or financial relationships that could be construed as a potential conflict of interest.

References

  1. Burne, R. Oral Streptococci. Products of their environment. J. Dent. Res. 1998, 77, 445–452. [Google Scholar] [CrossRef] [PubMed]
  2. Loesche, W.J. Role of Streptococcus mutans in human dental decay. Microbiol. Rev. 1986, 50, 353–380. [Google Scholar] [PubMed]
  3. Nyvad, B.; Kilian, M. Comparison of the initial Streptococcal microflora on dental enamel in caries-active and in caries-inactive individuals. Caries Res. 1990, 24, 267–272. [Google Scholar] [CrossRef] [PubMed]
  4. Aas, J.A.; Paster, B.J.; Stokes, L.N.; Olsen, I.; Dewhirst, F.E. Defining the normal bacterial flora of the oral cavity. J. Clin. Microbiol. 2005, 43, 5721–5732. [Google Scholar] [CrossRef] [PubMed]
  5. Kroes, I.; Lepp, P.W.; Relman, D.A. Bacterial diversity within the human subgingival crevice. Proc. Natl. Acad. Sci. USA 1999, 96, 14547–14552. [Google Scholar] [CrossRef] [PubMed] [Green Version]
  6. Paster, B.J.; Boches, S.K.; Galvin, J.L.; Ericson, R.E.; Lau, C.N.; Levanos, V.A.; Sahasrabudhe, A.; Dewhirst, F.E. Bacterial diversity in human subgingival plaque. J. Bacteriol. 2001, 183, 3770–3783. [Google Scholar] [CrossRef]
  7. Hamada, S.; Slade, H.D. Biology, immunology, and cariogenicity of Streptococcus mutans. Microbiol. Rev. 1980, 44, 331–384. [Google Scholar]
  8. Bowen, W.; Koo, H. Biology of Streptococcus mutans-derived glucosyltransferases: Role in extracellular matrix formation of cariogenic biofilms. Caries Res. 2011, 45, 69–86. [Google Scholar] [CrossRef]
  9. Banas, J.A. Virulence properties of Streptococcus mutans. Front. Biosci. 2004, 9, 1267–1277. [Google Scholar] [CrossRef]
  10. Aoki, H.; Shiroza, T.; Hayakawa, M.; Sato, S.; Kuramitsu, H.K. Cloning of a Streptococcus mutans glucosyltransferase gene coding for insoluble glucan synthesis. Infect. Immun. 1986, 53, 587–594. [Google Scholar]
  11. Lynch, D.J.; Fountai, T.L.; Mazurkeiwicz, J.E.; Banas, J.A. Glucan-binding proteins are essential for shaping Streptococcus mutans biofilm architecture. FEMS Microbiol. Lett. 2007, 268, 158–165. [Google Scholar] [CrossRef] [PubMed]
  12. Duque, C.; Stipp, R.N.; Wang, B.; Smith, D.J.; Höfling, J.F.; Kuramitsu, H.K.; Duncan, M.J.; Mattos-Graner, R.O. Downregulation of GbpB, a component of the VicRK regulon, affects biofilm formation and cell surface characteristics of Streptococcus mutans. Infect. Immun. 2011, 79, 786–796. [Google Scholar] [CrossRef] [PubMed]
  13. Ahn, S.-J.; Ahn, S.-J.; Wen, Z.T.; Brady, L.J.; Burne, R.A. Characteristics of Biofilm Formation by Streptococcus mutans in the Presence of Saliva. Infect. Immun. 2008, 76, 4259–4268. [Google Scholar] [CrossRef] [PubMed]
  14. Perry, J.A.; Cvitkovitch, D.G.; Lévesque, C.M. Cell death in Streptococcus mutans biofilms: A link between CSP and extracellular DNA. FEMS Microbiol. Lett. 2009, 299, 261–266. [Google Scholar] [CrossRef] [PubMed]
  15. Das, T.; Sharma, P.K.; Busscher, H.J.; Van Der Mei, H.C.; Krom, B.P. Role of extracellular DNA in initial bacterial adhesion and surface aggregation. Appl. Environ. Microbiol. 2010, 76, 3405–3408. [Google Scholar] [CrossRef] [PubMed]
  16. Zhang, K.; Ou, M.; Wang, W.; Ling, J. Effects of quorum sensing on cell viability in Streptococcus mutans biofilm formation. Biochem. Biophys. Res. Commun. 2009, 379, 933–938. [Google Scholar] [CrossRef] [PubMed]
  17. Petersen, F.C.; Tao, L.; Scheie, A.A. DNA Binding-Uptake System: A link between Cell-to-Cell communication and biofilm formation. J. Bacteriol. 2005, 187, 4392–4400. [Google Scholar] [CrossRef] [PubMed]
  18. Reck, M.; Rutz, K.; Kunze, B.; Tomasch, J.; Surapaneni, S.K.; Schulz, S.; Wagner-Döbler, I. The biofilm inhibitor carolacton disturbs membrane integrity and cell division of Streptococcus mutans through the Serine/Threonine protein kinase PknB. J. Bacteriol. 2011, 193, 5692–5706. [Google Scholar] [CrossRef] [PubMed]
  19. Liao, S.; Klein, M.I.; Heim, K.P.; Fan, Y.; Bitoun, J.P.; Ahn, S.-J.; Burne, R.A.; Koo, H.; Brady, L.J.; Wen, Z.T. Streptococcus mutans extracellular DNA is upregulated during growth in biofilms, actively released via membrane vesicles, and influenced by components of the protein secretion machinery. J. Bacteriol. 2014, 196, 2355–2366. [Google Scholar] [CrossRef]
  20. Rivera, J.; Cordero, R.J.B.; Nakouzi, A.S.; Frases, S.; Nicola, A.; Casadevall, A. Bacillus anthracis produces membrane-derived vesicles containing biologically active toxins. Proc. Natl. Acad. Sci. USA 2010, 107, 19002–19007. [Google Scholar] [CrossRef]
  21. Prados-Rosales, R.; Carreño, L.J.; Batista-Gonzalez, A.; Baena, A.; Venkataswamy, M.M.; Xu, J.; Yu, X.; Wallstrom, G.; Magee, D.M.; LaBaer, J.; et al. Mycobacterial membrane vesicles administered systemically in mice induce a protective immune response to surface compartments of Mycobacterium tuberculosis. mBio 2014, 5, e01921-14. [Google Scholar] [CrossRef] [PubMed]
  22. Toyofuku, M.; Cárcamo-Oyarce, G.; Yamamoto, T.; Eisenstein, F.; Hsiao, C.-C.; Kurosawa, M.; Gademann, K.; Pilhofer, M.; Nomura, N.; Eberl, L. Prophage-triggered membrane vesicle formation through peptidoglycan damage in Bacillus subtilis. Nat. Commun. 2017, 8, 481. [Google Scholar] [CrossRef] [PubMed]
  23. Olaya-Abril, A.; Prados-Rosales, R.; McConnell, M.J.; Martín-Peña, R.; González-Reyes, J.A.; Jiménez-Munguía, I.; Gómez-Gascón, L.; Fernandez, J.; Luque-Garcia, J.L.; García-Lidón, C.; et al. Characterization of protective extracellular membrane-derived vesicles produced by Streptococcus pneumoniae. J. Proteom. 2014, 106, 46–60. [Google Scholar] [CrossRef]
  24. Kawarai, T.; Narisawa, N.; Suzuki, Y.; Nagasawa, R.; Senpuku, H. Streptococcus mutans biofilm formation is dependent on extracellular DNA in primary low pH conditions. J. Oral Biosci. 2016, 58, 55–61. [Google Scholar] [CrossRef]
  25. Das, T.; Sehar, S.; Manefield, M. The roles of extracellular DNA in the structural integrity of extracellular polymeric substance and bacterial biofilm development. Environ. Microbiol. Rep. 2013, 5, 778–786. [Google Scholar] [CrossRef] [PubMed]
  26. Nagasawa, R.; Sato, T.; Senpuku, H. Raffinose induces biofilm formation by Streptococcus mutans in low concentrations of sucrose by increasing production of extracellular DNA and fructan. Appl. Environ. Microbiol. 2017, 83. [Google Scholar] [CrossRef] [PubMed]
  27. Suzuki, Y.; Nagasawa, R.; Senpuku, H. Inhibiting effects of fructanase on competence-stimulating peptide-dependent quorum sensing system in Streptococcus mutans. J. Infect. Chemother. 2017, 23, 634–641. [Google Scholar] [CrossRef] [PubMed]
  28. Nakao, R.; Hasegawa, H.; Ochiai, K.; Takashiba, S.; Ainai, A.; Ohnishi, M.; Watanabe, H.; Senpuku, H. Outer membrane vesicles of Porphyromonas gingivalis elicit a mucosal immune response. PLoS ONE 2014, 6, e26163. [Google Scholar] [CrossRef] [PubMed]
  29. Motegi, M.; Takagi, Y.; Yonezawa, H.; Hanada, N.; Terajima, J.; Watanabe, H.; Senpuku, H. Assessment of genes associated with Streptococcus mutans Biofilm Morphology. Appl. Environ. Microbiol. 2006, 72, 6277–6287. [Google Scholar] [CrossRef] [PubMed]
  30. Hamada, S.; Horikoshi, T.; Minami, T.; Okahashi, N.; Koga, T. Purification and characterization of cell-associated glucosyltransferase synthesizing water-insoluble glucan from serotype c Streptococcus mutans. J. Gen. Microbiol. 1989, 135, 335–344. [Google Scholar] [CrossRef] [PubMed]
  31. Koo, H.; Xiao, J.; Klein, M.I.; Jeon, J.G. Exopolysaccharides Produced by Streptococcus mutans Glucosyltransferases modulate the establishment of microcolonies within multispecies biofilms. J. Bacteriol. 2010, 192, 3024–3032. [Google Scholar] [CrossRef] [PubMed]
  32. Kolenbrander, P.E.; Andersen, R.N.; Blehert, D.S.; Egland, P.G.; Foster, J.S.; Palmer, R.J. Communication among oral bacteria. Microbiol. Mol. Biol. Rev. 2002, 66, 486–505. [Google Scholar] [CrossRef] [PubMed]
  33. Klein, M.I.; Hwang, G.; Santos, P.H.S.; Campanella, O.H.; Koo, H. Streptococcus mutans-derived extracellular matrix in cariogenic oral biofilms. Front. Microbiol. 2015, 5, 10. [Google Scholar] [CrossRef] [PubMed]
  34. Smith, A.V.; Scott-Anne, K.; Whelehan, M.; Berkowitz, R.; Feng, C.; Bowen, W. Salivary glucosyltransferase B as a possible marker for caries activity. Caries Res. 2007, 41, 445–450. [Google Scholar] [CrossRef] [PubMed]
  35. Klein, M.I.; DeBaz, L.; Agidi, S.; Lee, H.; Xie, G.; Lin, A.H.-M.; Hamaker, B.R.; Lemos, J.A.; Koo, H. Dynamics of Streptococcus mutans transcriptome in response to starch and sucrose during biofilm development. PLoS ONE 2010, 5, e13478. [Google Scholar] [CrossRef] [PubMed]
  36. Kesty, N.C.; Mason, K.M.; Reedy, M.; Miller, S.E.; Kuehn, M.J. Enterotoxigenic Escherichia coli vesicles target toxin delivery into mammalian cells. EMBO J. 2004, 23, 4538–4549. [Google Scholar] [CrossRef] [PubMed]
  37. Steinberger, R.E.; Holden, P.A. Extracellular DNA in single- and multiple-species unsaturated biofilms. Appl. Environ. Microbiol. 2015, 71, 5404–5410. [Google Scholar] [CrossRef]
  38. Rainey, K.; Michalek, S.M.; Wen, Z.T.; Wu, H. Glycosyltransferase mediated matrix dynamics and virulence of Streptooccus mutans. Appl. Environ. Microbiol. 2019, 85, e02247-18. [Google Scholar] [CrossRef]
  39. Barken, K.B.; Yang, L.; Klausen, M.; Webb, J.S.; Kjelleberg, S.; Molin, S.; Givskov, M.; Tolker-Nielsen, T.; Allesen-Holm, M.; Tolker-Nielsen, T.; et al. A characterization of DNA release in Pseudomonas aeruginosa cultures and biofilms. Mol. Microbiol. 2006, 59, 1114–1128. [Google Scholar]
  40. Jung, C.-J.; Hsu, R.-B.; Shun, C.-T.; Hsu, C.-C.; Chia, J.-S. AtlA mediates extracellular DNA release, which contributes to Streptococcus mutans biofilm formation in an experimental rat model of infective endocarditis. Infect. Immun. 2017, 85, e00252-17. [Google Scholar] [CrossRef]
  41. Rainey, M.M.; Korostyshevsky, D.; Lee, S.; Perlstein, E.O. The antidepressant sertraline targets intracellular vesiculogenic membranes in Yeast. Genetics 2010, 185, 1221–1233. [Google Scholar] [CrossRef] [PubMed]
  42. Foulston, L.; Elsholz, A.K.W.; DeFrancesco, A.S.; Losick, R. The extracellular matrix of Staphylococcus aureus biofilms comprises cytoplasmic proteins that associate with the cell surface in response to decreasing pH. mBio 2014, 5, e01667-14. [Google Scholar] [CrossRef] [PubMed]
  43. Dengler, V.; Foulston, L.; DeFrancesco, A.S.; Losick, R. An Electrostatic Net Model for the Role of extracellular DNA in biofilm formation by Staphylococcus aureus. J. Bacteriol. 2015, 197, 3779–3787. [Google Scholar] [CrossRef] [PubMed]
  44. Marcato-Romain, C.-E.; Randrianjatovo-Gbalou, I.; Rouquette, P.; Lefebvre, D.; Girbal-Neuhauser, E. In situ analysis of Bacillus licheniformis biofilms: Amyloid-like polymers and eDNA are involved in the adherence and aggregation of the extracellular matrix. J. Appl. Microbiol. 2017, 122, 1262–1274. [Google Scholar]
  45. Carot, M.L.; Torresi, R.M.; Garcia, C.D.; Esplandiu, M.J.; Giacomelli, C.E. Electrostatic and hydrophobic interactions involved in CNT biofunctionalization with short ss-DNA. J. Phys. Chem. C 2010, 114, 4459–4465. [Google Scholar] [CrossRef] [PubMed]
  46. Balladur, V.; Theretz, A.; Mandrand, B. Determination of the main forces driving DNA oligonucleotide adsorption onto aminated silica wafers. J. Colloid Interface Sci. 1997, 194, 408–418. [Google Scholar] [CrossRef]
  47. Koo, H.; Allan, R.N.; Howlin, R.P.; Hall-Stoodley, L.; Stoodley, P. Targeting microbial biofilms: Current and prospective therapeutic strategies. Nat. Rev. Genet. 2017, 15, 740–755. [Google Scholar] [CrossRef] [PubMed]
Sample Availability: Samples of the compounds, MVs are available from the authors.
Figure 1. Preparation of various types of DNA. (A) Whole-size pure DNA, sub-purified DNAs prepared by beads destruction for 90 (Sub puri DNA 90s) and 180 s (Sub puri DNA 180 s), sub puri DNA 180 s treated with phenol and chloroform (Sub puri DNA 180 s + Phen Chlo), and sub puri DNA 180 s + Phen Chlo treated with proteinase K (sub puri DNA 180 s + Phen Chlo + Pro K) were observed for molecular size and proteins. Left: Polyacrylamide gel after SDS-PAGE analysis using various types of DNA was stained by Coomassie Brilliant Blue (CBB), and Center: Ethidium bromide staining to left gel. Right: Agarose gel after electrophoresis using the same samples was stained by ethidium bromide. M: Protein marker. (B) Sub-purified DNAs prepared by beads destruction for 180 (Sub puri DNA 180 s) was used as a DNA with proteins. Biofilm formation of Streptococcus mutans UA159 gtfBC was quantitatively assessed in conditions with DNA with proteins and pure full size DNA. The data indicate the mean ± standard deviation (SD) of triplicate experiments. The independent experiments were performed three times, with similar results obtained in each. The asterisks indicate a significant difference between the two groups (*: p < 0.01, no DNA vs. DNA).
Molecules 24 03131 g001aMolecules 24 03131 g001b
Figure 2. Roles of glucan for biofilm formation of S. mutans by sub-purified DNA. The biofilm formation of S. mutans UA159 gtfBC induced by sub-purified DNA were analyzed for the production of glucan and observed in media including sucrose. The biofilm formations of S. mutans UA159 gtfBC were induced by none, sub-purified DNA prepared by beads destruction for total 90 and 180 s, and whole size pure DNA. Their biofilms were stained by SYTO 9 and Alexa Flour 647-dextran conjugate, observed by confocal microscope and analyzed by Zen. Upper left: Live cells, Upper right: Glucan, and Lower left: Live cell merged with glucan were presented. Representative data from more than three independent experiments are presented in the pictures.
Molecules 24 03131 g002
Figure 3. Effects of carbohydrates on the biofilm formation by DNA samples. Biofilm formations were quantitatively assessed in none, sub-purified DNA prepared by beads destruction for a total of 90 and 180 s, and whole-size pure DNA in TSB with 0.25% sucrose, 0.25% glucose, and 0.5% sucrose, THB with 0.25% glucose, and BHI with 0.25% sucrose. The data indicate the mean ± standard deviation (SD) of triplicate experiments. The independent experiments were performed three times, with similar results obtained in each. The asterisks indicate a significant difference between the two groups (*: p < 0.05, no DNA vs. DNA).
Molecules 24 03131 g003
Figure 4. Presence of GTF-I and GTF-SI in sub-purified DNA. (A) Membrane vesicles (MVs) and sub-purified DNA prepared by beads destruction for a total of 90 s from S. mutans UA159 were observed at 20,000 and 100,000 magnifications by electron microscope. The independent experiments were performed three times, with similar results obtained in each. (B) Sub-purified DNAs prepared by beads destruction for 90 and 180 s in S. mutans UA159 were applied into SDS-PAGE and western blotting using anti-GTF antiserum was performed. Representative data from more than three independent experiments were presented in the pictures.
Molecules 24 03131 g004
Figure 5. Biofilm formation of S. mutans by DNA. Biofilm formations induced by 0, 0.15, 0.3, and 0.6 ng/mL of whole-size pure DNA (open bar), sub-purified DNA with proteins (gray bar) from 180-s cell destruction and short-size pure DNA in UA159 were quantitatively assessed by absorbance at 492 nm (A). The data indicate the mean ± standard deviation (SD) of triplicate experiments. The independent experiments were performed three times, with similar results obtained each time. The asterisks indicate a significant difference between the two groups (*: p < 0.05, no DNA vs. DNA). Biofilm formations induced by 0, 0.15, 0.3, and 0.6 ng/mL of whole-size pure DNA, sub-purified DNA with proteins and short-size pure DNA were visually observed by confocal microscope with live/dead staining (B). XY, XZ, and YZ axes biofilms are shown in each picture. Representative data from more than three independent experiments are shown in the pictures. The biofilm formations of S. mutans UA159.gtfBC, which were induced by various concentrations of short-size pure DNA, were stained by the Live/Dead BacLight Viability Kit, observed by confocal microscope and analyzed (Zen). Live (A, D, G), dead (B, E, H), and merged cells (C, F, I) in quadrant square images are shown (C). Representative data from more than three independent experiments are shown in the pictures.
Molecules 24 03131 g005
Figure 6. Biofilm formation of S. mutans by MVs. (A) MVs from S. mutans UA159 (UAWTMV), UA159.gtfBC (UABC-MV), GS-5(GSMV), and culture supernatant without MVs and >10 kDa (GSH) and <50 kDa (GSL) proteins from GS-5 were analyzed by SDS-PAGE, and the gel was stained by CBB. M: Protein markers. (B) Western blotting using anti-GTF antisera was performed after SDS-PAGE. (C) Biofilm formation of S. mutans UA159.gtfBC was observed in conditions with added MVs from UA159 and culture supernatant without MVs and >10 kDa and <10 kDa proteins from GS-5. (D) Biofilm formation of S. mutans UA159.gtfBC was observed in conditions with MVs from UA159 and S. mutans UA159.gtfBC. The data indicate the mean ± standard deviation (SD) of triplicate experiments. The independent experiments were performed three times, with similar results obtained each time. The asterisks indicate a significant difference between the two groups (*: p < 0.05, no MVs vs. MVs).
Molecules 24 03131 g006
Table 1. GTF-I and GTF-SI on biofilm formation in oral microorganisms.
Strains NoneUA159 MVsUA159.gtfBC MVsActivity
S. mitisATCC 9030.241 ± 0.0271.370 ± 0.101 *0.242 ± 0.048UP
ATCC 62490.411 ± 0.0450.432 ± 0.0820.473 ± 0.082
S. oralisATCC 350370.149 ± 0.0120.685 ± 0.079 *0.127 ± 0.002UP
S. sanguinisATCC 105561.147 ± 0.2562.029 ± 0.082 *1.430 ± 0.240UP
ST 2050.270 ± 0.0351.164 ± 0.221 *0.356 ± 0.044UP
ST 1340.175 ± 0.0060.255 ± 0.0440.160 ± 0.030
S. gordoniiATCC 105580.406 ± 0.0181.727 ± 0.341 *0.398 ± 0.005UP
S. anginosusATCC 333971.256 ± 0.2541.175 ± 0.0261.115 ± 0.581-
S. intermediusATCC 273350.153 ± 0.0100.330 ± 0.0700.150 ± 0.036-
S. pyogenesK330.289 ± 0.0110.377 ± 0.1820.358 ± 0.163-
K320.574 ± 0.1070.484 ± 0.0910.529 ± 0.330-
S. pneumoniaeGTC 2610.178 ± 0.0150.127 ± 0.0100.212 ± 0.133-
S. salivariusJCM 59070.492 ± 0.0180.584 ± 0.0200.566 ± 0.012-
ATCC 97590.124 ± 0.0210.299 ± 0.0700.163 ± 0.020-
HT9R0.222 ± 0.0290.277 ± 0.0050.244 ± 0.007-
A. naeslundiix6000.415 ± 0.0921.916 ± 0.582 *1.059 ± 0.423UP
A. orisMG11.087 ± 0.2222.264 ± 0.207 *0.998 ± 0.157UP
N. cinerea23-10.344 ± 0.0180.261 ± 0.0110.339 ± 0.011-
N. flavescensATCC 131200.353 ± 0.0120.231 ± 0.0440.376 ± 0.010-
N. mucosa16-21.889 ± 0.2601.333 ± 0.1331.590 ± 0.172DOWN
N. subflava#21.071 ± 0.1011.318 ± 0.2371.301 ± 0.208-
C. albicansSC53140.393 ± 0.0460.292 ± 0.0630.433 ± 0.181-
SC53120.178 ± 0.0290.288 ± 0.0490.171 ± 0.015-
S. aureusCowan I0.283 ± 0.0040.328 ± 0.0180.262 ± 0.043-
ATCC 6538P0.211 ± 0.0360.269 ± 0.0360.208 ± 0.010-

