Article

Preparation of SiO2-MnFe2O4 Composites via One-Pot Hydrothermal Synthesis Method and Microwave Absorption Investigation in S-Band

1
College of Science, Sichuan Agricultural University, Ya’an 625014, China
2
Key Laboratory of Space Applied Physics and Chemistry (Ministry of Education), School of Science, Northwestern Polytechnical University, Xi’an 710072, China
3
College of Mechanical and Electrical Engineering, Sichuan Agricultural University, Ya’an 625014, China
*
Author to whom correspondence should be addressed.
Molecules 2019, 24(14), 2605; https://doi.org/10.3390/molecules24142605
Submission received: 17 April 2019 / Revised: 29 June 2019 / Accepted: 17 July 2019 / Published: 17 July 2019

Abstract

:
MnFe2O4 NPs are successfully decorated on the surface of SiO2 sheets to form the SiO2-MnFe2O4 composite via one-pot hydrothermal synthesis method. The phase identification, morphology, crystal structure, distribution of elements, and microwave absorbing properties in S-band (1.55~3.4 GHz) of the as-prepared composite were investigated by XRD, SEM, TEM, and Vector Network Analyzer (VNA) respectively. Compared with the pure MnFe2O4 NPs, the as-prepared SiO2-MnFe2O4 composite exhibits enhanced microwave absorption performance in this frequency band due to the strong eddy current loss, better impedance matching, excellent attenuation characteristic, and multiple Debye relaxation processes. The maximum reflection loss of −14.87 dB at 2.25 GHz with a broader −10 dB bandwidth over the frequency range of 1.67~2.9 GHz (1.23 GHz) can be obtained at the thickness of 4 mm. Most importantly, the preparation method used here is relatively simple, hence such composite can be served as a potential candidate for effective microwave absorption in S-band.

1. Introduction

In recent decades, with the rapid development of military and commercial radars and other electronic equipment, the electromagnetic pollution has become one of serious problem following the water, air and noise pollutions [1,2,3,4]. Currently, the preparation of microwave absorbers with high absorption strength, wide absorption bandwidth, low cost, simple and efficient is a key of the research in microwave absorption materials (MAMs). Much attention has been focused on the microwave absorbing materials of magnetic metals [5,6], dielectric materials [7,8,9], conductive macromolecules [10,11], ferrites [12,13] and so on. In which the ferrites have been widely used as the microwave absorber due to the special magnetic property, high Curie temperature, thermo-stable, anti-abrasion, and lower cost etc. [14]. As a kind of magnetic recording materials, the MnFe2O4 is a common ferrite with spinel structure and has been used in the field of microwave absorption for the past few years [15]. Such as M.P. Reddy et al. [16] synthesized the MnFe2O4 ferrite by a facile hydrothermal route and then consolidated into dense nanostructured compacts by the spark plasma sintering technique, the magnetic analysis indicated that the MnFe2O4 ferrite showed ferromagnetic behavior and can be applied in the microwave absorbing area.
However, to the best of our knowledge, the microwave absorption performance of unilateral MnFe2O4 is unsatisfactory due to the single magnetic loss mechanism. Hence, the MnFe2O4 ferrite can be composited with other materials to improve its electromagnetic wave absorbing properties. Y. Wang et al. [17] synthesized Ag/MnFe2O4/RGO and characterized the morphology, microstructure, electromagnetic properties of as-prepared composite, the results displayed that the maximum reflection loss reaches −38 dB at 6 GHz with the thickness of 3.5 mm. X.J. Zhang et al. [18] prepared the RGO/MnFe2O4/PVDF composite under the ultrasonic treatment, the maximum RL of the hybrid can achieve −29 dB at the frequency of 9.2 GHz with 5 wt% content, and the effective bandwidth of RL < −10 dB is in the range of 8~12.88 GHz. S.H. Hosseini et al. [19] synthesized polythiophene nanofibers coated MnFe2O4/Fe3O4 core-shell nanoparticles via co-precipitation and in-situ polymerization, the maximum microwave absorption of the product is −21 dB at 12 GHz. Y. Wang et al. [20] decorated the MnFe2O4 nanoparticles on the surface of reduced graphene oxide through a simple hydrothermal method, the maximum reflection loss of MnFe2O4/RGO composite is −32.8 dB at 8.2 GHz, and the absorption bandwidth with the RL below −10 dB is between 7.2~12 GHz. R.V. Lakshmi et al. [21] prepared the PMMA modified MnFe2O4-polyaniline nanocomposites with enhanced microwave absorption properties in the frequency range of X-band. H. Wang et al. [22] synthesized the MnFe2O4/wood composite by using a solvothermal method through a bottom-up pathway, the as-prepared hybrids exhibited an effective microwave absorption and the maximum reflection loss reached −12 dB at 15.52 GHz. S.H. Hosseini et al. [23] also prepared a PANI/MnFe2O4 nanocomposite with the core-shell structure, a maximum reflection loss of −15.3 dB was observed at 10.4 GHz.
In conclusion, it is not difficult to find that the most existing research results of MnFe2O4-based composite are mainly focused in the range of the 2~18 GHz, and the microwave absorption performance of which would be much worse in the low frequency of S-band. However, the working frequency range of many radars has been extended to S-band and the radiant frequency of microwave generated from much electronic equipment used in our daily life is also seated in this range. Hence, the development of MnFe2O4-based composite with strong absorption ability in this band is intensively demanded [24,25].
In this work, the SiO2 sheets were introduced to composited with MnFe2O4 nanoparticles (denoted as MnFe2O4 NPs henceforth) via hydrothermal synthesis method. Therefore, the values of permeability and permittivity in composite can be modified to suitable range for enhancing the impedance matching properties of the absorber, which is very helpful to reinforce the microwave absorption of ferrite. The phase identification, morphology, crystal structure, distribution of elements and microwave absorbing properties in S-band of the as-prepared composites were investigated, the samples can obtain enhanced electromagnetic absorption performance in this frequency band compared with pure MnFe2O4 ferrite. It is believed that such composite can be served as a potential candidate of microwave absorber in the frequency range of S-band.

2. Results and Discussion

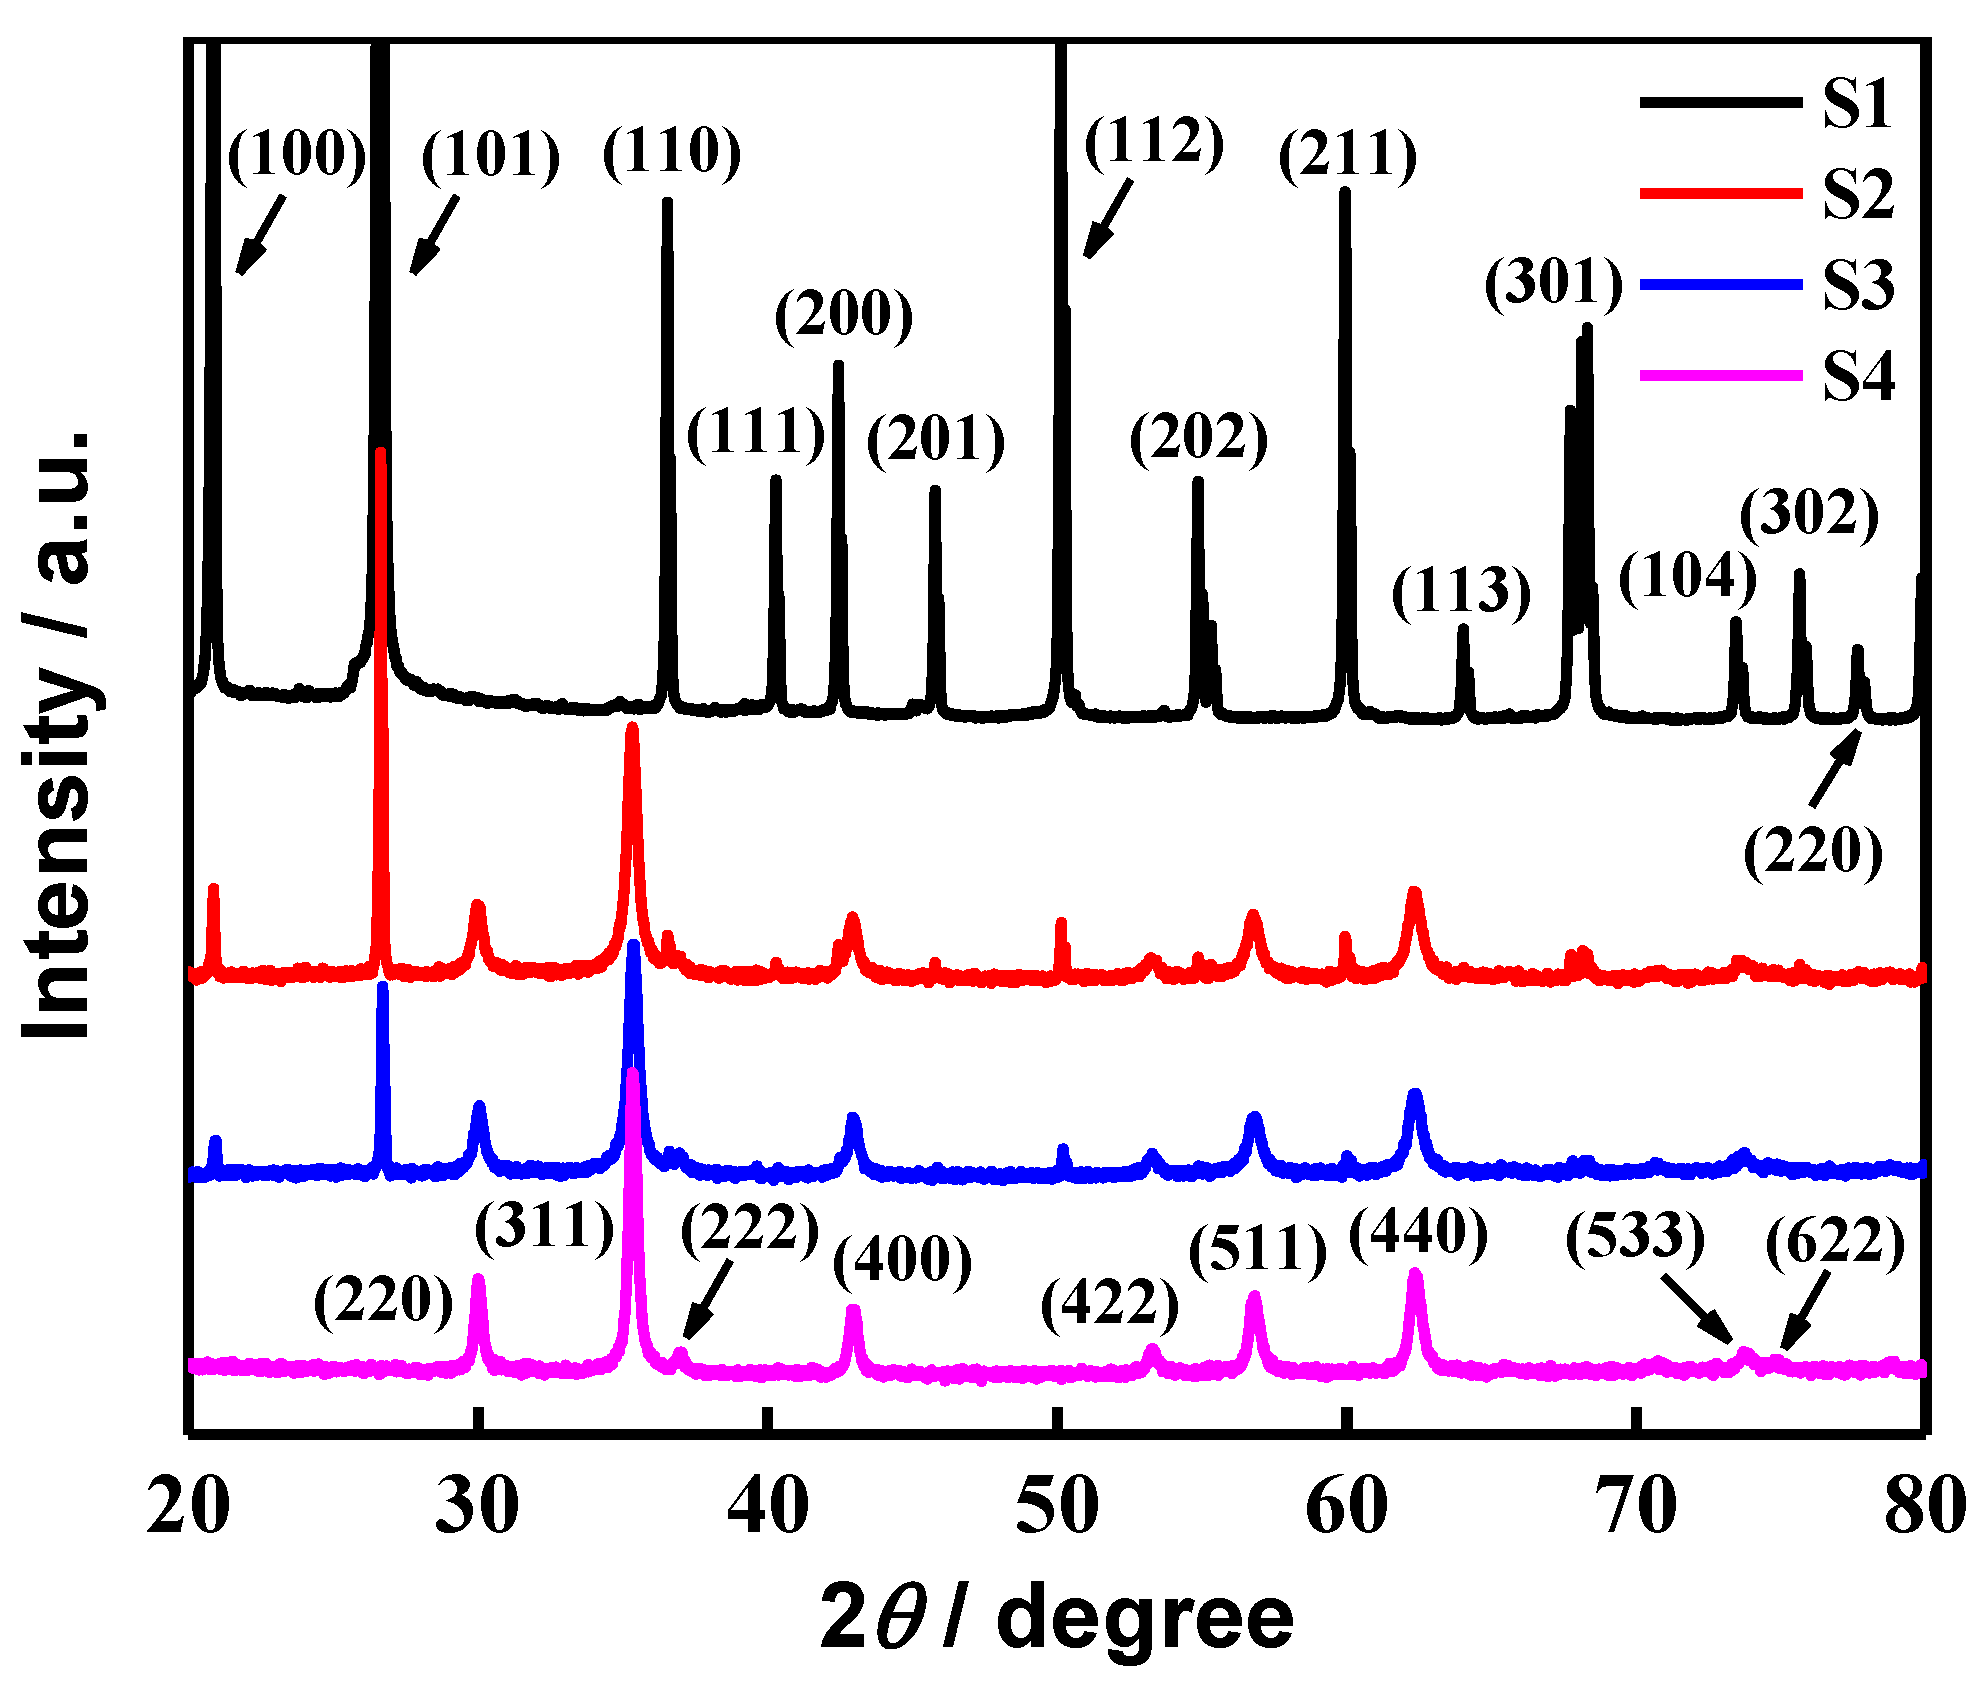
Figure 1 displays the X-ray diffraction patterns of S1, S2, S3, and S4 samples. The characteristic diffraction peaks of S1 at 2θ = 20.86°, 26.64°, 36.54°, 40.30°, 42.45°, 45.79°, 50.14°, 54.87°, 59.96°, 64.03°, 68.32°, 73.47°, 75.66°and 77.67° are assigned to the (100), (101), (110), (111), (200), (201), (112), (202), (211), (113), (301), (104), (302) and (220) planes of SiO2 reported in the standard card (JCPDS card no.46-1045). Also, the diffraction peaks of S4 at 2θ = 29.71°, 34.98°, 36.65°, 42.53°, 52.74°, 56.20°, 61.66°, 72.92° and 73.93° are in good agreement with the (220), (311), (222), (400), (422), (511), (440), (533) and (622) planes of MnFe2O4 reported in the standard card (JCPDS card no. 10-0319), confirming the spinel structure of this ferrite. Moreover, it shows that the characteristic diffraction peaks in S2 and S3 samples corresponding to both SiO2 sheets and MnFe2O4 ferrite can be seen clearly, and no other diffraction peaks corresponding to impurities can be found as well, which indicates that the SiO2 sheets are composited well with the MnFe2O4 ferrite.
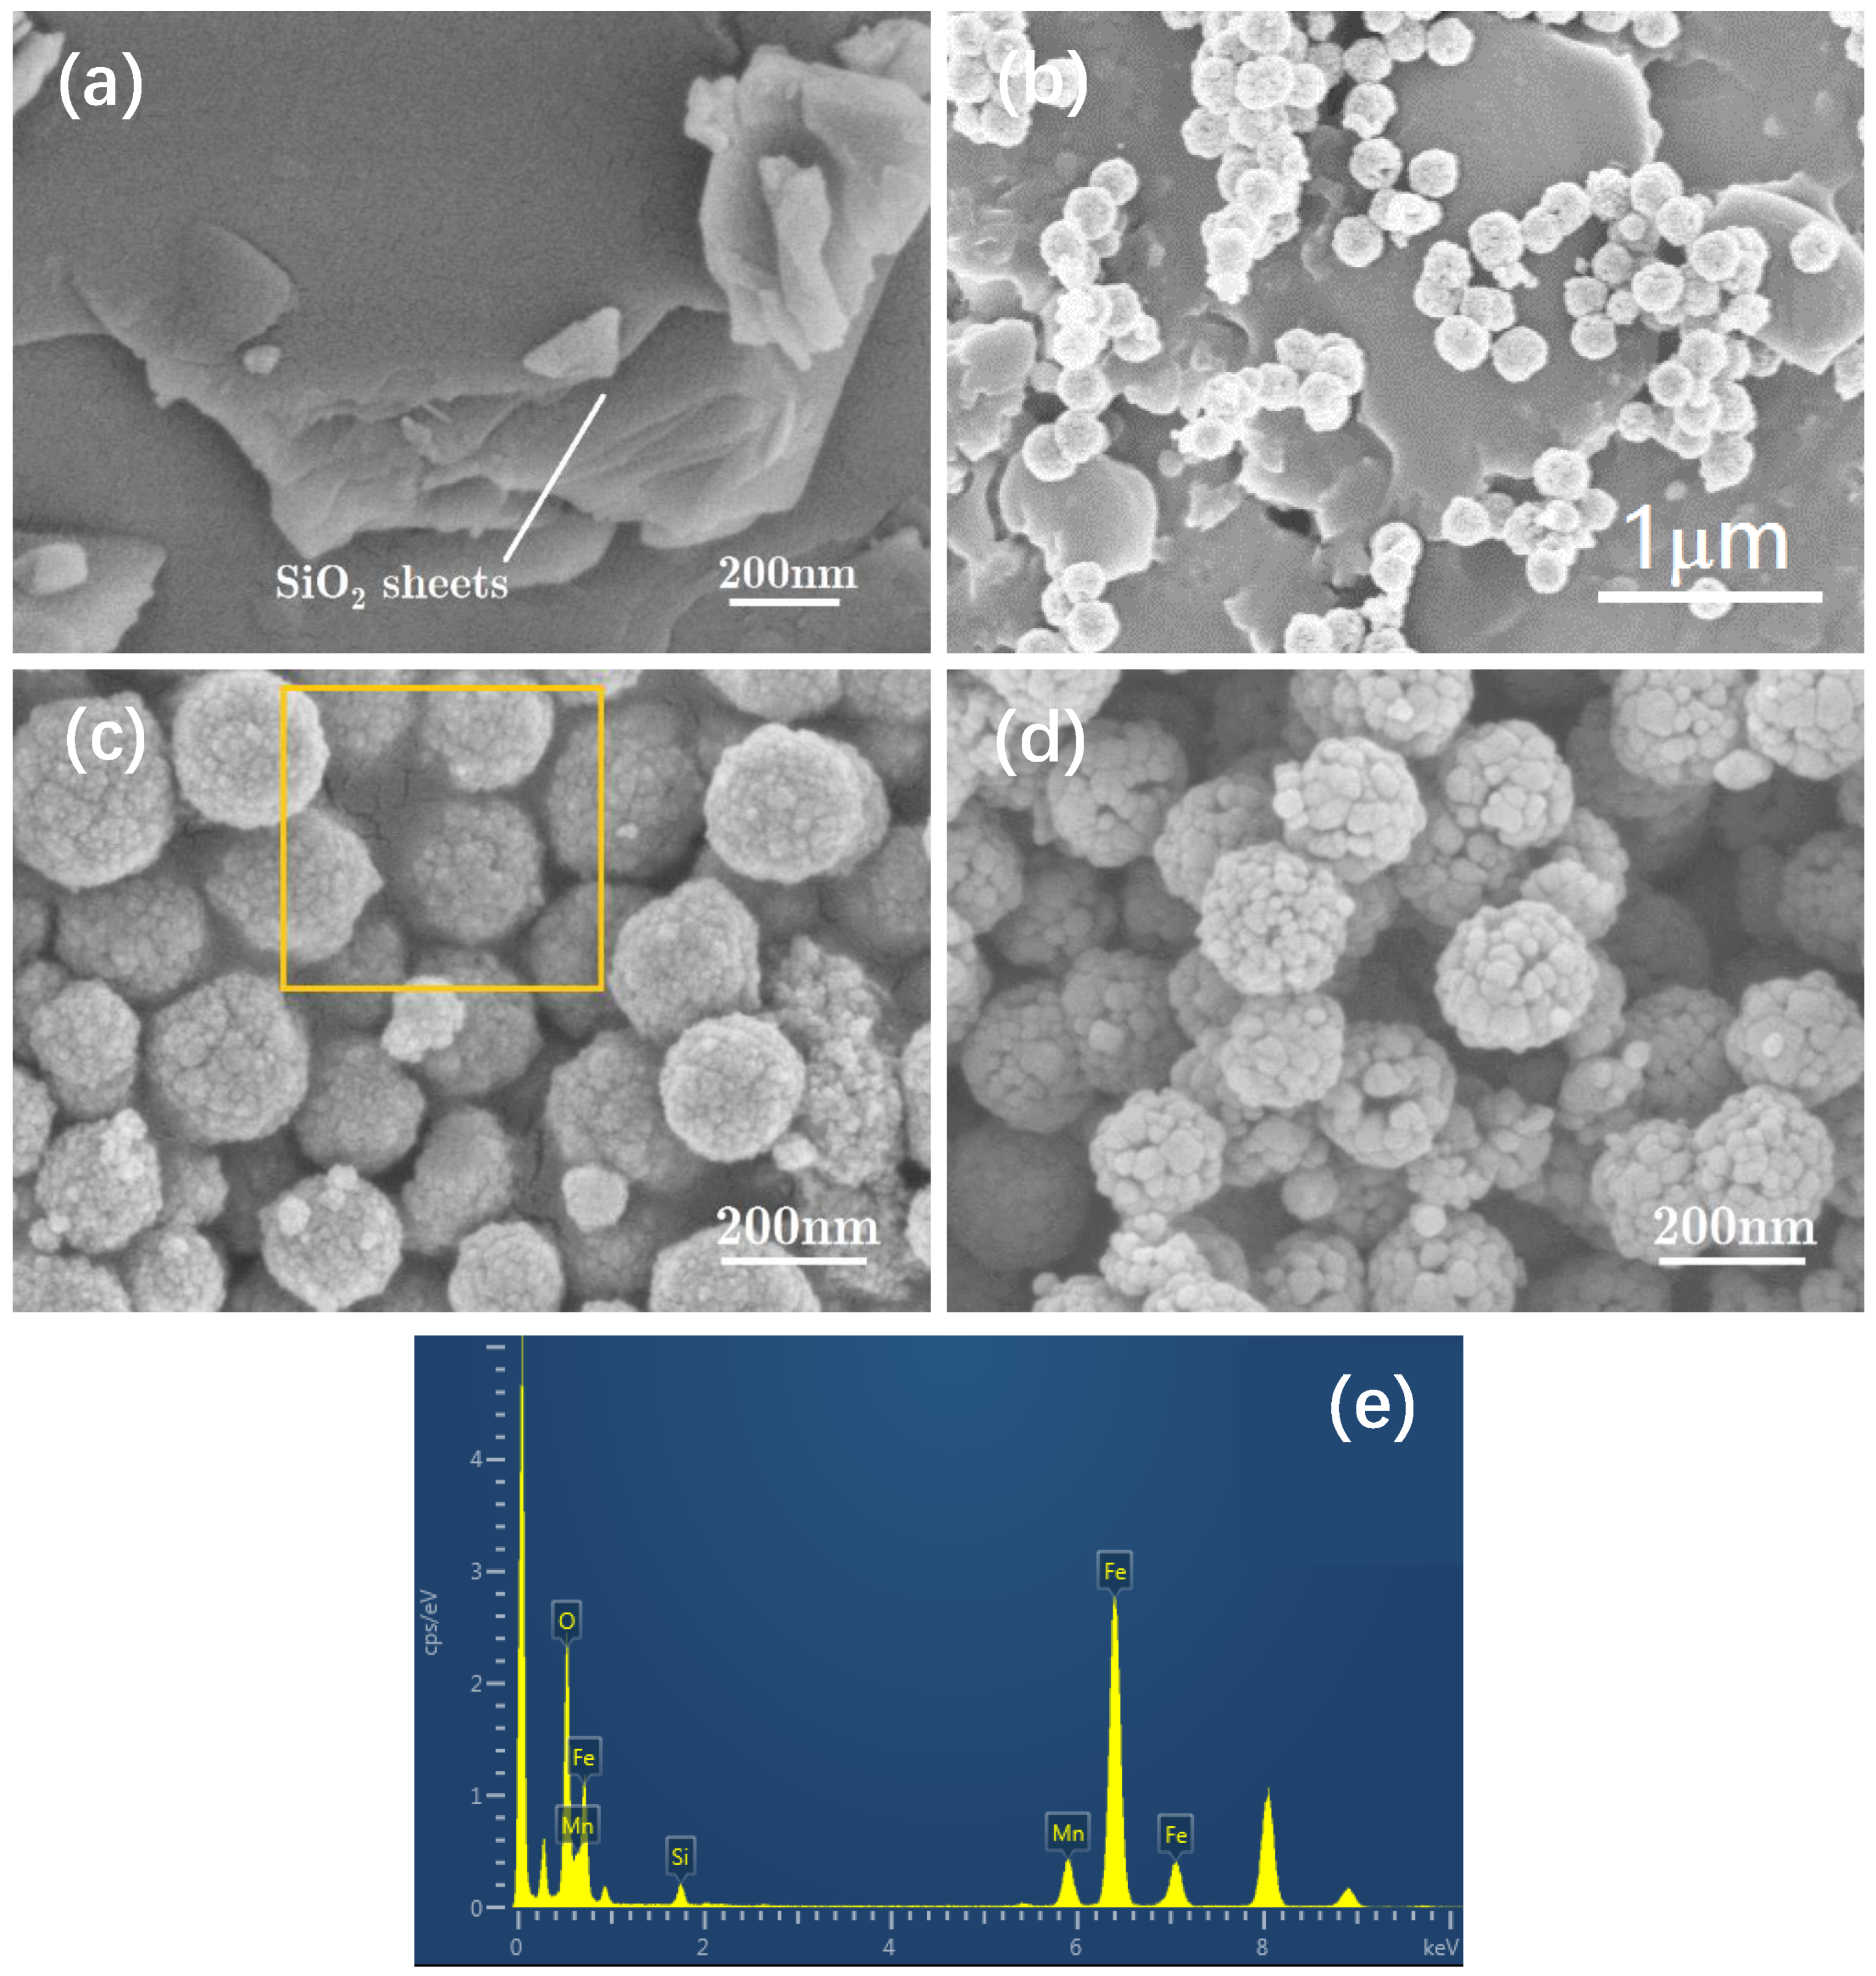
The microstructures of S1, S2, S3, and S4 are characterized by SEM and shown in Figure 2. It indicates that the raw silica presents a stacked lamellar structure in Figure 2a, while the fine MnFe2O4 NPs exhibits a rough ball-like structure with different particle sizes, and the average size of which is ~150 nm. As shown in Figure 2b, the ferrite NPs are adhered on the surface of SiO2 sheets and hard to cover the whole surface in general for the excessive silica content added. However, in the case of lower silica content, the ferrite NPs coated the surface of SiO2 sheets well, and even seems to be embedded into the surface as shown in the square region of Figure 2c. This tight bond between the two components is conducive to enhance the interfacial polarization effect of absorption materials, indicating that the S3 sample may have good microwave absorbing performance. Besides, it is interesting to note that the pure MnFe2O4 NPs in Figure 2d are consist of many smaller nanoparticles and stacked up together to form the loose structure. Moreover, the Energy Dispersive Spectrometer (EDS) of S3 sample was given in Figure 2e, suggesting the existence of Mn, Fe, O and Si elements in the composite, which can further confirm the possible associativity of SiO2 and MnFe2O4 NPs to a certain degree.
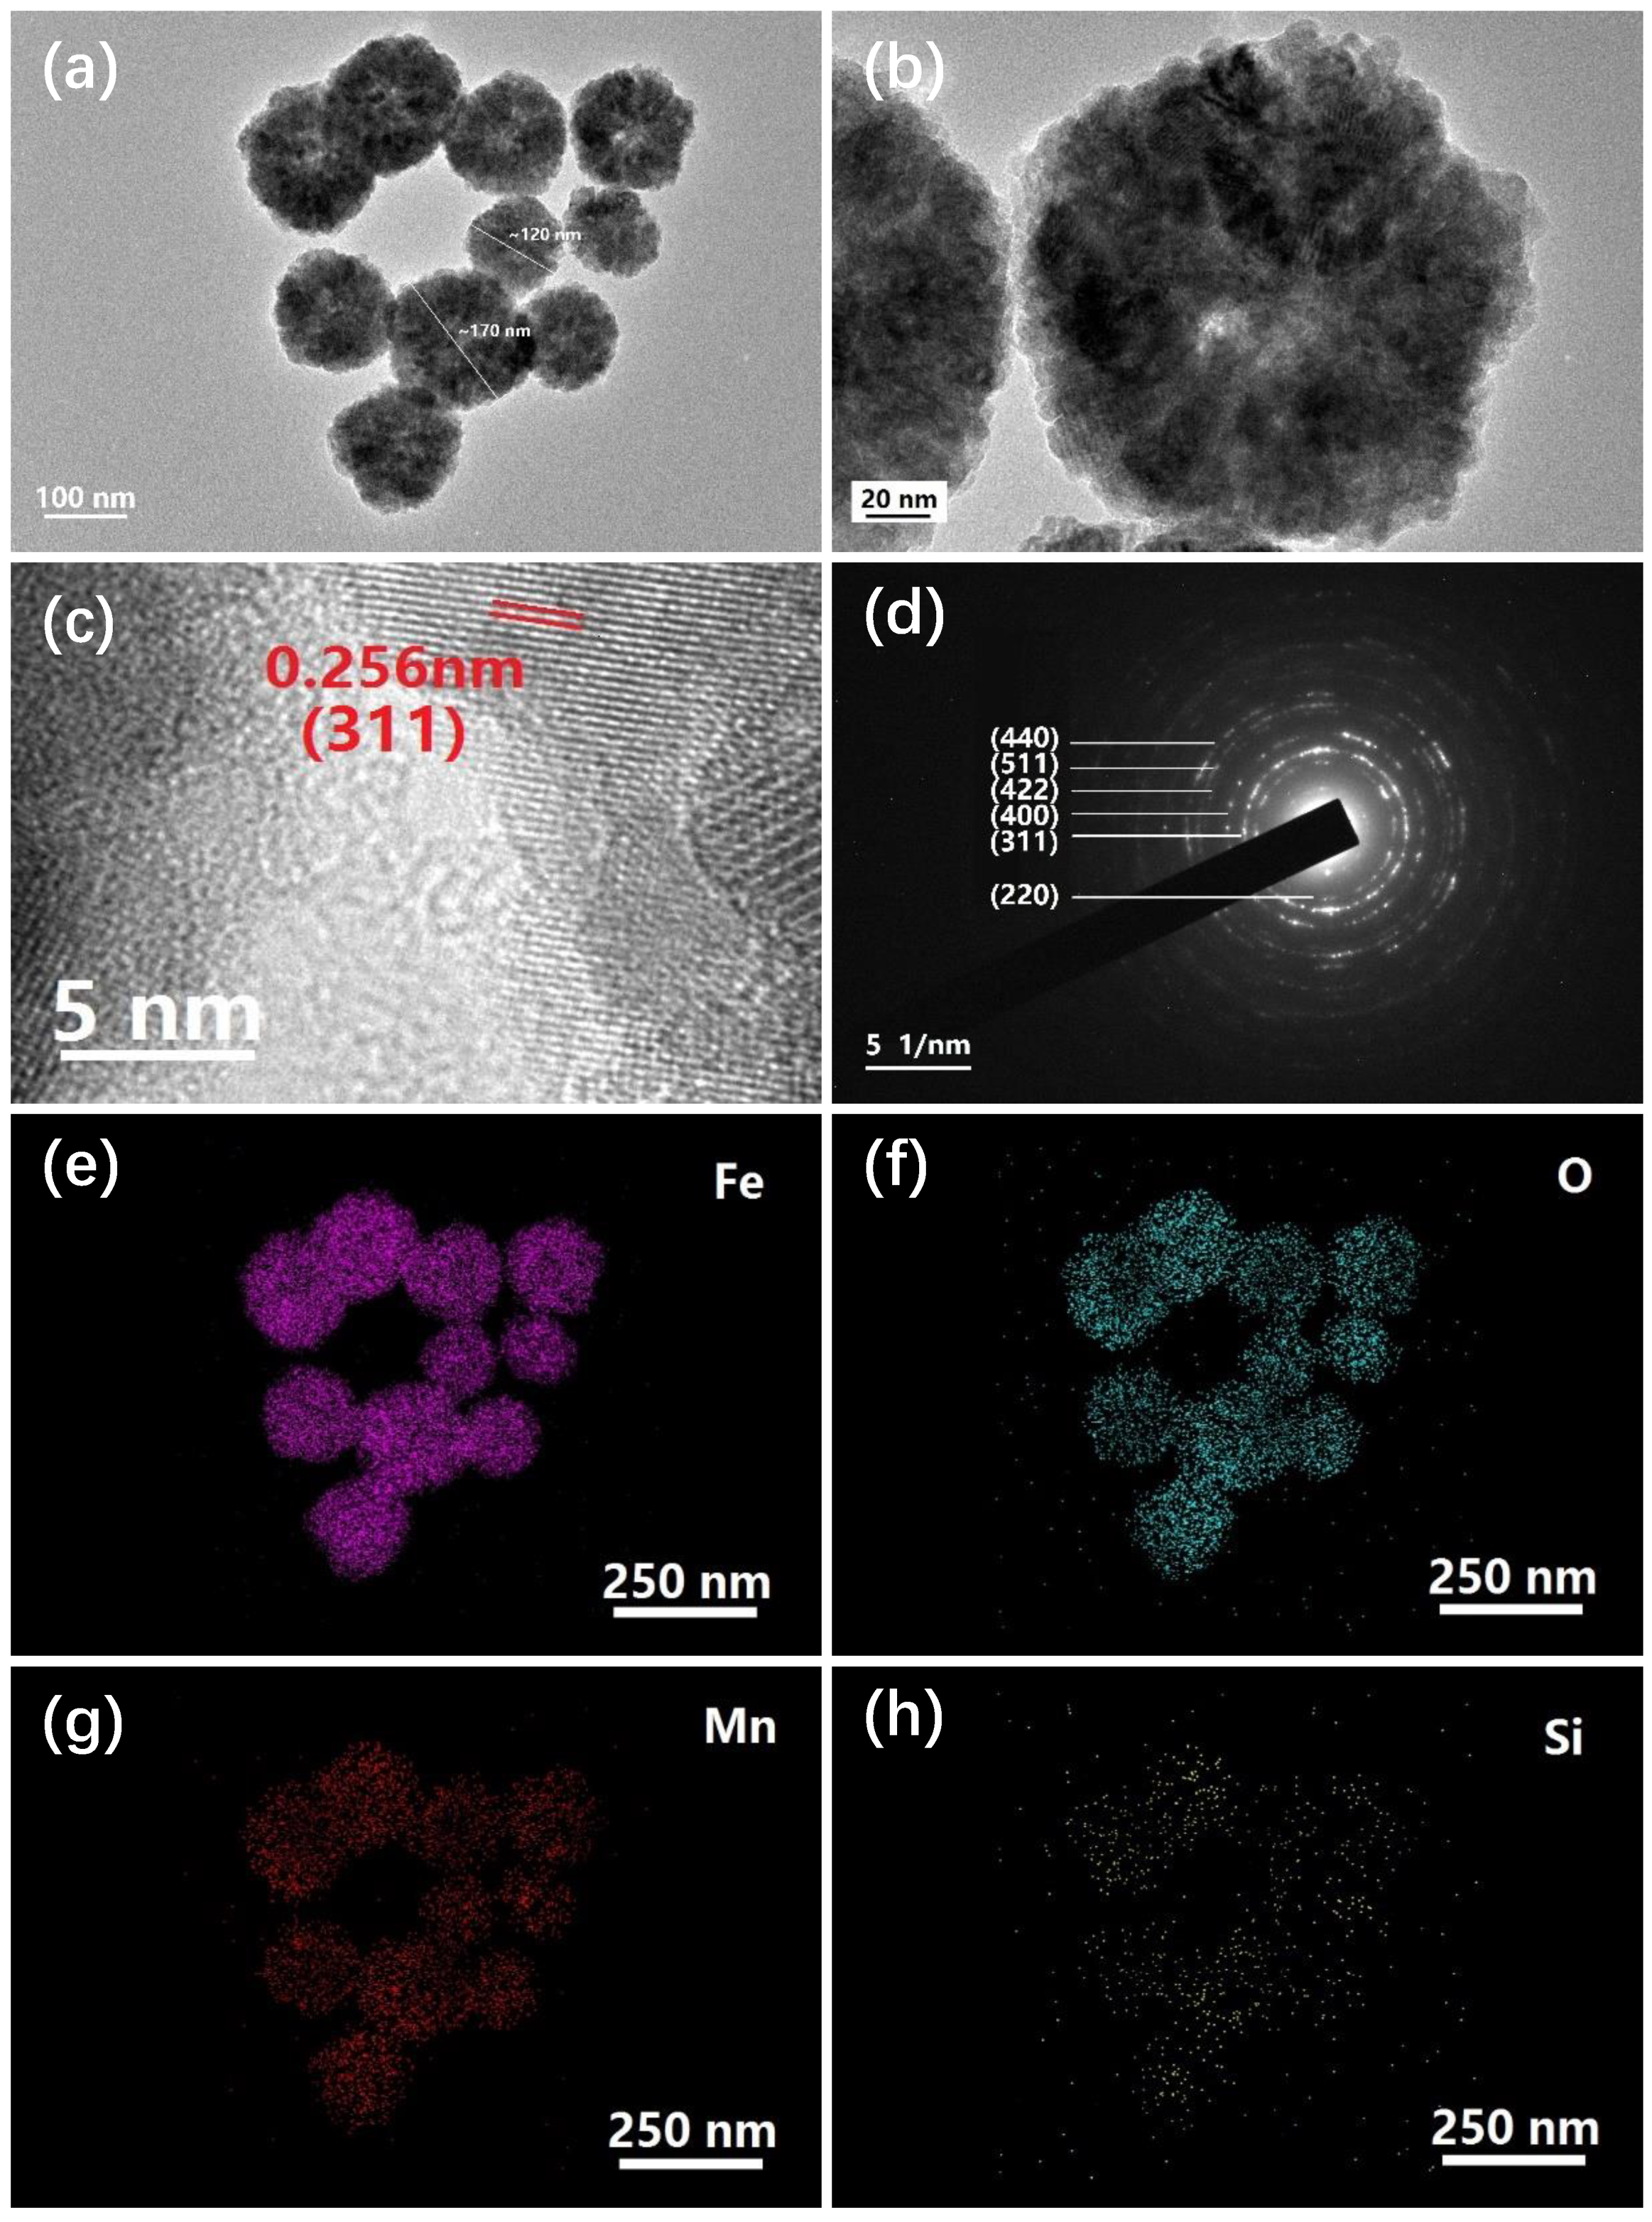
The transmission electron micrograph was used to further analyze the characteristics of NPs in S3 sample, as shown in Figure 3a, typical MnFe2O4 NPs show a diameter range of 120~170 nm and some of which appear to be hollow as shown in Figure 3b, each particle is made up of many smaller micro-crystals with different orientations. The HR-TEM image presented in Figure 3c exhibits clear lattice fringes with a spacing of 0.256 nm, which is corresponding to the interplanar spacing of (311) plane in NPs, indicating that the well crystalline nature of MnFe2O4 NPs. Figure 3d shows the selected area electron diffraction pattern of NPs, it describes some diffraction rings from inside to outside, which are assigned to the (220), (311), (400), (422), (511) and (440) planes of NPs respectively, further confirming the polycrystalline properties of NPs. Furthermore, the distribution of elements on NPs can be determined from the corresponding elemental mapping images from Figure 3e~h, the NPs are mainly consist of Mn, Fe and O elements, the small quantity of Si element is diffused from SiO2 sheets, and the distribution area of which is slightly larger than the other elements.
In order to investigate the microwave absorption property of as-prepared samples, the microwave reflection loss (denoted as RL henceforth) is calculated according to the transmission-line theory, which can be defined with the following equations [26,27]:
R L = 20 log | Z i n Z 0 Z i n + Z 0 |
where Zin is the input impedance and can be expressed as:
Z i n = Z 0 μ r ε r tanh ( j 2 π f d c μ r ε r )
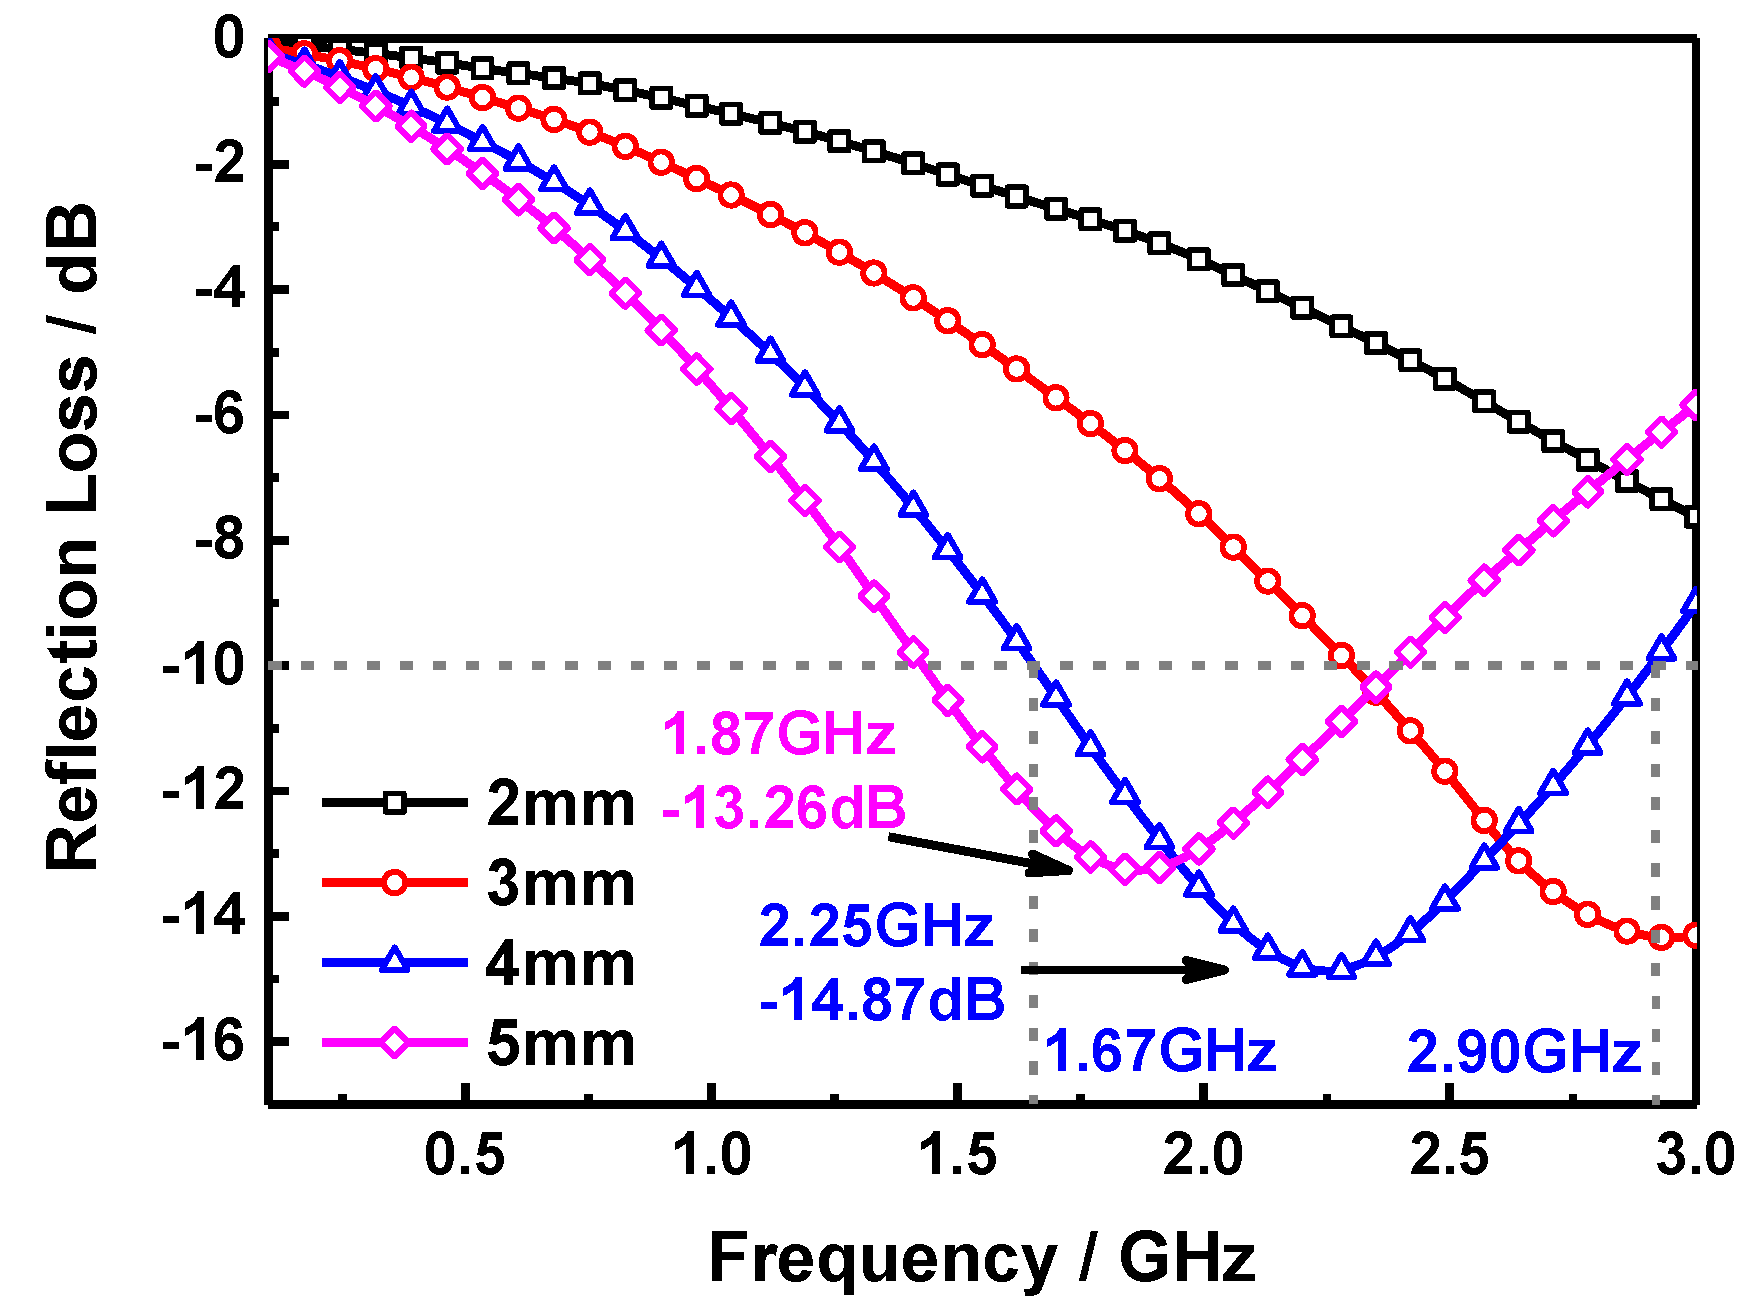
where, εr is the complex permittivity, μr the complex permeability, c the velocity of light in vacuum, d the thickness of samples, f the frequency and Z0 the impedance of air. Figure 4 shows the RL curves of S1, S2, S3, and S4 samples at a thickness of 5 mm, it can be seen that the microwave absorption performance of pure SiO2 sheets i.e., S1 sample is relatively limited and the maximum RL value is −7.50 dB at 2.67 GHz, which is due to the weak dielectric loss ability of SiO2. This situation will be improved as the SiO2 sheets are composited with the MnFe2O4 ferrite, the maximum RL value of S2 sample with the SiO2 mass content of 25 wt% reaches −8.93 dB at 2.70 GHz, for the single magnetic loss absorption of MnFe2O4 NPs is slightly stronger than the former, and the maximum RL of S4 is −10.14 dB at 2.26 GHz. It is interesting to note that the microwave absorption performance can be enhanced significantly in S3 sample i.e., the SiO2 mass content is 12.5 wt%. The maximum RL of which is −13.26 dB at 1.87 GHz with a −10 dB absorption bandwidth over the frequency range of 1.43~2.39 GHz (0.96 GHz). It indicates that the suitable composite ratio of SiO2 sheets and MnFe2O4 ferrite endows the sample a better impedance matching property and the excellent synergistic effect of dielectric loss and magnetic loss mechanisms. Furthermore, the interfacial polarization and associated relaxation between SiO2 sheets and MnFe2O4 can reinforce the dielectric loss as well [28]. These are all very helpful to improve the microwave absorption ability of absorber. As we all know that when the RL is below −10 dB, above 90% microwave energy will be dissipated during the transmission process in composites, thus the S3 sample possesses a good electromagnetic wave absorption performance in the S-band. Figure 5 shows the RL curves of the S3 sample at different thicknesses, it suggests that there is none obvious absorption peak can be observed in the measurement range as the thickness is 2 mm, and the maximum RL value is −7.63 dB at 3 GHz. However, the absorption peak appears gradually with the increase of thickness in sample, the absorption peak intensity of S3 achieves −14.33 dB at 2.94 GHz and the effective absorption bandwidth corresponding to the RL below −10 dB is focus in the range of 2.3~3 GHz (0.7 GHz) when the thickness of sample is 3 mm. Besides, it can be noted that the absorption peak intensity is enhanced only a little to −14.87 dB at 2.25 GHz as the thickness further added to 4 mm, however, the absorption bandwidth below −10 dB has been greatly increased, which is focus in the range of 1.67~2.9 GHz (1.23 GHz), this is superior to the microwave absorption property of sample with the thickness of 5 mm, and can cover the most of S-band. Moreover, it indicates that the RL peak moves to a lower frequency domain as the thickness of absorber increased, which is owing to the quarter-wavelength resonance effect [29]:
f = n c 4 d | μ r | | ε r |
Where, εr and μr are the complex permittivity and permeability of samples, d the thickness of absorber, c the velocity of light in free space. Thus, the corresponding frequency of the lowest RL peak shifts to a lower frequency when the thickness of the microwave absorbing material increased.
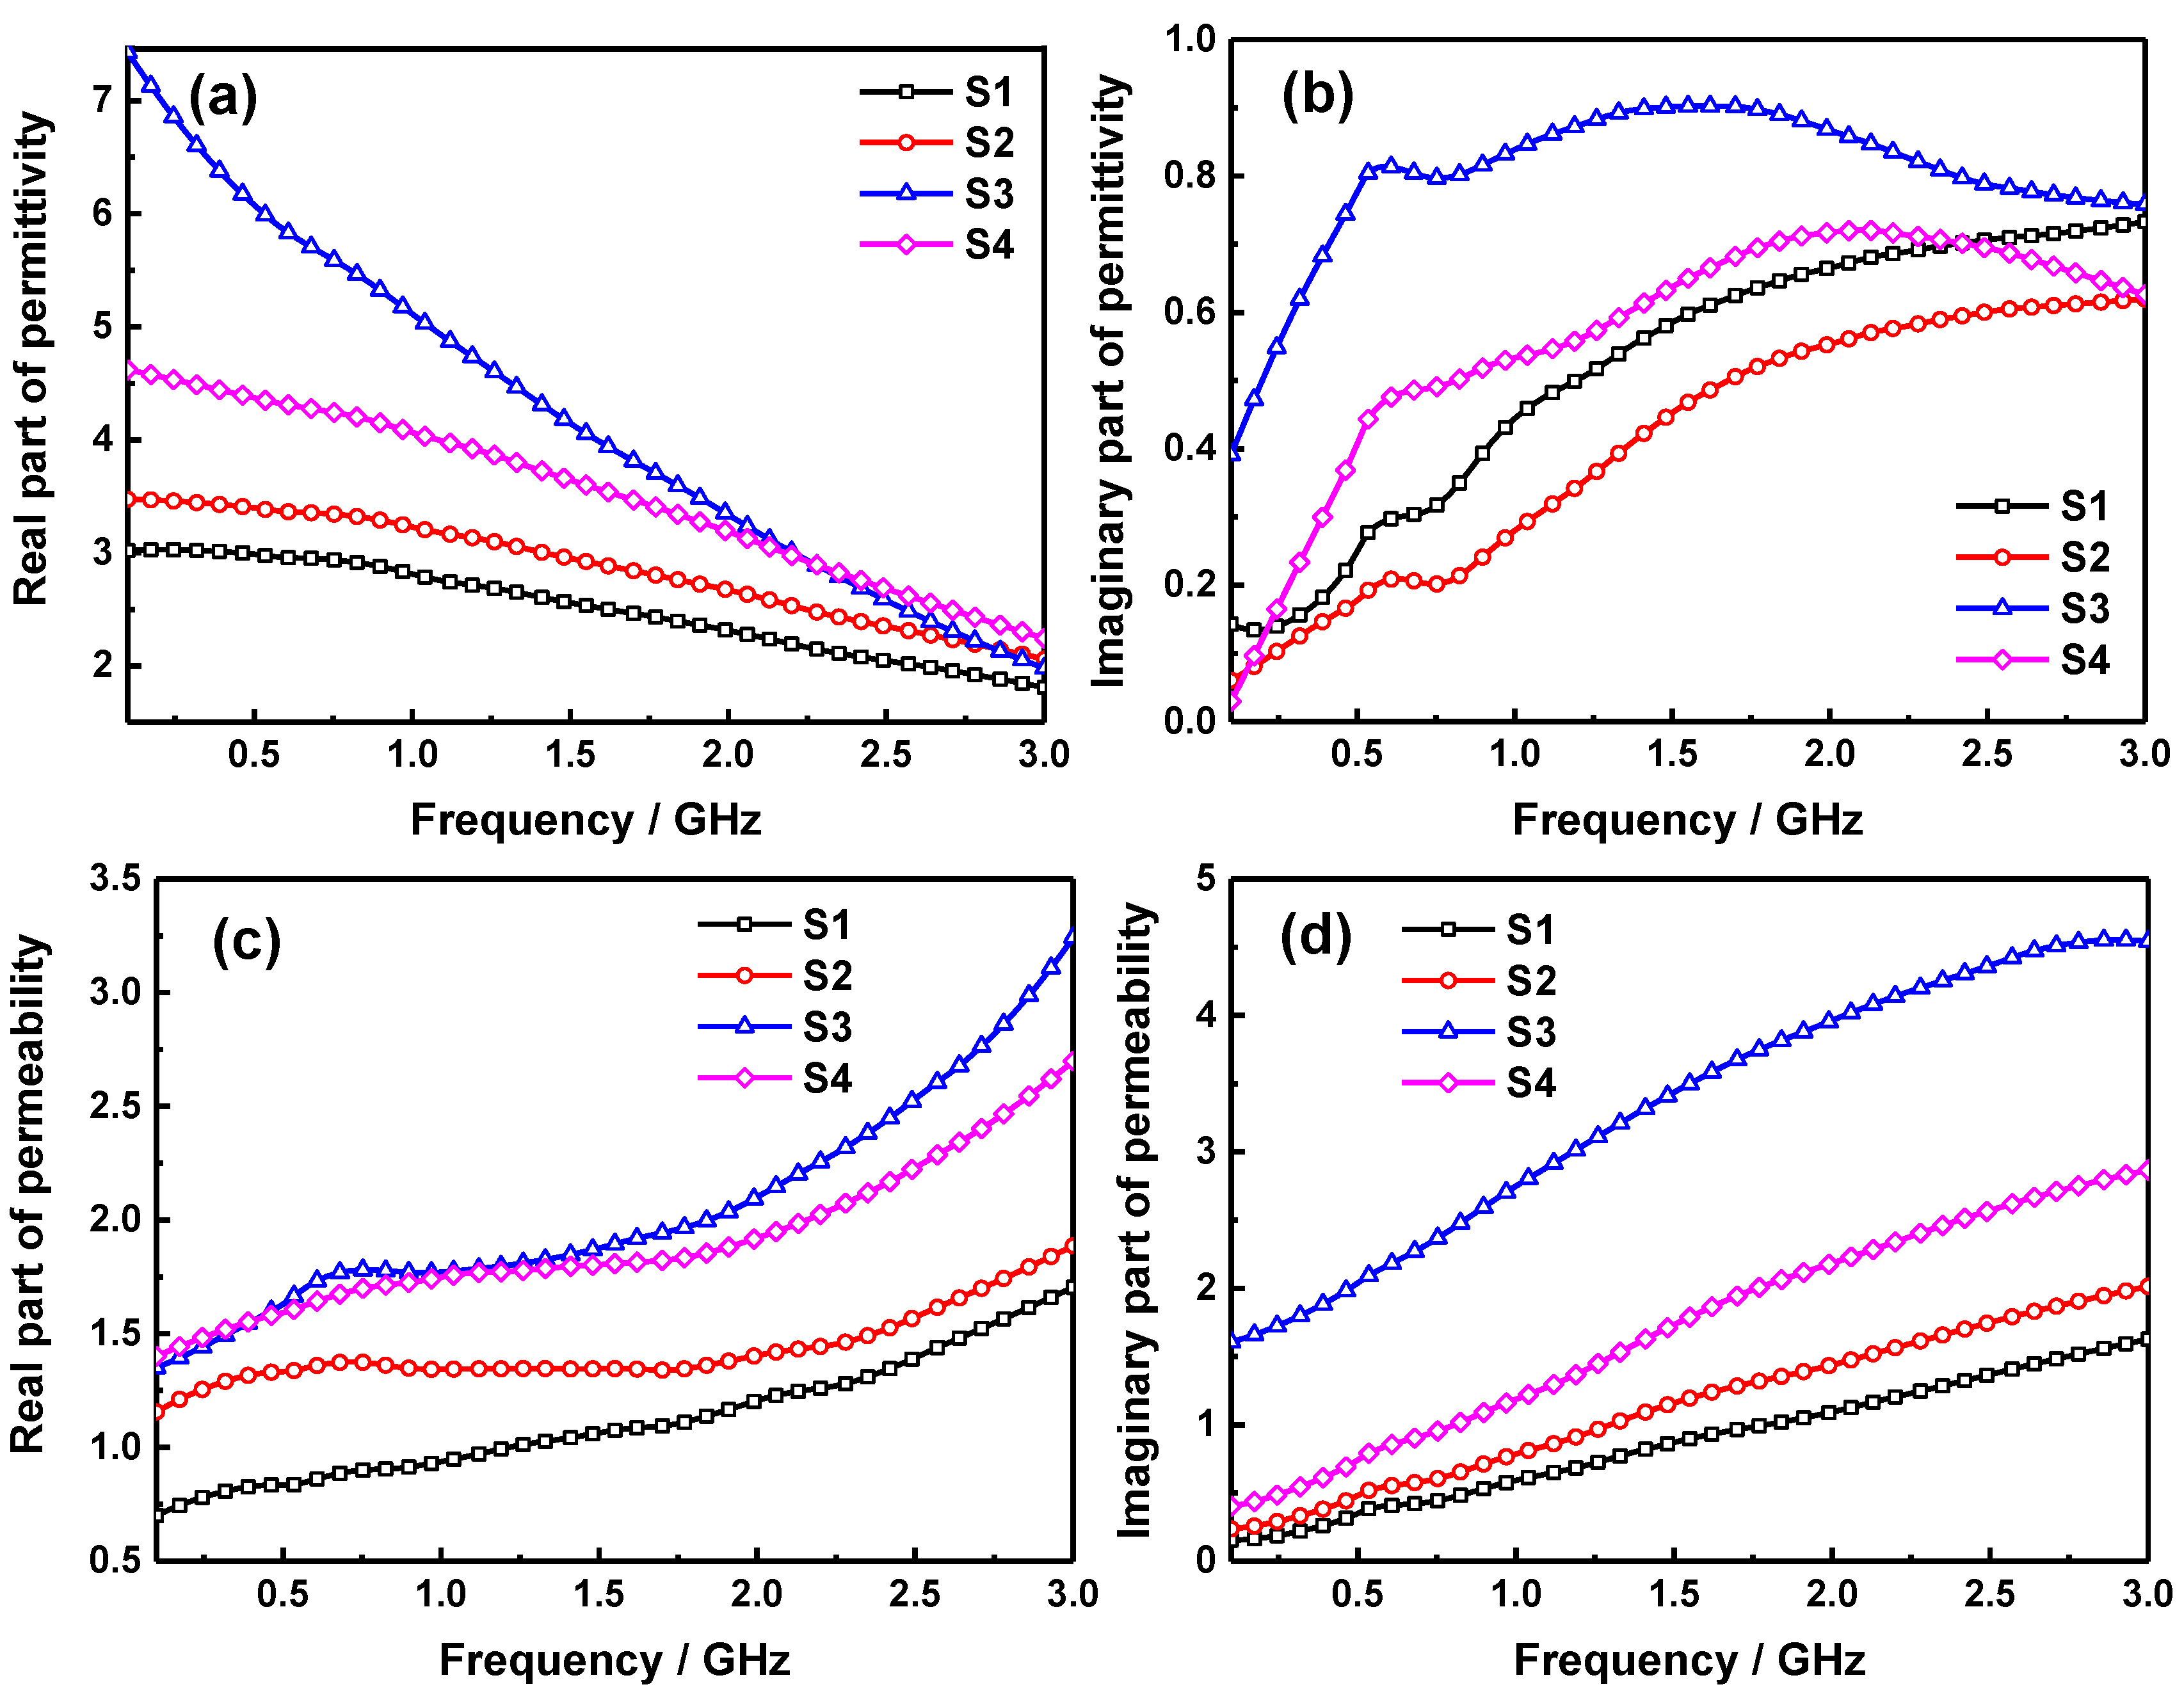
In order to investigate the possible microwave absorption mechanisms, the frequency dependent complex permittivity and permeability of various samples were measured in the range and shown in Figure 6. As shown in Figure 6a, it can be seen that the real part of permittivity of S1, S2, S3, and S4 are all decreasing gradually with the increase of frequency in the measurement range. The ε′ of S1, S2 and S4 varies between 3.02~1.81, 3.47~2.06 and 4.62~2.24 respectively, which is heightened for the increase of MnFe2O4 content. However, the real part of permittivity of S3 is obviously higher than other three samples, especially in the low frequency domain, which varies from 7.43 to 1.98, indicating that the suitable doping of SiO2 in pure MnFe2O4 ferrite can be beneficial to heighten the ε′ of sample. While, in Figure 6b, the imaginary part of permittivity of S1 increases as the frequency increased, and the ε″ of S2 sample is lower than that of S1 during the entire frequency range in spite of ε″ of pure ferrite S4 is slightly larger than S1. It is interesting to note that the imaginary part of permittivity of S3 is obviously larger than those of other samples in the whole frequency range. This may be owing to the interfaces and defects generated from the recombination process of SiO2 and MnFe2O4 under the optimum ratio, thus the more polarization and related relaxation could be initiated around these interfaces and defects, which can further increase the imaginary part of permittivity in S3 sample. In general, the real part of permittivity represents the storage capacity of the microwave energy in absorbing materials, nevertheless the imaginary part of permittivity represents the energy loss ability [30]. Hence, the S3 sample may have an excellent microwave absorption performance in this frequency range. Moreover, the permittivity of sample in gigahertz range is closely related to its interfacial polarization and inherent dipole polarization, due to some resistance inside the material, the dipole reversal always can’t keep up with the speed of the electromagnetic field during the increase process of frequency, this will lead to the typical frequency dependent dielectric property of permittivity [31]. It can be seen from Figure 6c that the real part of permeability of S1, S2, S3, and S4 are all increasing continuously with the enhance of frequency, and it is heightened with the increase of ferrite content for the magnetic properties of the MnFe2O4 NPs. Moreover, the μ′ value of S3 is slightly greater than S4 in the high frequency part, this is ascribed to the fact that the dispersion and independence of MnFe2O4 NPs are greatly enhanced as the nanoparticles are embedded into the laminar SiO2 sheets, which is beneficial to exhibit the quantum scale effect of fine particles to enlarge the μ′ of S3. Furthermore, the change tendency of imaginary part of permeability in Figure 6d is mainly the same as that of the real part of permeability, however, the μ″ of S3 is much larger than pure MnFe2O4 ferrite, indicating that a higher magnetic loss property of the sample. As we all know that the imaginary part of permeability presents the magnetic loss ability of sample in general [32], and the natural resonance of magnetic loss can be expressed by the following equation [33]:
2 π f r = γ H a
H a = 4 | K 1 | 3 μ 0 M s
Here, Ha is the anisotropy energy, |K1| the anisotropic coefficient, μ0 the permeability in a vacuum, Ms the saturation magnetization and γ the gyromagnetic ratio. On one hand, the anisotropy energy of nano-size materials would be remarkably increased due to the surface anisotropic field by the small size effect. On the other hand, the suitable compound proportion in S3 sample is also helpful to enhance its anisotropy energy. These are all beneficial to improve the magnetic loss of S3 sample.
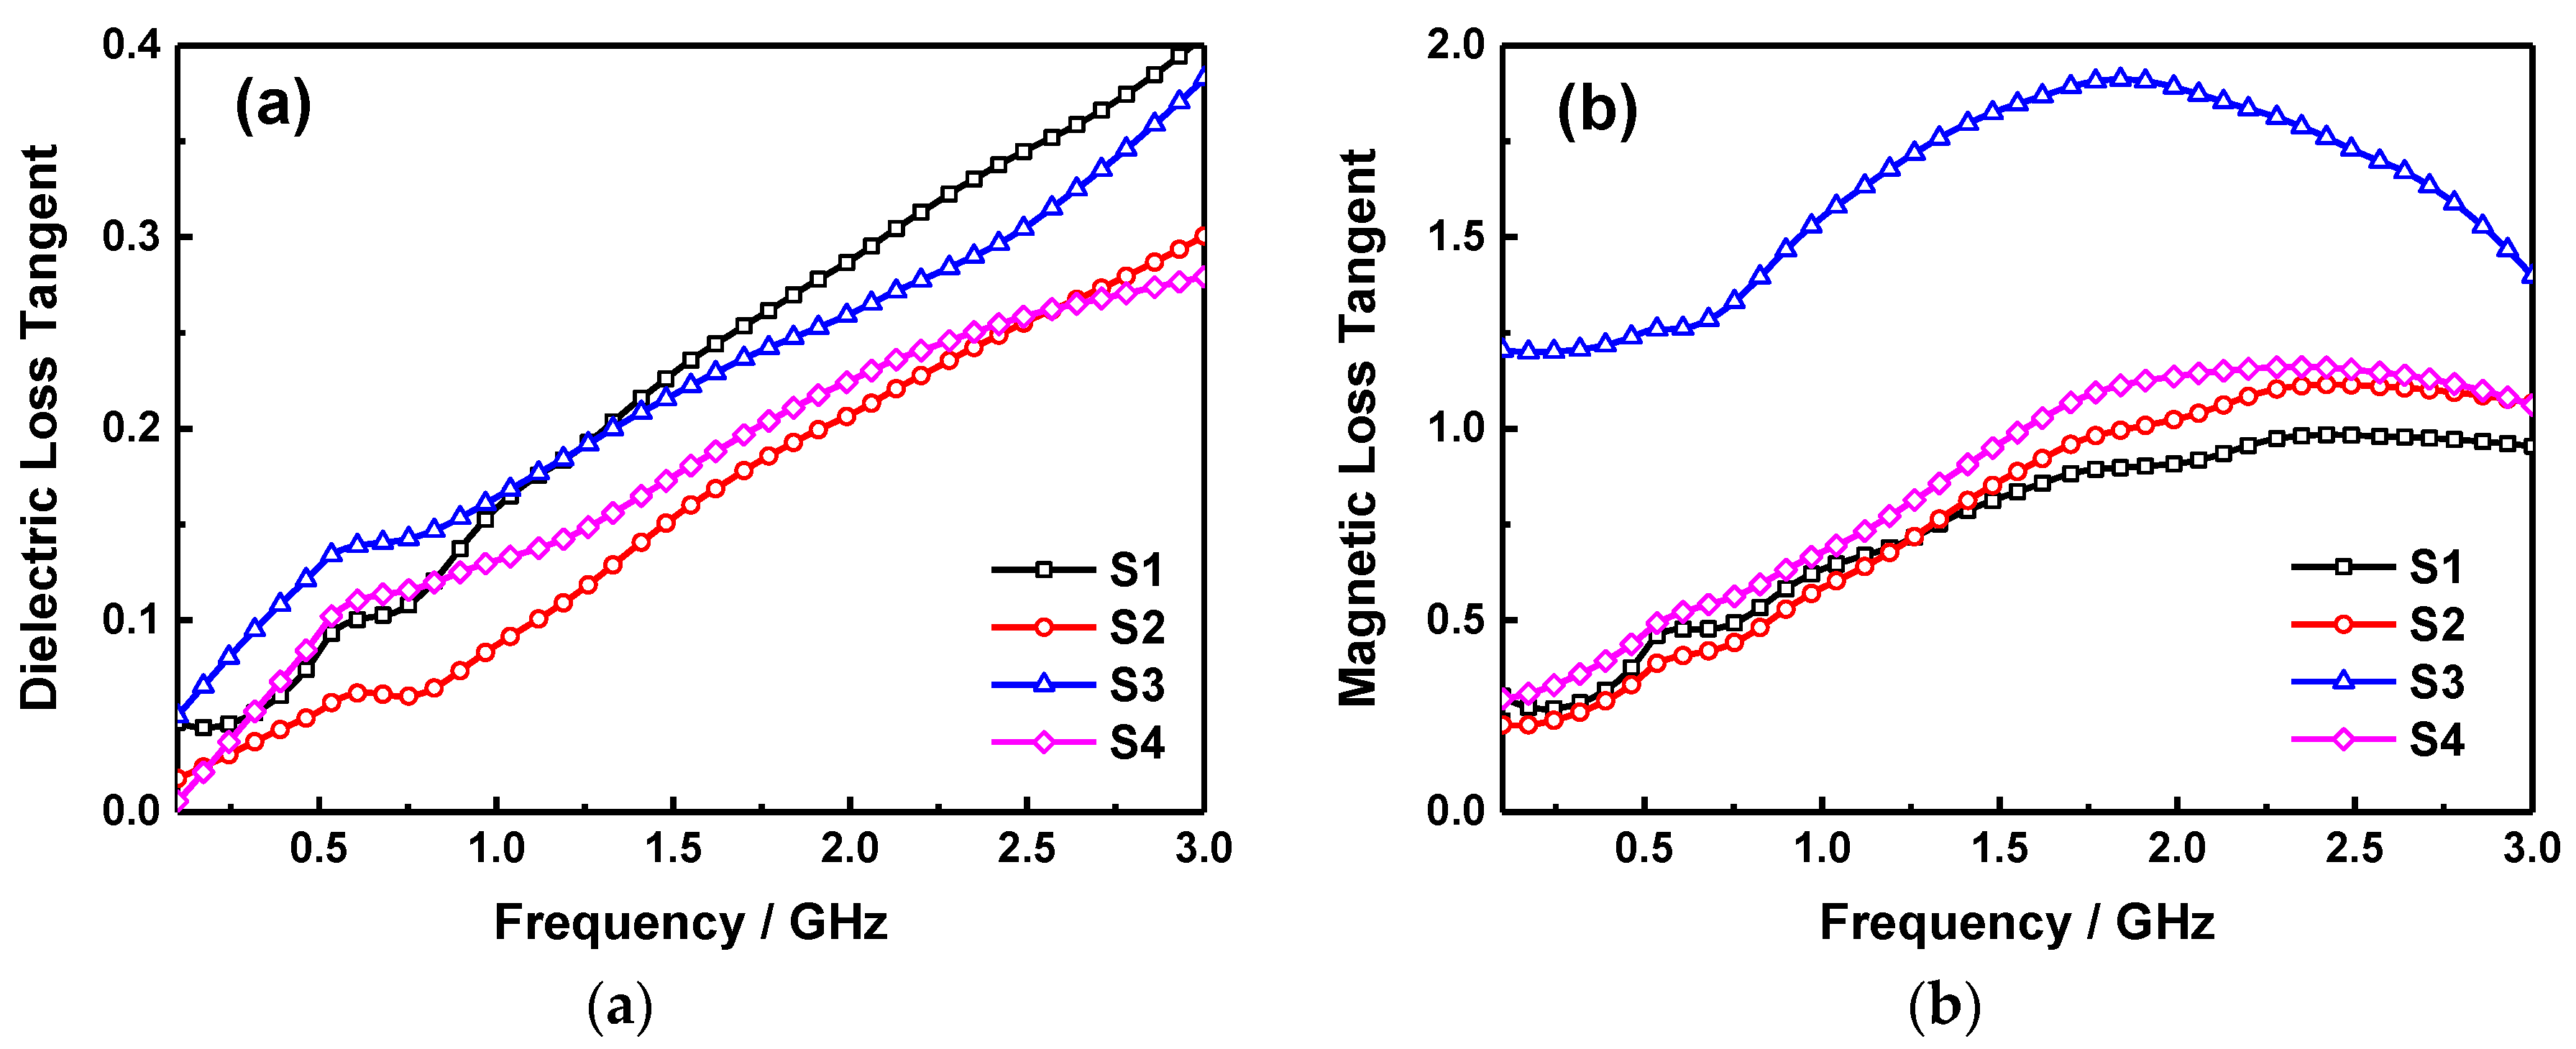
The dielectric and magnetic loss tangent of S1, S2, S3, and S4 samples can be calculated according to the permittivity and permeability measured above, which are shown in Figure 7. In Figure 7a, it indicates that the dielectric loss of the samples are all increasing as the frequency increased, which is relatively higher in the S1 than that of S4 for its dielectric property of raw SiO2 sheets, particularly in the high frequency domain. Although the dielectric loss in sample will recede as the two components composited together, however, the value of S3 get a slight boost in the low frequency part, it varies from 0.05 to 0.38 during the whole testing frequency range. As shown in Figure 7b, the magnetic loss of S1, S2 and S4 are enhanced with the increase of ferrite content, and mainly between 0.27~0.98, 0.23~1.11 and 0.29~1.16 respectively, moreover, there is an obvious peak value can be observed in the measurement range. While, the μ″ of S3 is significantly higher than other samples with a peak value of 1.91, indicating that the better magnetic loss property for microwave absorption of S3 sample, this is due to the reason mentioned above i.e., embedded structure of NPs in the sheets and enhanced anisotropic energy to improve the natural resonance of magnetic loss. In addition, it can be found that although the dielectric and magnetic loss are both contribute to the microwave absorption of samples, the effect of magnetic loss is more obvious for the relatively higher values.
Usually, the magnetic loss of ferrite mainly originates from hysteresis loss, eddy current loss, natural resonance loss and domain wall resonance loss. However, the domain wall resonance loss mainly occurs in the frequency range of megahertz, and the hysteresis loss is too weak to be neglected within a feeble field [34]. Hence, the natural resonance loss and eddy current loss are the most probable reasons for the electromagnetic absorption in gigahertz range, in which the eddy current loss can be expressed as follows [35]:
μ 2 π μ 0 ( μ ) 2 σ d 2 f / 3
Here, σ is the electrical conductivity, μ0 the permeability in a vacuum. Hence, C0 can be expressed as follows [36]:
C 0 = μ ( μ ) 2 f 1 2 π μ 0 σ d 2 / 3
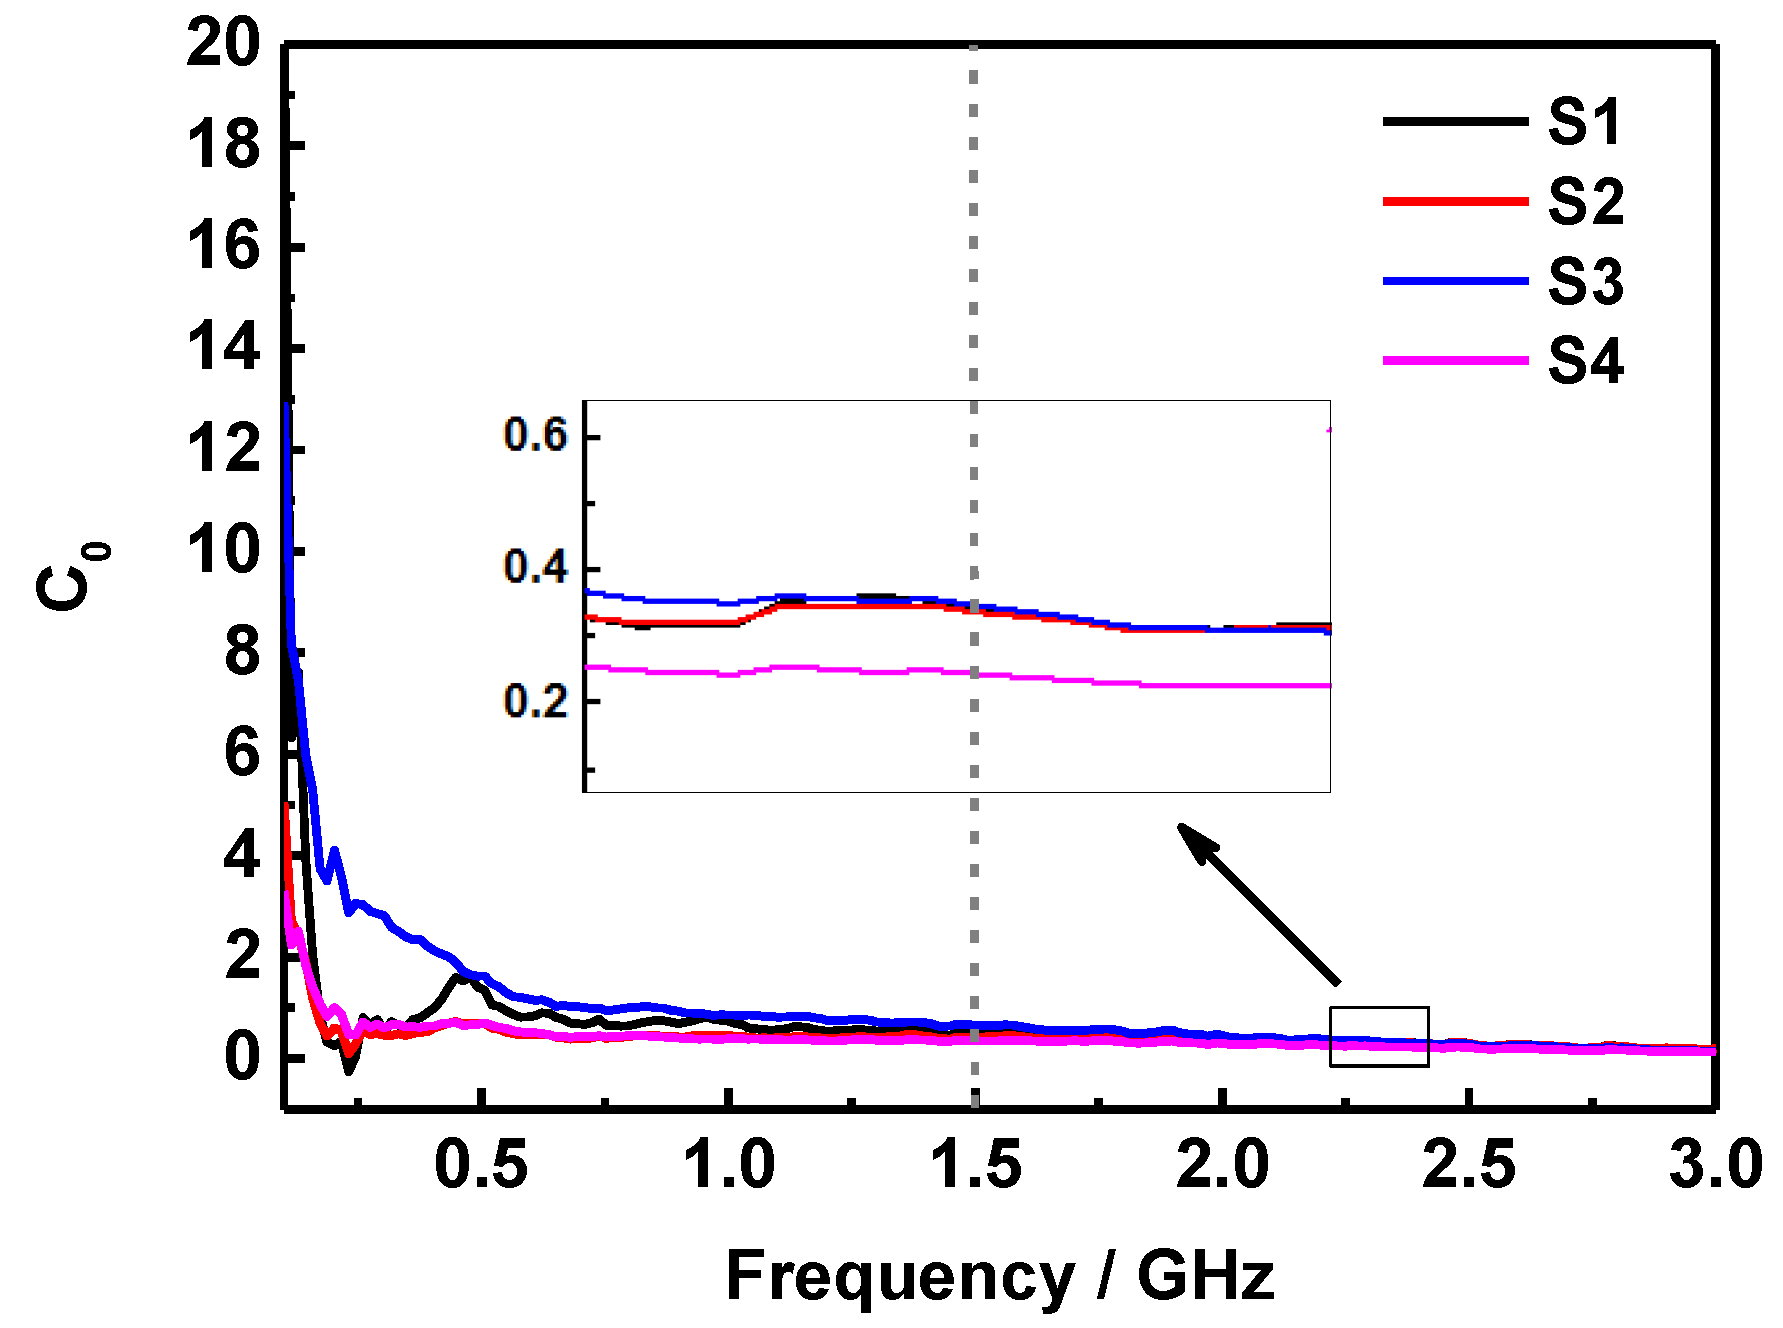
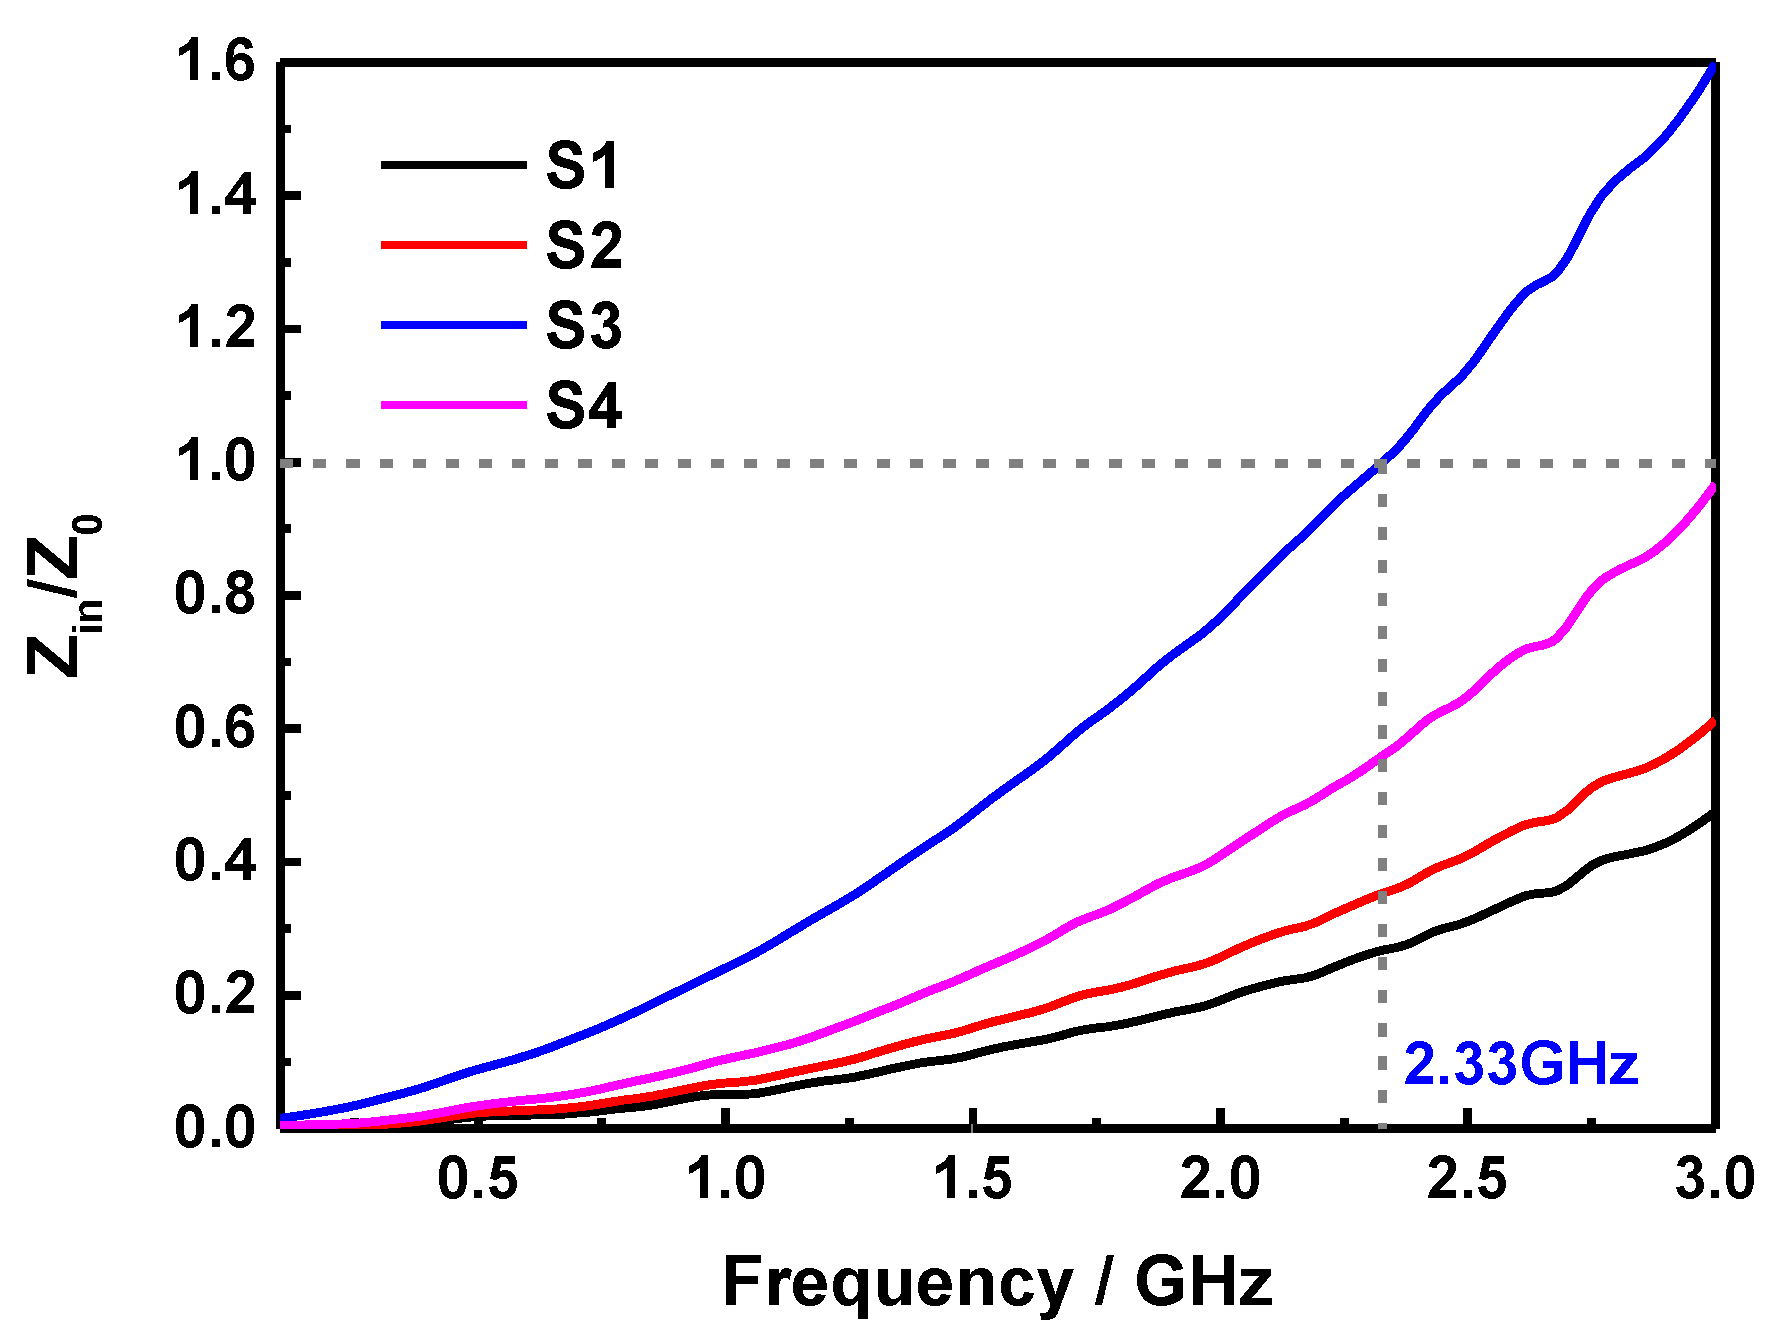
If the reflection loss comes from the eddy current loss, the values of C0 will keep the constant when the frequency varies. Figure 8 shows the frequency-dependent C0 curves of S1, S2, S3, and S4 at the thickness of 4 mm. It can be noted that the value of C0 is almost constant in the frequency range of 1.5~3 GHz, confirming that the samples possess an obvious eddy current loss for the microwave energy absorption in this range. While, the magnetic loss in 0.1~1.5 GHz is mainly caused by the natural resonance, and the proper content of SiO2 sheets in S3 is conducive to enhance this effect. Moreover, the Zin/Z0 values of S1, S2, S3, and S4 with a thickness of 4 mm were calculated and shown in Figure 9. In principle, the perfect impedance matching demands that the value of Zin/Z0 is equal to 1, thus there is none reflection of microwave at the front surface of absorber can be realized [37,38]. As shown in Figure 9, it can be observed that the Zin/Z0 value of S3 sample with a layer of 4 mm is closer to the free space at about 2.33 GHz, while that of other samples are far lower than 1 in the range of 0.1~3 GHz, indicating that the excellent microwave absorption performance of S3 in the above frequency range, and more microwaves will transmit into the absorber to be dissipated.
The attenuation constant α is another important parameter related to the RL of samples, which determines the attenuation properties of microwave absorbing materials and can be determined according to the following equation [39,40]:
α = 2 π f c × ( μ ε μ ε ) + ( μ ε μ ε ) 2 + ( μ ε + μ ε ) 2
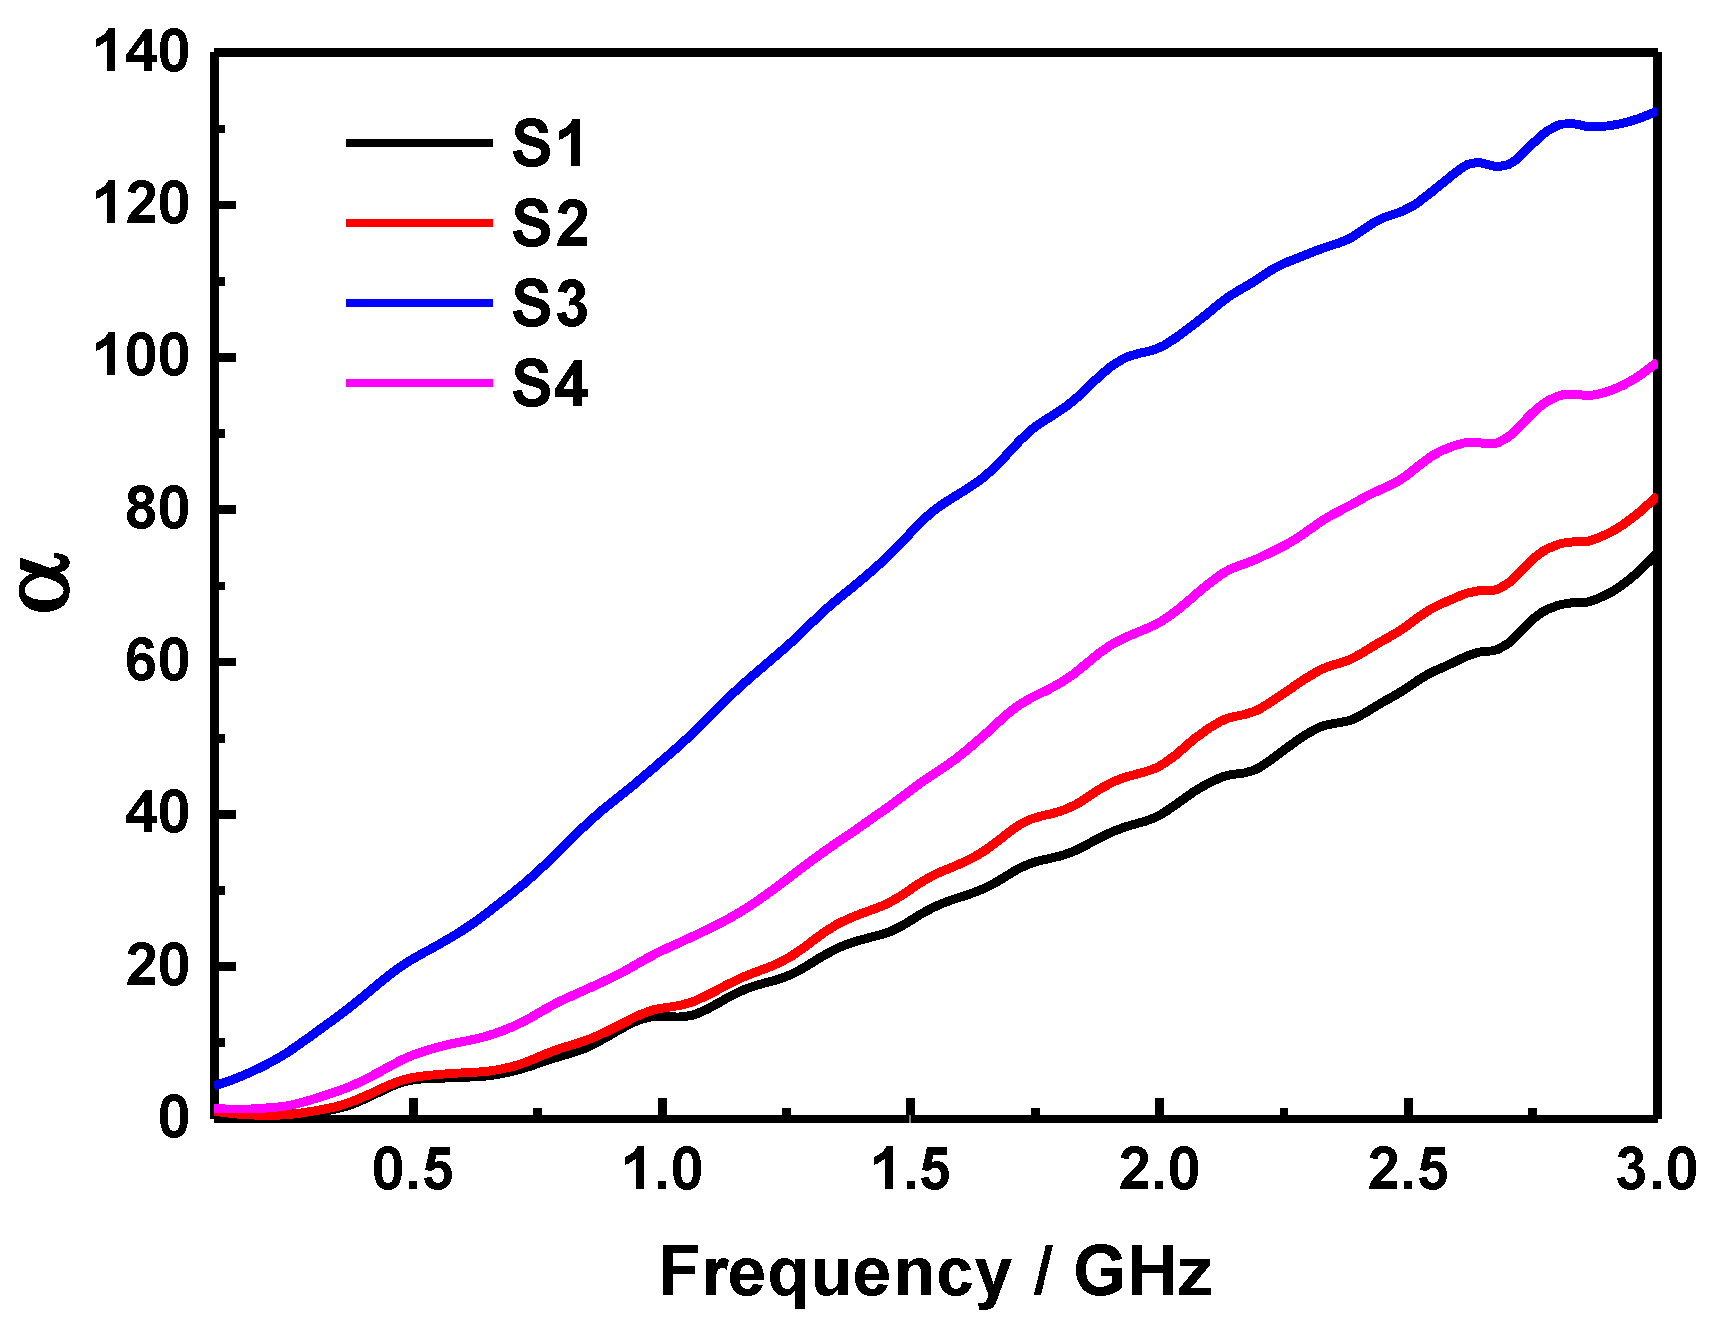
Figure 10 displays the attenuation constants of S1, S2, S3, and S4 at the thickness of 4 mm. It shows that the α is enhanced as the frequency increased in each sample, and that of S1 sample is the lowest among all the samples for its relatively lower imaginary part of permeability. In addition, the α of samples are strengthened with the increase of ferrite mass content, however, the S3 sample have a greater α than other samples in the whole frequency range owing to its higher values of ε″ and μ″, indicating that the outstanding attenuation characteristic is highly conducive to the electromagnetic wave absorption performance of the sample. Furthermore, the Debye dipolar relaxation is also an important factor for the dielectric loss of microwave absorber, according to the Debye theory the relationship between ε′ and ε″ can be exhibited as follows [41,42]:
( ε ε s + ε 2 ) 2 + ( ε ) 2 = ( ε s ε 2 ) 2
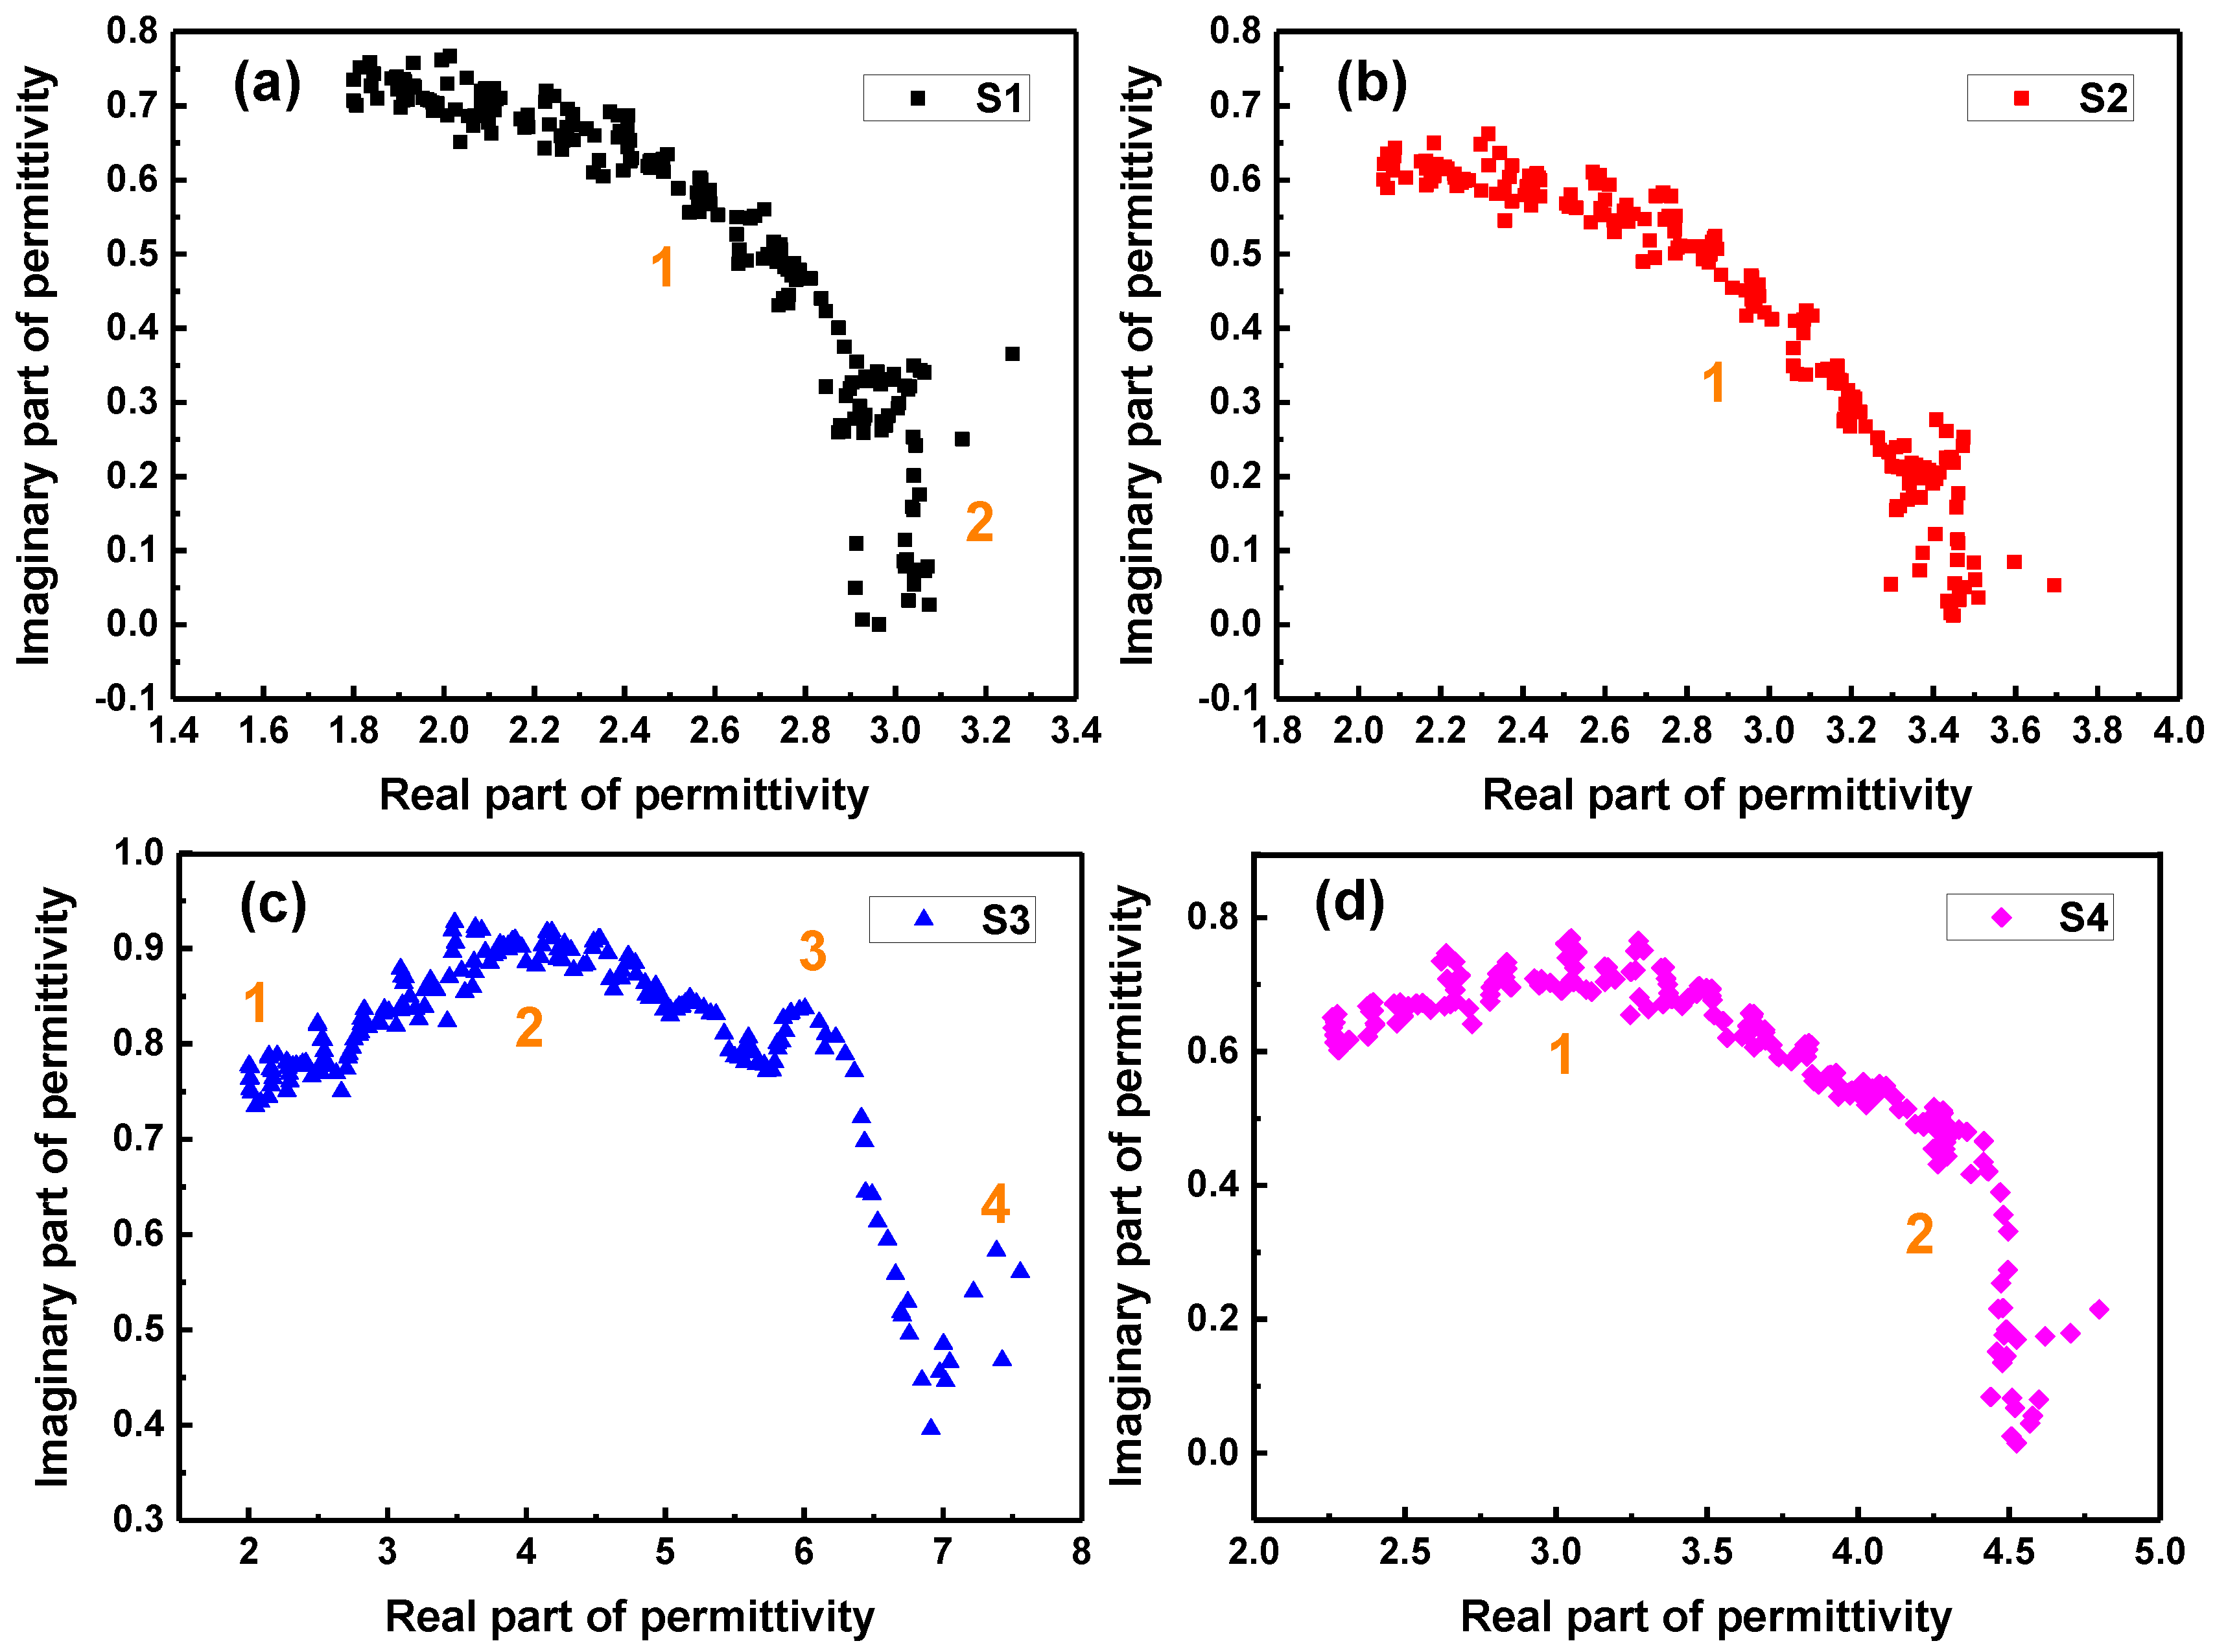
where, ε is the dielectric constant at infinite frequency, and εs the static dielectric constant. Thus, the curve of ε′ − ε″ is denoted as the Cole-Cole semicircle, which is corresponded to the Debye relaxation process. Figure 11 shows the ε′ − ε″ curves of S1, S2, S3, and S4 at the thickness of 4 mm. The results suggest that there are two Cole-Cole semicircles can be observed in S1 and S4 samples, confirming that two Debye relaxation processes have occurred during the microwave absorption process in the samples. Clearly, only one Debye relaxation process can be seen in the S2 sample for one obvious Cole-Cole semicircle. However, the S3 sample has much more different-sized semicircles than those of other samples, indicating that multiple Debye relaxation processes have been produced in the absorption of electromagnetic wave energy, which is one of significant reasons that the microwave absorption of S3 sample is greatly enhanced in the S-band.
Overall, the comparison of microwave absorbing properties between as-prepared SiO2-MnFe2O4 composite and other materials available in the literature have been listed in Table 1 [43,44,45,46,47,48,49,50]. It can be noted that the ferrites are often composited with other materials to enhance their impedance matching and electromagnetic absorption. Moreover, the comparison results suggest that most of the composites based on ferrites have excellent microwave absorption performance in GHz range, however, the absorbing frequency range of SiO2-MnFe2O4 composite prepared in this work is obviously the lowest compared with those obtained in other literatures.

3. Experimental

3.1. Materials

The manganese chloride tetrahydrate (MnCl2·4H2O) and ethylene glycol were purchased from Sinopharm Chemical Reagent Co. Ltd., China. The ferric chloride hexahydrate (FeCl3·6H2O), sodium acetate trihydrate (NaAc) and polyethylene glycol 6000 were purchased from Chengdu Kelong Chemical Reagent Co. Ltd., China. The SiO2 sheets were purchased from Beiyan Celiang Co. Ltd., China. All the chemicals were of analytic purity grade and were used as received without any further purification.

3.2. Preparation of MnFe2O4 NPs and SiO2-MnFe2O4 Composites

The SiO2-MnFe2O4 composites were prepared via typical one-pot hydrothermal synthesis method [51]. In the process, 6.75 g ferric chloride hexahydrate (25 mmol) and 2.475 g manganese chloride tetrahydrate (12.5 mmol) were added into 200 mL ethylene glycol with continuous stirring to form a clear solution. Then, 18 g sodium acetate trihydrate (132.35 mmol) and 5 g polyethylene glycol 6000 (~0.83 mmol) were consecutively added into the preceding solution with sustained stirring and ultrasonic dispersion for 30 min. Subsequently, the different masses of SiO2 sheets were put into the above solution and keep stirring for 10 min. Finally, the uniform solution was sealed into a 300 mL hydrothermal reactor and held the temperature at 180 °C for 12 h. After the reaction, the products were SiO2-MnFe2O4 composites and could be extracted out from the reaction liquid with a magnet. Then, the separated black precipitation was washed with ethanol to remove the impurities and dried in a drying oven at 50 °C for 6 h. In addition, the preparation of pure MnFe2O4 NPs was through the same process without the addition of SiO2 sheets. For the convenience of description, the four samples of pure SiO2 sheets, SiO2-MnFe2O4 composites with the SiO2 sheets mass content of 25 wt% and 12.5 wt%, and Pure MnFe2O4 NPs were marked as S1, S2, S3, and S4 respectively in the following text. By the way, take the S2 sample as an example, the quality of product, in theory, is 3.85 g. However, the actual mass of product is 3.10 g after drying sufficiently, thus the yield of this synthesis procedure is approximately to 80.52%.

3.3. Characterization

The crystal structures of S1, S2, S3, and S4 were analyzed by an X-ray powder diffraction system (German Bruker D8 with Cu-Kα radiation, λ = 0.154 nm). The Scanning Electron Microscope (SEM, SU8100, Hitachi, Japan) and Transmission Electron Microscope (TEM, Tecnai F30 G2, FEI, Morristown, NJ, USA) were employed to characterize the micromorphology and elements distribution of the samples. The samples used for electromagnetic wave absorption measurement were prepared by mixing the products with paraffin in a mass percentage of 50 wt%, for the composites would be very hard to shape as the powders were overloaded. Then, the produced samples were pressed into a toroidal shape (Φin = 3.04 mm and Φout = 7.00 mm) with different thicknesses and the S-parameters of samples were measured by a TIANDA TD3618C Vector Network Analyzer with coaxial transmission and reflection method. Finally, the relative complex permittivity and permeability of samples can be calculated according to the theory of Nicolson and Ross [52].

4. Conclusions

In summary, the SiO2-MnFe2O4 composite with significant microwave absorption performance in S-band was prepared via one-pot hydrothermal synthesis method, the microwave absorbing property of the as-prepared sample was also investigated. The dielectric and magnetic loss are both contribute to the microwave absorption of samples, while the effect of magnetic loss is more obvious. The preferable microwave absorbing ability of sample is attributed to the strong eddy current loss, better impedance matching, excellent attenuation characteristic and multiple Debye relaxation processes. Thus, the maximum reflection loss of −14.87 dB at 2.25 GHz with a broader −10 dB bandwidth over the frequency range of 1.67~2.9 GHz (1.23 GHz) can be obtained at the sample thickness of 4 mm. Most importantly, the preparation method reported here is relatively simple, make it quite a suitable candidate for the microwave absorption in S-band.

Author Contributions

Writing—original draft preparation, P.Y.; writing—review and editing, L.Z. (Limin Zhang); methodology, J.W., X.F. and L.Z. (Liang Zhao); investigation, H.R. and Y.W.; data curation, J.D.

Funding

This research was funded by Cultivation Project of Sichuan Science and Technology Innovation Seedling Program, grant number 2018128; National Natural Science Foundation of China, grant number 51704242; Natural Science Foundation of Shaanxi Province in China, grant number 2018JM5094; and the APC was funded by Cultivation Project of Sichuan Science and Technology Innovation Seedling Program.

Conflicts of Interest

The authors declare no conflict of interest.

References

  1. Ling, J.; Zhai, W.; Feng, W.; Shen, B.; Zhang, J.; Zheng, W. Facile preparation of lightweight microcellular polyetherimide/graphene composite foams for electromagnetic interference shielding. ACS Appl. Mater. Interfaces 2013, 5, 2677–2684. [Google Scholar] [CrossRef] [PubMed]
  2. Chen, X.; Meng, F.; Zhou, Z.; Tian, X.; Shan, L.; Zhu, S.; Xu, X.; Jiang, M.; Wang, L.; Hui, D.; et al. One-step synthesis of graphene/polyaniline hybrids by in situ intercalation polymerization and their electromagnetic properties. Nanoscale 2014, 6, 8140–8148. [Google Scholar] [CrossRef] [PubMed]
  3. Kong, L.; Yin, X.; Yuan, X.; Zhang, Y.; Liu, X.; Cheng, L.; Zhang, L. Electromagnetic wave absorption properties of graphene modified with carbon nanotube/poly (dimethyl siloxane) composites. Carbon 2014, 73, 185–193. [Google Scholar] [CrossRef]
  4. Lan, D.; Qin, M.; Yang, R.; Chen, S.; Wu, H.; Fan, Y.; Fu, Q.; Zhang, F. Facile synthesis of hierarchical chrysanthemum-like copper cobaltate-copper oxide composites for enhanced microwave absorption performance. J. Colloid Inter. Sci. 2019, 533, 481–491. [Google Scholar] [CrossRef] [PubMed]
  5. Khani, O.; Shoushtari, M.Z.; Ackland, K.; Stamenov, P. The structural, magnetic and microwave properties of spherical and flake shaped carbonyl iron particles as thin multilayer microwave absorbers. J. Magn. Magn. Mater. 2017, 428, 28–35. [Google Scholar] [CrossRef]
  6. Xu, Y.; Yuan, L.; Liang, Z.; Wang, X.; Li, X. A wide frequency absorbing material added CIPs using the fuse deposition modeling. J. Alloy. Compd. 2017, 704, 593–598. [Google Scholar] [CrossRef]
  7. Tang, N.; Yang, Y.; Lin, K.; Zhong, W.; Au, C.; Du, Y. Synthesis of plait-like carbon nanocoils in ultrahigh yield and their microwave absorption properties. J. Phys. Chem. C 2008, 112, 10061–10067. [Google Scholar] [CrossRef]
  8. Wu, H.; Qu, S.; Lin, K.; Qing, Y.; Wang, L.; Fan, Y.; Fu, Q.; Zhang, F. Enhanced low-frequency microwave absorbing property of SCFs@TiO2 composite. Powder Technol. 2018, 333, 153–159. [Google Scholar] [CrossRef]
  9. Luo, H.; Chen, W.; Zhou, W.; Long, L.; Deng, L.; Xiao, P.; Li, Y. Carbon fiber/Si3N4 composites with SiC nanofiber interphase for enhanced microwave absorption properties. Ceram. Int. 2017, 43, 12328–12332. [Google Scholar] [CrossRef]
  10. Yun, S.; Kirakosyan, A.; Surabhi, S.; Jeong, J.R.; Choi, J. Controlled morphology of MWCNTs driven by polymer-grafted nanoparticles for enhanced microwave absorption. J. Mater. Chem. C 2017, 5, 8436–8443. [Google Scholar] [CrossRef]
  11. Wang, Y.; Wang, W.; Yu, D. Three-phase heterostructures f-NiFe2O4/PANI/PI EMI shielding fabric with high microwave absorption performance. Appl. Surf. Sci. 2017, 425, 518–525. [Google Scholar] [CrossRef]
  12. Wu, H.; Wu, G.; Ren, Y.; Yang, L.; Wang, L.; Li, X. Co2+/Co3+ ratio dependence of electromagnetic wave absorption in hierarchical NiCo2O4-CoNiO2 hybrids. J. Mater. Chem. C 2015, 3, 7677–7690. [Google Scholar] [CrossRef]
  13. Wu, H.; Wu, G.; Wang, L. Peculiar porous α-Fe2O3, γ-Fe2O3 and Fe3O4 nanospheres: Facile synthesis and electromagnetic properties. Powder Technol. 2015, 269, 443–451. [Google Scholar] [CrossRef]
  14. Lan, Y.; Li, X.; Zong, Y.; Li, Z.; Sun, Y.; Tan, G.; Feng, J.; Ren, Z.; Zheng, X. In-situsynthesis of carbon nanotubes decorated by magnetite nanoclusters and their applications as highly efficient and enhanced microwave absorber. Ceram. Int. 2016, 42, 19110–19118. [Google Scholar] [CrossRef]
  15. Xiao, H.M.; Liu, X.M.; Fu, S.Y. Synthesis, magnetic and microwave absorbing properties of core-shell structured MnFe2O4/TiO2 nanocomposites. Compos. Sci. Technol. 2006, 66, 2003–2008. [Google Scholar] [CrossRef]
  16. Reddy, M.P.; Mohamed, A.M.A.; Ramana, M.V.; Zhou, X.B.; Huang, Q. Spark plasma sintering and microwave electromagnetic properties of MnFe2O4 ceramics. J. Magn. Magn. Mater. 2015, 395, 185–189. [Google Scholar] [CrossRef]
  17. Wang, Y.; Wu, X.; Zhang, W.; Huang, S. Synthesis and electromagnetic absorption properties of Ag-coated reduced graphene oxide with MnFe2O4 particles. J. Magn. Magn. Mater. 2016, 404, 58–63. [Google Scholar] [CrossRef]
  18. Zhang, X.J.; Wang, G.S.; Cao, W.Q.; Wei, Y.Z.; Liang, J.F.; Guo, L.; Cao, M.S. Enhanced microwave absorption property of reduced graphene oxide (RGO)-MnFe2O4 nanocomposites and polyvinylidene fluoride. ACS Appl. Mater. Interfaces 2014, 6, 7471–7478. [Google Scholar] [CrossRef]
  19. Hosseini, S.H.; Moghimi, A.; Moloudi, M. Magnetic, conductive, and microwave absorption properties of polythiophene nanofibers layered on MnFe2O4/Fe3O4 core-shell structures. Mat. Sci. Semicon. Proc. 2014, 24, 272–277. [Google Scholar] [CrossRef]
  20. Wang, Y.; Wu, X.; Zhang, W.; Huang, S. One-pot synthesis of MnFe2O4 nanoparticles decorated reduced graphene oxide for enhanced microwave absorption properties. Mater. Technol. 2017, 32, 32–37. [Google Scholar] [CrossRef]
  21. Lakshmi, R.V.; Bera, P.; Chakradhar, R.P.S.; Choudhury, B.; Pawar, S.P.; Bose, S.; Nair, R.U.; Barshilia, H.C. Enhanced microwave absorption properties of PMMA modified MnFe2O4-polyaniline nanocomposites. Phys. Chem. Chem. Phys. 2019, 21, 5068–5077. [Google Scholar] [CrossRef] [PubMed]
  22. Wang, H.; Wang, C.; Xiong, Y.; Yao, Q.; Chang, Q.; Chen, Y.; Jin, C.; Sun, Q. Solvothermal fabrication and growth behavior study of spherical MnFe2O4 through a bottom-up method on wood substrate with effective microwave absorption. RSC Adv. 2017, 7, 24764–24770. [Google Scholar] [CrossRef]
  23. Hosseini, S.H.; Mohseni, S.H.; Asadnia, A.; Kerdari, H. Synthesis and microwave absorbing properties of polyaniline/MnFe2O4 nanocomposite. J. Alloy. Compd. 2011, 509, 4682–4687. [Google Scholar] [CrossRef]
  24. Han, M.; Liang, D.; Deng, L. Fabrication and electromagnetic wave absorption properties of amorphous Fe79Si16B5 microwires. Appl. Phys. Lett. 2011, 99, 082503. [Google Scholar]
  25. Wang, H.; Dai, Y.; Gong, W.; Geng, D.; Ma, S.; Li, D.; Liu, W.; Zhang, Z. Broadband microwave absorption of CoNi@C nanocapsules enhanced by dual dielectric relaxation and multiple magnetic resonances. Appl. Phys. Lett. 2013, 102, 223113. [Google Scholar] [CrossRef]
  26. Weng, X.; Li, B.; Zhang, Y.; Lv, X.; Gu, G. Synthesis of flake shaped carbonyl iron/reduced graphene oxide/polyvinyl pyrrolidone ternary nanocomposites and their microwave absorbing properties. J. Alloy. Compd. 2017, 695, 508–519. [Google Scholar] [CrossRef]
  27. Li, J.; Xie, Y.; Lu, W.; Chou, T.W. Flexible electromagnetic wave absorbing composite based on 3D rGO-CNT-Fe3O4 ternary films. Carbon 2018, 129, 76–84. [Google Scholar] [CrossRef]
  28. Chen, D.Z.; Wang, G.S.; He, S.; Liu, J.; Guo, L.; Cao, M.S. Controllable fabrication of mono-dispersed RGO-hematite nanocomposites and their enhanced wave absorption properties. J. Mater. Chem. A 2013, 1, 5996–6003. [Google Scholar] [CrossRef]
  29. Li, R.; Wang, T.; Tan, G.G.; Zuo, W.L.; Wei, J.Q.; Qiao, L.; Li, F.S. Microwave absorption properties of oriented Pr2Fe17N3-δ particles/paraffin composite with planar anisotropy. J. Alloy. Compd. 2014, 586, 239–243. [Google Scholar] [CrossRef]
  30. Liu, X.F.; Cui, X.R.; Chen, Y.X.; Zhang, X.J.; Yu, R.H.; Wang, G.S.; Ma, H. Modulation of electromagnetic wave absorption by carbon shell thickness in carbon encapsulated magnetite nanospindles-poly (vinylidene fluoride) composites. Carbon 2015, 95, 870–878. [Google Scholar] [CrossRef]
  31. Song, W.L.; Cao, M.S.; Lu, M.M.; Liu, J.; Yuan, J.; Fan, L.Z. Improved dielectric properties and highly efficient and broadened bandwidth electromagnetic attenuation of thickness-decreased carbon nanosheet/wax composites. J. Mater. Chem. C 2013, 1, 1846–1854. [Google Scholar] [CrossRef]
  32. Jia, Q.; Wang, W.; Zhao, J.; Xiao, J.; Lu, L.; Fan, H. Synthesis and characterization of TiO2/polyaniline/graphene oxide bouquet-like composites for enhanced microwave absorption performance. J. Alloy. Compd. 2017, 710, 717–724. [Google Scholar] [CrossRef]
  33. Zhu, J.Q.; Zhang, X.J.; Wang, S.W.; Wang, G.S.; Yin, P.G. Enhanced microwave absorption material of ternary nanocomposites based on MnFe2O4@SiO2, polyaniline and polyvinylidene fluoride. RSC Adv. 2016, 6, 88104–88109. [Google Scholar] [CrossRef]
  34. Fang, J.; Liu, T.; Chen, Z.; Wang, Y.; Wei, W.; Yue, X.; Jiang, Z. A wormhole-like porous carbon/magnetic particles composite as an efficient broadband electromagnetic wave absorber. Nanoscale 2016, 8, 8899–8909. [Google Scholar] [CrossRef] [PubMed]
  35. Lei, Y.; Yao, Z.; Lin, H.; Zhou, J.; Haidry, A.A.; Liu, P. The effect of polymerization temperature and reaction time on microwave absorption properties of Co-doped ZnNi ferrite/polyaniline composites. RSC Adv. 2018, 8, 29344–29355. [Google Scholar] [CrossRef] [Green Version]
  36. Long, Q.; Xu, Z.; Xiao, H.; Xie, K. A facile synthesis of a cobalt nanoparticle-graphene nanocomposite with high-performance and triple-band electromagnetic wave absorption properties. RSC Adv. 2018, 8, 1210–1217. [Google Scholar] [CrossRef]
  37. Zhang, K.; Gao, X.; Zhang, Q.; Li, T.; Chen, H.; Chen, X. Preparation and microwave absorption properties of asphalt carbon coated reduced graphene oxide/magnetic CoFe2O4 hollow particles modified multi-wall carbon nanotube composites. J. Alloy. Compd. 2017, 723, 912–921. [Google Scholar] [CrossRef]
  38. Zhang, N.; Huang, Y.; Zong, M.; Ding, X.; Li, S.; Wang, M. Synthesis of ZnS quantum dots and CoFe2O4 nanoparticles co-loaded with graphene nanosheets as an efficient broad band EM wave absorber. Chem. Eng. J. 2017, 308, 214–221. [Google Scholar] [CrossRef]
  39. Zhao, B.; Guo, X.Q.; Zhao, W.Y.; Deng, J.H.; Fan, B.B.; Shao, G.; Bai, Z.Y.; Zhang, R. Facile synthesis of yolk-shell Ni@void@SnO2(Ni3Sn2) ternary composites via galvanic replacement/Kirkendall effect and their enhanced microwave absorption properties. Nano Res. 2017, 10, 331–343. [Google Scholar] [CrossRef]
  40. Wang, H.; Zhu, D.; Wang, X.; Luo, F. Influence of silicon carbide fiber (SiCf) type on the electromagnetic microwave absorbing properties of SiCf/epoxy composites. Compos. Part. A 2017, 93, 10–17. [Google Scholar] [CrossRef]
  41. Du, Y.; Liu, W.; Qiang, R.; Wang, Y.; Han, X.; Ma, J.; Xu, P. Shell Thickness-Dependent Microwave Absorption of Core-Shell Fe3O4@C Composites. ACS Appl. Mater. Interfaces 2014, 6, 12997–13006. [Google Scholar] [CrossRef] [PubMed]
  42. Alanagh, F.M.; Khiabani, A.B.; Salimkhani, H. Improvement in magnetic and microwave absorption properties of nano-Fe3O4@CFs composites using a modified multi-step EPD process. Appl. Surf. Sci. 2017, 420, 726–739. [Google Scholar] [CrossRef]
  43. Heidari, B.; Ansari, M.; Hoseinabadi, A.; Jiriaee, H.; Heidary, F. The effect of ZnO, Fe3O4 and graphene oxide nanostructures on the microwave absorbing properties of polystyrene composites. J. Mater. Sci. Mater. Electron. 2017, 28, 1028–1037. [Google Scholar] [CrossRef]
  44. Cao, M.S.; Yang, J.; Song, W.L.; Zhang, D.Q.; Wen, B.; Jin, H.B.; Hou, Z.L.; Yuan, J. Ferroferric oxide/multiwalled carbon nanotube vs. polyaniline/ferroferric oxide/multiwalled carbon nanotube multiheterostructures for highly effective microwave absorption. ACS Appl. Mater. Inter. 2012, 4, 6949–6956. [Google Scholar] [CrossRef] [PubMed]
  45. Xue, H.; Jiao, Q.; Hao, L.; Ni, X.; Wang, Y.; Li, H.; Wu, Q.; Zhao, Y. Preparation of core-shell Zn-doped CoFe2O4 cubes@CNT composites and their absorbing performances. Micro Nano Lett. 2017, 12, 227–230. [Google Scholar] [CrossRef]
  46. Hou, C.L.; Li, T.H.; Zhao, T.K.; Liu, H.G.; Liu, L.H.; Zhang, W.J. Electromagnetic wave absorbing properties of multi-wall carbon nanotube/Fe3O4 hybrid materials. New Carbon Mater. 2013, 28, 184–190. [Google Scholar] [CrossRef]
  47. Feng, C.; Liu, X.; Or, S.W.; Ho, S.L. Exchange coupling and microwave absorption in core/shell-structured hard/soft ferrite-based CoFe2O4/NiFe2O4 nanocapsules. AIP Adv. 2017, 7, 056403. [Google Scholar] [CrossRef]
  48. Li, G.; Sheng, L.; Yu, L.; An, K.; Ren, W.; Zhao, X. Electromagnetic and microwave absorption properties of single-walled carbon nanotubes and CoFe2O4 nanocomposites. Mater. Sci. Eng. B 2015, 193, 153–159. [Google Scholar] [CrossRef]
  49. Guan, Z.J.; Jiang, J.T.; Chen, N.; Gong, Y.X.; Zhen, L. Carbon-coated CoFe-CoFe2O4 composite particles with high and dual-band electromagnetic wave absorbing properties. Nanotechnology 2018, 29, 305604. [Google Scholar] [CrossRef]
  50. Lia, J.; Feng, Y.; Wu, Y.; Yuan, Y. Fiber-guided and particle-localized microwave absorption of nanoscale CoFe2O4 derived from citric acid-based precursor. Phys. B 2019, 561, 16–22. [Google Scholar] [CrossRef]
  51. Deng, H.; Li, X.L.; Peng, Q.; Wang, X.; Chen, J.P.; Li, Y.D. Monodisperse magnetic single-crystal ferrite microspheres. Angew. Chem. Int. Ed. 2005, 117, 2842–2845. [Google Scholar] [CrossRef]
  52. Nicolson, A.M.; Ross, G.F. Measurement of the intrinsic properties of materials by time-domain techniques. IEEE T. Instrum. Meas. 1970, 19, 377–382. [Google Scholar] [CrossRef]
Sample Availability: Samples of the compounds SiO2-MnFe2O4 are available from the authors.
Figure 1. X-ray diffraction patterns of S1, S2, S3, and S4 samples.
Molecules 24 02605 g001
Figure 2. SEM images of sample S1 (a), sample S2 (b), sample S3 (c), sample S4 (d) and the Energy Dispersive Spectrometer (EDS) spectrum of sample S3 (e).
Molecules 24 02605 g002
Figure 3. TEM images with different magnifications (a) and (b), HR-TEM image (c), SAED pattern (d) and corresponding elemental mapping images of S3 sample (e)~(h).
Molecules 24 02605 g003
Figure 4. Frequency-dependent reflection loss (RL) curves of S1, S2, S3, and S4 at the thickness of 5 mm.
Molecules 24 02605 g004
Figure 5. Frequency-dependent RL curves of S3 at different thicknesses.
Molecules 24 02605 g005
Figure 6. Frequency dependence of real part of permittivity (a), imaginary part of permittivity (b), real part of permeability (c) and imaginary part of permittivity (d).
Molecules 24 02605 g006
Figure 7. Frequency dependence of dielectric loss tangent (a) and magnetic loss tangent (b).
Molecules 24 02605 g007
Figure 8. Frequency dependency of the eddy current loss curves of S1, S2, S3, and S4 at the thickness of 4 mm.
Molecules 24 02605 g008
Figure 9. Frequency dependent Zin/Z0 values of S1, S2, S3, and S4 at the thickness of 4 mm.
Molecules 24 02605 g009
Figure 10. Attenuation constants of S1, S2, S3, and S4 at the thickness of 4 mm.
Molecules 24 02605 g010
Figure 11. Plots of ε ε for S1, S2, S3, and S4 at the thickness of 4 mm.
Molecules 24 02605 g011
Table 1. Comparison of microwave absorbing properties between SiO2-MnFe2O4 composite and other materials available in the literature.
MaterialsThicknessMinimum RLPositionRL < −10 dBRefs.
SiO2-MnFe2O44 mm−14.87 dB2.25 GHz1.67~2.9 GHzThis work
ZnO/Fe3O4/GO2 mm−7.2 dB/6.4~8 GHz[43]
PANI/Fe3O4/MWCNT4 mm−16 dB/8~15 GHz[44]
Zn-doped CoFe2O4 cubes@CNT2 mm−9.98 dB9.33 GHz/[45]
MWCNTs/Fe3O42 mm−18.22 dB/10.9~12.4 GHz[46]
CoFe2O4/NiFe2O44.5 mm−20.1 dB9.7 GHz7.8~16.2 GHz[47]
CoFe2O4/LPA-SWCNT2 mm−30.7 dB12.9 GHz10.1~17.3 GHz[48]
Carbon-coated CoFe-CoFe2O43.93−60 dB5.5 GHz4.1~7.8 GHz[49]
CoFe2O4 fiber5 mm−36.5 dB6.0 GHz/[50]