
DFT Simulations of the Vibrational Spectrum and Hydrogen Bonds of Ice XIV


Abstract
:1. Introduction
2. Computational Methodology
3. Results and Discussion
4. Conclusions
Supplementary Materials
Author Contributions
Funding
Acknowledgments
References
- Bertie, J.E.; Whalley, E. Optical Spectra of Orientationally Disordered Crystals. II. Infrared Spectrum of Ice Ih and Ice Ic from 360 to 50 cm−1. J. Chem. Phys. 1967, 46, 1271–1284. [Google Scholar] [CrossRef]
- Bertie, J.E.; Calvert, L.D.; Whalley, E. Transformations of Ice II, Ice III, and Ice V at Atmospheric Pressure. J. Chem. Phys. 1963, 38, 840–846. [Google Scholar] [CrossRef]
- Kuhs, W.F.; Finney, J.L.; Vettier, C.; Bliss, D.V. Structure and hydrogen ordering in ices VI, VII, and VIII by neutron powder diffraction. J. Chem. Phys. 1984, 81, 3612–3623. [Google Scholar] [CrossRef]
- Whalley, E.; Heath, J.B.R.; Davidson, D.W. Ice IX: An Antiferroelectric Phase Related to Ice III. J. Chem. Phys. 1968, 48, 2362–2370. [Google Scholar] [CrossRef]
- Tajima, Y.; Matsuo, T.; Suga, H. Phase transition in KOH-doped hexagonal ice. Nature 1982, 299, 810–812. [Google Scholar] [CrossRef]
- Hirsch, K.R.; Holzapfel, W.B. Effect of high pressure on the Raman spectra of ice VIII and evidence for ice X. J. Chem. Phys. 1986, 84, 2771–2775. [Google Scholar] [CrossRef]
- Lobban, C.; Finney, J.L.; Kuhs, W.F. The structure of a new phase of ice. Nature 1998, 391, 268–270. [Google Scholar] [CrossRef]
- Salzmann, C.G.; Radaelli, P.G.; Mayer, A.E.; Finney, J.L. The Preparation and Structures of Hydrogen Ordered Phases of Ice. Science 2006, 311, 1758–1761. [Google Scholar] [CrossRef] [PubMed]
- Salzmann, C.G.; Radaelli, P.G.; Mayer, E.; Finney, J.L. Ice XV: A new thermodynamically stable phase of ice. Phys. Rev. Lett. 2009, 103, 105701. [Google Scholar] [CrossRef] [PubMed]
- Falenty, A.; Hansen, T.C.; Kuhs, W.F. Formation and properties of ice XVI obtained by emptying a type sII clathrate hydrate. Nature 2014, 516, 213–233. [Google Scholar] [CrossRef] [PubMed]
- Del Rosso, L.; Celli, M.; Ulivi, L. New porous water ice metastable at atmospheric pressure obtained by emptying a hydrogen-filled ice. Nat. Commun. 2016, 7, 13394–13400. [Google Scholar] [CrossRef] [PubMed]
- Zhang, P.; Wang, Z.; Lu, Y.B.; Ding, Z.W. The normal modes of lattice vibrations of ice XI. Sci. Rep. 2016, 6, 29273–29281. [Google Scholar] [CrossRef] [PubMed]
- Tribello, G.A.; Slater, B.; Salzmann, C.G. A Blind Structure Prediction of Ice XIV. J. Am. Chem. Soc. 2006, 128, 12594–12595. [Google Scholar] [CrossRef] [PubMed]
- Salzmann, C.G.; Hallbrucker, A.; Finney, J.L.; Mayer, E. Raman spectroscopic features of hydrogen-ordering in ice XII. Chem. Phys. Lett. 2006, 429, 469–473. [Google Scholar] [CrossRef]
- Chou, I.-M.; Blank, J.G.; Goncharov, A.F.; Mao, H.-K.; Hemley, R.J. In Situ Observations of a High-Pressure Phase of H2O Ice. Science 1998, 281, 809–812. [Google Scholar] [CrossRef] [PubMed]
- Salzmann, C.G.; Kohl, I.; Loerting, T.; Mayer, E.; Hallbrucker, A. The Raman Spectrum of Ice XII and Its Relation to that of a New “High-Pressure Phase of H2O Ice”. J. Phys. Chem. B 2002, 106, 1–6. [Google Scholar] [CrossRef]
- Yoshimura, Y.; Stewart, S.T.; Mao, H.-K.; Hemley, R.J. In situ Raman spectroscopy of low-temperature/high-pressure transformations of H2O. J. Chem. Phys. 2007, 126, 174505. [Google Scholar] [CrossRef] [PubMed]
- Koza, M.M.; Schober, H.; Tölle, A.; Fujara, F.; Hansen, T. Formation of ice XII at different conditions. Nature 1999, 397, 660–661. [Google Scholar] [CrossRef]
- Koza, M.M.; Schober, H.; Parker, S.F.; Peters, J. Vibrational dynamics and phonon dispersion of polycrystalline ice XII and of high-density amorphous ice. Phys. Rev. B 2008, 77, 104306. [Google Scholar] [CrossRef]
- Clark, S.J.; Segall, M.D.; Pickard, C.J.; Hasnip, P.J.; Probert, M.I.J.; Refson, K.; Payne, M.C. First principles methods using CASTEP. Z. Kristallogr.-Cryst. Mater. 2005, 220, 567–570. [Google Scholar] [CrossRef] [Green Version]
- Hammer, B.; Hansen, L.B.; Norskov, J.K. Improved adsorption energetics within density-functional theory using revised Perdew-Burke-Ernzerhof functionals. Phys. Rev. B 1999, 59, 7413–7421. [Google Scholar] [CrossRef] [Green Version]
- Brandenburg, J.G.; Maas, T.; Grimme, S. Benchmarking DFT and Semiempirical Methods on Structures and Lattice Energies for Ten Ice Polymorphs. J. Chem. Phys. 2015, 142, 124104. [Google Scholar] [CrossRef] [PubMed]
- Whale, T.F.; Clark, S.J.; Finney, J.L.; Salzmann, C.G. DFT-assisted interpretation of the Raman spectra of hydrogen-ordered ice XV. J. Raman Spectrosc. 2013, 44, 290–298. [Google Scholar] [CrossRef]
- Klug, D.D.; Whalley, E. Origin of the High-Frequency Translational Bands of Ice I. J. Glaciol. 1978, 21, 55–63. [Google Scholar] [CrossRef] [Green Version]
- Marchi, M.; Tse, J.S.; Klein, M.L. Lattice vibrations and infrared absorption of ice Ih. J. Chem. Phys. 1986, 85, 2414–2418. [Google Scholar] [CrossRef]
- Tse, J.S.; Klug, D.D. Comments on “Further evidence for the existence of two kinds of H-bonds in ice Ih” by Li et al. Phys. Lett. A 1995, 198, 464–466. [Google Scholar] [CrossRef]
- Li, J.C.; Ross, D.K. Evidence for two kinds of hydrogen bond in ice. Nature 1993, 365, 327–329. [Google Scholar] [CrossRef]
- Li, J.C. Inelastic neutron scattering studies of hydrogen bonding in ices. J. Chem. Phys. 1996, 105, 6733–6755. [Google Scholar] [CrossRef]
- Klotz, S.; Strassle, T.; Salzmann, C.G.; Philippe, J.; Parker, S.F. Incoherent inelastic neutron scattering measurements on ice VII: Are there two kinds of hydrogen bonds in ice? Europhys. Lett. 2005, 72, 576–582. [Google Scholar] [CrossRef]
- Zhang, P.; Tian, L.; Zhang, Z.P.; Shao, G.; Li, J.C. Investigation of the hydrogen bonding in ice Ih by first-principles density function methods. J. Chem. Phys. 2012, 137, 044504. [Google Scholar] [CrossRef] [PubMed]
- Zhang, P.; Han, S.H.; Yu, H.; Liu, Y. A calculating proof on hydrogen bonding in ordinary ice by the first-principles density functional theory. RSC Adv. 2013, 3, 6646–6649. [Google Scholar] [CrossRef]
- He, X.; Sode, O.; Xantheas, S.S.; Hirata, S. Second-order many-body perturbation study of ice Ih. J. Chem. Phys. 2012, 11, 204505. [Google Scholar] [CrossRef] [PubMed]
- Yuan, Z.Y.; Zhang, P.; Yao, S.K.; Lu, Y.B.; Yang, H.Z.; Luo, H.W.; Zhao, Z.J. Computational assignments of lattice vibrations of ice Ic. RSC Adv. 2017, 7, 36801–36806. [Google Scholar] [CrossRef] [Green Version]
Sample Availability: Samples of the compounds are not available from the authors. |


| PDOS | Neutr. Scattering (References [18]/[19]) | Normal Modes | Raman Intensity | Raman Scattering (References [14]/[15]/[16]) |
|---|---|---|---|---|
| 53 | 56/— | 62 | 0.01 | |
| 75 | 80/— | 82 | 0.00 | |
| 83 | 0.03 | |||
| 84 | 0.11 | |||
| 88 | 96/— | 90 | 0.00 | |
| 92 | 0.00 | |||
| 94 | 0.17 | |||
| 95 | 0.06 | |||
| 104 | 100 | 0.08 | ||
| 101 | 0.10 | |||
| 102 | 0.01 | |||
| 113 | 104 | 0.03 | ||
| 128 | 127 | 0.00 | ||
| 128 | 0.04 | |||
| 129 | 0.00 | |||
| 142 | 138 | 0.18 | ||
| 153 | 0.01 | |||
| 159 | 160/— | 154 | 0.02 | |
| 166 | 162 | 0.00 | ||
| 169 | 2.21 | |||
| 176 | 1.70 | |||
| 178 | 2.42 | 214/192/195 | ||
| 188 | 192/— | 192 | 0.93 | |
| 193 | 0.11 | |||
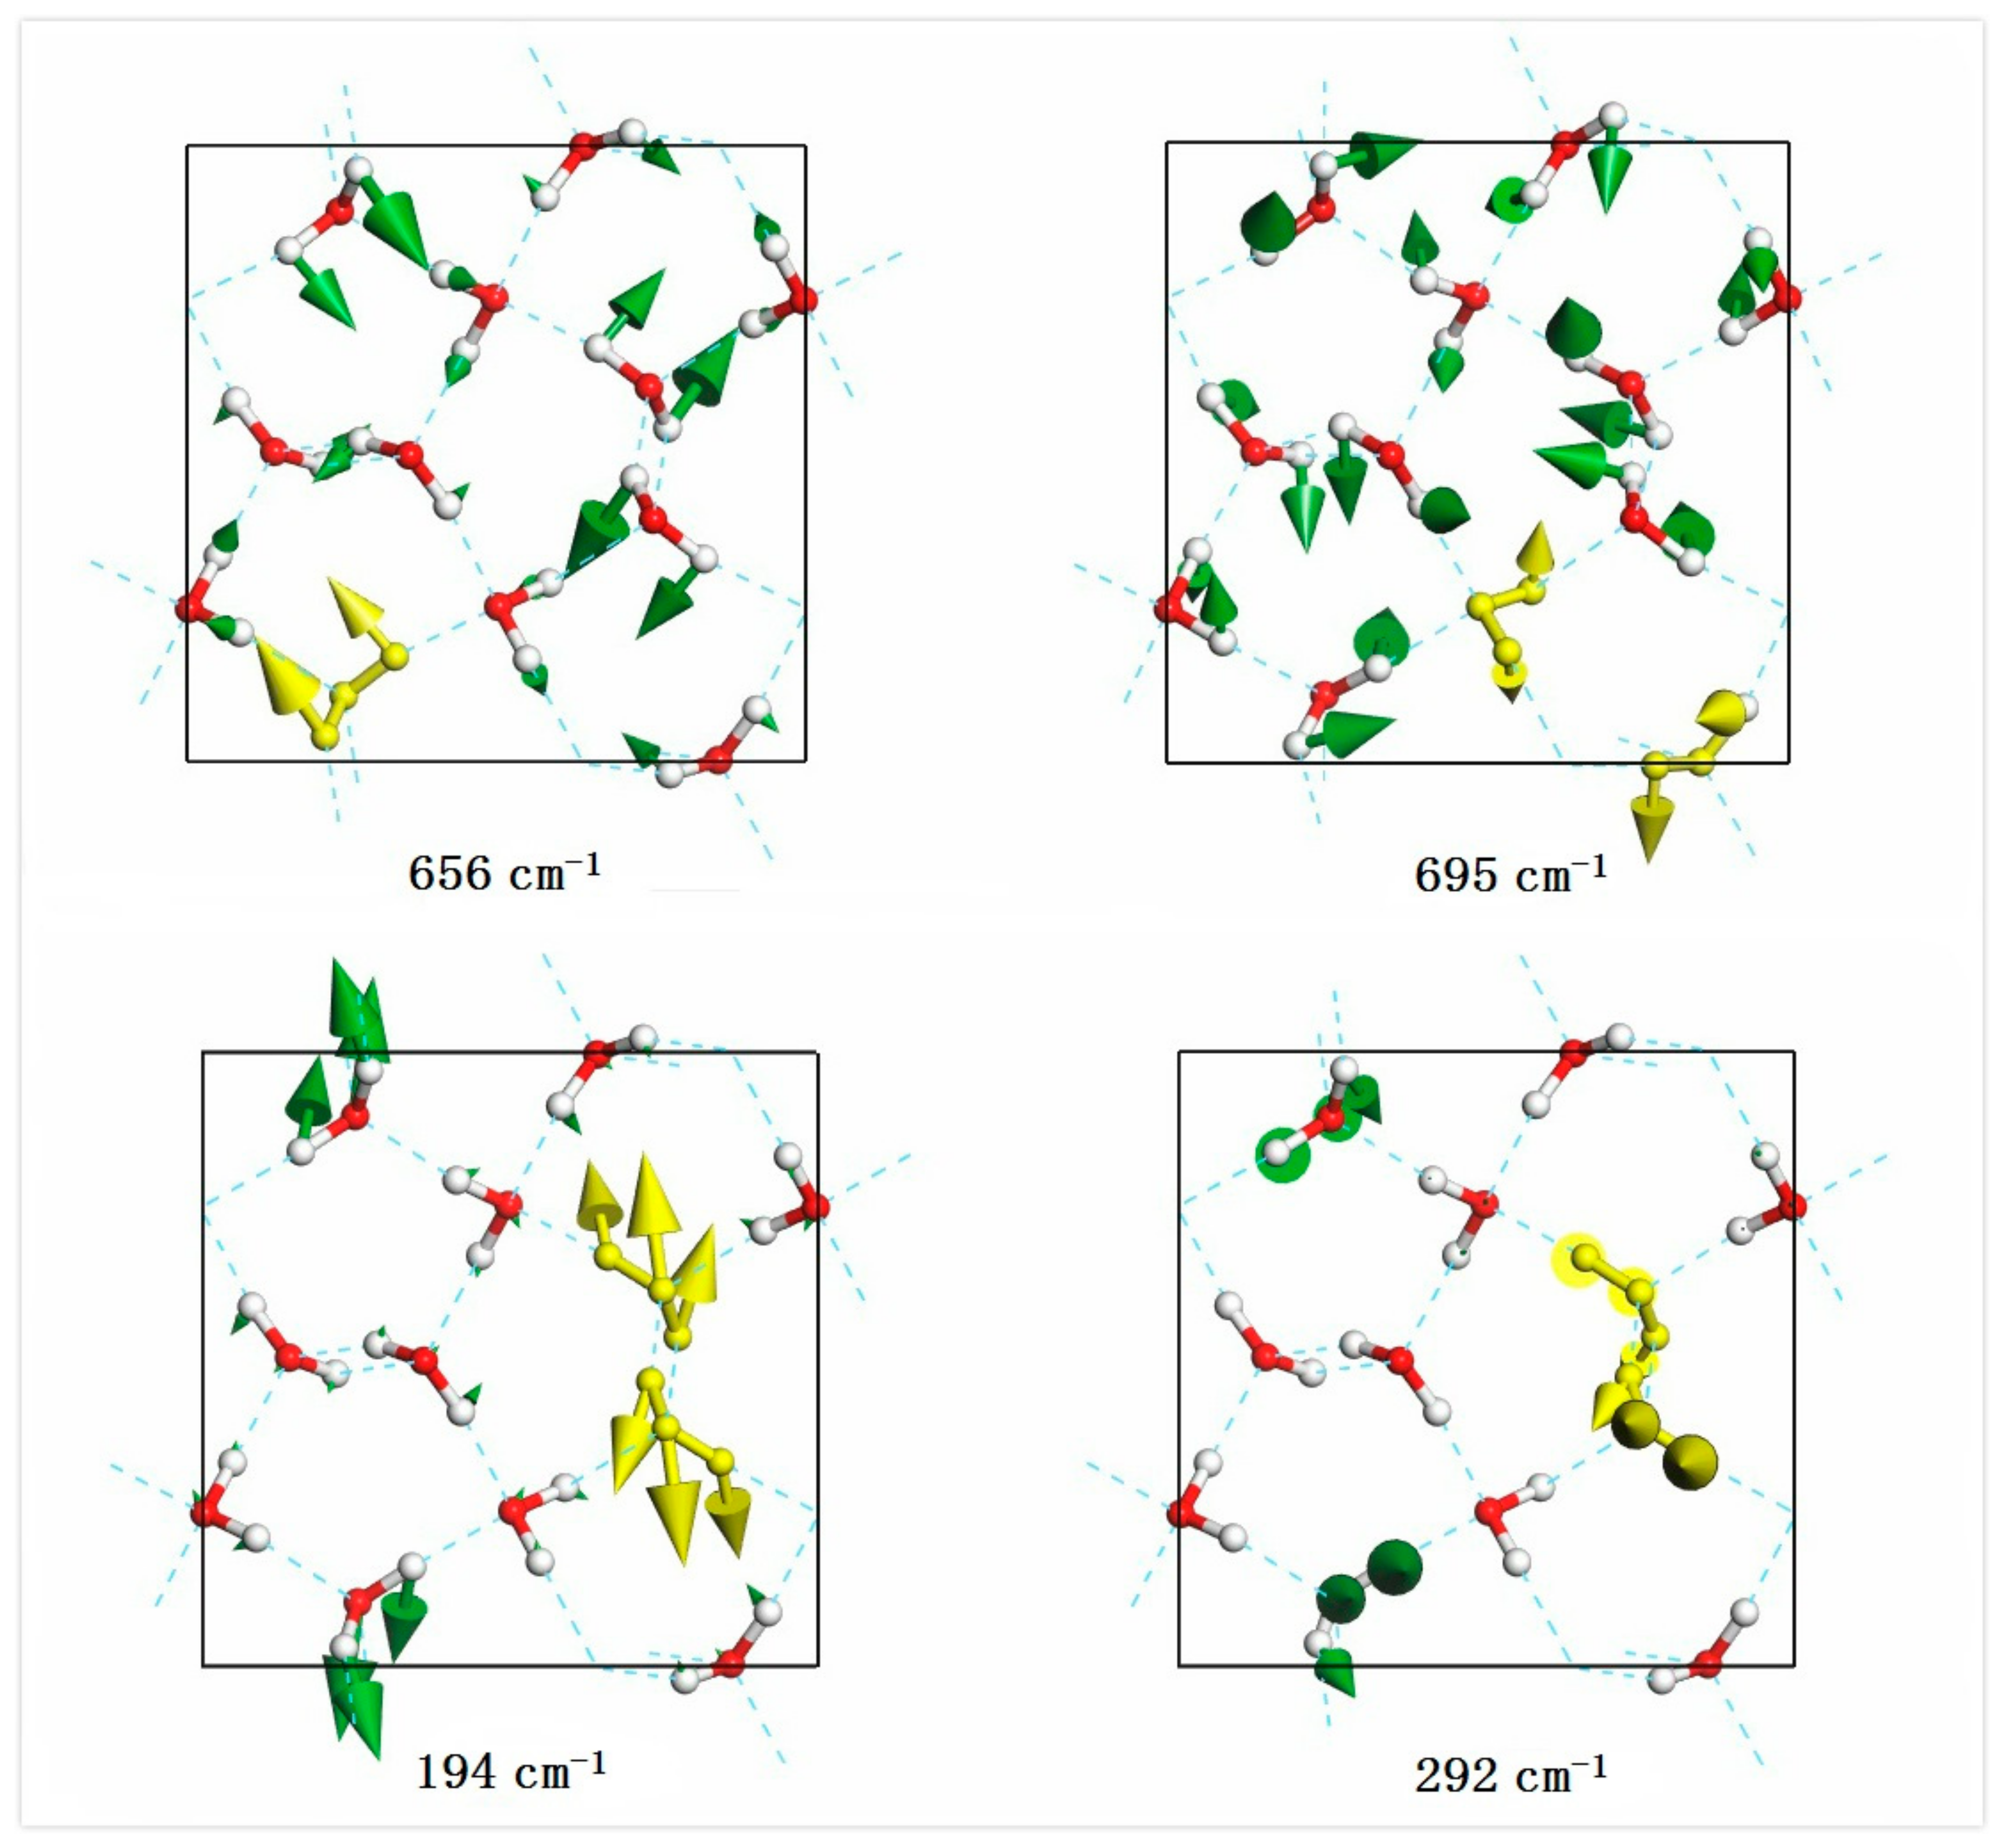
| 194 | 0.01 | |||
| 199 | —/~208 | 199 | 0.16 | |
| 209 | 0.07 | |||
| 226 | 211 | 0.67 | 241/—/— | |
| 248 | 236 | 0.14 | ||
| 277 | 0.17 | 314/—/— | ||
| 279 | 279 | 0.16 | ||
| 288 | —/~288 | 289 | 0.00 | |
| 292 | 0.08 | |||
| 504 | ~464/— | 502 | 0.39 | |
| 512 | 510 | 0.06 | ||
| 518 | 3.88 | 462/490/470 | ||
| 523 | 0.45 | |||
| 524 | 1.23 | 488/—/— | ||
| 543 | 545 | 0.01 | ||
| 563 | ~560/— | 570 | 0.25 | |
| 583 | 4.54 | 527/—/— | ||
| 585 | 4.34 | 562/—/553 | ||
| 593 | 591 | 1.13 | ||
| 612 | 613 | 0.55 | ||
| 620 | 0.01 | |||
| 625 | 1.51 | |||
| 631 | 0.20 | |||
| 632 | 0.61 | |||
| 639 | ~632/— | 642 | 0.09 | |
| 643 | 1.56 | |||
| 652 | 657 | 1.41 | ||
| 671 | 3.72 | |||
| 688 | 684 | 1.34 | ||
| 695 | 0.05 | |||
| 701 | 6.14 | |||
| 705 | 702 | 2.20 | ||
| 725 | 724 | 1.10 | ||
| 729 | 1.14 | |||
| 748 | 733 | 1.30 | ||
| 757 | ~760/— | 751 | 0.03 | |
| 777 | 790 | 0.42 | ||
| 796 | 798 | 1.50 | 790/—/— | |
| 817 | 817 | 0.49 | ||
| 846 | 845 | 0.43 | ||
| 853 | 2.00 | |||
| 876 | 874 | 0.51 | ||
| 903 | ~904/— | 891 | 10.72 | 867/—/— |
| 930 | 932 | 0.00 | ||
| 933 | 1.50 | |||
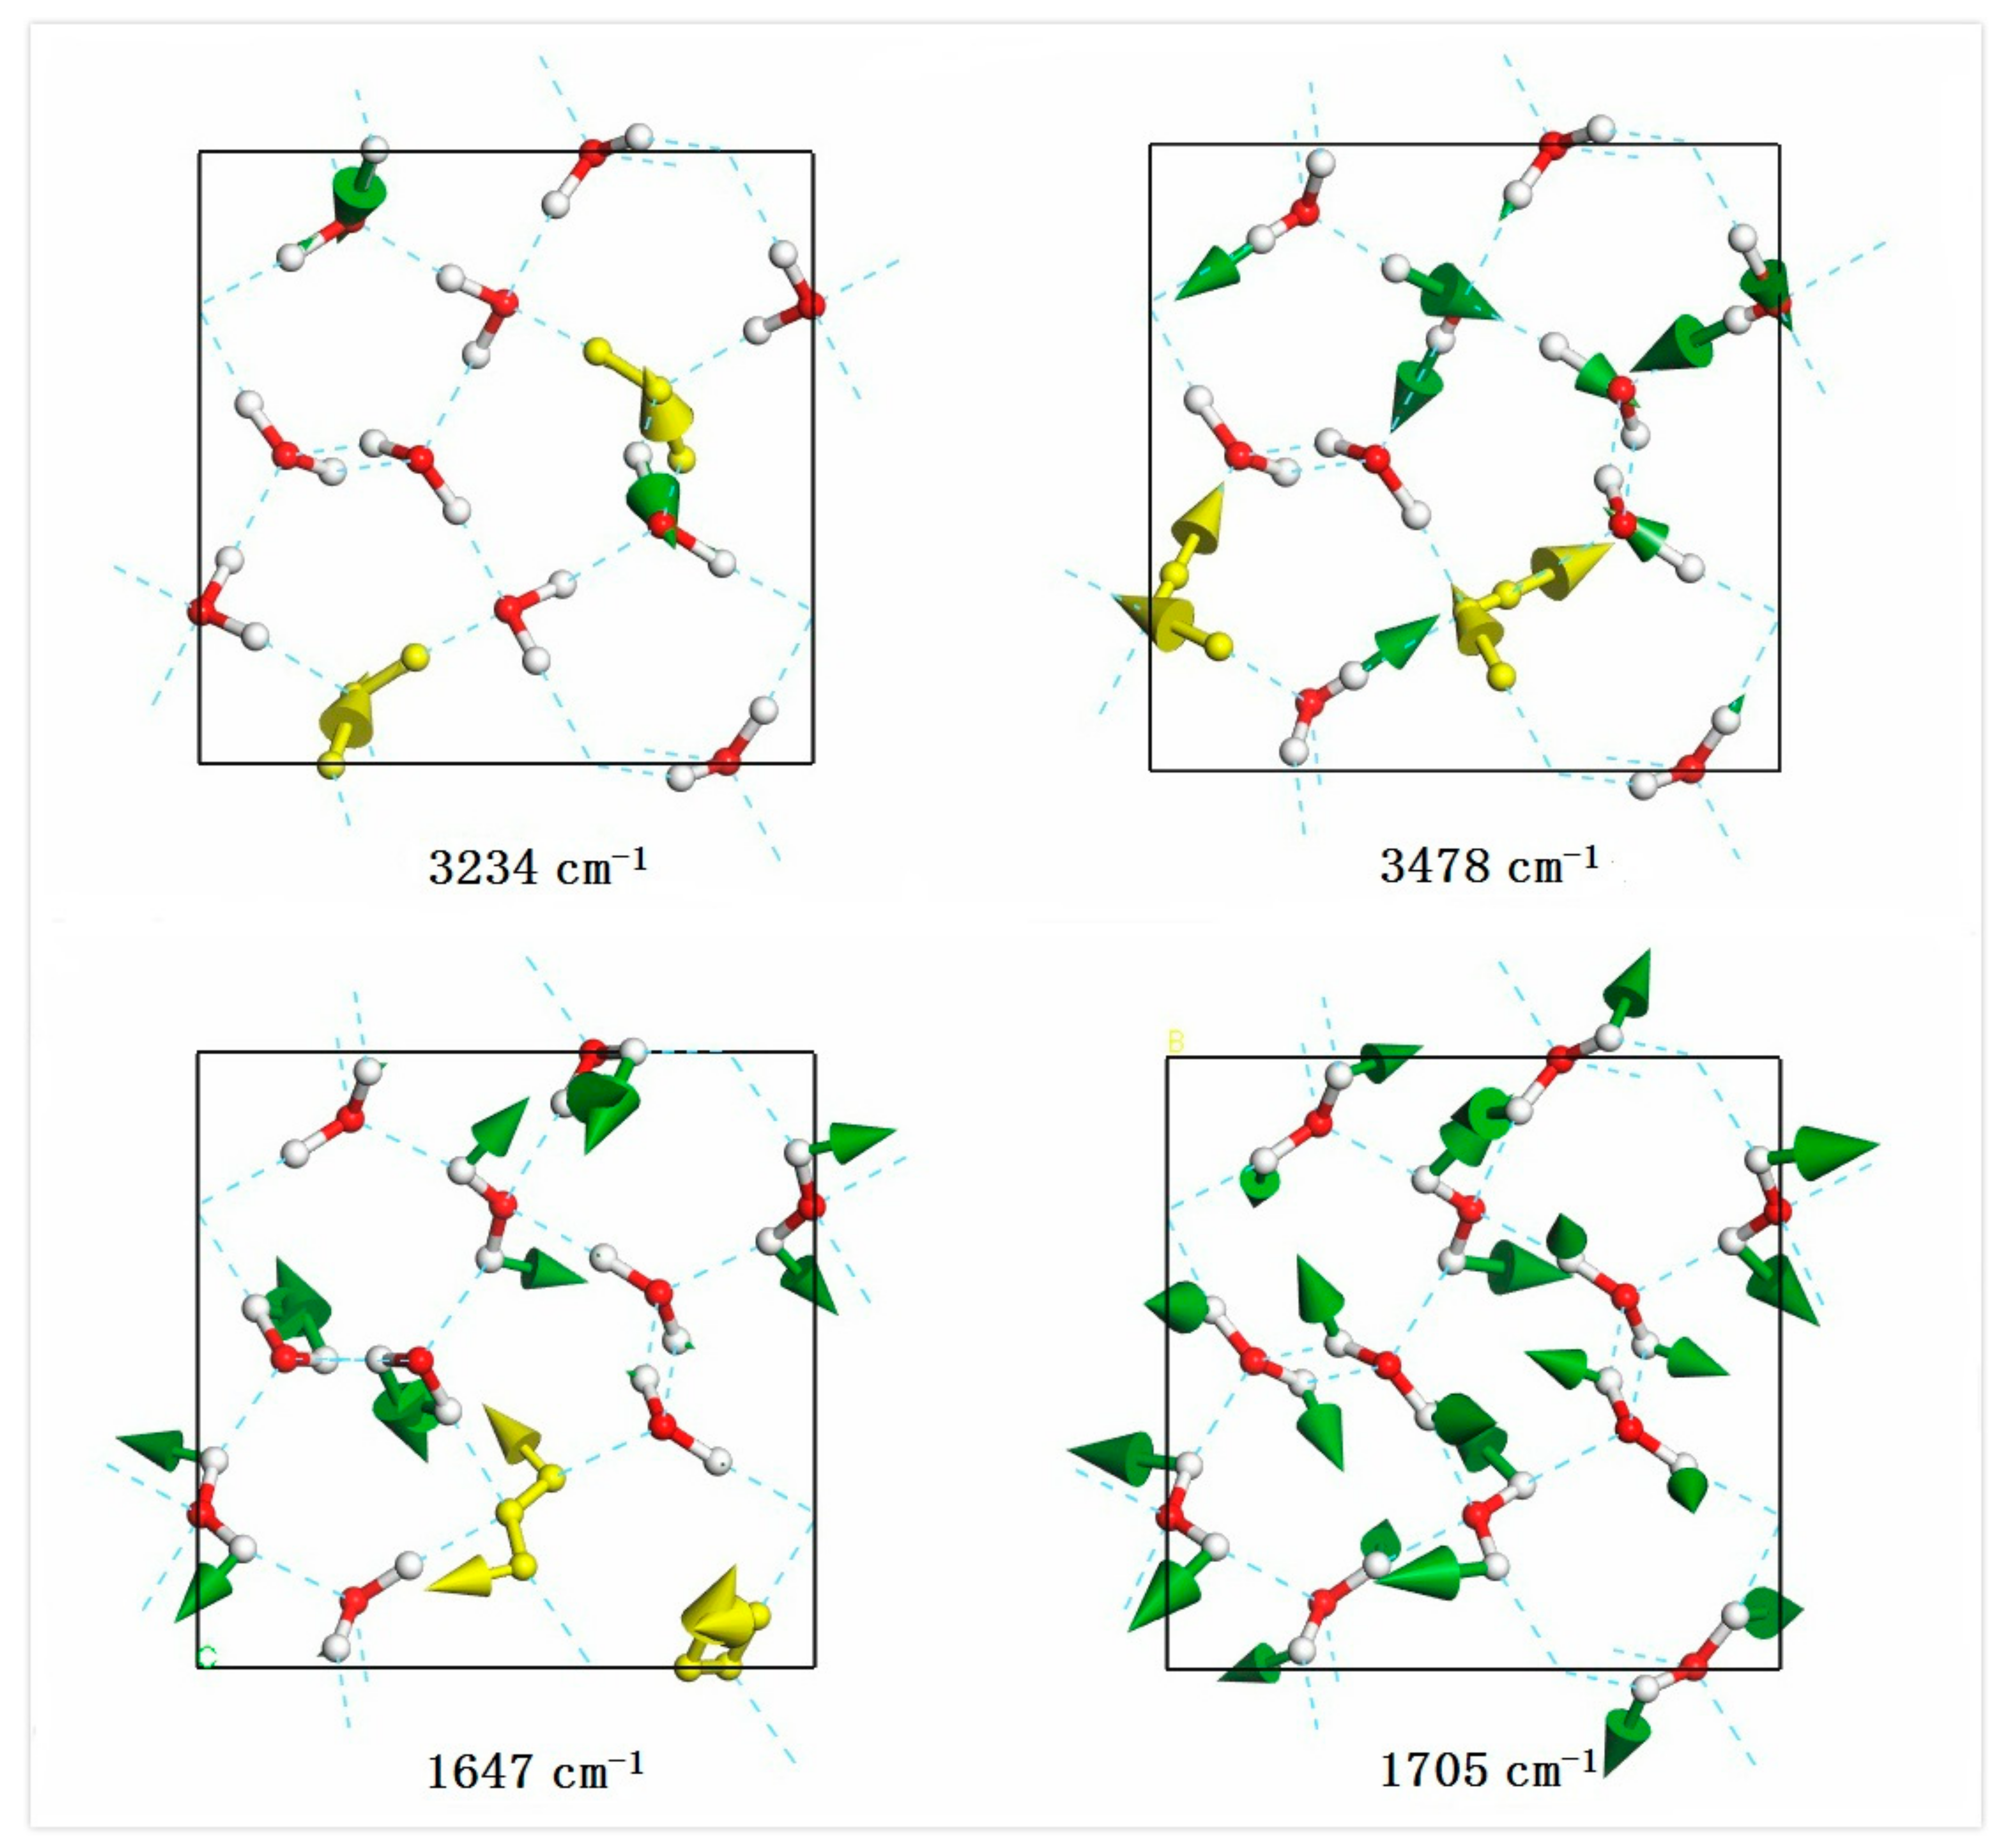
| 1647 | 1.24 | |||
| 1661 | 4.30 | |||
| 1665 | 1663 | 5.87 | ||
| 1668 | 1.15 | |||
| 1669 | 1.42 | |||
| 1671 | 0.04 | |||
| 1687 | 1684 | 1.46 | ||
| 1693 | 1705 | 0.32 | ||
| 1720 | 1722 | 0.01 | ||
| 1727 | 1725 | 1.05 | ||
| 1734 | 0.10 | |||
| 1735 | 0.80 | |||
| 3234 | 1519.40 | 3214/3215/3209 | ||
| 3238 | 3235 | 15.13 | ||
| 3260 | 3269 | 1975.96 | 3317/—/3310 | |
| 3283 | 3275 | 22.23 | ||
| 3302 | 3322 | 1.01 | ||
| 3333 | 3334 | 72.87 | ||
| 3343 | 1510.66 | 3326/—/— | ||
| 3351 | 0.17 | |||
| 3358 | 3352 | 21.79 | ||
| 3375 | 931.33 | 3346/—/3340 | ||
| 3376 | 3377 | 37.50 | ~3348/—/— | |
| 3390 | 26.01 | |||
| 3395 | 343.97 | 3368/—/— | ||
| 3400 | 3398 | 41.58 | ||
| 3402 | 170.77 | |||
| 3411 | 3411 | 31.95 | ||
| 3447 | 0.61 | |||
| 3449 | 3450 | 77.66 | ||
| 3451 | 434.71 | ~3407/3410/3415 | ||
| 3458 | 12.08 | |||
| 3465 | 38.95 | |||
| 3467 | 17.76 | |||
| 3473 | 3470 | 104.38 | ||
| 3478 | 396.50 |
© 2018 by the authors. Licensee MDPI, Basel, Switzerland. This article is an open access article distributed under the terms and conditions of the Creative Commons Attribution (CC BY) license (http://creativecommons.org/licenses/by/4.0/).
Share and Cite
Zhang, K.; Zhang, P.; Wang, Z.-R.; Zhu, X.-L.; Lu, Y.-B.; Guan, C.-B.; Li, Y. DFT Simulations of the Vibrational Spectrum and Hydrogen Bonds of Ice XIV. Molecules 2018, 23, 1781. https://doi.org/10.3390/molecules23071781
Zhang K, Zhang P, Wang Z-R, Zhu X-L, Lu Y-B, Guan C-B, Li Y. DFT Simulations of the Vibrational Spectrum and Hydrogen Bonds of Ice XIV. Molecules. 2018; 23(7):1781. https://doi.org/10.3390/molecules23071781
Chicago/Turabian StyleZhang, Kai, Peng Zhang, Ze-Ren Wang, Xu-Liang Zhu, Ying-Bo Lu, Cheng-Bo Guan, and Yanhui Li. 2018. "DFT Simulations of the Vibrational Spectrum and Hydrogen Bonds of Ice XIV" Molecules 23, no. 7: 1781. https://doi.org/10.3390/molecules23071781
APA StyleZhang, K., Zhang, P., Wang, Z.-R., Zhu, X.-L., Lu, Y.-B., Guan, C.-B., & Li, Y. (2018). DFT Simulations of the Vibrational Spectrum and Hydrogen Bonds of Ice XIV. Molecules, 23(7), 1781. https://doi.org/10.3390/molecules23071781