Abstract
This work aims at the theoretical description of EphA2-ephrin A1 inhibition by small molecules. Recently proposed ab initio-based scoring models, comprising long-range components of interaction energy, is tested on lithocholic acid class inhibitors of this protein–protein interaction (PPI) against common empirical descriptors. We show that, although limited to compounds with similar solvation energy, the ab initio model is able to rank the set of selected inhibitors more effectively than empirical scoring functions, aiding the design of novel compounds.
1. Introduction
The erythropoietin-producing hepatocellular carcinoma (Eph) receptors are probably the largest family of receptor tyrosine kinases (RTKs) and includes 14 members [1] divided into class A (EphA) and class B (EphB), based on the binding affinity for their ligands (ephrins, also divided into classes A and B), and sequence homology [2]. Ephrins are membrane proteins with the A class connected to the membrane by a phosphatidylinositol (GPI) linker, and the B class linked via a hydrophobic domain. While interclass binding has been reported [3,4], ephrin A-type ligands generally bind to EphA receptors, whereas ephrin B-type ligands interact with EphB receptors.
The Eph-ephrin signaling system is known to play important and diverse biological functions that involve cell–cell interactions both during embryonic development and for maintaining homeostasis in adult cells. For instance, in embryos, the Eph-ephrin system finely tunes tissue boundary formation, including central nervous system patterning [5], while in adults it controls bone and intestinal homeostasis, immune system functions and angiogenic processes. The Eph-ephrin system is currently gaining interest in the context of drug discovery as it has been found hyperactivated in several cancers [6]. Among the cloned Eph receptor subtype, EphA2 has been studied the most in the oncology field since the overexpression and/or the hyperactivation of this receptor has been linked to the insurgence and progression of several cancer types, including brain, lung, breast, ovarian and prostate [7]. Moreover, the abnormal activity of this receptor has been associated with poor prognosis [8]. Due to its increasing recognition as a tumorigenic protein, the EphA2 receptor has gained interest as a target protein for novel cancer therapies [9].
One of the available approaches targeting Eph-ephrin system (and EphA2 with its physiological ligand, ephrin-A1, in particular) involves small molecule inhibitors [1] able to prevent ephrin-A1 binding to EphA2. Several classes of inhibitors of this specific protein–protein interaction (PPI) have been recently identified [10,11,12]. The most promising class is represented by lithocholic acid (LCA) and its -amino acid conjugates [7,13]. It has been demonstrated by surface plasmon resonance (SPR) analysis that this class of compounds prevents ephrin-A1 binding to EphA2 by targeting a conserved region of the ligand-binding domain of EphA2 [14,15].
Molecular modeling investigations performed with classical force fields have identified a likely binding mode for these inhibitors consistent with available structure–activity relationship (SAR) data, i.e., proposing a reasonable role for the terminal carboxylic group and the amino acid side-chain of the inhibitors during their docking within EphA2 [13,14]. However, attempts to build quantitative models correlating experimental activities to docking energies led to modest results [13], suggesting that classical methods may not be able to properly describe accommodation of amino acid conjugates of LCA within EphA2 ligand binding domain (LBD).
Ligand-receptor binding is often examined using empirical or semi-empirical methods with a diverse level of success [16,17,18,19], particularly in terms of the virtual screening campaigns. A way to improve the quality of the results could involve ab initio calculations, but due to the computational time required, these are rather impractical in the screening of potential drug candidates. On the other hand, quantum chemical calculations are able to provide insight into the physical nature of the receptor–ligand interactions. Studying small-molecule PPI inhibition is usually more challenging than evaluation of interactions in regular protein–ligand complexes [20]. For instance, binding cavities for inhibitors targeting PPIs are flat and often featured by the presence of aromatic residues, such as Phe, Tyr or Trp residues [21]. Empirical scoring functions, commonly used for scoring of receptor–ligand interactions, are not really suited for PPIs [22,23]. Despite the fact that some empirical and semi-empirical approaches have been applied to score PPI inhibitors with moderate success [24,25,26,27], ab initio derived models appear to be better suited for studying PPI recognition by small molecules, since they offer a detailed insight into the physical basis of such interactions.
When polar or charged systems are investigated, the computationally inexpensive non-empirical electrostatic term is sufficient to model the experimental data [28,29]. However, accounting for the dispersive interactions is required for a general description targeting any receptor–ligand complex, irrespectively of the physical nature of binding within such a system [30]. While non-empirical evaluation of the multipole electrostatic term conveniently scales with the size of the complex under study as the squared number of atoms, ab initio calculations of dispersion energy are computationally demanding, scaling with at least the fifth power of the number of atomic orbitals. However, dispersion interactions could be approximated, for instance, by the function, which successfully describes non-covalent interactions with atom–atom potentials fitted to reproduce the results of high-level quantum chemical calculations [31,32]. Recently developed non-empirical model comprising long-range terms of interaction energy, i.e., multipole electrostatic moment and dispersion contribution approximated by function [31,32], which offers a great enhancement in the computational time, was already tested on several systems, including essentially non-polar complexes of fatty acid amide hydrolase (FAAH) [33], pteridine reductase 1 (TbPTR1) featuring both dispersive and electrostatic interactions [34], and menin-mixed lineage leukemia (MLL) system [35], in which electrostatic interactions are dominant.
Such an approach neglects, among other entropic contributions, the influence of solvation effects. To include the latter, one would need a much more time-consuming method, for instance free-energy perturbation (FEP), Molecular Mechanics/Poisson-Boltzmann, Molecular Mechanics/Generalized Born Surface Area (MM/GBSA and MM/PBSA, respectively) [36] or Fragment Molecular Orbital (FMO) approach [37]. The quantum chemical methods (like DFT or MP2) are rather not combined with empirical solvation or ligand entropy estimates [36], and therefore they should work only if the neglected contributions to the energy of binding are similar within the studied set of complexes.
In the work presented herein, we attempt to reproduce the experimental ranking of a congeneric series of EphA2-ephrin A1 inhibitors [38] (shown in Table 1) with a recently developed simple ab initio model comprising multipole electrostatic and dispersion contributions, . Such a model was previously validated on another set of protein–protein inhibitors [35], and not only the inhibitory activity ranking was reproduced, but novel inhibitors (i.e., not present in the training set) were successfully scored. We show here that if we limit our analysis to a set of EphA2-ephrin A1 inhibitors featuring similar solvation energy, ab initio modeling of the interactions provides computational results which parallel experimental potency data well. Moreover, such a model is able to outperform several commonly used empirical scoring functions.

Table 1.
The structures and experimental activity a of inhibitors targeting EphA2-ephrin A1 interaction. The numbering of the structures is consistent with Table 1 from [13].
2. Results and Discussion
EphA2 binding site representation, shown in Figure 1, comprises six amino acid residues: Cys70, Cys188, Phe108, Arg103, Val72 and Met73 (more details regarding the model are given in the Materials and Methods section). All 15 analyzed inhibitors (Table 1) shared a similar binding mode [13], with a –COOH group facing Arg103 residue, in agreement with SAR data. Moreover, their common LCA scaffold was positioned almost identically. Thus, this steroidal moiety was excluded from the analysis and the compounds were cut in a way indicated by the red line in Table 1. Accordingly, the inhibitors were represented by smaller entities corresponding to the variable part of the inhibitor structure. Binding poses of models of two inhibitors, 20 (l-Trp derivative) and 19 (d-Tyr derivative), i.e., the most and least potent compounds, respectively, are presented in Figure 1.
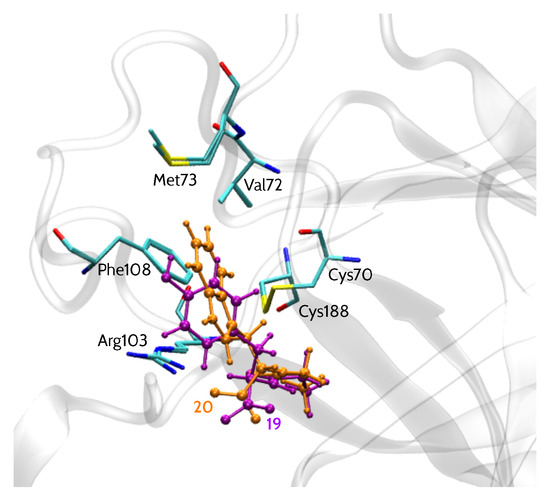
Figure 1.
EphA2 binding site representation with bound inhibitors 19 (d-Tyr) and 20 (l-Trp).
2.1. Theoretical Models
Total binding energy values of EphA2 inhibitors for consecutive levels of Hybrid Variation–Perturbation Theory (HVPT) [39,40] and, in addition, energy results, are provided in Table 2. Pairwise interaction energy values between each inhibitor and a given amino acid residue are given in Table S1 in Supplementary Materials. Apparently, the main contribution to the total interaction energy calculated at the MP2 level of theory is due to the electrostatic energy. As a result, and energy values are comparable in magnitude (Table 2).
Table 2.
Total EphA2-inhibitor interaction energy a at the consecutive levels of theory.
The dominant electrostatic effects appear to arise from the interaction between counter-charged inhibitors and Arg103 residue (charges of and , respectively). Indeed, as shown in Figure 2, which presents the electrostatic contribution to the binding energy of each amino acid residue, Arg103–inhibitor interaction has the major impact on the total energy. Compared to Arg103, the remaining residues are of minor contribution. All inhibitors are directed towards Arg103 residue with their common –COOH group. Thus, any positional inaccuracy of the docked compounds related to Arg103 residue could mask the subtle interactions with other residues.
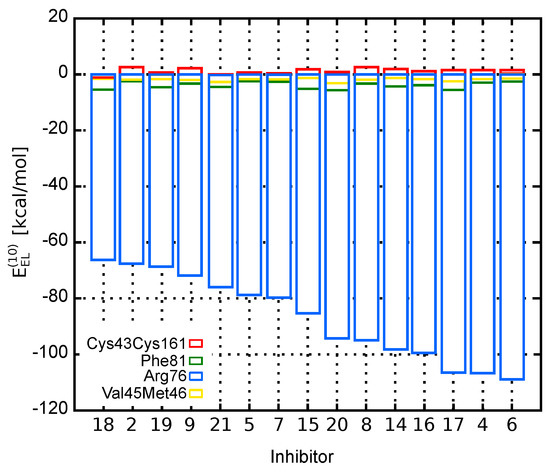
Figure 2.
Contribution of EphA2 amino acid residues to the EphA2-inhibitor binding energy represented by the electrostatic term, .
In general, more potent inhibitors are characterized by higher absolute values of the interaction energy (Table 2). To assess the relationship between the total binding energy and the inhibitory activity, interaction energy terms evaluated within HVPT energy decomposition scheme were correlated with values established experimentally [13]. It can be seen in Table 2 that the interaction energy results computed at the electrostatic and MP2 levels of theory are comparable in terms of the correlation with the experimental inhibitory activity ( and , respectively). Correlation coefficient of the multipole electrostatic model of inhibitory activity is slightly lower (), but the values of the statistical predictor (the success rate of prediction of relative affinities, explained further in the Materials and Methods section) are comparable for all three levels of theory and remain within the range between 75.0% (, ) and 76.9% (). The first order Heitler–London energy () is characterized by the weakest relationship with the experimental inhibitory activity (, Table 2), which is due to the repulsive term of the interaction energy. Apparently, the short-range exchange term of the interaction energy has contributed to the greatest extent to the binding of inhibitors with higher affinity to the EphA2 LBD, resulting in the drop of the R value at the level of theory. It has already been observed for other complexes [29,34] that structures obtained with empirical docking protocols and further evaluated with ab initio methods appear to suffer from the presence of artificially shortened intermolecular distances. Due to the sensitivity of short-range interaction energy components to any structural deficiencies, long-range binding energy terms seem to be more suitable for the determination of the relative ligand binging affinities [41]. Thus, the following level of theory, which accounts for short-range delocalization contribution (), is only slightly improved compared to in terms of the correlation (, Table 2). Nevertheless, only the introduction of the correlation term , that is present in energy, is able to recover the predictive abilities of the inhibitory activity model, as the corresponding correlation coefficient amounts to . Similarly to values of the Pearson correlation coefficient, values associated with and are also lower compared to the statistical outcome obtained for the remaining levels of theory.
Among all presented levels of theory, model offers the best performance ( or , ). Reasonable agreement with experimental binding potency yielded by model indicates that accounting only for long-range interaction energy terms could compete with the computationally expensive MP2 level of theory. Still, its predictive abilities for EphA2-ephrin A1 inhibitors appear to be rather limited. Therefore, the impact of solvation was further analyzed to check whether it might be significant in this particular system.
2.2. Solvation Energy of Inhibitors
PPI contact surfaces are large [42], and the targeted EphA2 receptor fits into this description. Therefore, with a small molecule inhibitor bound, the EphA2 binding site remains relatively solvent exposed. As a result, solvation effects could possibly affect the interaction energy and influence the correlation between the latter and the experimental binding affinities. On the other hand, in the case of inhibition of another PPI system, i.e., menin-MLL complex [35], the nonempirical model accounting for the gas phase interaction only was sufficient to reproduce the experimental data. This could arise from the fact that substantially more amino acid residues surround menin ligands than in the case of EphA2 receptor. To determine the importance of solvation effects for binding of EphA2-ephrin A1 inhibitors, solvation free energy was calculated for all compounds analyzed herein.
The solvation free energy, , along with its electrostatic and non-electrostatic contributions ( and , respectively), is given in Table 3 for each EphA2 inhibitor. It can be concluded from the analysis of the correlation coefficient values provided in Table 3 that energy values do not explicitly correlate with the experimental binding potency. Nonempirical models of inhibitory activity applied herein operate under the assumption that the enthalpic contribution to the binding free energy is responsible for the observed differences in ligand binding affinity. Accordingly, applicability of the interaction energy-based nonempirical approaches is limited to the set of ligands characterized by similar solvation free energy. Considering the suboptimal performance of model in predicting the inhibitory activity of EphA2 ligands (, see Table 2), compared to more significant correlation obtained previously for, e.g., menin-MLL inhibitors ( [35]), the possible influence of the solvation effects was further investigated by calculating of solvation for FAAH [33], TbPTR1 [34] and menin-MLL [35] inhibitors. In all cases, is calculated at the MP2 level of theory, but the basis sets used depend on the system (FAAH: 6-31G(d), menin-MLL: 6-31G(d), TbPTR1: 6-311G(d) with diffuse functions on S and P orbitals of chlorine atoms; the choice of basis set was made to match the remaining ab initio interaction energy calculations performed for each of these systems). The solvation free energies of FAAH, TbPTR1 and menin-MLL inhibitors (22, 6, and 18 inhibitors in each system, respectively) are given in Supplementary Materials in Tables S2–S4. Comparison of the corresponding standard deviation is provided in Table 4 for all abovementioned inhibitors.
Table 3.
Solvation free energy () of inhibitors of EphA2-ephrin A1 interaction with its electrostatic, , and non-electrostatic, , contributions a.
Table 4.
Performance of and models and differences in ligand solvation free energy for EphA2-ephrin A1, menin-MLL [35], FAAH [33], and TbPTR1 [34] inhibitors.
Among the ligand sets presented in Table 4, EphA2-ephrin A1 inhibitors are characterized by the largest value of standard deviation of solvation free energy (). Since the linear relationship between interaction energy and experimental affinities assumes, among other factors, that the solvation effects are comparable for all inhibitors within the set, this could indicate that this expectation is not met in the case of EphA2-ephrin A1 inhibitors. Considering that PCM results can be obtained easily, standard deviation could be used as an initial predictor of the applicability of model.
Compared to FAAH and TbPTR1 ligand sets, characterized by significantly lower values of standard deviation (Table 4), model provides less accurate inhibitory activity predictions in the case of both EphA2-ephrin A1 and menin-MLL systems. On the other hand, the best performing model is not able to predict the EphA2-ephrin A1 inhibitory activity to the extent observed for menin-MLL or TbPTR1 inhibitors. Therefore, it seemed interesting if omitting the inhibitors that differ the most in terms of values (compounds 20, 7, 2 and 18, all marked in white in Figure 3) would improve the results. The standard deviation of solvation free energy associated with the resulting reduced set of EphA2 inhibitors is equal to . The correlation coefficients obtained for the full and reduced ligand sets are compared in Figure 4 for , , and models. The corresponding correlation coefficients and values for all the nonempirical models of inhibitory activity, as applied to the full and reduced ligands sets, are provided in the Supplementary Materials (Table S5). Indeed, the reduced set of EphA2 inhibitors, obtained by selecting the compounds with essentially similar solvation free energies (Figure 3) features improved values of correlation coefficients. In particular, model provides the most accurate predictions (Figure 4), as the corresponding correlation coefficient R amounts to ().
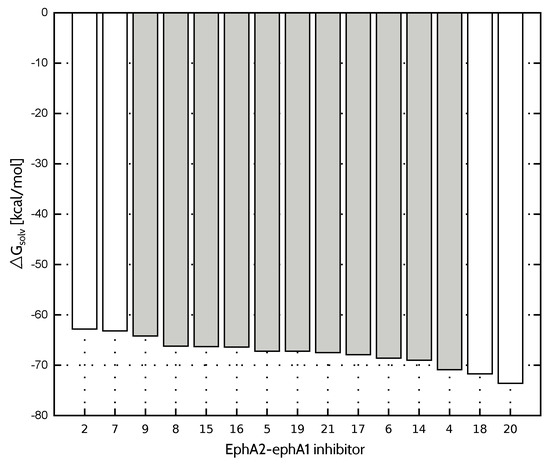
Figure 3.
Solvation free energy of EphA2-ephA1 inhibitors. Compounds indicated in white were not included in the reduced ligand set.
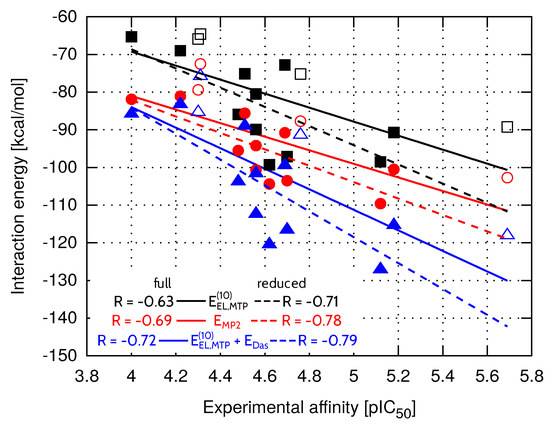
Figure 4.
Total EphA2-inhibitor interaction energy at the selected levels of theory within the full (solid line) and reduced (dashed line) ligand sets. The reduced set of EphA2 inhibitors consists of the compounds shown with full symbols.
Overall, selection of ligands to be excluded based on their differences is rather an arbitrary approach, as one could iteratively select inhibitors to reach even lower standard deviation values and, presumably, better predictive abilities of the nonempirical approach. On the other hand, a more extensive elimination of compounds does not necessarily improve the correlation coefficient between the given interaction energy model and the experimental binding potency. It can be seen in Figure 3 that ligands 4 and 9 feature values similar to compounds 2, 7, 18 and 20, already exluded from the initial set due to solvation free energy differing the most in comparison with the majority of EphA2 inhibitors considered herein. However, further limiting the size of the test set by removal of compounds 4 and 9 results in no improvement in the correlation coefficient values ( and for and , respectively), despite substantial drop in the standard deviation equal to . It should be noted that since the models of receptor–ligand complexes are developed with certain approximations due to the lack of experimental structures, they cannot be expected to provide perfect agreement with the experimental binding potency. Therefore, the ligand elimination based on the differences also appears to be a limited approach. Nevertheless, it provides a reasonable basis for the exclusion of the outliers with simultaneous improvement in the performance of nonempirical models applied herein.
2.3. Empirical Evaluation of EphA2-Ephrin A1 Inhibitors
To further evaluate the predictive potential of various empirical descriptors related to receptor–ligand binding, Solvent Accessible Surface Area (SASA) and Molecular Hydrophobicity Potential (MHP) were calculated for each EphA2-ephrin A1 inhibitor. Both lipophilic () and hydrophilic match surfaces () obtained with MHP calculation could help to assess the hydrophobic/hydrophilic complementarity of the analyzed ligands to the receptor binding site, which is based on the surface area of favorable (hydrophilic-hydrophilic) and unfavorable (hydrophilic-hydrophobic) contacts [43]. A number of scoring functions were also used for comparison, namely LigScore1 [44], PLP2 [45,46], Jain [47], PMF [48], PMF04 [49], Ludi1 [50], and Ludi3 [51] (available in Discovery Studio 2017 [52]), GoldScore, ChemScore and ASP (implemented in Gold program [53]), AutoDock Vina [54], ChemPLP (Plants program [55]), and Glide SP [56]. Correlation coefficients associated with all these empirical approaches are compared in Figure 5 for both full and reduced ligand sets. The numerical data reflecting each empirical score obtained for EphA2 inhibitors alongwith the corresponding correlation coefficients and values are provided in Table S6 in Supplementary Materials.
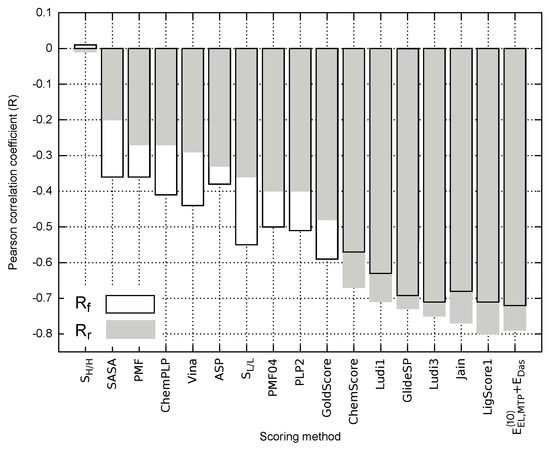
Figure 5.
Pearson correlation coefficients obtained for the empirical scoring methods and model applied to the full () and reduced () ligand sets.
The best performing empirical descriptors for both full and reduced ligand sets include LigScore1, Jain, Ludi3, GlideSP and Ludi1 (Figure 5). In fact, the related correlation coefficients are comparable with the corresponding value characterizing model, e.g., in the case of full ligand set () and () for LigScore1 and , respectively (see Table S6 in Supplementary Materials). Nevertheless, the majority of the analyzed empirical scoring functions yield unsatisfactory results and are outperformed by most of the nonempirical models, including . As it has been pointed out by Li et al. [57], SASA appears to perform better as a scoring method than a number of popular scoring functions [57,58]. Accordingly, outperforming the SASA predictions might be viewed as a necessary condition, allowing for distinguishing between the scoring functions providing reasonable results and those failing to reflect the experimental binding affinity. In this particular case, most of the scoring approaches presented in Figure 5 seem to pass this test; however, only some of the empirical approaches, and model in particular, appear to provide at least semi-quantitative agreement with the experimental inhibitory activity.
In contrast to the theoretical models considered herein (Table S5 in Supplementary Materials), the correlation between the empirical scoring functions and experimental inhibitory activity values do not always improve when the reduced model is considered (Figure 5). This could arise from the fact that solvation effects might be implicitly included in the empirical description by parametrization performed with experimental binding potency. Depending on the ability of a given scoring function to account for the influence of solvent, limiting the test ligand set to the inhibitors featuring similar solvation energy might either decrease the performance of the method (PLP2 and PMF04) or improve the predictions, as can be seen for (e.g., LigScore1 and Jain; see Figure 5).
It seemed interesting to check whether there is some consistency in top scoring empirical functions throughout the systems tested so far in our group. Since some scoring functions implemented in Discovery Studio have been used also in the case of FAAH [33] and menin-MLL [35], comparison was made for these methods. The performance of LigScore1, PLP2, Jain, PMF, and Ludi1, described by correlation coefficients and percentage of successful predictions () is presented in Table 5 for FAAH, menin-MLL and EphA2-ephA1 systems. In the latter case, comparison was made based on the results associated with the reduced set of ligands featuring similar values. As demonstrated in Tables S5 and S6 in Supplementary Materials, selecting EphA2 inhibitors with relatively similar values of solvation free energy improves the performance of both nonempirical model and most of the scoring functions included in this comparison.
Table 5.
Performance of empirical scoring for FAAH, menin-MLL and EphA2-ephrin A1 systems. The results obtained for nonempirical model are provided for comparison.
It can be seen in Table 5 that both LigScore1 and Jain provide the best prediction for menin-MLL and EphA2-ephrin A1 systems. On the contrary, the performance of these scoring functions is unsatisfactory in the case of FAAH inhibitors. Entirely different predictive abilities seem to be associated with PMF function, that performs the best for FAAH system, yet it fails in the case of both menin and EphA2 inhibitors. As for the remaning empirical scoring functions compared herein, PLP2 appears to provide valid predictions only for menin-MLL system, whereas Ludi1 yields rather satisfactory agreement with the experimental data for both FAAH and EphA2 inhibitors. The interactions in menin-MLL [35] and EphA2-ephrin A1 system are predominantly electrostatic in nature, and it seems that LigScore1 or Jain functions might be better suited in such a case. On the other hand, for dispersion-dominated systems like FAAH [33], PMF could be a better choice. Nevertheless, the performance of model is comparable (or superior, as demonstrated in the case of menin-MLL system) to the best empirical scoring functions in each system analyzed so far. Considering that the physical nature of interactions for novel receptor–ligand complexes can hardly be determined without time-consuming ab initio calculations and the resulting choice of a reliable empirical scoring function might not be clear, the nonempirical model appears to be a preferable method, capable of providing the predictions with a reasonable quality at the computational cost comparable to that of empirical scoring functions.
3. Materials and Methods
3.1. Preparation of the Structures
From the LCA-based structures reported by Incerti et al. [13], all active -amino acid LCA conjugates were selected. An LCA compound was not included in this analysis on account of the likely multiple binding modes within EphA2 [14]. In contrast, LCA amino acid conjugates studied herein presumably possess a single binding mode due to the interaction between the carboxylate group and Arg103 residue of EphA2 receptor. The structures of the selected inhibitors and the corresponding vales (taken from [13]) are given in Table 1.
The geometries of EphA2-inhibitor complexes, obtained from molecular docking simulation [13], were provided by Incerti et al. [13]. Since the goal of the analysis was to investigate the influence of amino acid substituent on the activity of the inhibitors, the common LCA scaffold, positioned similarly in all complexes, was not included in the analysis. In particular, the inhibitors were cut as indicated by the red line in the scaffold representation in Table 1.
To obtain more reliable positions of amino acid residues, all EphA2-inhibitor complexes were solvated with the TIP3 water model [59] and re-optimized in the Charmm program [60] (version c36b1, Harvard University, Cambridge, MA, USA). Hydrogen atoms were built with Hbuild command. Both Charmm General Force Field v. 2b7 [61] and Charmm22 All-Hydrogen Force Field [62,63,64] parameter files were used. Missing parameters for inhibitor structures were generated with CGenFF interface at http://cgenff.paramchem.org [61,65,66,67] (interface version 1.0.0). LCA scaffold and all amino acid residues further than 4 Å from each inhibitor were kept frozen throughout 1000 steps of steepest descent followed by conjugate gradient optimization until a root mean squared deviation of the gradient (GRMS) of Å was reached.
The model of EphA2 binding site included all residues in the vicinity of 4 Å of the interchangeable fragment of the inhibitors, i.e., Cys70, Cys188, Phe108, Arg103, Val72 and Met73 (Figure 1). Dangling bonds resulting from cutting the amino acid residues from protein structure were filled with hydrogen atoms minimized in the Schrödinger Maestro [68] program (Maestro version 9.3, Schrödinger, LLC, New York, NY, USA) using Opls 2005 force field [69].
3.2. Interaction Energy Calculations
Interaction energy between EphA2 receptor and each inhibitor was calculated within Hybrid Variation–Perturbation Theory (HVPT) [39,40] decomposition scheme as the sum of interaction energy components obtained for each residue-inhibitor dimer. Counterpoise correction was applied in the treatment of the basis set superposition error [70]. The calculations were carried out with a modified version [40] of Gamess program [71] using 6-311+G(d) basis set [72,73,74]. HVPT introduces the partitioning of the Møller–Plesset second-order interaction energy () into the multipole electrostatic (), penetration (), exchange (), delocalization () and correlation () terms:
which could be divided into the long- and short-range contributions that vary with the intermolecular distance R as and , respectively. term from Equation (1) is the electrostatic multipole component of the binding energy. Herein, it was estimated from Cumulative Atomic Multipole Moment (Camm) expansion (implemented in Gamess), truncated at the term. The first-order electrostatic energy () is obtained by adding the penetration term, , to the energy. The first-order Heitler–London energy, , is the sum of first-order electrostatic energy and the exchange component . The higher order delocalization energy, , comprising classical induction and charge transfer terms, is defined as the difference between the counterpoise-corrected self-consistent field (SCF) variational energy, , and the first-order Heitler–London energy, . The correlation term is calculated as the difference of the second-order Møller–Plesset interaction energy, , and converged SCF energy, . consists mostly of intramolecular correlation contributions, dispersion and exchange-dispersion interaction energy terms. The zero value of the second superscript accompanying some energy terms in Equation (1) represents uncorrelated interaction energy contributions. in Equation (1) denotes the scaling of the computational cost, where N and A indicate the number of atomic orbitals and atoms, respectively.
On account of the considerable computational cost of term, containing the dispersion contribution, atom–atom potential function [31,32] was calculated to obtain the approximate dispersion energy at a far more affordable computational expense. In contrast to , computation scaling with at least the fifth power of the number of atomic orbitals, , calculation scales with the square number of atoms, .
Among amino acid residues in the close proximity of a varying fragment of the LCA derivatives, only Arg103 residue is not neutral, bearing charge. Except for Arg103 residue and two polar cysteine residues, linked by disulfide bond, the remaining residues in the model of EphA2 receptor are nonpolar. The negatively charged () ligands could be considered solvent exposed, as their large fragments face water environment. Since Cys70 and Cys188 residues constitute a disulfide bridge, these residues were considered as Cys70-Cys188 dimer interacting with inhibitors. Similarly, the subsequent Val72 and Met73 residues were not separated but treated as Val72-Met73 dimer to interact with all inhibitors. The remaining residues (Arg103 and Phe108) were included separately.
3.3. Solvation Energy Calculations
for each inhibitor was computed at the MP2/6-311+G(d) level of theory in Gaussian09 [75]. The calculations involved Polarizable Continuum Model (PCM) using the integral equation formalism variant (IEFPCM) [76,77,78] and ExternalIteration [79,80], DoVacuum, and SMD [81] options.
3.4. Empirical Scoring
Empirical scoring with a variety of methods was performed for EphA2-inhibitor complexes. As scoring in the presence of water molecules appears to have little influence on the quality of predictions [82], solvent molecules were removed from protein–ligand complexes. Solvent Accessible Surface Area (SASA) [83,84] of each inhibitor was calculated in VMD [85,86] (http://www.ks.uiuc.edu/Research/vmd/) with Sasa.tcl script [87] and the sphere radius set to Å. Molecular Hydrophobicity Potential (MHP) was calculated in the Platinum program (version 1.0, Laboratory of Biomolecular Modeling, Russian Academy of Sciences, Moscow, Russia) [43]. GoldScore, ChemScore, and Astex Statistical Potential (ASP) were obtained using Gold (The Cambridge Crystallographic Data Centre, Cambridge, United Kingdom) [53] with a spherical grid centered at the alpha carbon of Arg103, comprising amino acid residues within 10 Å radius from the point of origin. Plants [55] docking program with its ChemPLP scoring function was employed with a 10 Å radius sphere. PyMOL [88] and PyMOL AutoDock/Vina plugin [89] were used for preparation of the receptor and inhibitors for scoring in AutoDock Vina (version 1.1.2, Molecular Graphics Lab at The Scripps Research Institute, La Jolla, CA, USA). The latter was carried out with Å cubic grid. Glide SP [56] (standard precision), implemented in Schrödinger Glide [90], was applied with a 15 Å grid centered on the ligand. The following scoring functions implemented in Discovery Studio 2017 [52] were used: LigScore1 [44], Piecewise Linear Potential, PLP2 [45,46], Jain [47], Potential of Mean Force, PMF [48] and PMF04 [49], Ludi1 [50] and Ludi3 [51]. In all cases, the scoring performed with Discovery Studio 2017 (Dassault Systèmes BIOVIA, San Diego, CA, USA) suite was carried out with a 10 Å radius sphere centered on the ligand. Calculations performed with AutoDock Vina, Plants, Gold, Glide, and Discovery Studio 2017 involved only scoring of the available compounds’ poses to avoid their re-docking, as this would affect the results. While using all these docking programs, the full protein structures were employed. In each case, standard settings were employed, as further described in Supplementary Materials.
3.5. Evaluation of the Results
To assess the performance of each scoring model, the Pearson correlation coefficients were calculated with respect to the experimentally determined inhibitory activity values [13]. The scoring functions with higher score indicating the greater binding potency were assigned the opposite values of the calculated correlation coefficient to facilitate the comparison with the non-empirical interaction energy results, assigning lower binding energy values to more potent inhibitors. Another performance measure applied herein involved the statistical predictor , constituting the success rate of prediction of relative affinities, and defined as the percentage of concordant pairs with relative stability of the same sign as in the reference experimentally measured activities, evaluated among all pairs of inhibitors [91]. Here, a special case has occurred as two of the examined inhibitors were reported with an identical experimental affinity ( for compounds 14 (l-Met) and 15 (d-Met) [13]). This particular pair of inhibitors was not taken into account while evaluating values.
4. Conclusions
The binding of inhibitors of EphA2-ephrin A1 system appears to be dominated by electrostatic interactions. Interaction due to the positively charged Arg103 residue constitutes the major contribution to the interaction energy between the receptor and the negatively charged inhibitors. Nevertheless, accounting for dispersion improves the predictive abilities of the theoretical models applied herein. Among the proposed nonempirical approaches characterizing EphA2-ephrin A1 inhibition, model, comprising solely long-range multipole electrostatic and approximate dispersion interactions, appears to be the best performing (, ) in terms of the agreement with the experimental data.
Furthermore, solvation effects are probably significant in the case of binding of the presented class of EphA2 inhibitors. Rather limited predictive abilities of model could be related to a relatively large standard deviation of solvation free energy of EphA2-ephrin A1 inhibitors. Compared to standard deviation obtained for ligands in other systems previously studied in our group, this value is higher and thus could indicate the limited applicability of model for this particular case. In fact, once the set of EphA2 inhibitors is restricted to the ligands featuring essentially similar solvation free energy (i.e., without the compounds 2, 7, 18, 20), the correlation of the theoretical models with the experimental results is improved, with the performance of model characterized by and .
Despite the limitations discussed above, model is able to outperform essentially all of the empirical descriptors tested herein, including the scoring functions implemented in popular docking programs, such as Gold, AutoDock Vina or Plants. Among the empirical approaches tested herein for EphA2 inhibitors, the only scoring functions that perform comparably to model in this particular case involve LigScore1, Jain and Ludi. However, the scoring performance of these functions is hardly general, as it was not satisfactory in some of the systems studied in our group [33,35]. Based on the comparison encompassing FAAH [33], menin-MLL [35] and EphA2-ephrin A1 cases, it could be tentatively stated that LigScore1 or Jain functions might be better suited for systems with predominant electrostatic interactions (e.g., menin-MLL and EphA2-ephrin A1). In contrast, PMF is probably more appropriate for dispersion-dominated systems (FAAH). Irrespectively of the physical nature of the receptor–ligand binding, the nonempirical model yields the inhibitory activity predictions comparable or outperforming the best empirical scoring function in each of these cases, at similar computational cost. While more tests are required to validate the usefulness and general applicability of model, it appears to constitute an advantageous alternative to commonly used empirical scoring approaches.
Supplementary Materials
Supplementary materials are available online.
Author Contributions
A.L. provided the data; W.J. performed the calculations and analyzed the data, together with E.D.-K.; all authors worked on the paper.
Funding
This research was funded by National Science Centre, Poland, Grant No. 2016/21/N/ST4/00516.
Acknowledgments
We thank W. Andrzej Sokalski for thoughtful reading and suggestions. Calculations were carried out using resources provided by the Wrocław Centre for Networking and Supercomputing (http://wcss.pl) and the Biovia Polish Academic Country Wide license.
Conflicts of Interest
The authors declare no conflict of interest. The founding sponsors had no role in the design of the study; in the collection, analyses, or interpretation of data; in the writing of the manuscript, and in the decision to publish the results.
References
- Lisle, J.E.; Mertens-Walker, I.; Rutkowski, R.; Herington, A.C.; Stephenson, S.A. Eph receptors and their ligands: Promising molecular biomarkers and therapeutic targets in prostate cancer. BBA-Rev. Cancer 2013, 1835, 243–257. [Google Scholar] [CrossRef] [PubMed]
- Tognolini, M.; Hassan-Mohamed, I.; Giorgio, C.; Zanotti, I.; Lodola, A. Therapeutic perspectives of Eph-ephrin system modulation. Drug Discov. Today 2014, 19, 661–669. [Google Scholar] [CrossRef] [PubMed]
- Himanen, J.P.; Chumley, M.J.; Lackmann, M.; Li, C.; Barton, W.A.; Jeffrey, P.D.; Vearing, C.; Geleick, D.; Feldheim, D.A.; Boyd, A.W.; et al. Repelling class discrimination: Ephrin-A5 binds to and activates EphB2 receptor signaling. Nat. Neurosci. 2004, 7, 501–509. [Google Scholar] [CrossRef] [PubMed]
- Qin, H.; Noberini, R.; Huan, X.; Shi, J.; Pasquale, E.B.; Song, J. Structural Characterization of the EphA4-Ephrin-B2 Complex Reveals New Features Enabling Eph-Ephrin Binding Promiscuity. J. Biol. Chem. 2010, 285, 644–654. [Google Scholar] [CrossRef] [PubMed]
- Park, J.E.; Son, A.I.; Zhou, R. Roles of EphA2 in Development and Disease. Genes 2013, 4, 334–357. [Google Scholar] [CrossRef] [PubMed]
- Chavent, M.; Seiradake, E.; Jones, E.Y.; Sansom, M.S.P. Structures of the EphA2 Receptor at the Membrane: Role of Lipid Interactions. Structure 2016, 24, 337–347. [Google Scholar] [CrossRef] [PubMed]
- Giorgio, C.; Mohamed, I.H.; Flammini, L.; Barocelli, E.; Incerti, M.; Lodola, A.; Tognolini, M. Lithocholic Acid Is an Eph-ephrin Ligand Interfering with Eph-kinase Activation. PLoS ONE 2011, 6, e18128. [Google Scholar] [CrossRef] [PubMed]
- Miyazaki, T.; Kato, H.; Fukuchi, M.; Nakajima, M.; Kuwano, H. EphA2 overexpression correlates with poor prognosis in esophageal squamous cell carcinoma. Int. J. Cancer 2003, 103, 657–663. [Google Scholar] [CrossRef] [PubMed]
- Nikolov, D.B.; Xu, K.; Himanen, J.P. Eph/ephrin recognition and the role of Eph/ephrin clusters in signaling initiation. BBA-Proteins Proteom. 2013, 1834, 2160–2165. [Google Scholar] [CrossRef] [PubMed]
- Russo, S.; Incerti, M.; Tognolini, M.; Castelli, R.; Pala, D.; Hassan-Mohamed, I.; Giorgio, C.; De Franco, F.; Gioiello, A.; Vicini, P.; et al. Synthesis and Structure-Activity Relationships of Amino Acid Conjugates of Cholanic Acid as Antagonists of the EphA2 Receptor. Molecules 2013, 18, 13043–13060. [Google Scholar] [CrossRef] [PubMed]
- Noberini, R.; Koolpe, M.; Peddibhotla, S.; Dahl, R.; Su, Y.; Cosford, N.D.P.; Roth, G.P.; Pasquale, E.B. Small Molecules Can Selectively Inhibit Ephrin Binding to the EphA4 and EphA2 Receptors. J. Biol. Chem. 2008, 283, 29461–29472. [Google Scholar] [CrossRef] [PubMed]
- Petty, A.; Myshkin, E.; Qin, H.; Guo, H.; Miao, H.; Tochtrop, G.P.; Hsieh, J.T.; Page, P.; Liu, L.; Lindner, D.J.; et al. A Small Molecule Agonist of EphA2 Receptor Tyrosine Kinase Inhibits Tumor Cell Migration In Vitro and Prostate Cancer Metastasis In Vivo. PLoS ONE 2012, 7, e42120. [Google Scholar] [CrossRef] [PubMed]
- Incerti, M.; Tognolini, M.; Russo, S.; Pala, D.; Giorgio, C.; Hassan-Mohamed, I.; Noberini, R.; Pasquale, E.B.; Vicini, P.; Piersanti, S.; et al. Amino Acid Conjugates of Lithocholic Acid as Antagonists of the EphA2 Receptor. J. Med. Chem. 2013, 56, 2936–2947. [Google Scholar] [CrossRef] [PubMed]
- Russo, S.; Callegari, D.; Incerti, M.; Pala, D.; Giorgio, C.; Brunetti, J.; Bracci, L.; Vicini, P.; Barocelli, E.; Capoferri, L.; et al. Exploiting Free-Energy Minima to Design Novel EphA2 Protein-Protein Antagonists: From Simulation to Experiment and Return. Chem. Eur. J. 2016, 22, 8048–8052. [Google Scholar] [CrossRef] [PubMed]
- Tognolini, M.; Incerti, M.; Hassan-Mohamed, I.; Giorgio, C.; Russo, S.; Bruni, R.; Lelli, B.; Bracci, L.; Noberini, R.; Pasquale, E.B.; et al. Structure-Activity Relationships and Mechanism of Action of Eph-ephrin Antagonists: Interaction of Cholanic Acid with the EphA2 Receptor. ChemMedChem 2012, 7, 1071–1083. [Google Scholar] [CrossRef] [PubMed]
- Ortiz, A.R.; Pisabarro, M.T.; Gago, F.; Wade, R.C. Prediction of drug binding affinities by computer binding analysis. J. Med. Chem. 1995, 38, 2681–2691. [Google Scholar] [CrossRef] [PubMed]
- Leach, A.R.; Shoichet, B.K.; Peishoff, C.E. Prediction of Protein-Ligand Interactions. Docking and Scoring: Successes and Gaps. J. Med. Chem. 2006, 49, 5851–5855. [Google Scholar] [CrossRef] [PubMed]
- Doweyko, A.M. 3D-QSAR Illusions. J. Comput.-Aided Mol. Des. 2004, 18, 587–596. [Google Scholar] [CrossRef] [PubMed]
- Yilmazer, N.D.; Korth, M. Comparison of Molecular Mechanics, Semi-Empirical Quantum Mechanical, and Density Functional Theory Methods for Scoring Protein-Ligand Interactions. J. Phys. Chem. B 2013, 117, 8075–8084. [Google Scholar] [CrossRef] [PubMed]
- Arkin, M.R.; Tang, Y.; Wells, J.A. Small-Molecule Inhibitors of Protein-Protein Interactions: Progressing toward the Reality. Chem. Biol. 2014, 21, 1102–1114. [Google Scholar] [CrossRef] [PubMed]
- Bienstock, R.J. Computational drug design targeting protein–protein interactions. Curr. Pharm. Des. 2012, 18, 1240–1254. [Google Scholar] [CrossRef] [PubMed]
- Laraia, L.; McKenzie, G.; Spring, D.R.; Venkitaraman, A.R.; Huggins, D.J. Overcoming Chemical, Biological, and Computational Challenges in the Development of Inhibitors Targeting Protein-Protein Interactions. Chem. Biol. 2015, 22, 689–703. [Google Scholar] [CrossRef] [PubMed]
- Kuenemann, M.A.; Sperandio, O.; Labbé, C.M.; Lagorce, D.; Miteva, M.A.; Villoutreix, B.O. In silico design of low molecular weight protein–protein interaction inhibitors: Overall concept and recent advances. Prog. Biophys. Mol. Biol. 2015, 119, 20–32. [Google Scholar] [CrossRef] [PubMed]
- Jiang, Z.Y.; Lu, M.C.; Xu, L.L.; Yang, T.T.; Xi, M.Y.; Xu, X.L.; Guo, X.K.; Zhang, X.J.; You, Q.D.; Sun, H.P. Discovery of Potent Keap1-Nrf2 Protein-Protein Interaction Inhibitor Based on Molecular Binding Determinants Analysis. J. Med. Chem. 2014, 57, 2736–2745. [Google Scholar] [CrossRef] [PubMed]
- Li, H.; Xiao, H.; Lin, L.; Jou, D.; Kumari, V.; Lin, J.; Li, C. Drug design targeting protein–protein interactions (PPIs) using multiple ligand simultaneous docking (MLSD) and drug repositioning: Discovery of raloxifene and bazedoxifene as novel inhibitors of IL-6/GP130 interface. J. Med. Chem. 2014, 57, 632–641. [Google Scholar] [CrossRef] [PubMed]
- Chen, J.; Wang, J.; Zhang, Q.; Chen, K.; Zhu, W. Probing Origin of Binding Difference of inhibitors to MDM2 and MDMX by Polarizable Molecular Dynamics Simulation and QM/MM-GBSA Calculation. Sci. Rep. 2015, 5, 17421. [Google Scholar] [CrossRef] [PubMed]
- Huang, W.; Cai, L.; Chen, C.; Xie, X.; Zhao, Q.; Zhao, X.; Zhou, H.Y.; Han, B.; Peng, C. Computational analysis of spiro-oxindole inhibitors of the MDM2-p53 interaction: Insights and selection of novel inhibitors. J. Biomol. Struct. Dyn. 2016, 34, 341–351. [Google Scholar] [CrossRef] [PubMed]
- Dyguda, E.; Grembecka, J.; Sokalski, W.A.; Leszczyński, J. Origins of the activity of PAL and LAP enzyme inhibitors: Towards ab initio binding affinity prediction. J. Am. Chem. Soc. 2005, 127, 1658–1659. [Google Scholar] [CrossRef] [PubMed]
- Grzywa, R.; Dyguda-Kazimierowicz, E.; Sieńczyk, M.; Feliks, M.; Sokalski, W.A.; Oleksyszyn, J. The molecular basis of urokinase inhibition: From the nonempirical analysis of intermolecular interactions to the prediction of binding affinity. J. Mol. Model. 2007, 13, 677–683. [Google Scholar] [CrossRef] [PubMed]
- Wagner, J.P.; Schreiner, P.R. London Dispersion in Molecular Chemistry—Reconsidering Steric Effects. Angew. Chem. Int. Ed. 2015, 54, 12274–12296. [Google Scholar] [CrossRef] [PubMed]
- Podeszwa, R.; Pernal, K.; Patkowski, K.; Szalewicz, K. Extension of the Hartree-Fock Plus Dispersion Method by First-Order Correlation Effects. J. Phys. Chem. Lett. 2010, 1, 550–555. [Google Scholar] [CrossRef]
- Pernal, K.; Podeszwa, R.; Patkowski, K.; Szalewicz, K. Dispersionless Density Functional Theory. Phys. Rev. Lett. 2009, 103, 263201. [Google Scholar] [CrossRef] [PubMed]
- Giedroyć-Piasecka, W.; Dyguda-Kazimierowicz, E.; Beker, W.; Mor, M.; Lodola, A.; Sokalski, W.A. Physical Nature of Fatty Acid Amide Hydrolase Interactions with Its Inhibitors: Testing a Simple Nonempirical Scoring Model. J. Phys. Chem. B 2014, 118, 14727–14736. [Google Scholar] [CrossRef] [PubMed]
- Jedwabny, W.; Panecka-Hofman, J.; Dyguda-Kazimierowicz, E.; Wade, R.C.; Sokalski, W.A. Application of a simple quantum chemical approach to ligand fragment scoring for Trypanosoma brucei pteridine reductase 1 inhibition. J. Comput.-Aided Mol. Des. 2017, 31, 715–728. [Google Scholar] [CrossRef] [PubMed]
- Jedwabny, W.; Kłossowski, S.; Purohit, T.; Cierpicki, T.; Grembecka, J.; Dyguda-Kazimierowicz, E. Theoretical models of inhibitory activity for inhibitors of protein–protein interactions: Targeting menin-mixed lineage leukemia with small molecules. Med. Chem. Commun. 2017, 8, 2216–2227. [Google Scholar] [CrossRef] [PubMed]
- Ryde, U.; Söderhjelm, P. Ligand-Binding Affinity Estimates Supported by Quantum-Mechanical Methods. Chem. Rev. 2016, 116, 5520–5566. [Google Scholar] [CrossRef] [PubMed]
- Otsuka, T.; Okimoto, N.; Taiji, M. Assessment and Acceleration of Binding Energy Calculations for Protein-Ligand Complexes by the Fragment Molecular Orbital Method. J. Comput. Chem. 2015, 36, 2209–2218. [Google Scholar] [CrossRef] [PubMed]
- Tognolini, M.; Lodola, A. Targeting the Eph-ephrin System with Protein-Protein Interaction (PPI) Inhibitors. Curr. Drug Targets 2015, 16, 1048–1056. [Google Scholar] [CrossRef] [PubMed]
- Sokalski, W.A.; Roszak, S.; Pecul, K. An efficient procedure for decomposition of the SCF interaction energy into components with reduced basis set dependence. Chem. Phys. Lett. 1988, 153, 153–159. [Google Scholar] [CrossRef]
- Góra, R.W.; Sokalski, W.A.; Leszczyński, J.; Pett, V. The nature of interactions in the ionic crystal of 3-pentenenitrile, 2-nitro-5-oxo, ion(-1) sodium. J. Phys. Chem. B 2005, 109, 2027–2033. [Google Scholar] [CrossRef] [PubMed]
- Beker, W.; Langner, K.M.; Dyguda-Kazimierowicz, E.; Feliks, M.; Sokalski, W.A. Low-Cost Prediction of Relative Stabilities of Hydrogen-Bonded Complexes from Atomic Multipole Moments for Overly Short Intermolecular Distances. J. Comput. Chem. 2013, 34, 1797–1799. [Google Scholar] [CrossRef] [PubMed]
- Wells, J.A.; McClendon, C.L. Reaching for high-hanging fruit in drug discovery at protein–protein interfaces. Nature 2007, 450, 1001–1009. [Google Scholar] [CrossRef] [PubMed]
- Pyrkov, T.V.; Chugunov, A.O.; Krylov, N.A.; Nolde, D.E.; Efremov, R.G. PLATINUM: A web tool for analysis of hydrophobic/hydrophilic organization of biomolecular complexes. Bioinformatics 2009, 25, 1201–1202. [Google Scholar] [CrossRef] [PubMed]
- Krammer, A.; Kirchhoff, P.D.; Jiang, X.; Venkatachalam, C.M.; Waldman, M. LigScore: A novel scoring function for predicting binding affinities. J. Mol. Graph. Model. 2005, 23, 395–407. [Google Scholar] [CrossRef] [PubMed]
- Gehlhaar, D.K.; Verkhivker, G.M.; Rejto, P.A.; Sherman, C.J.; Fogel, D.B.; Fogel, L.J.; Freer, S.T. Molecular Recognition of the Inhibitor AG-1343 by HIV-1 Protease: Conformationally Flexible Docking by Evolutionary Programming. Chem. Biol. 1995, 2, 317–324. [Google Scholar] [CrossRef]
- Gehlhaar, D.K.; Bouzida, D.; Rejto, P.A. Rational Drug Design: Novel Methodology and Practical Applications; American Chemical Society: Washington, DC, USA, 1999. [Google Scholar]
- Jain, A.N. Scoring noncovalent protein–ligand interactions: A continuous differentiable function tuned to compute binding affinities. J. Comput. Aided Mol. Des. 1996, 10, 427–440. [Google Scholar] [CrossRef] [PubMed]
- Muegge, I.; Martin, Y.C. A General and Fast Scoring Function for Protein-Ligand Interactions: A Simplified Potential Approach. J. Med. Chem. 1999, 42, 791–804. [Google Scholar] [CrossRef] [PubMed]
- Muegge, I. PMF Scoring Revisited. J. Med. Chem. 2006, 49, 5895–5902. [Google Scholar] [CrossRef] [PubMed]
- Böhm, H.J. The development of a simple empirical scoring function to estimate the binding constant for a protein–ligand complex of known three-dimensional structure. J. Comput. Aided Mol. Des. 1994, 8, 243–256. [Google Scholar] [CrossRef] [PubMed]
- Böhm, H.J. Prediction of binding constants of protein ligands: A fast method for the prioritization of hits obtained from the de novo design or 3D database search programs. J. Comput. Aided Mol. Des. 1998, 12, 309–323. [Google Scholar] [CrossRef] [PubMed]
- Dassault Systèmes BIOVIA. Discovery Studio Modeling Environment; Release 2017; Dassault Systèmes: San Diego, CA, USA, 2016. [Google Scholar]
- Jones, G.; Willett, P.; Glen, R.C.; Leach, A.R.; Taylor, R. Development and Validation of a Genetic Algorithm for Flexible Docking. J. Mol. Biol. 1997, 267, 727–748. [Google Scholar] [CrossRef] [PubMed]
- Trott, O.; Olson, A.J. AutoDock Vina: Improving the speed and accuracy of docking with a new scoring function, efficient optimization and multithreading. J. Comput. Chem. 2010, 31, 455–461. [Google Scholar] [CrossRef] [PubMed]
- Korb, O.; Stutzle, T.; Exner, T.E. Empirical Scoring Functions for Advanced Protein-Ligand Docking with PLANTS. J. Chem. Inf. Model. 2009, 49, 84–96. [Google Scholar] [CrossRef] [PubMed]
- Friesner, R.A.; Banks, J.L.; Murphy, R.B.; Halgren, T.A.; Klicic, J.J.; Mainz, D.T.; Repasky, M.P.; Knoll, E.H.; Shelley, M.; Perry, J.K.; et al. Glide: A new approach for rapid, accurate docking and scoring. 1. Method and assessment of docking accuracy. J. Med. Chem. 2004, 47, 1739–1749. [Google Scholar] [CrossRef] [PubMed]
- Li, Y.; Liu, Z.; Li, J.; Han, L.; Liu, J.; Zhao, Z.; Wang, R. Comparative Assessment of Scoring Functions on an Updated Benchmark: 1. Compilation of the Test Set. J. Chem. Inf. Model. 2014, 54, 1700–1716. [Google Scholar] [CrossRef] [PubMed]
- Li, Y.; Han, L.; Liu, Z.; Wang, R. Comparative Assessment of Scoring Functions on an Updated Benchmark: 2. Evaluation Methods and General Results. J. Chem. Inf. Model. 2014, 54, 1717–1736. [Google Scholar] [CrossRef] [PubMed]
- Mahoney, M.W.; Jorgensen, W.L. A five-site model for liquid water and the reproduction of the density anomaly by rigid, nonpolarizable potential functions. J. Chem. Phys. 2000, 112, 8910–8922. [Google Scholar] [CrossRef]
- Brooks, B.R.; Bruccoleri, R.E.; Olafson, B.D.; States, D.J.; Swaminathan, S.; Karplus, M. CHARMM: A program for macromolecular energy, minimization, and dynamics calculations. J. Comput. Chem. 1983, 4, 187–217. [Google Scholar] [CrossRef]
- Vanommeslaeghe, K.; Hatcher, E.; Acharya, C.; Kundu, S.; Zhong, S.; Shim, J.; Darian, E.; Guvench, O.; Lopes, P.; Vorobyov, I.; et al. CHARMM General Force Field: A Force Field for Drug-Like Molecules Compatible with the CHARMM All-Atom Additive Biological Force Fields. J. Comput. Chem. 2010, 31, 671–690. [Google Scholar] [CrossRef] [PubMed]
- MacKerell, A.D.; Bashford, D.; Bellott, M.; Dunbrack, R.L.; Evanseck, J.D.; Field, M.J.; Fischer, S.; Gao, J.; Guo, H.; Ha, S.; et al. All-atom empirical potential for molecular modeling and dynamics studies of proteins. J. Phys. Chem. B 1998, 102, 3586–3616. [Google Scholar] [CrossRef] [PubMed]
- Mackerell, A.D.; Feig, M.; Brooks, C.L. Extending the treatment of backbone energetics in protein force fields: Limitations of gas-phase quantum mechanics in reproducing protein conformational distributions in molecular dynamics simulations. J. Comput. Chem. 2004, 25, 1400–1415. [Google Scholar] [CrossRef] [PubMed]
- Stote, R.H.; Karplus, M. Zinc binding in proteins and solution: A simple but accurate nonbonded representation. Proteins 1995, 23, 12–31. [Google Scholar] [CrossRef] [PubMed]
- Vanommeslaeghe, K.; MacKerell, A.D., Jr. Automation of the CHARMM General Force Field (CGenFF) I: Bond Perception and Atom Typing. J. Chem. Inf. Model. 2012, 52, 3144–3154. [Google Scholar] [CrossRef] [PubMed]
- Vanommeslaeghe, K.; Raman, E.P.; MacKerell, A.D., Jr. Automation of the CHARMM General Force Field (CGenFF) II: Assignment of Bonded Parameters and Partial Atomic Charges. J. Chem. Inf. Model. 2012, 52, 3155–3168. [Google Scholar] [CrossRef] [PubMed]
- Yu, W.; He, X.; Vanommeslaeghe, K.; MacKerell, A.D., Jr. Extension of the CHARMM general force field to sulfonyl-containing compounds and its utility in biomolecular simulations. J. Comput. Chem. 2012, 33, 2451–2468. [Google Scholar] [CrossRef] [PubMed]
- Maestro Version 9.3; Schrödinger, LLC: New York, NY, USA, 2012.
- Banks, J.L.; Beard, H.S.; Cao, Y.; Cho, A.E.; Damm, W.; Farid, R.; Felts, A.K.; Halgren, T.A.; Mainz, D.T.; Maple, J.R.; et al. Integrated Modeling Program, Applied Chemical Theory (IMPACT). J. Comput. Chem. 2005, 26, 1752–1780. [Google Scholar] [CrossRef] [PubMed]
- Boys, S.F.; Bernardi, F. The calculation of small molecular interactions by the differences of separate total energies. Some procedures with reduced errors. Mol. Phys. 2002, 100, 65–73. [Google Scholar] [CrossRef]
- Schmidt, M.W.; Baldridge, K.K.; Boatz, J.A.; Elbert, S.T.; Gordon, M.S.; Jensen, J.H.; Koseki, S.; Matsunaga, N.; Nguyen, K.A.; Su, S.J.; et al. General Atomic and Molecular Electronic Structure System. J. Comput. Chem. 1993, 14, 1347–1363. [Google Scholar] [CrossRef]
- Krishnan, R.; Binkley, J.S.; Seeger, R.; Pople, J.A. Selfconsistent molecular orbital methods. XX. A basis set for correlated wave functions. J. Chem. Phys. 1980, 72, 650–654. [Google Scholar] [CrossRef]
- McLean, A.D.; Chandler, G.S. Contracted Gaussian basis sets for molecular calculations. I. Second row atoms, Z = 11–18. J. Chem. Phys. 1980, 72, 5639–5648. [Google Scholar] [CrossRef]
- Francl, M.M.; Pietro, W.J.; Hehre, W.J.; Binkley, J.S.; Gordon, M.S.; Defrees, D.J.; Pople, J.A. Self-consistent molecular orbital methods. XXIII. A polarization-type basis set for second-row elements. J. Chem. Phys. 1982, 77, 3654–3665. [Google Scholar] [CrossRef]
- Frisch, M.J.; Trucks, G.W.; Schlegel, H.B.; Scuseria, G.E.; Robb, M.A.; Cheeseman, J.R.; Scalmani, G.; Barone, V.; Mennucci, B.; Petersson, G.A.; et al. Gaussian 09 Revision D.01; Gaussian Inc.: Pittsburgh, PA, USA, 2009. [Google Scholar]
- Tomasi, J.; Mennucci, B.; Cances, E. The IEF version of the PCM solvation method: An overview of a new method addressed to study molecular solutes at the QM ab initio level. J. Mol. Struct.-THEOCHEM 1999, 464, 211–226. [Google Scholar] [CrossRef]
- Pascualahuir, J.L.; Silla, E.; Tunon, I. GEPOL: An improved description of molecular surfaces. III. A new algorithm for the computation of a solvent-excluding surface. J. Comput. Chem. 1994, 15, 1127–1138. [Google Scholar] [CrossRef]
- Tomasi, J.; Mennucci, B.; Cammi, R. Quantum mechanical continuum solvation models. Chem. Rev. 2005, 105, 2999–3093. [Google Scholar] [CrossRef] [PubMed]
- Improta, R.; Scalmani, G.; Frisch, M.J.; Barone, V. Toward effective and reliable fluorescence energies in solution by a new state specific polarizable continuum model time dependent density functional theory approach. J. Chem. Phys. 2007, 127, 074504. [Google Scholar] [CrossRef] [PubMed]
- Improta, R.; Barone, V.; Scalmani, G.; Frisch, M.J. A state-specific polarizable continuum model time dependent density functional theory method for excited state calculations in solution. J. Chem. Phys. 2006, 125, 054103. [Google Scholar] [CrossRef] [PubMed]
- Marenich, A.V.; Cramer, C.J.; Truhlar, D.G. Universal Solvation Model Based on Solute Electron Density and on a Continuum Model of the Solvent Defined by the Bulk Dielectric Constant and Atomic Surface Tensions. J. Phys. Chem. B 2009, 113, 6378–6396. [Google Scholar] [CrossRef] [PubMed]
- Englebienne, P.; Moitessier, N. Docking Ligands into Flexible and Solvated Macromolecules. 4. Are Popular Scoring Functions Accurate for this Class of Proteins? J. Chem. Inf. Model. 2009, 49, 1568–1580. [Google Scholar] [CrossRef] [PubMed]
- Shrake, A.; Rupley, J.A. Environment and exposure to solvent of protein atoms. Lysozyme and insulin. J. Mol. Biol. 1973, 79, 351–371. [Google Scholar] [CrossRef]
- Lee, B.; Richards, F.M. The interpretation of protein structures: Estimation of static accessibility. J. Mol. Biol. 1971, 55, 379. [Google Scholar] [CrossRef]
- Humphrey, W.; Dalke, A.; Schulten, K. VMD—Visual Molecular Dynamics. J. Mol. Graph. 1996, 14, 33–38. [Google Scholar] [CrossRef]
- Stone, J. An Efficient Library for Parallel Ray Tracing and Animation. Master’s Thesis, Computer Science Department, University of Missouri-Rolla, Rolla, MO, USA, 1998. [Google Scholar]
- Falsafi, S.; Karimi, Z. SASA.tcl. Available online: http://www.ks.uiuc.edu/Research/vmd/mailing_list/vmd-l/att-18670/sasa.tcl (accessed on 30 May 2018).
- PyMOL(TM) Molecular Graphics System, Version 1.7.0.0.; Schrödinger, LLC: New York, NY, USA, 2013.
- Seeliger, D.; de Groot, B.L. Ligand docking and binding site analysis with PyMOL and Autodock/Vina. J. Comput.-Aided Mol. Des. 2010, 24, 417–422. [Google Scholar] [CrossRef] [PubMed]
- Schrödinger LLC. Schrödinger Release 2018-1, Glide; Schrödinger, LLC: New York, NY, USA, 2018. [Google Scholar]
- Langner, K.M.; Beker, W.; Sokalski, W.A. Robust Predictive Power of the Electrostatic Term at Shortened Intermolecular Distances. J. Phys. Chem. Lett. 2012, 3, 2785–2789. [Google Scholar] [CrossRef]
Sample Availability: Samples of the compounds are not available from the authors. |


© 2018 by the authors. Licensee MDPI, Basel, Switzerland. This article is an open access article distributed under the terms and conditions of the Creative Commons Attribution (CC BY) license (http://creativecommons.org/licenses/by/4.0/).