Article

Comparison of the Active Compositions between Raw and Processed Epimedium from Different Species

Tianjin State Key Laboratory of Modern Chinese Medicine, Tianjin University of Traditional Chinese Medicine, 312 Anshanxi Road, Nankai District, Tianjin 300193, China
*
Author to whom correspondence should be addressed.
These authors contributed equally to this work.
Molecules 2018, 23(7), 1656; https://doi.org/10.3390/molecules23071656
Submission received: 19 June 2018 / Revised: 3 July 2018 / Accepted: 6 July 2018 / Published: 7 July 2018

Abstract

:
Epimedium herb is one of the most vital traditional Chinese medicines (TCMs), which is used for “nourishing the kidney and reinforcing the Yang”. In the guidance of TCM theory, Epimedium herb is usually processed with lamb oil to increase its efficacy. The contents of active ingredients in different Epimedium are significantly varied, which may derive from their different species, regions and processing methods. In this research, 13 batches of raw Epimedium collected from 6 provinces were identified. After optimization of the processing method of Epimedium, a liquid chromatography–mass spectrometry (LC–MS/MS) method for simultaneous determination of 16 compounds was established to evaluate the quality of raw and processed. Then the multivariate statistical technique was applied to compare different batches of Epimedium based on the LC–MS/MS data. As a conclusion, the herbs collected from 6 areas were ascribed to 5 species by microscopic and appearance features. Meanwhile, all of the raw and processed samples were classified by partial least squares discriminant analysis (PLS-DA) based on the 16 analyzed compounds. The comparison results indicate that processing and species both have important influences on Epimedium compositions contents.

1. Introduction

Epimedium herb, commonly named as Yinyanghuo in Chinese, has its origins in the Berberidaceae family which include Epimedium koreanum Nakai, Epimedium brevicornum Maxim., Epimedium pubescens Maxim., Epimedium sagittatum (Sieb.et Zucc.) Maxim. and Epimedium wushanense T. S. Ying [1]. According to the “Shen Nong’s Herbal Classic” records, as one of the tonic TCMs, Epimedium herb has been used for more than 2000 years [2].
Chemical studies reveal that more than 260 ingredients have been isolated from Epimedium, such as flavonoids, polysaccharides, essential oils, phytosterols, phenolic acids and alkaloid [3,4]. Pharmacological studies demonstrate that ingredients in Epimedium possess various attributes. For example, flavonoids, the major constituents in Epimedium which including baohuoside II, baohuoside I, epimedin A, epimedin B, epimedin C, quercitrin, sagittatoside A, sagittatoside B, hyperoside, icariside I, icariin and astragalin, have been widely used for improving cardiovascular and promoting sexual function [5,6]. They also show anti-osteoporosis, anti-inflammation, anti-cancer and anti-oxidation effects [7,8,9,10,11]. Meanwhile, the phenolic acids such as chlorogenic acid, neochlorogenic acid and cryptochlorogenic acid have extensive pharmacological actions including anti-inflammation, anti-fatigue and antitumor properties [12,13,14]. Furthermore, alkaloid such as magnoflorine is found to possess anti-glycemic and anti-oxidant activities [15,16].
In TCM theory, processing is a necessary procedure, which can enhance clinical efficacy and decrease the toxicity of herbs [17]. For Epimedium herb, much research suggests that processed and unprocessed herbs have a different effect in pharmacological and clinical. The drug processed has greater efficacy for improving sexual desire and performance, while the raw has stronger efficacy in osteoporosis and rheumatism [18,19]. Modern studies focusing on pharmacological properties reveal that the processed method is an important factor influencing composition contents. Chen et al. reported that the contents of flavonoids were increased when the processing temperature was 60 °C [20] while Gao et al. claimed that 120 °C may be the best [21]. Comparing the contents of flavonoids after processing, Li et al. pointed out roasting was better than frying [22]. In practical production, there are many processing methods for Chinese herbs, including stir-frying, steaming, calcining, roasting and boiling. The Chinese Pharmacopoeia (2015 edition) record stir-frying with lamb oil as the processing method of Epimedium herb but not in detail [1]. Thus, it is necessary to optimize the traditional processing method to gain standardization.
The previous study reported that both species and region had a notable impact on the contents of TCMs [17]. Gao et al. indicated that the magnolia content of E. koreanum Nakai was 10 times higher than E. brevicornu Maxim. Moreover, the E. brevicornum Maxim. collected from Gansu province were better than other provinces [23]. So it is important to develop a reliable method for Epimedium identification based on the appearance and microscopic features.
In general, baohuoside I and icariin are considered as the major active components and the quality marker of Epimedium herb [1]. However, other ingredients such as phenolic acids and alkaloid with verified pharmacological activities are also abundant in Epimedium. Comprehensive quality control demands a method to analyze multiple active components of Epimedium simultaneously. Chen et al. compared the methods for determination of 15 flavonoids in raw Epimedium by high-performance liquid chromatography (HPLC) and ultra performance liquid chromatography (UPLC). The analysis time of the UPLC method was shorter than HPLC, and the UPLC method was more sensitive [24]. Moreover, Zhu et al. had established the fingerprint chromatogram of Epimedium by UPLC, and found there were 5 differences in fingerprint between crude and processed product [25]. Naseer’s research demonstrated that the HPLC–MS method exhibits higher sensitivity, lower LOQs and shorter analysis time compared with the HPLC–ultraviolet (UV) and UPLC–UV methods [26,27].
Considering all these factors, Epimedium from 6 regions in China were ascribed to 5 species (E. koreanum Nakai, E. brevicornum Maxim., E. pubescens Maxim., E. sagittatum (Sieb.et Zucc.) Maxim. and E. wushanense T. S. Ying) by appearance and microscopic features. Then, 13 batches of samples were processed by optimized method and 16 ingredients including 12 flavonoids such as baohuoside II, baohuoside I, epimedin A, epimedin B, epimedin C, quercitrin, sagittatoside A, sagittatoside B, hyperoside, icariside I, icariin and astragalin, 3 phenolic acids such as chlorogenic acid, neochlorogenic acid, cryptochlorogenic acid and 1 alkaloid such as magnoflorine were simultaneously evaluated by LC–MS/MS. The present assay was further applied to investigate and compare the main components of crude and processed Epimedium using multivariate data analysis (partial least squares discriminant analysis (PLS-DA)) [28,29].

2. Results and Discussion

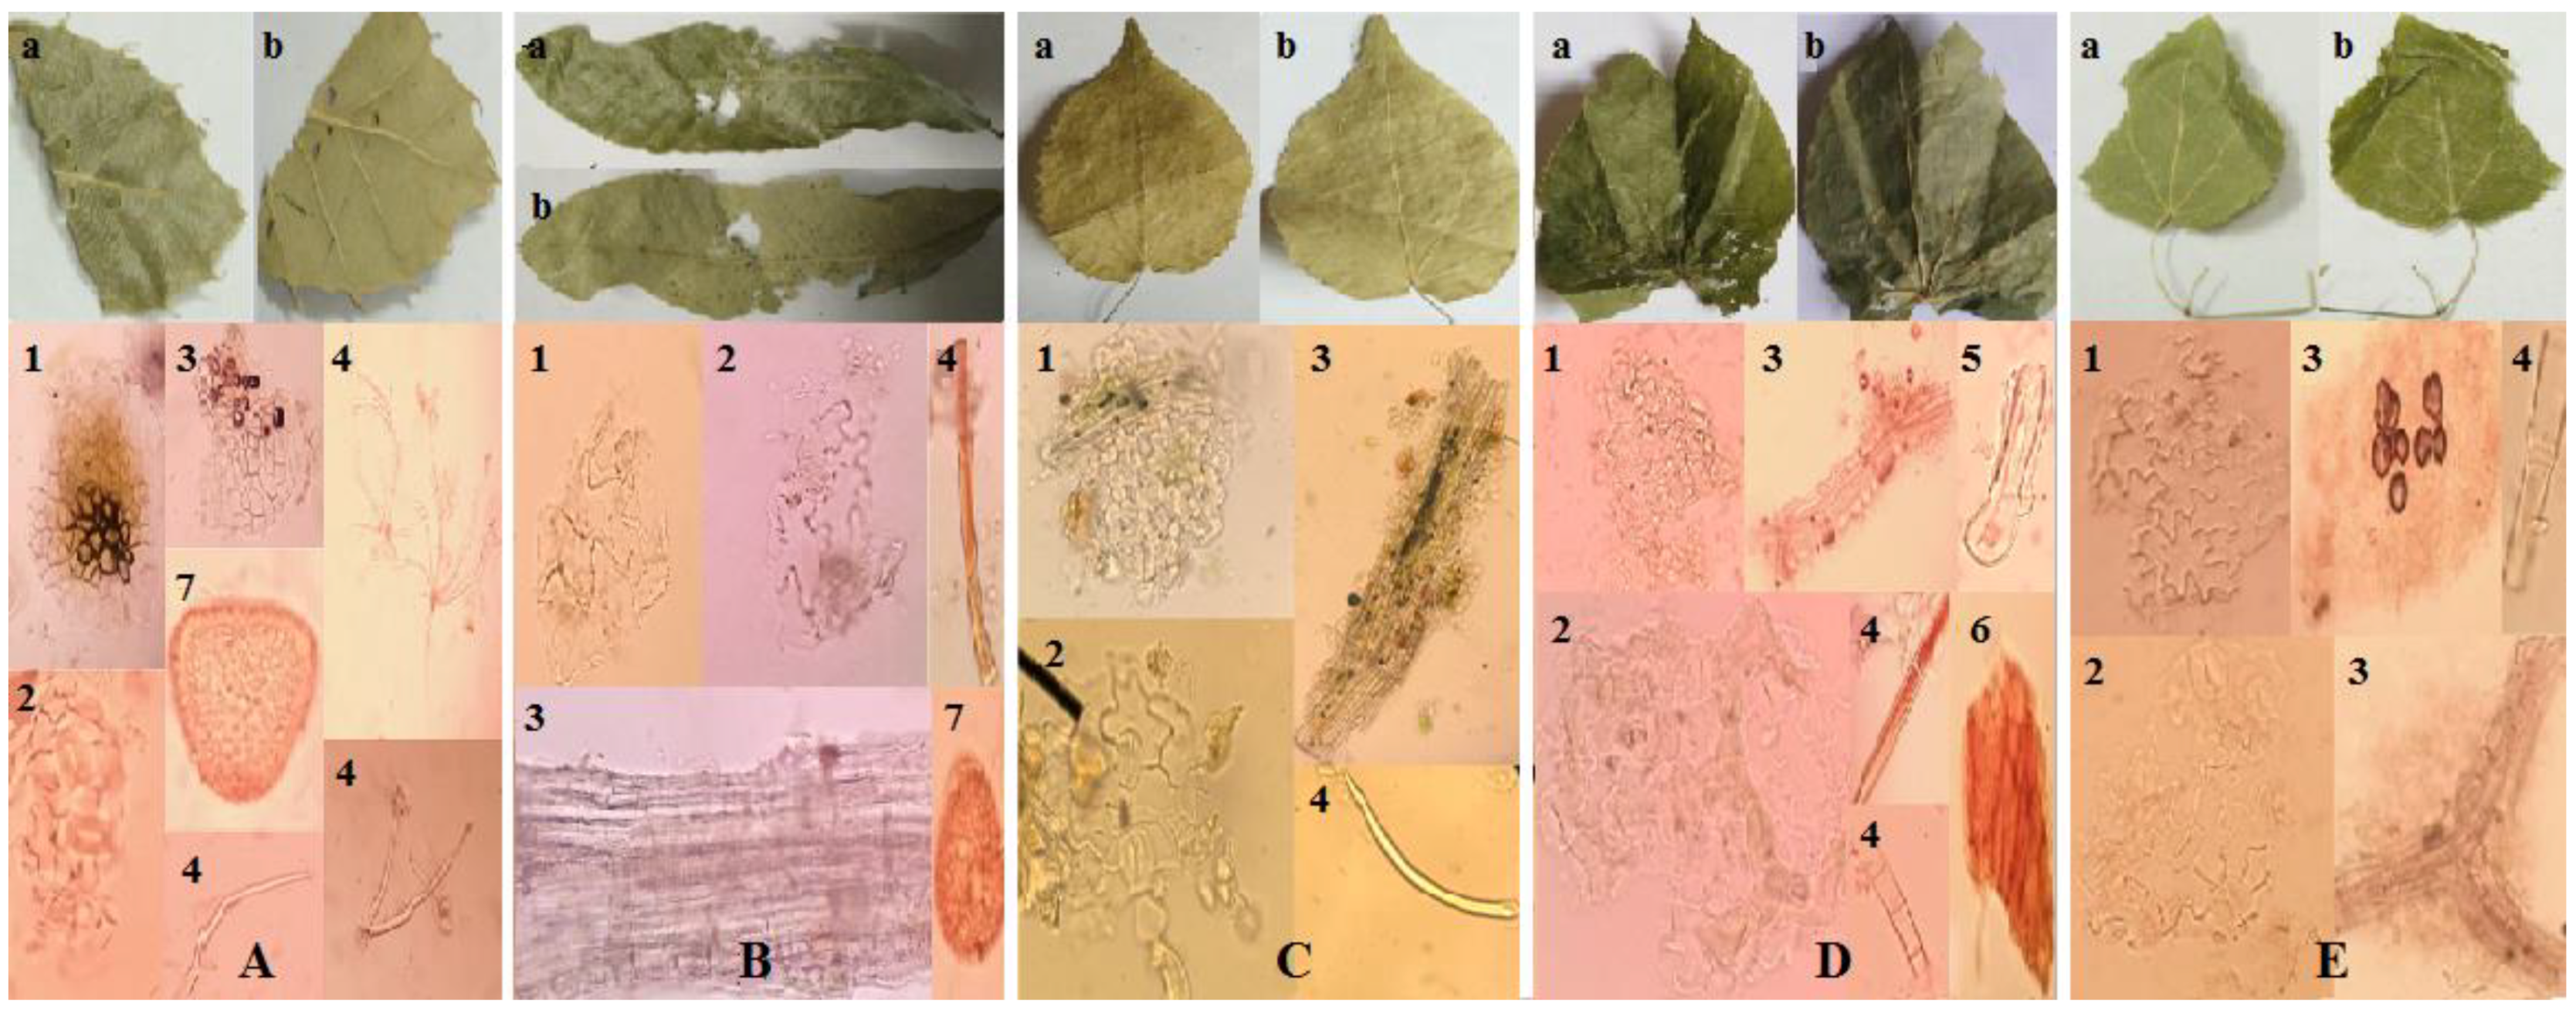
2.1. Appearance and Microscopic Features of Epimedium

As shown in Figure 1, it is clear that the different features appear in leaf size, shape, material and texture. It is also obvious that microscopic features differ in leaf upper epidermis, leaf lower epidermis, fibers, non-glandular hairs, glandular hairs, reddish-brown content and oil cells. The detail information and identification of Epimedium were demonstrated in Table 1. The appearance and microscopic features of Epimedium are shown in Figures S1–S13.
For TCM, morphologic analysis, microscopy analysis and DNA analysis were useful tools for taxonomic identification of plant species. DNA barcoding and microsatellite analyses to distinguish plant species were more accurate [30,31,32,33,34]. In the present paper, considering that they are effective and easily undertaken, morphologic and microscopy analysis were chosen as the reasonable method for herb identification. In the future, it is necessary to identify herbs comprehensively by various methods.

2.2. Optimization of Processing Conditions

The Chinese Pharmacopoeia indicates that icariin is the quality indicator for raw Epimedium herb, while icariin and baohuoside I for processed Epimedium herb. Flavonoids are considered as the major effective compounds in Epimedium, meanwhile glycosyl in the structure of flavonoids could be removed, such as epimedin C could transfer into icariin. Therefore, to optimize processing conditions, flavonoids including epimedin A, epimedin B, epimedin C, icariin and baohuoside I were chosen as the evaluation indicator. In order to obtain the optimal processing method, the processing heat (200 w, 400 w and 600 w), processing time (5 min, 10 min and 15 min) and samples weight (5 g, 10 g and 15 g) were selected as main elements. As shown in Table 2, the maximum content of total flavonoids could be achieved when 15 g of raw samples is heated under 200 w for 5 min. As a result, the method was selected as the optimization method to further process raw Epimedium.
The content of total flavonoids decreases with an increase in the processing time from 5 min to 15 min. At the same time, the content increases when the processing heat decreases from 600 w to 200 w. The reason for the content change after processing is high temperature destroys the structure of unstable constituents. For example, the sugar moieties of the glycosides are usually rhamnose, glucose, xylose or their corresponding acetyl or coumaroyl sugars at C-3 and/or C-7 positions may be lost. Regarding processing, the impact of the various factors is as follows: processing heat > processing time > samples weight.

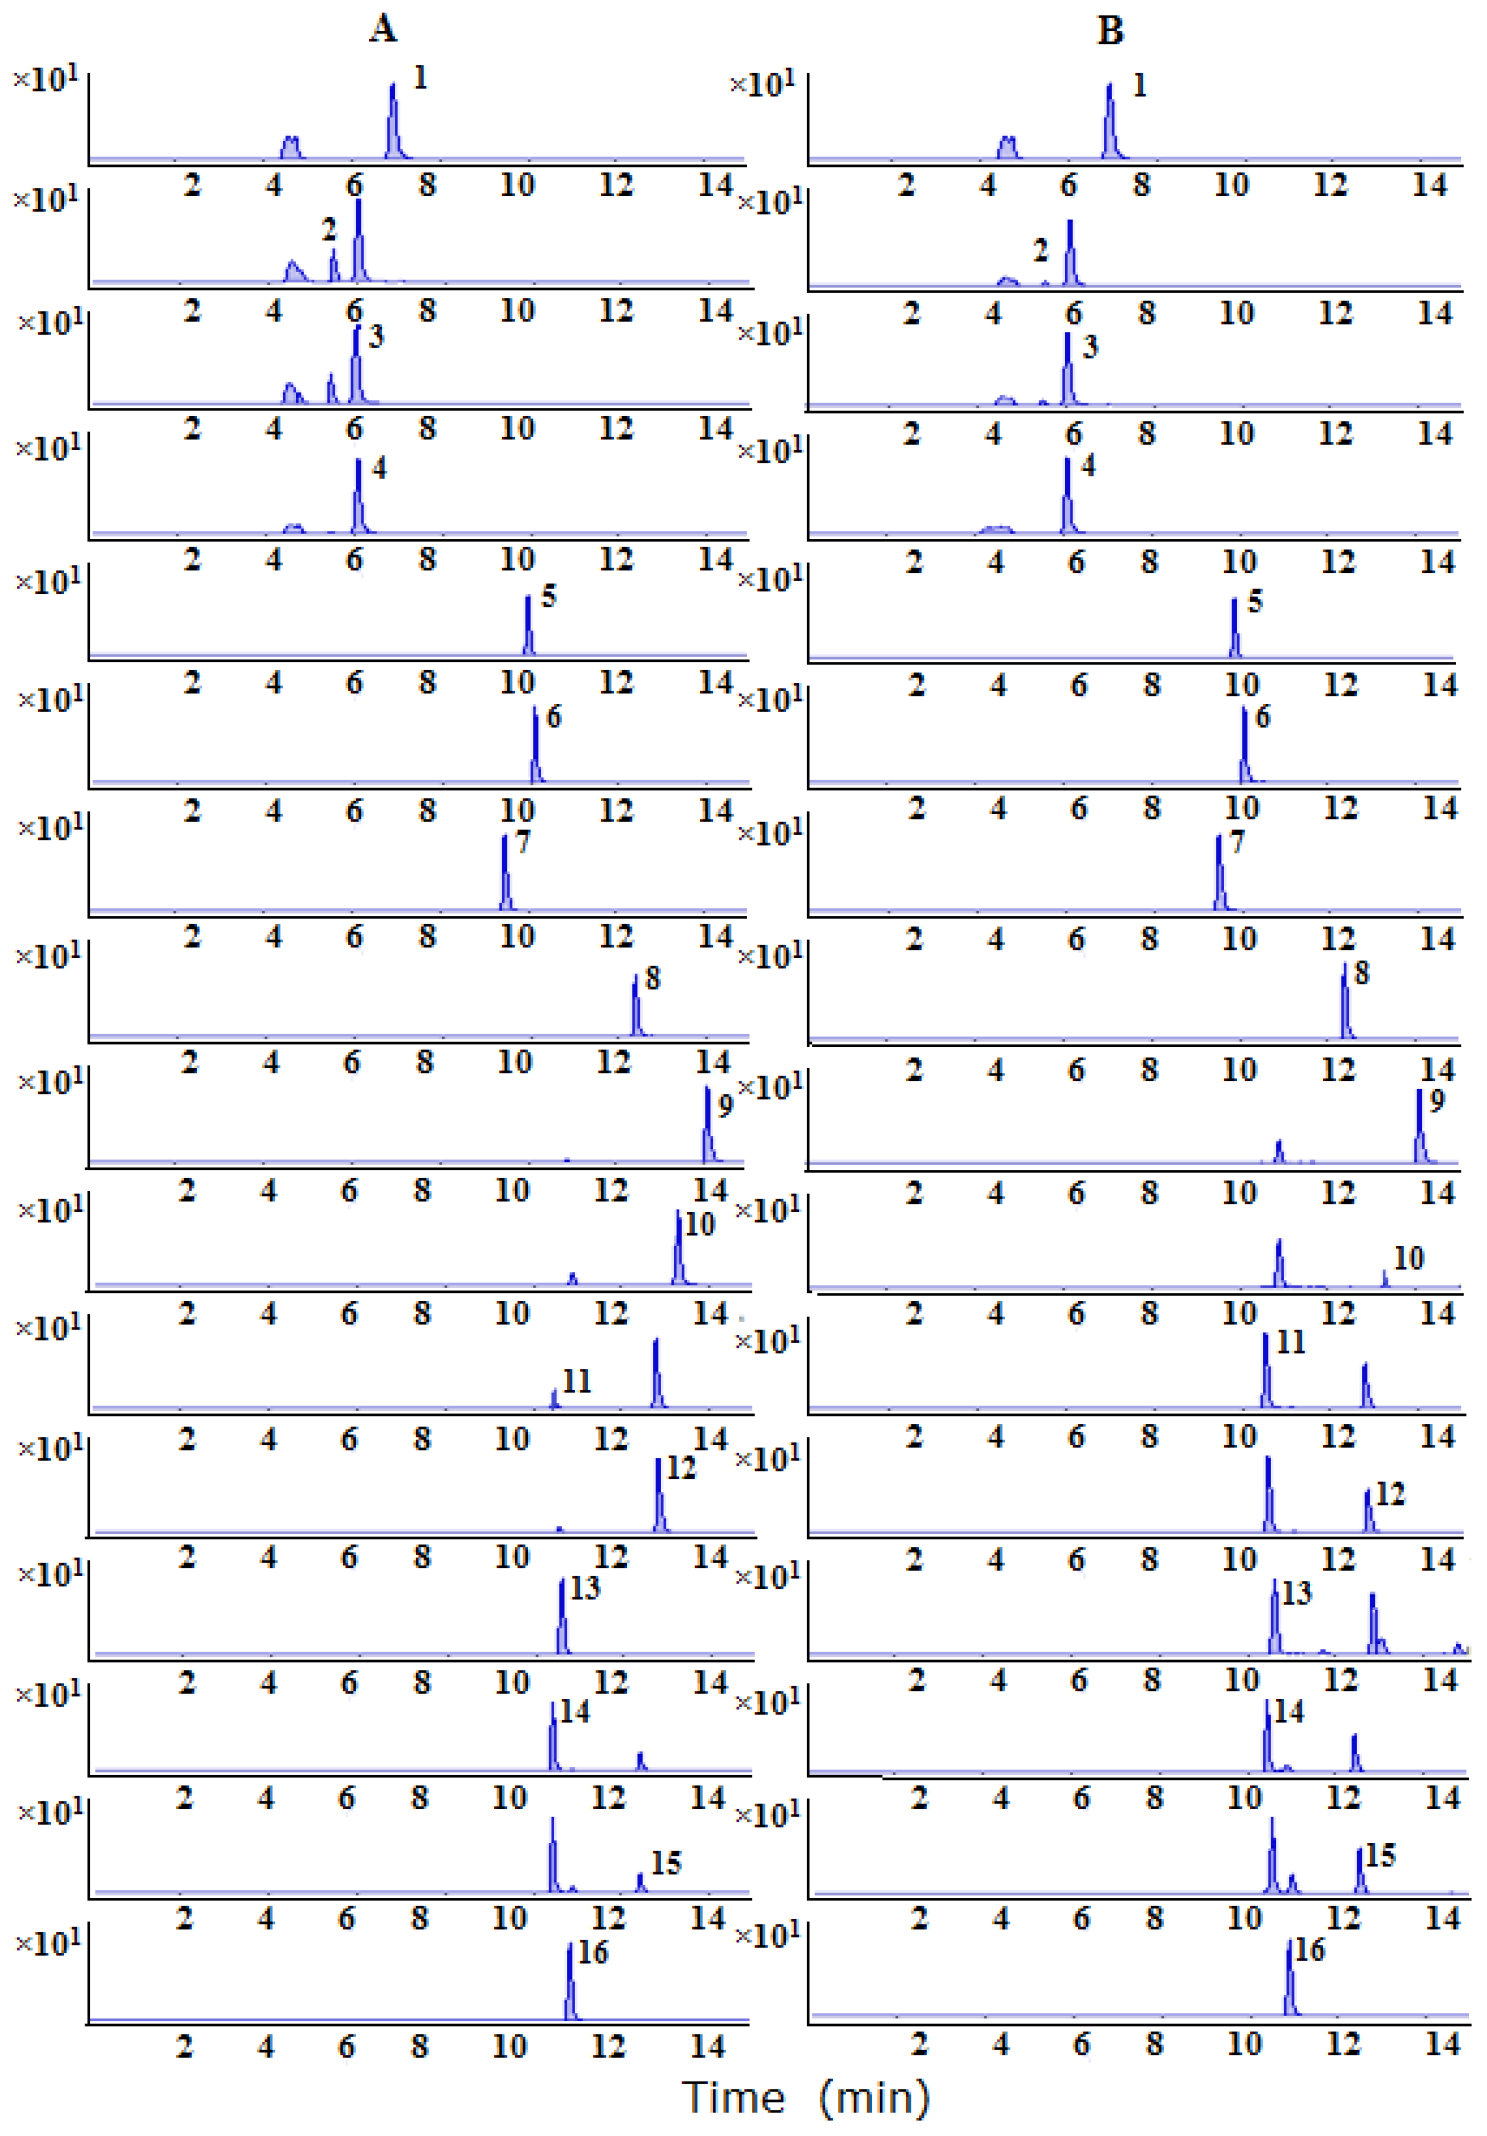
2.3. Quantification the Raw and Processed Samples by LC–MS/MS

Causes of differences in pharmacological and clinical effects between processed or unprocessed Epimedium herb are still indeterminate. To find the material basis of processing, LC–MS/MS was applied to detect multiple components of Epimedium.

2.3.1. Method Validation

The linear calibration curves of peak areas (y) vs. concentrations (x) were plotted for 16 compositions. The regression coefficients (r) are >0.996 for the 16 compounds, indicating a good linearity within a relatively wide range of concentrations. The lower limits of quantitation (LLOQs) are all less than 1 ng/mL for all compositions. For the precision, the relative standard deviations (RSDs) for relative contents of 16 characteristic components are <3.53%, respectively. In repeatability test, RSD values for relative contents range from 1.02% to 9.79%. The results indicate that the current method has a satisfactory precision and repeatability. The stability presented as RSD is in the range from 2.99% to 9.27%, indicating that the samples are stable within 24 h. The recoveries of six replicates range from 90.32% to 112.40% for the 16 analytes. The results indicate that the efficiency of sample preparation is acceptable in the current condition. The typical multiple reaction monitoring (MRM) chromatograms of the analytes were shown in Figure 2. The validation data showed in Table 3 are considered to be satisfactory for subsequent analysis of all of the samples. The data of the present LC–MS/MS method demonstrate that it exhibits higher sensitivity, lower LLOQs and shorter analysis time compared with the existing HPLC-UV and HPLC–MS methods [24,25,26,27].

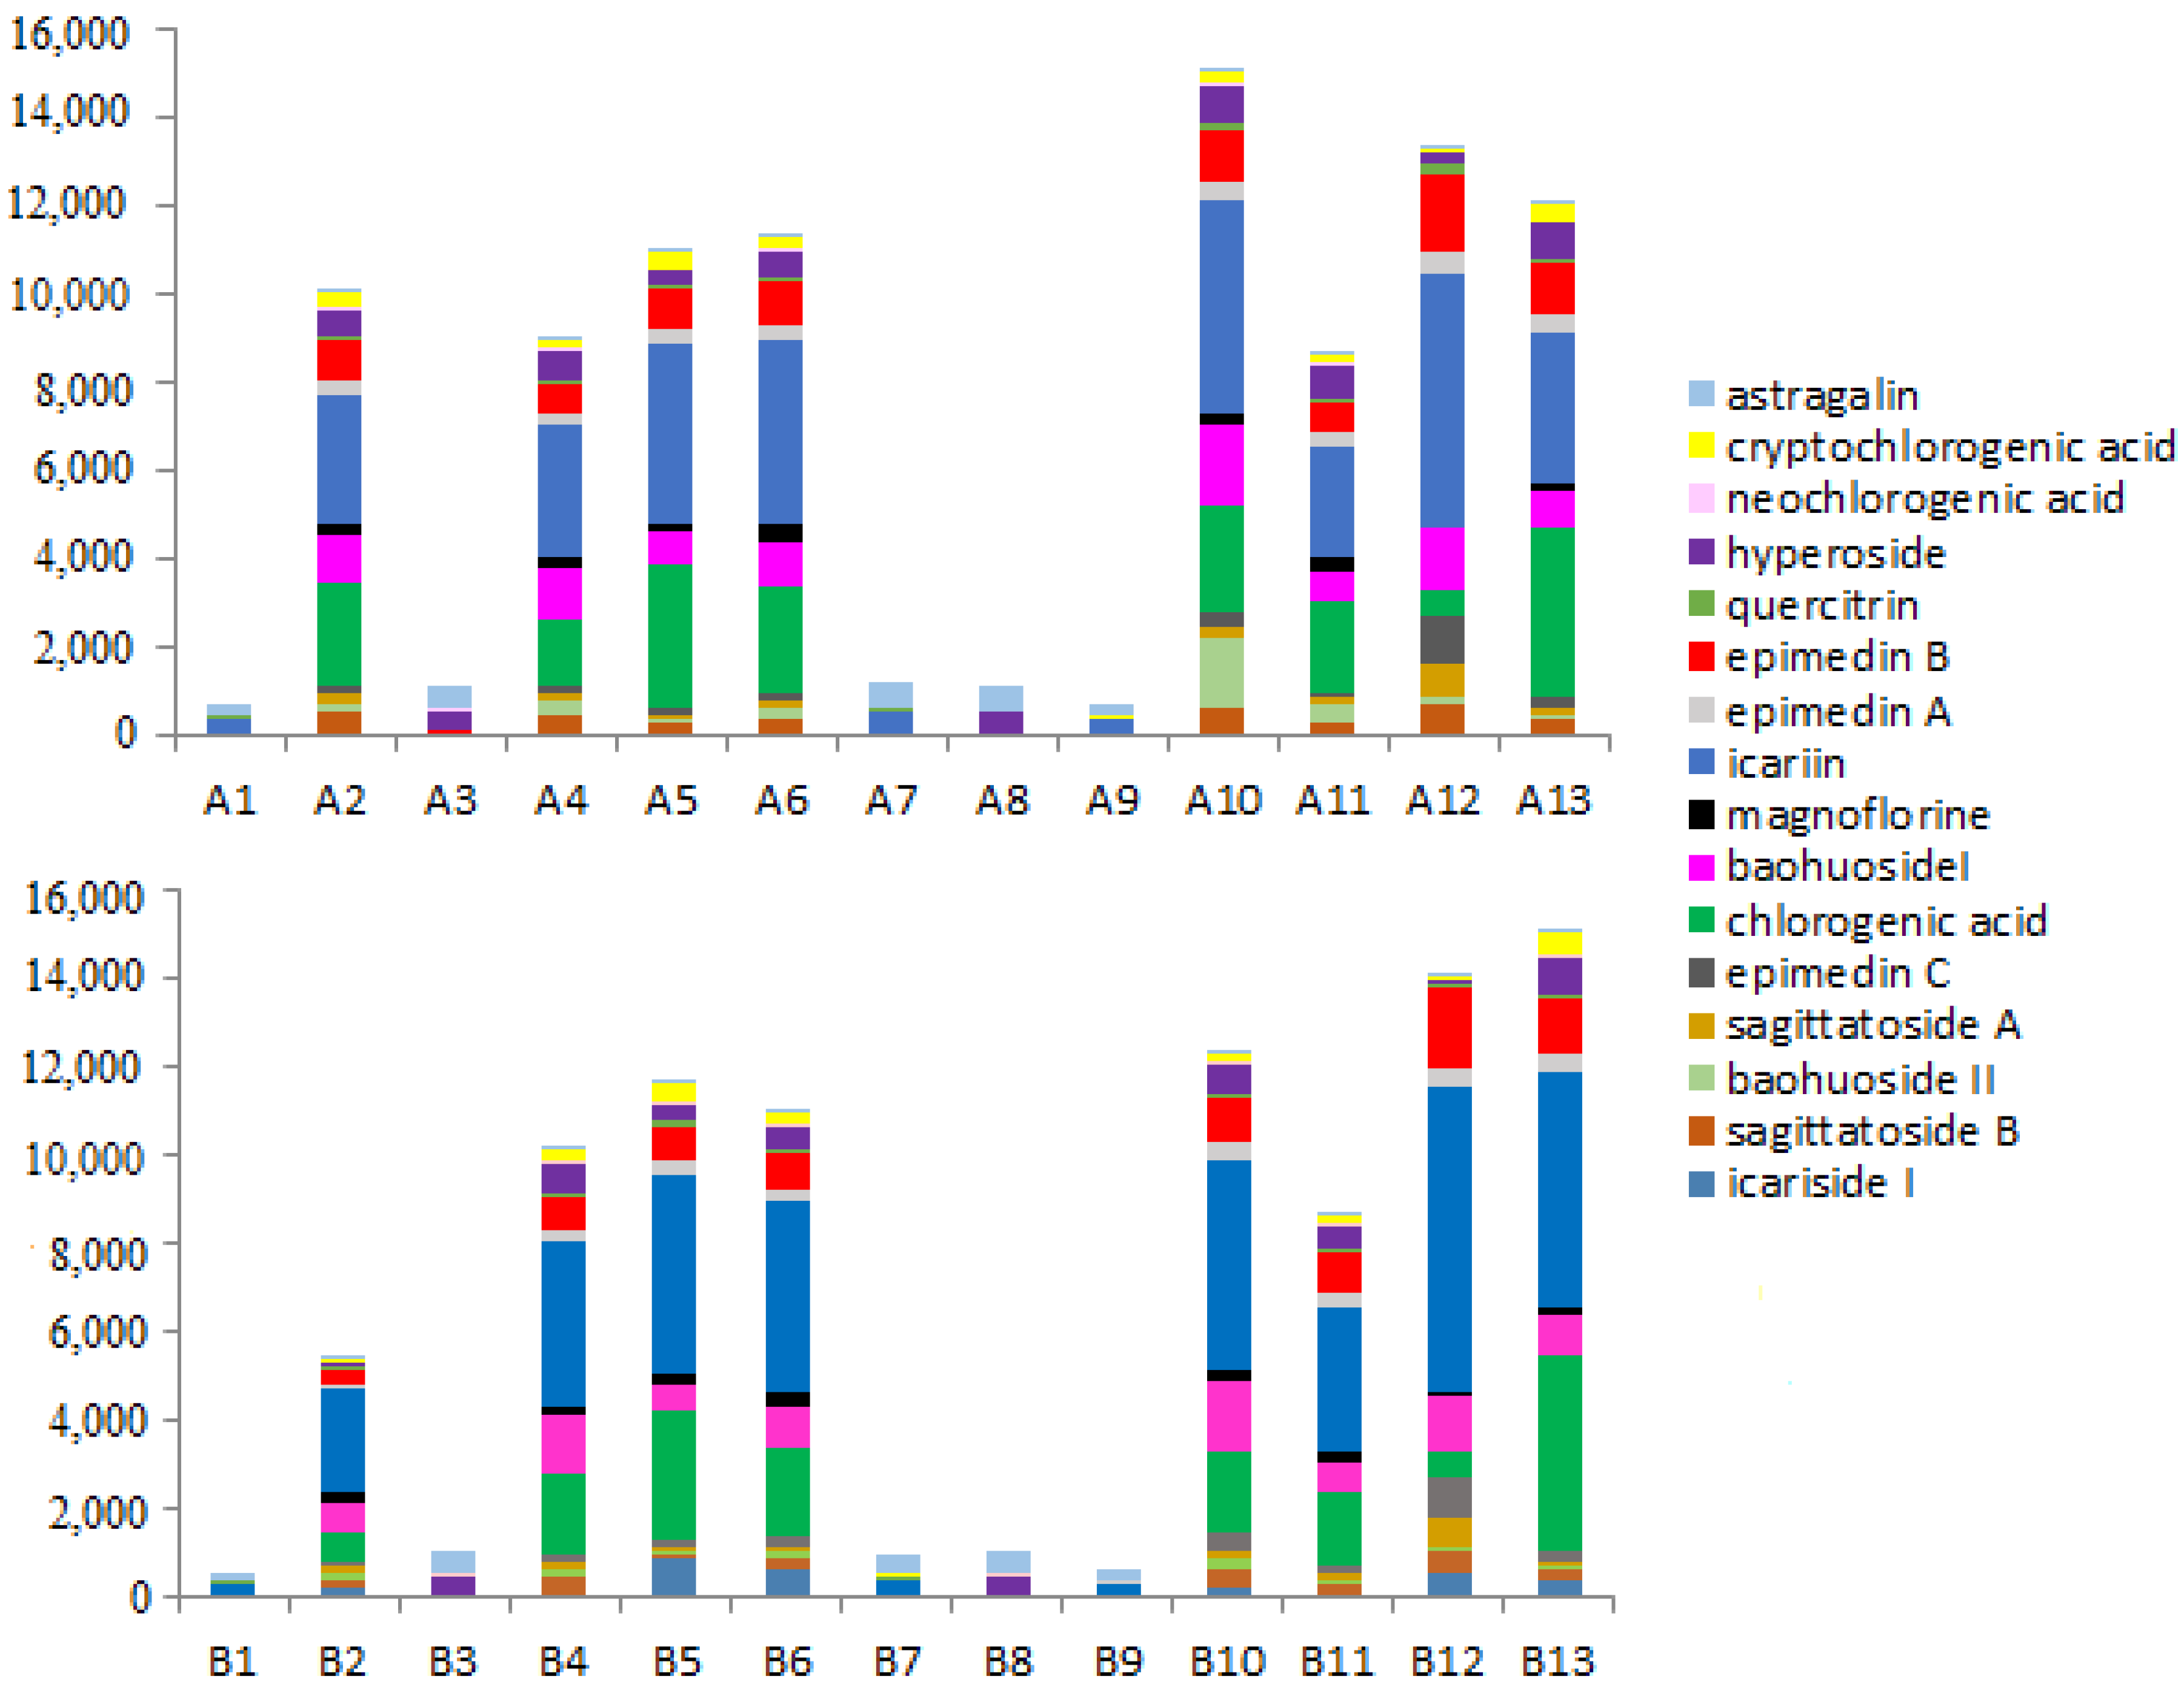
2.3.2. Quantitative Analysis of Raw and Processed Products

The validated method was applied to the analysis of 13 batches of raw and processed Epimedium samples. A total of 16 active ingredients were quantified with the external standard method based on their respective calibration curves. The contents of 16 compounds in raw and processed Epimedium samples were listed in Table 4. As shown in Figure 3, there are changes in contents of analytes, but not in the composition between raw and processed samples.

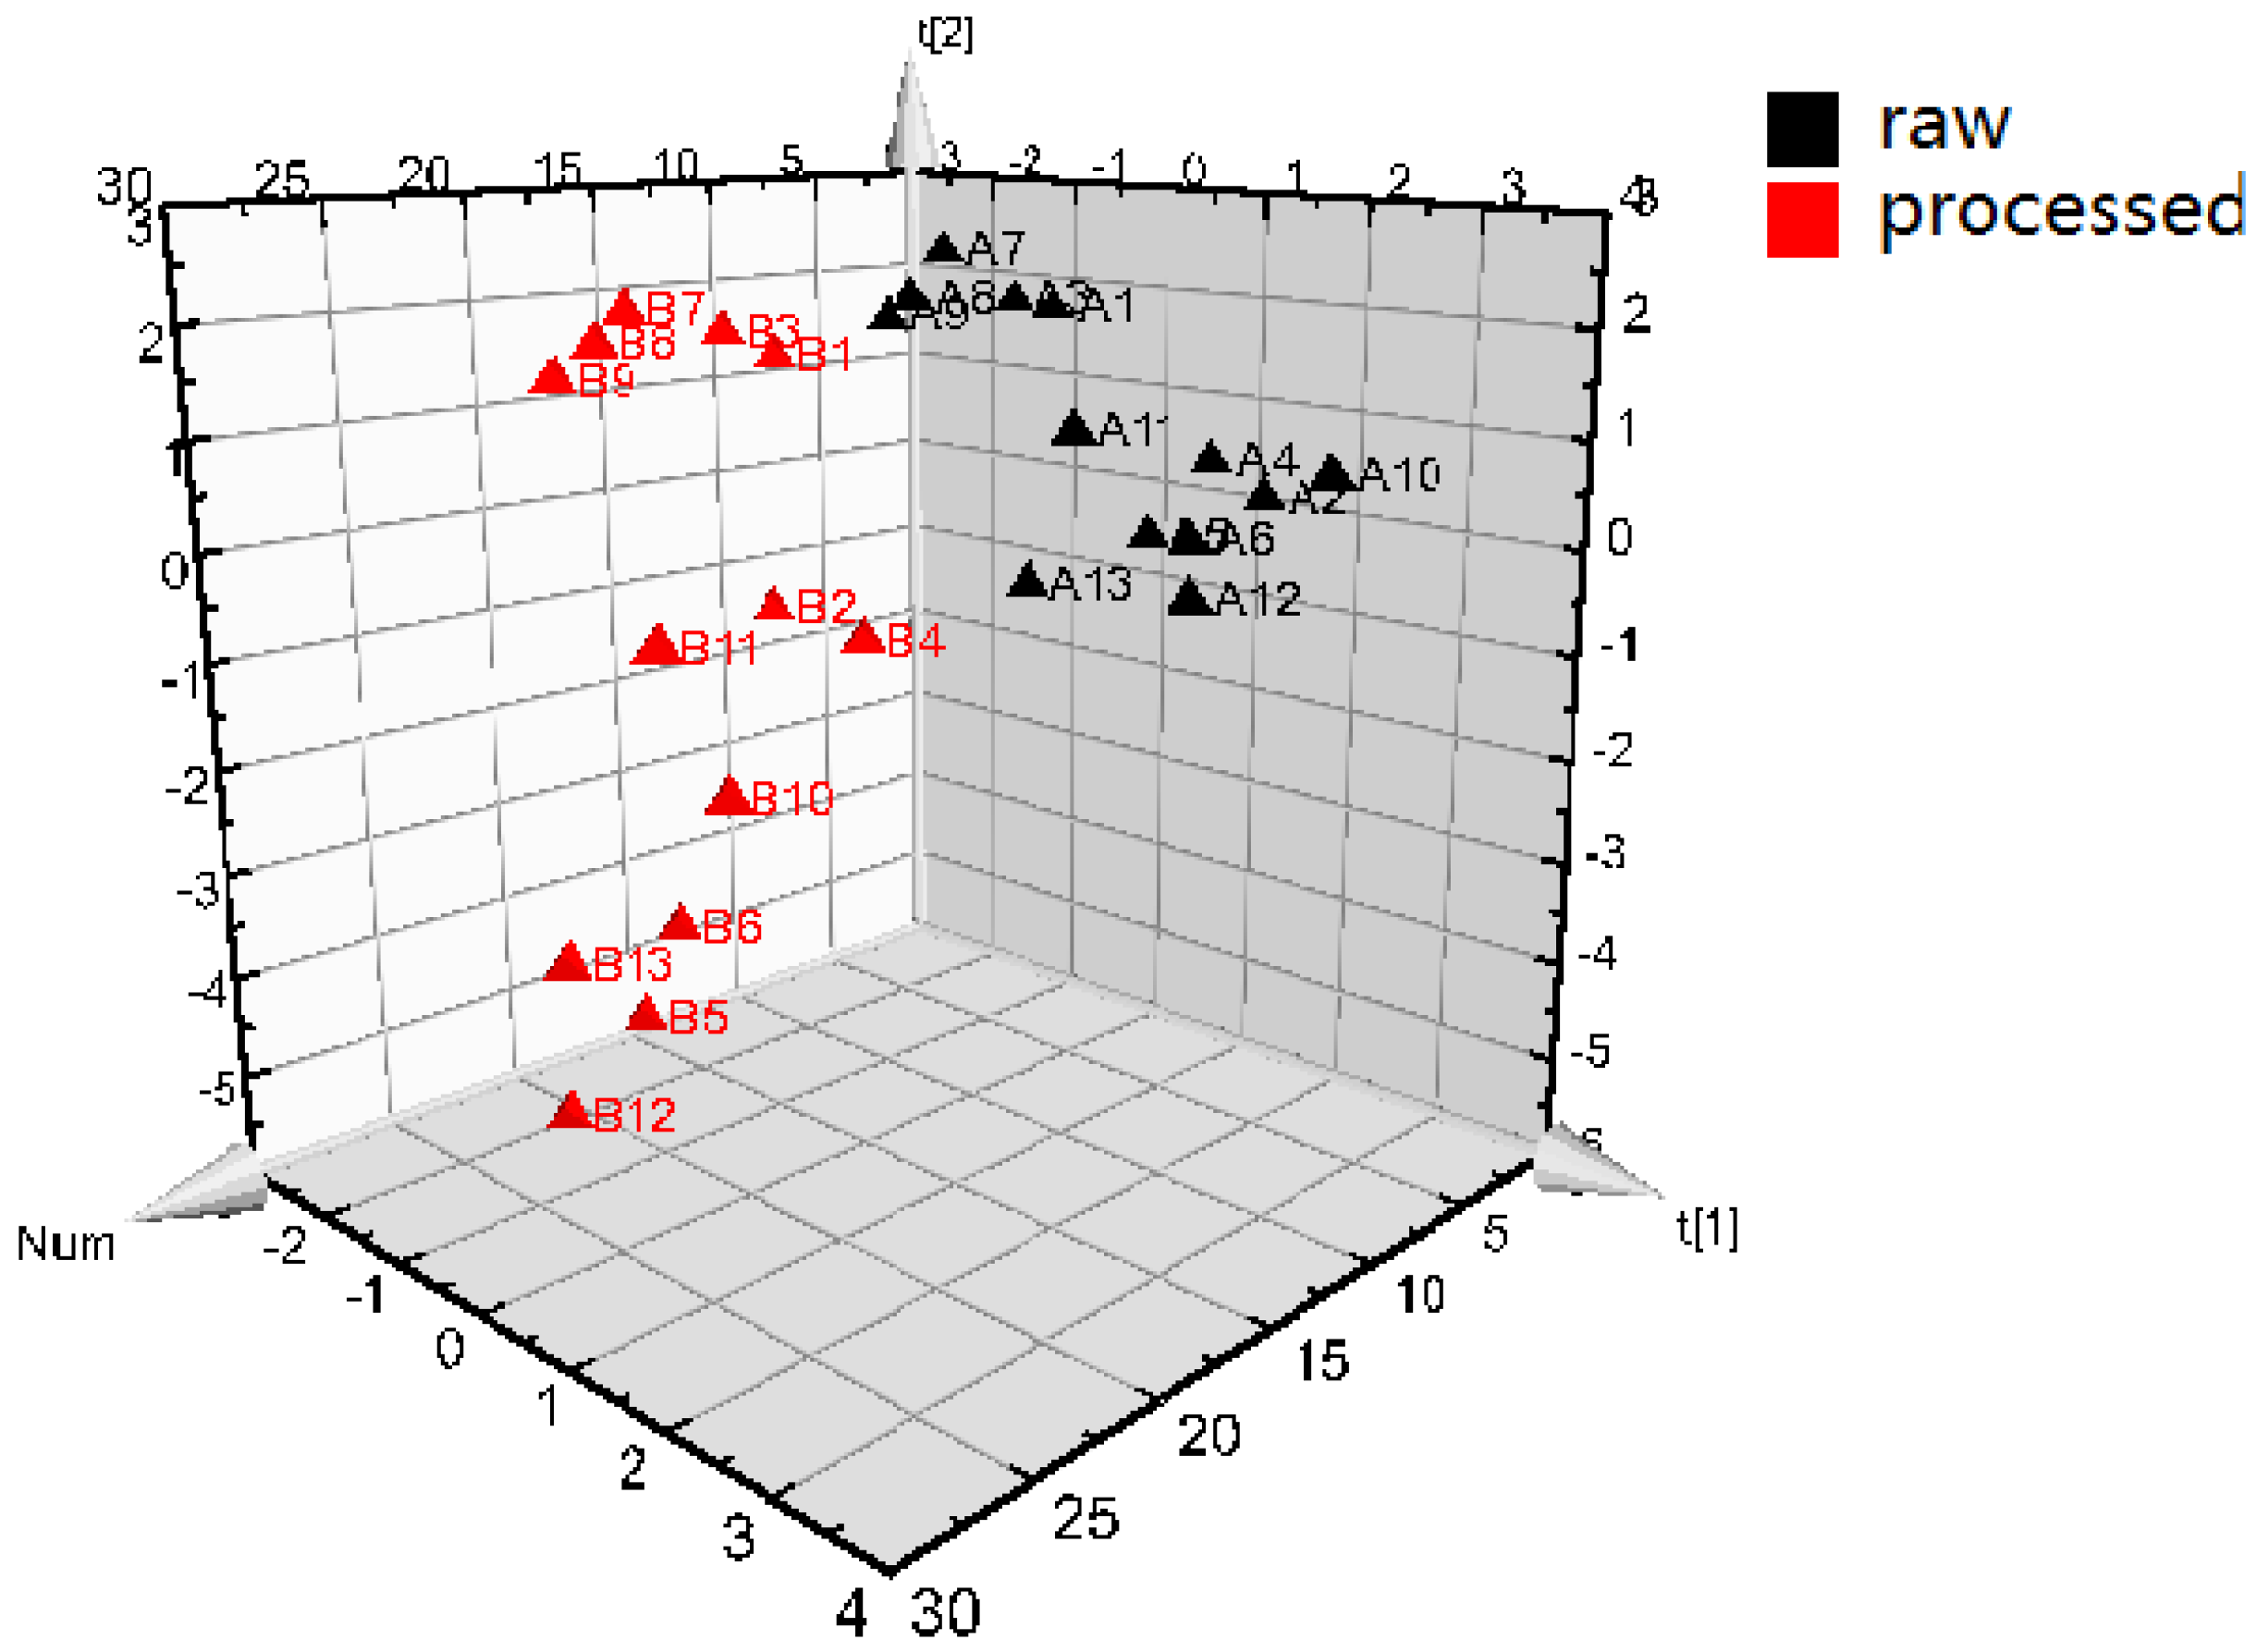
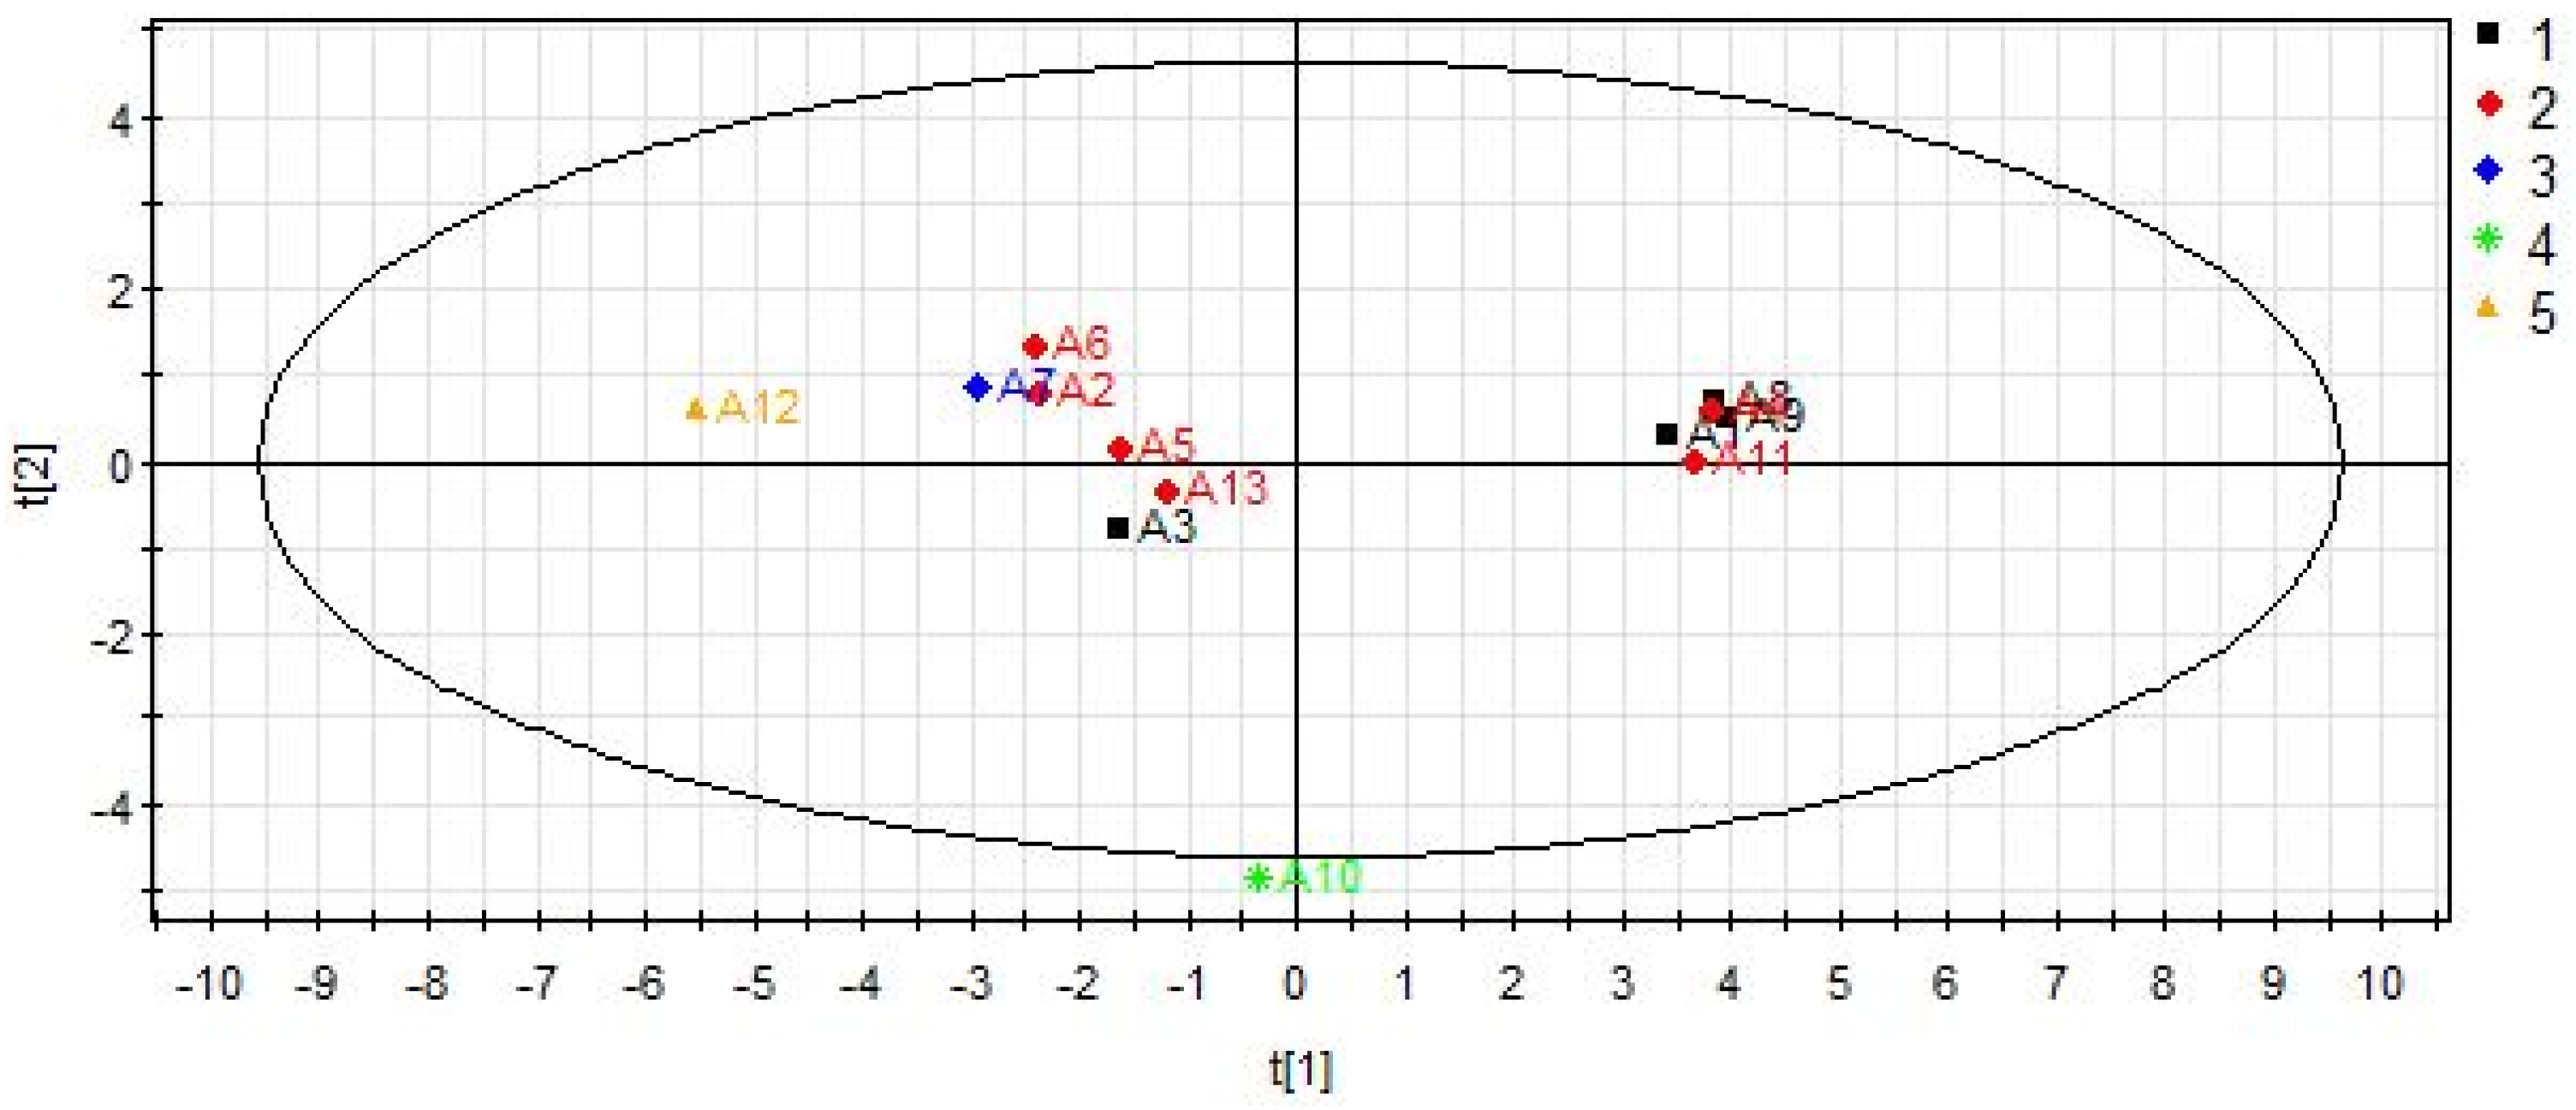
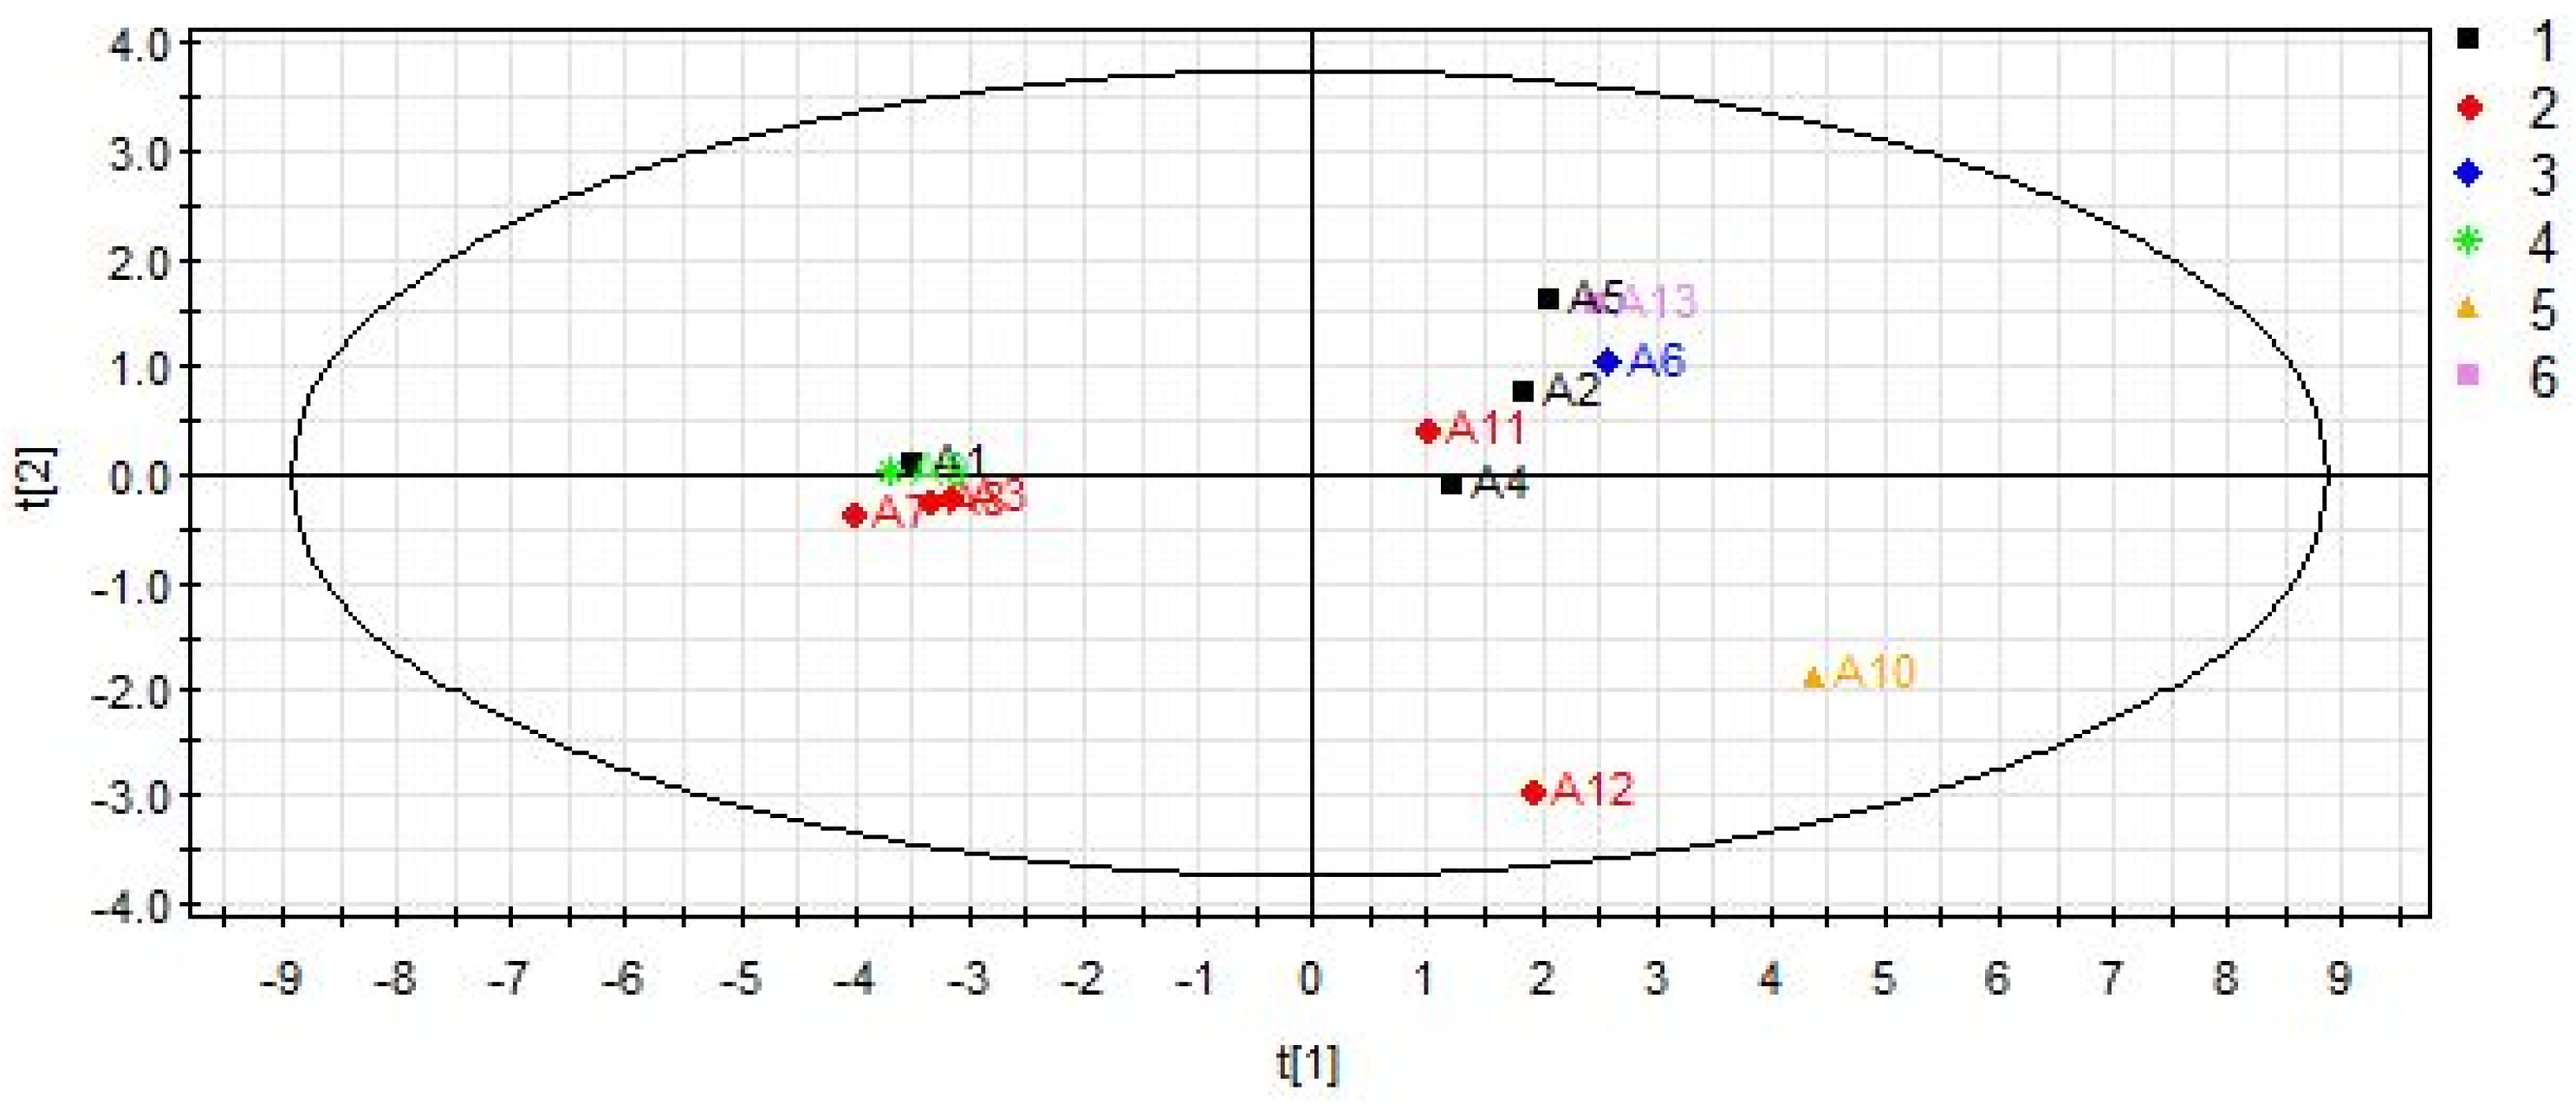
2.3.3. The Results of Data Analysis

The LC–MS/MS results were further analyzed by PLS-DA. In Figure 4, the three-dimensional (3D) score plot of PLS-DA was carried out to measure the difference between raw and processed Epimedium. All samples of raw (A1–A13) clusters are in a small region, which are distinguished from the processed samples. The processed samples (B1–B13) are clustered in another relatively discrete larger sphere, which indicates the qualities of the raw samples are more stable than the processed samples. Constituents with large loading values can be considered as markers, which contribute obviously to the classification of the samples. In the present study, the potential active ingredients whose VIP > 1 are icariside I, baohuoside II, quercitrin, icariin, and sagittatoside B. The raw and processed samples could be distinguished clearly, which explain that processing plays a crucial role in the contents change of Epimedium. The quality markers of processed Epimedium are always chosen as epimedin A, epimedin B, epimedin C, icariin and baohuoside I [35]; however, the present research has found the ingredients affected most by processing are icariside I, baohuoside II, quercitrin, icariin, and sagittatoside B. Therefore, the study provides new point of view on indicators to the further optimize processing conditions of Epimedium.
As shown in Figure 5, most samples are clearly clustered into distinct groups corresponding to species. Distinguishing from other samples, all samples of E. koreanum Nakai (A2, A4, A5, A6, A11 and A13) cluster in one region. E. pubescens Maxim. (A12) is in the left quadrant, while E. sagittatum (Sieb.et Zucc.) Maxim. (A1, A3, A8, A9) is in the right quadrant. E. wushanense T. S. Ying (A7) is close to E. pubescens Maxim. But E. brevicornu Maxim. (A10) is away from all other samples. The corresponding scores plot combined with VIP values screen out active ingredients for the differentiation of varieties including baohuoside II, astragalin, neochlorogenic acid, magnoflorine, quercitrin and hyperoside. The important variables are selected as VIP > 1. The results of PLS-DA demonstrate variations in the chemical content of Epimedium from different species.
As shown in Figure 6, the plot was used to assess the difference in samples collected from various regions. PLS-DA results reveal that six provinces of samples could not be distinguished clearly. The samples (A1, A2, A4 and A5) obtained from Jilin appear close to Shan’anxi, Gansu and Liaoning provinces. Batches of samples 3, 7, 8, 11 and 12 all from Gansu province are dispersed in both negative and positive axis. The figure reveals that the factor of the region has no significant impacts on the classification of Epimedium.

3. Materials and Methods

3.1. Plant Material

In the present study, 13 batches of Epimedium were collected from different regions of China during 2015 and 2016. The origins of the samples were shown in Table 1.

3.2. Chemicals

Acetonitrile, methanol (Thermo Fisher Scientific, Waltham, MA, USA), formic acid (ROE SCIENTIFIC INC Newark, NJ, USA) were all of HPLC grade. Analytical grade ethanol was obtained from Tianjin Guangfu Science Co. Ltd. (Tianjin, China). Ultrapure water was prepared by a Milli-Q water purification system (Millipore, Milford, MA, USA). The reference standards (purity > 98%) of baohuoside II, baohuoside I, epimedin A, epimedin B, epimedin C, quercitrin, sagittatoside A, sagittatoside B, hyperoside, chlorogenic acid, magnoflorine, neochlorogenic acid, cryptochlorogenic acid, icariside I, icariin and astragalin were purchased from Tianjin, Yifangzhongkang Pharmaceutical Technology Co. Ltd. (Tianjin, China). Lamb oil was purchased from Yuquan Road Market (Tianjin, China).

3.3. Identification of Epimedium

The species of Epimedium were identified according to the leaves’ appearance and microscopic features. After screening with the No. 4 sieve, each dried sample was ground to powder by an electric grinder. Samples were placed on the slides and permeated twice with 1–3 drops of chloral hydrate, and then sealed by diluted glycerol and coverslip. For observation, Epimedium powder samples were taken with a digital camera and light microscope with 20 times magnification.

3.4. Optimization of the Processing Method of Epimedium

Lamb oil, 20% weight of raw samples, was melted in a hot pot. Raw Epimedium was then added and heated with constant tossing or stirring until the raw samples became sheeny and yellow. In order to optimize the processing method of Epimedium, the effects of processing technological factors, including processing heat, processing time and weight of Epimedium were investigated by orthogonal experimental design (L9 (3) 4). Total flavonoids (epimedin A, epimedin B, epimedin C, icariin and baohuoside I), as major active constituents, were chosen as the marker chemicals to evaluate the quality of processed Epimedium (Table 5).

3.5. Quantification by Liquid Chromatography–Mass Spectrometry (LC–MS/MS)

3.5.1. Preparation of Samples

Thirteen batches of Epimedium were processed by the optimized method. Then, 100 mg Epimedium samples (raw or processed) were extracted with 100 mL of 70% aqueous ethanol under ultrasonic extraction conditions over 60 min at room temperature. After filtering through a nylon membrane filter (0.22 μm), the filtrate was used as the test solution.
Sixteen reference standards (magnoflorine, chlorogenic acid, cryptochlorogenic acid, neochlorogenic acid, hyperoside, epimedin A, epimedin C, sagittatoside B, baohuoside I, icariin, astragalin, quercitrin, baohuoside II, icariside I, epimedin B and sagittatoside A) were dissolved in methanol at a final concentration of 1 mg/mL as stock solutions, respectively. Working standard solutions were further obtained by appropriate stock standard solutions mixed and diluted with methanol.

3.5.2. Chromatographic and Mass Spectrometry (MS) Conditions

Chromatography was performed on a CORTECSR C18 column (150 × 4.6 mm, 3 μm) at a 0.3 mL/min flow rate. The separation was obtained using the following gradient program: 0–4 min, 20–50% B; 4–5 min, 50–60% B; 5–15 min, 60–70% B (A: water containing 0.1% formic acid, B: acetonitrile). The injection volume was 5 µL and the column temperature was set at 30 °C.
The optimized conditions for MS detector were as follows: capillary voltage, −4000 V; drying gas (N2) flow rate, 9.0 L/min with a temperature at 300 °C; nebulizer pressure, 20 psi. The MRM scanning mode was employed for quantification in negative mode simultaneously. The mass spectra properties of 16 analytes were shown in Table 6. Data analysis was performed using Masshunter Workstation Software from Agilent Technologies (version B.04.00).

3.5.3. LC–MS/MS Method Validation

The linearity of the assay for the test compounds was performed by least-square linear regression of 16 analytes-to-standard peak area ratios (y) versus the normalized standard concentration (x). The LLOQ for each sample was defined by the concentrations that generated peaks with signal-to-noise values (S/N) of 5. For precision, the method was evaluated by intraday and interday variability. The RSDs were calculated as the measure of precision. In the repeatability examination, six replicates of the samples from the same batch were extracted and analyzed. To evaluate the stability of analytes, sample solutions were stored at room temperature and then analyzed by replicate injection at 0, 2, 4, 8, 12 and 24 h, the RSDs were used to assess the stability. The recovery was evaluated by adding the standard solution to samples, which was used to further investigate the accuracy of the method. In the study, a known amount of 16 standards were added to Epimedium samples in 100 mL of 70% aqueous ethanol. The samples were thoroughly mixed before analyzing by LC–MS/MS. The recoveries were calculated by the formulae: recovery (%) = (amount found − original amount)/amount spiked × 100%.

3.6. Statistical Analysis

The differences of Epimedium were analyzed by PLS-DA. The method established the regression relationship between the matrixes, so as to get a better regression prediction result. When the supervised pattern recognition method was employed, the samples would divide into training and validation set. The classification model is obtained by training set, and the established model is used to predict the validation set. In the research, the validated method was applied to analyze Epimedium samples, including 13 batches of raw Epimedium samples (A1–A13) and 13 batches of processed Epimedium samples (B1–B13). A total of 16 compounds, including 12 flavonoids (hyperoside, epimedin A, epimedin C, sagittatoside B, baohuoside I, icariin, astragalin, quercitrin, baohuoside II, icariside I, epimedin B and sagittatoside A), 3 phenolic acids (chlorogenic acid, cryptochlorogenic acid, neochlorogenic acid) and 1 alkaloid (magnoflorine) were used to evaluate the changes of Epimedium after processing. The statistical performances of the models were evaluated by R2X, R2Y, and Q2. Statistical analysis was analyzed by SIMCA-P 12.0 software (Umetrics, Umea, Sweden).

4. Conclusions

At the beginning of the research, the assay was performed to exam Epimedium herb based on the microscopic features and appearance, which has become a specific and effective tool for herbal medicine identification. Then, research was carried out on the optimization of processing conditions. In addition, the contents of 26 batches Epimedium from different species, varied regions and different processing methods were investigated by LC–MS/MS, which enables more accurate monitoring and control of the herb quality. The LC–MS/MS quantification data of 16 active compounds were analyzed by PLS-DA. The PLS-DA results indicate that Epimedium is significantly different, in relation to the factors of the species as well as the processing method. Furthermore, an important finding is that six provinces of samples could not be classified into six sub-clusters by PLS-DA, which means the contents of 16 active compounds in Epimedium have no strong relation with the factor of the region.

Supplementary Materials

The Supplementary Materials are available online. Figures S1–S13: Appearance and microscopic features of batch 1–13 samples, respectively.

Author Contributions

J.H. and H.W. designed the research; H.Z., J.W. and M.S. wrote the manuscript and performed the experimental work; H.O., Z.D. and J.H. analyzed the data; X.C. and Y.C. perfected language. All authors discussed, edited and approved the final version.

Funding

This study was supported by National Natural Science Foundation of China (81703702, 81673824, 81503457), Natural Science Foundation of Tianjin (17JCYBJC28900, 15JCYBJC29300), Important Drug Develop of MOST, China (2015ZX09501004-003-004), Special Program for Basic Research of the Ministry of Science and Technology, China (2014FY111100).

Conflicts of Interest

The authors declare no conflict of interest.

References

  1. Pharmacopoeia Commission of PRC. Pharmacopoeia of the People’s Republic of China; China Medical Science Press: Beijing, China, 2015. [Google Scholar]
  2. Chen, X.J.; Tang, Z.H.; Li, X.W.; Xie, C.X.; Lu, J.J.; Wang, Y.T. Chemical constituents, quality control, and bioactivity of Epimedii Folium (Yinyanghuo). Am. J. Chin. Med. 2015, 43, 783–834. [Google Scholar] [CrossRef] [PubMed]
  3. Hao, W.; Lien, E.J.; Lien, L.L. Chemical and pharmacological investigations of Epimedium species: A survey. In Progress in Drug Research; Jucker, E., Ed.; Birkhäuser: Basel, Switzerland, 2003; pp. 1–57. [Google Scholar]
  4. Ma, H.; He, X.; Yang, Y.; Li, M.; Hao, D.; Jia, Z. The genus Epimedium: An ethnopharmacological and phytochemical review. J. Ethnopharmacol. 2011, 134, 519–541. [Google Scholar] [CrossRef] [PubMed]
  5. Huang, X.L.; Wang, W.; Zhou, Y.W. Protective effect of epimedium flavonoids injection on experimental myocardial infarction rats. Chin. J. Integr. Tradit. West Med. 2006, 26, 68–71. [Google Scholar]
  6. Zhou, F.; Xin, H.; Liu, T.; Li, G.Y.; Gao, Z.Z.; Liu, J. Effects of icariside II on improving erectile function in rats with streptozotocin-induced diabetes. J. Androl. 2012, 33, 832–844. [Google Scholar] [CrossRef] [PubMed]
  7. Meng, F.H.; Li, Y.B.; Xiong, Z.L.; Jiang, Z.M.; Li, F.M. Osteoblastic proliferative activity of Epimedium brevicornum Maxim. Phytomedicine 2005, 12, 189–193. [Google Scholar] [CrossRef] [PubMed]
  8. Zhang, J.F.; Li, G.; Chan, C.Y.; Meng, C.L.; Lin, M.C.; Chen, Y.C.; He, M.L.; Leung, P.C.; Kung, H.F. Flavonoids of Herba Epimedii regulate osteogenesis of human mesenchymal stem cells through bmp and wnt/β-catenin signaling pathway. Mol. Cell. Endocrinol. 2010, 314, 70–74. [Google Scholar] [CrossRef] [PubMed]
  9. Li, X.; Hu, Y.; He, L.; Wang, S.; Zhou, H.; Liu, S. Icaritin inhibits t cell activation and prolongs skin allograft survival in mice. Int. Immunopharmacol. 2012, 13, 1–7. [Google Scholar] [CrossRef] [PubMed]
  10. Song, J.; Shu, L.; Zhang, Z.; Tan, X.; Sun, E.; Jin, X. Reactive oxygen species-mediated mitochondrial pathway is involved in Baohuoside I-induced apoptosis in human non-small cell lung cancer. Chem. Biol. Interact. 2012, 199, 9–17. [Google Scholar] [CrossRef] [PubMed]
  11. Liu, X.Y.; Shen, Z.Y.; Wu, B.; Xia, S.J.; Huang, J.H.; Chen, W.H. Study on changes of protein phosphorylation of p65, IκBα and IκBε in lymphocytes of rats in progress of aging and interventional effect of Epimedium flavonoids. China J. Chin. Mater. Med. 2008, 33, 73–76. [Google Scholar]
  12. Liang, N.; Kitts, D.D. Role of chlorogenic acids in controlling oxidative and inflammatory stress conditions. Nutrients 2016, 8, 16. [Google Scholar] [CrossRef] [PubMed]
  13. Park, S.H.; Jang, S.; Sung, Y.Y.; Park, S.D.; Kim, H.K. Akebia quinata decaisne aqueous extract acts as a novel anti fatigue agent in mice exposed to chronic restraint stress. J. Ethnopharmacol. 2017, 222, 270–279. [Google Scholar] [CrossRef] [PubMed]
  14. Liu, Y.J.; Zhou, C.Y.; Qiu, C.H.; Lu, X.M.; Wang, Y.T. Chlorogenic acid induced apoptosis and inhibition of proliferation in human acute promyelocytic leukemia HL60 cells. Mol. Med. Rep. 2013, 8, 1106–1110. [Google Scholar] [CrossRef] [PubMed]
  15. Patel, B.M.; Mishra, S.M. Magnoflorine from Tinospora cordifolia stem inhibits α-glucosidase and is antiglycemic in rats. J. Funct. Foods 2012, 4, 79–86. [Google Scholar] [CrossRef]
  16. Rackova, L.; Majekova, M.; Kostalova, D.; Stefek, M. Antiradical and antioxidant activities of alkaloids isolated from Mahonia aquifolium. Structural aspects. Bioorg. Med. Chem. 2004, 12, 4709–4715. [Google Scholar] [CrossRef] [PubMed]
  17. Zhao, Z.; Liang, Z.; Chan, K.; Lu, G.; Lee, E.L.; Chen, H. A unique issue in the standardization of Chinese materia medica: Processing. Planta Med. 2010, 76, 1975–1986. [Google Scholar] [CrossRef] [PubMed]
  18. Chen, L.L.; Jia, X.B.; Jia, D.S. Advances in studies on processing mechanism of Epimedii Folium. Chin. Tradit. Herb. Drugs 2010, 41, 2108–2111. [Google Scholar]
  19. Han, B.; Yang, J.S. Epimedium pharmacology research overview. Chin. Tradit. Herb. Drugs 2000, 11, 75–77. [Google Scholar]
  20. Chen, H.L.; Wang, J.K.; Zhao, X.L. Determination and comparison of total flavonoids content in processed products of Epimedium sagittatum and processed products at different temperatures. J. Guiyang Coll. Tradit. Chin. Med. 2003, 25, 61–62. [Google Scholar]
  21. Gao, X.M.; Li, F.; Zhou, Y. Influence of temperature on total flavonoids and icariin in fried E. wushanense T. S. Ying. J. Beijing Univ. Tradit. Chin. Med. 2005, 3, 62–64. [Google Scholar]
  22. Li, S.H.; Wang, C.D. Epimedium processing technology research. J. Nanjing Univ. Chin. Med. 2005, 21, 194. [Google Scholar]
  23. Gao, M.; Fu, C.; Liu, J.; Guo, B.; Yang, X.; Chen, D. Distribution and influencing factors of magnoflorine in Epimedium. China J. Chin. Mater. Med. 2011, 36, 2475–2478. [Google Scholar]
  24. Chen, X.J.; Li, S.P.; Wang, Y.T.; Tu, P.F. Comparison of quantitative determination of flavonoids in Herba Epimedii by HPLC, UPLC and CZE. Chin. Pharm. J. 2008, 43, 624–628. [Google Scholar]
  25. Zhu, F.X.; Zhao, Y.G.; Jia, X.B.; Wei, Y.J.; Zhang, Z.H.; Wulazihan, G. Study on fingerprint of crude and processed Epimedium by UPLC-PDA-MS. Acta Chim. Sin. 2012, 70, 635–642. [Google Scholar] [CrossRef]
  26. Naseer, S.; Lone, S.H.; Lone, J.A.; Khuroo, M.A.; Bhat, K.A. LC-MS guided isolation, quantification and antioxidant evaluation of bioactive principles from Epimedium elatum. J. Chromatogr. B 2015, 989, 62–70. [Google Scholar] [CrossRef] [PubMed]
  27. Polat, D.C.; Coskun, M. Quantitative determination by HPLC-DAD of icariin, epimedin A, epimedin B, and epimedin C in Epimedium (Berberidaceae) species growing in Turkey. Nat. Prod. Commun. 2016, 11, 1665–1666. [Google Scholar]
  28. Su, B.R.; Deng, H.M.; Ma, H.L.; Lai, X.M.; He, W.L.; Wu, C.H. Quality evaluation of astragali radix through chemical pattern recognition of fingerprint by HPLC-DAD-ELSD. China J. Chin. Mater. Med. 2013, 38, 3319–3323. [Google Scholar]
  29. Acevska, J.; Stefkov, G.; Cvetkovikj, I.; Petkovska, R.; Kulevanova, S.; Cho, J. Fingerprinting of morphine using chromatographic purity profiling and multivariate data analysis. J. Pharm. Biomed. Anal. 2015, 109, 18–27. [Google Scholar] [CrossRef] [PubMed]
  30. Gismondi, A.; Canini, A. Microsatellite analysis of Latial Olea europaea L. cultivars. Plant Biosyst. 2013, 147, 686–691. [Google Scholar] [CrossRef]
  31. Gismondi, A.; Impei, S.; Di Marco, G.; Crespan, M.; Leonardi, D.; Canini, A. Detection of new genetic profiles and allelic variants in improperly classified grapevine accessions. Genome 2014, 57, 111–118. [Google Scholar] [CrossRef] [PubMed]
  32. Seberg, O.; Petersen, G. How many loci does it take to DNA barcode a crocus? PLoS ONE 2009, 4, e4598. [Google Scholar] [CrossRef] [PubMed]
  33. Gismondi, A.; Di, M.G.; Delorenzo, M.; Canini, A. Upgrade of Castanea sativa (Mill.) genetic resources by sequencing of barcode markers. J. Genet. 2015, 94, 519–524. [Google Scholar] [CrossRef] [PubMed]
  34. CBOL Plant Working Group. A DNA barcode for land plants. Proc. Natl. Acad. Sci. USA 2009, 106, 12794–12797. [Google Scholar] [Green Version]
  35. Jin, X.Y.; Jia, X.B.; Sun, E.; Wang, J.; Chen, Y.; Cai, B. Research on variation regularity of five main flavonoids contents in Epimedium and processed Epimedium. China J. Chin. Mater. Med. 2009, 34, 2738–2742. [Google Scholar]
Sample Availability: The raw and processed Epimedium are available from the authors.
Figure 1. The appearance and microscopic features of Epimedium samples: (A) E. sagittatum (Sieb.et Zucc.) Maxim.; (B) E. koreanum Nakai; (C) E. wushanense T. S. Ying; (D) E. brevicornu Maxim.; (E) E. pubescens Maxim.; (a) leaf upper surface; (b) leaf lower surface; (1) leaf upper epidermis; (2) leaf lower epidermis; (3) fibers; (4) non-glandular hairs; (5) glandular hairs; (6) reddish-brown content; (7) oil cells.
Molecules 23 01656 g001
Figure 2. Multiple reaction monitoring (MRM) chromatograms of magnoflorine (1); neochlorogenic acid (2); chlorogenic acid (3); cryptochlorogenic acid (4); astragalinbaohuoside (5); quercitrin (6); hyperoside (7); baohuoside II (8); baohuoside I (9); icariside I (10); epimedin B (11); sagittatoside B (12); epimedin C (13); epimedin A (14); sagittatoside A (15); icariin (16); (A) standard solution; (B) Epimedium sample.
Molecules 23 01656 g002
Figure 3. Contents of 16 components in different batches of raw and processed Epimedium (μg/g): (A) raw; (B) processed. The sample numbers were same as in Table 1.
Molecules 23 01656 g003
Figure 4. Partial least squares discriminant analysis (PLS-DA) 3D score scatter plot for raw (A) and processed (B) Epimedium (R2X = 0.656, R2Y = 0.418, Q2 = 0.081).
Molecules 23 01656 g004
Figure 5. PLS-DA score scatter plot for samples collected from different species: (1) E. sagittatum (Sieb.et Zucc.) Maxim.; (2) E. koreanum Nakai; (3) E. wushanense T. S. Ying; (4) E. brevicornu Maxim.; (5) E. pubescens Maxim. The denotations from numbers 1 to 13 were the corresponding sample numbers as listed in Table 1 (R2X = 0.974, R2Y = 0.971, Q2 = 0.259).
Molecules 23 01656 g005
Figure 6. PLS-DA score scatter plot for samples collected from different areas in China. (1) Jilin; (2) Gansu; (3) Shan’anxi; (4) Sichuan; (5) Hubei; (6) Liaoning. The sample numbers in the plot were in accordance with the batch numbers in Table 1 (R2X = 0.761, R2Y = 0.220, Q2 = 0.135).
Molecules 23 01656 g006
Table 1. Detailed information of 13 batches Epimedium.
BatchOriginAppearance FeaturesPower CharacteristicsIdentification
1JilinLeaves thick, leathery. Lower and upper epidermal cells slightly wavy, relatively small; stomas dense; with verrucae on the surface.E. sagittatum (Sieb.et Zucc.) Maxim.
2JilinLeaves thin, relatively large, elliptical or subrounded in shape, margin serrate.Epidermal cells slightly wavy, lower epidermal stomas and non-glandular hairs on them; non-glandular hairs straight or slight wavy, few undulant curvy; cells very big, some cells containing reddish-brown content.E. koreanum Nakai
3GansuLeaves leathery, oblong or lanceolate in shape.Lower and upper epidermal cells slightly wavy, relatively small; with verrucae on the surface.E. sagittatum (Sieb.et Zucc.) Maxim.
4JilinLeaves thin, relatively large.Epidermal cells slightly wavy, lower epidermal stomas and non-glandular hairs on them; non-glandular hairs straight or slightly wavy, few undulant curvy; cells very big, some cells containing reddish-brown content.E. koreanum Nakai
5JilinLeaves subrounded, apical leaf relative long, with serrate on the margin, base deep heart-shaped and askew, leaflets slightly large, leaves thin, membranous.Epidermal cells slightly wavy, lower epidermal stomas and non-glandular hairs on them; non-glandular hairs straight or slightly wavy, some cells containing reddish-brown content.E. koreanum Nakai
6Shan’anxiLeaves elliptical or subrounded, apical leaf relative long, with serrate on the margin, base deep heart-shaped and askew, leaflets slightly large, leaves thin, membranous.Epidermal cells slightly wavy, lower epidermal stomas and non-glandular hairs on them; non-glandular hairs straight or slightly wavy, few undulant curvy; cells very big, some cells containing reddish-brown content.E. koreanum Nakai
7GansuLeaves lanceolate, apical leaf relative long, with serrate on the margin.Epidermal cells slightlv wavy; few non-glandular on them, cells straight or curvy, with few columns of calcium oxalate.E. wushanense T. S. Ying
8GansuLeaves leathery, oblong or lanceolate in shape.Lower and upper epidermal cells slightly wavy, relatively small; stomas dense; with verrucae on the surface; columns of calcium oxalate scattered throughout.E sagittatum (Sieb.et Zucc.) Maxim.
9SichuanLeaves thick, leathery, base askew.Lower and upper epidermal cells slightly wavy, relative small; stomas dense; columns of calcium oxalate scattered throughout.E. sagittatum (Sieb.et Zucc.) Maxim.
10HubeiLeaflets in base deep heart-shaped, with serrate on the margin, leathery.Epidermal cells slightly wavy; anomocytic stomata; non-glandular hairs relative less; columns of calcium oxalate scattered throughout; some cells containing reddish-brown content.E.brevicornu Maxim.
11GansuLeaves thin, relatively large.Epidermal cells slightly wavy, lower epidermal stomas and non-glandular hairs on them; non-glandular hairs straight or slightly wavy, few undulant curvy; cells very big, some cells containing reddish-brown content.E. koreanum Nakai
12GansuThe lower surface of leaf and petiole densely covered with villous pilose, leaves thin, leathery.Non-glandular slightly fine and wavy; glandular rare; upper and lower epidermal cells curved or irregular; anomocytic or anisocytic stomata sparse; fibers visible; some containing secretions.E. pubescens Maxim.
13LiaoningLeaves elliptical or subrounded, apical leaf relative long, with serrate on the margin, base deep heart-shaped and askew, leaflets slightly large.Epidermal cells slightly wavy, lower epidermal stomas and non-glandular hairs on them; non-glandular hairs straight or slightly wavy, few undulant curvy; cells very big, some cells containing reddish-brown content.E. koreanum Nakai
Table 2. Orthogonal array design matrix L9 (3) 4 and experimental results (n = 3).
Test NumberFactors
Processing Time (min)Processing Power (w)Weight (g)Epimedin A (mg/g)Epimedin B (mg/g)Epimedin C (mg/g)Icariin (mg/g)Baohuoside I (mg/g)Total Yield (mg/g)
1520052.132.9911.2110.121.5227.97
25400101.702.518.448.251.3722.26
35600151.612.168.2310.281.6323.92
410200101.632.288.577.581.3921.45
510400151.561.968.209.171.5622.45
61060050.040.100.520.460.381.51
715200151.702.278.548.431.3922.33
81540051.501.786.7310.761.6922.47
915600100.000.000.100.040.060.20
Table 3. Regression equation, linear range, correlation coefficients (r), lower limit of quantitation (LLOQ), precision, repeatability, stability, and recovery of 16 investigated analytes (n = 6).
CompundsRegression EquationLinear Range (ng/mL)rLLOQ (ng/mL)Precision Relative Standard Deviations (RSD) (%)Repeatability RSD (%)Stability RSD (%)Recovery (%)
Magnofloriney = 19.9023x + 10.09775–50,0000.9981.01.167.858.9596.50%
Neochlorogenic acidy = 38.3582x + 1.39685–50,0000.9981.02.921.608.3694.67%
Chlorogenic acidy = 133.5534x + 253.06585–50,0000.9991.03.531.028.60112.40%
Cryptochlorogenic acidy = 28.6432x − 1.04425–50,0000.9981.02.892.896.0193.10%
Astragaliny = 76.2325x + 45.22831–10,0000.9981.01.026.686.5393.69%
Quercitriny =112.5154x + 21.29391–10,0000.9991.00.579.794.1591.36%
Hyperosidey = 85.7392x + 48.99695–50,0000.9971.00.653.762.99100.45%
Baohuoside IIy = 180.1430x + 21.07981–10,0000.9970.50.827.944.8890.32%
Baohuoside Iy = 165.3076x + 168.53525–50,0000.9990.50.292.624.7692.43%
Icariside Iy = 236.7256x + 218.91441–10,0000.9961.00.868.229.27108.30%
Epimedin By = 57.2633 + 3.97291–10,0000.9981.01.651.863.8591.22%
Sagittatoside By = 88.9303x − 19.08105–50,0000.9990.50.913.664.01100.18%
Epimedin Cy = 19.0452x − 2.51945–50,0000.9971.02.093.193.95110.35%
Epimedin Ay = 25.9472x + 6.51905–50,0000.9991.01.942.306.21105.60%
Sagittatoside Ay = 68.2445x +20.19041–10,0000.9980.50.593.775.8994.98%
Icariiny = 133.1104x + 838.29825–50,0000.9960.51.351.144.3298.43%
Table 4. The contents of 16 compounds in Epimedium samples (μg/g).
CompundsSort12345678910111213
Baohuoside IIcrude0.98101.190.69183.9549.40132.400.350.380.31882.15248.1278.8241.46
processed0.53120.280.67103.1935.77102.850.350.230.26179.6844.0661.7339.82
Baohuoside Icrude2.44626.164.82723.63420.10591.285.141.721.791125.14411.42820.44484.79
processed2.54392.245.37774.33366.89573.906.403.322.89945.51432.14760.07553.46
Epimedin Acrude0.331331.782.39917.991323.221300.174.533.221.871697.701011.922054.511704.68
processed3.19425.843.09976.371124.781052.936.694.893.461422.281300.541807.191758.32
Epimedin Bcrude2.301668.054.641206.511496.901712.985.665.257.212065.071215.853015.301946.71
processed17.88621.593.241312.941426.511417.146.267.293.911728.831611.523075.182089.55
Epimedin Ccrude2.69977.793.871007.21855.221148.508.355.505.141852.39760.555328.931094.29
processed10.44482.209.551080.77792.09979.935.864.359.701894.001078.074955.041100.49
Quercitrincrude9.4279.0810.4080.74127.82101.9010.2610.8719.2289.3786.85216.4969.50
processed11.8635.249.8063.92133.4085.158.399.358.1369.5048.78101.3258.07
Sagittatoside Acrude0.64326.580.53262.79128.74226.190.540.630.48403.78175.851163.67221.25
processed0.38126.770.53247.78100.44190.450.260.810.41303.49176.40953.55149.32
Sagittatoside Bcrude1.06565.491.01456.68224.44373.741.451.141.24599.40282.31750.66404.40
processed1.22188.591.46405.13165.77293.871.391.721.91471.76309.80528.11258.03
Hyperosidecrude379.84684.99539.24835.24306.45655.84544.31497.95345.511011.95870.43271.50952.46
processed294.44107.31452.53784.14387.38553.44425.78485.90362.86829.46608.12119.501001.10
Chlorogenic acidcrude12.541755.8715.621110.142471.911799.8114.119.096.721767.931542.55475.882890.56
processed12.67538.5911.561371.742188.571520.7218.4814.3212.411380.941218.47384.223336.53
Magnoflorinecrude-1287.090.861141.121129.522291.760.410.66-1321.291335.76350.53939.18
processed-1310.170.72694.151320.461380.921.091.662.601249.401204.44426.97663.15
Neochlorogenic acidcrude130.19161.18172.34139.36163.03185.52182.74152.3197.77148.66102.0128.42109.09
processed100.8044.70146.18160.19180.31192.16142.38166.7892.54134.69135.7840.56152.02
Cryptochlorogenic acidcrude10.031020.1514.48627.721368.76977.9110.9311.8411.37989.72767.35150.611567.19
processed9.04242.5111.48795.011342.77863.5114.8715.7213.55768.96623.72146.621856.38
Icariside Icrude4.205.871.797.5618.9212.730.360.19-19.495.1017.4111.41
processed3.5385.473.1336.11362.27250.864.561.070.1981.9313.61241.49166.84
Icariincrude2.782182.947.672218.893056.923098.3311.357.423.353613.001930.354296.512585.21
processed11.841706.467.122866.103363.193273.8919.1913.519.273605.642456.705209.314034.14
Astragalincrude294.2923.80688.80 76.1410.2430.64695.71730.92356.7832.5856.1718.6162.14
processed237.307.20668.6538.996.9825.27606.98679.07305.0624.4224.079.5997.46
Table 5. Factors and levels of the orthogonal array design L9 (3) 4 matrix.
LevelsFactors
Processing Heat (w)Processed Time (min)Weight (g)
120055
24001010
36001515
Table 6. Mass spectra properties of 16 analytes.
CompoundsPrecursor Ion (m/z)Product Ion (m/z)Frag. (V) C.E. (V)
Magnoflorine340.1310.114522
Neochlorogenic acid352.9191.011510
Chlorogenic acid353.0191.09010
Cryptochlorogenic acid353.1172.910010
Astragalin447.0284.014022
Quercitrin447.2300.114520
Hyperoside463.0300.09022
Baohuoside II499.2353.014020
Baohuoside I513.2366.014020
Icariside I529.0367.014512
Epimedin B645.1365.614530
Sagittatoside B645.2366.214530
Epimedin C659.2365.714530
Epimedin A675.1365.813032
Sagittatoside A675.2367.014532
Icariin721.0513.214510

