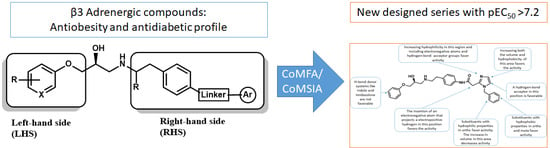
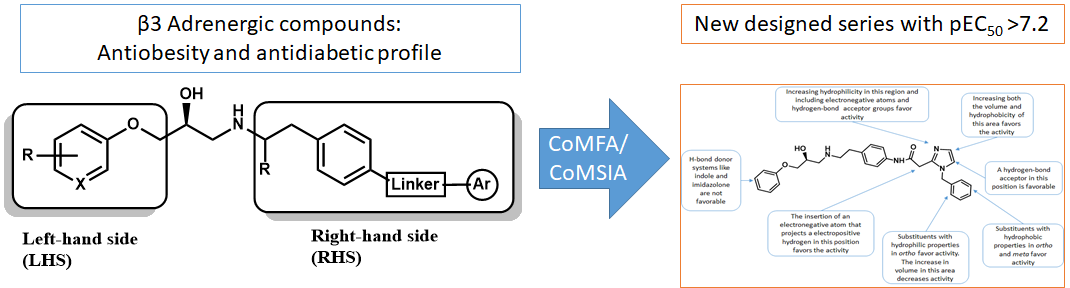
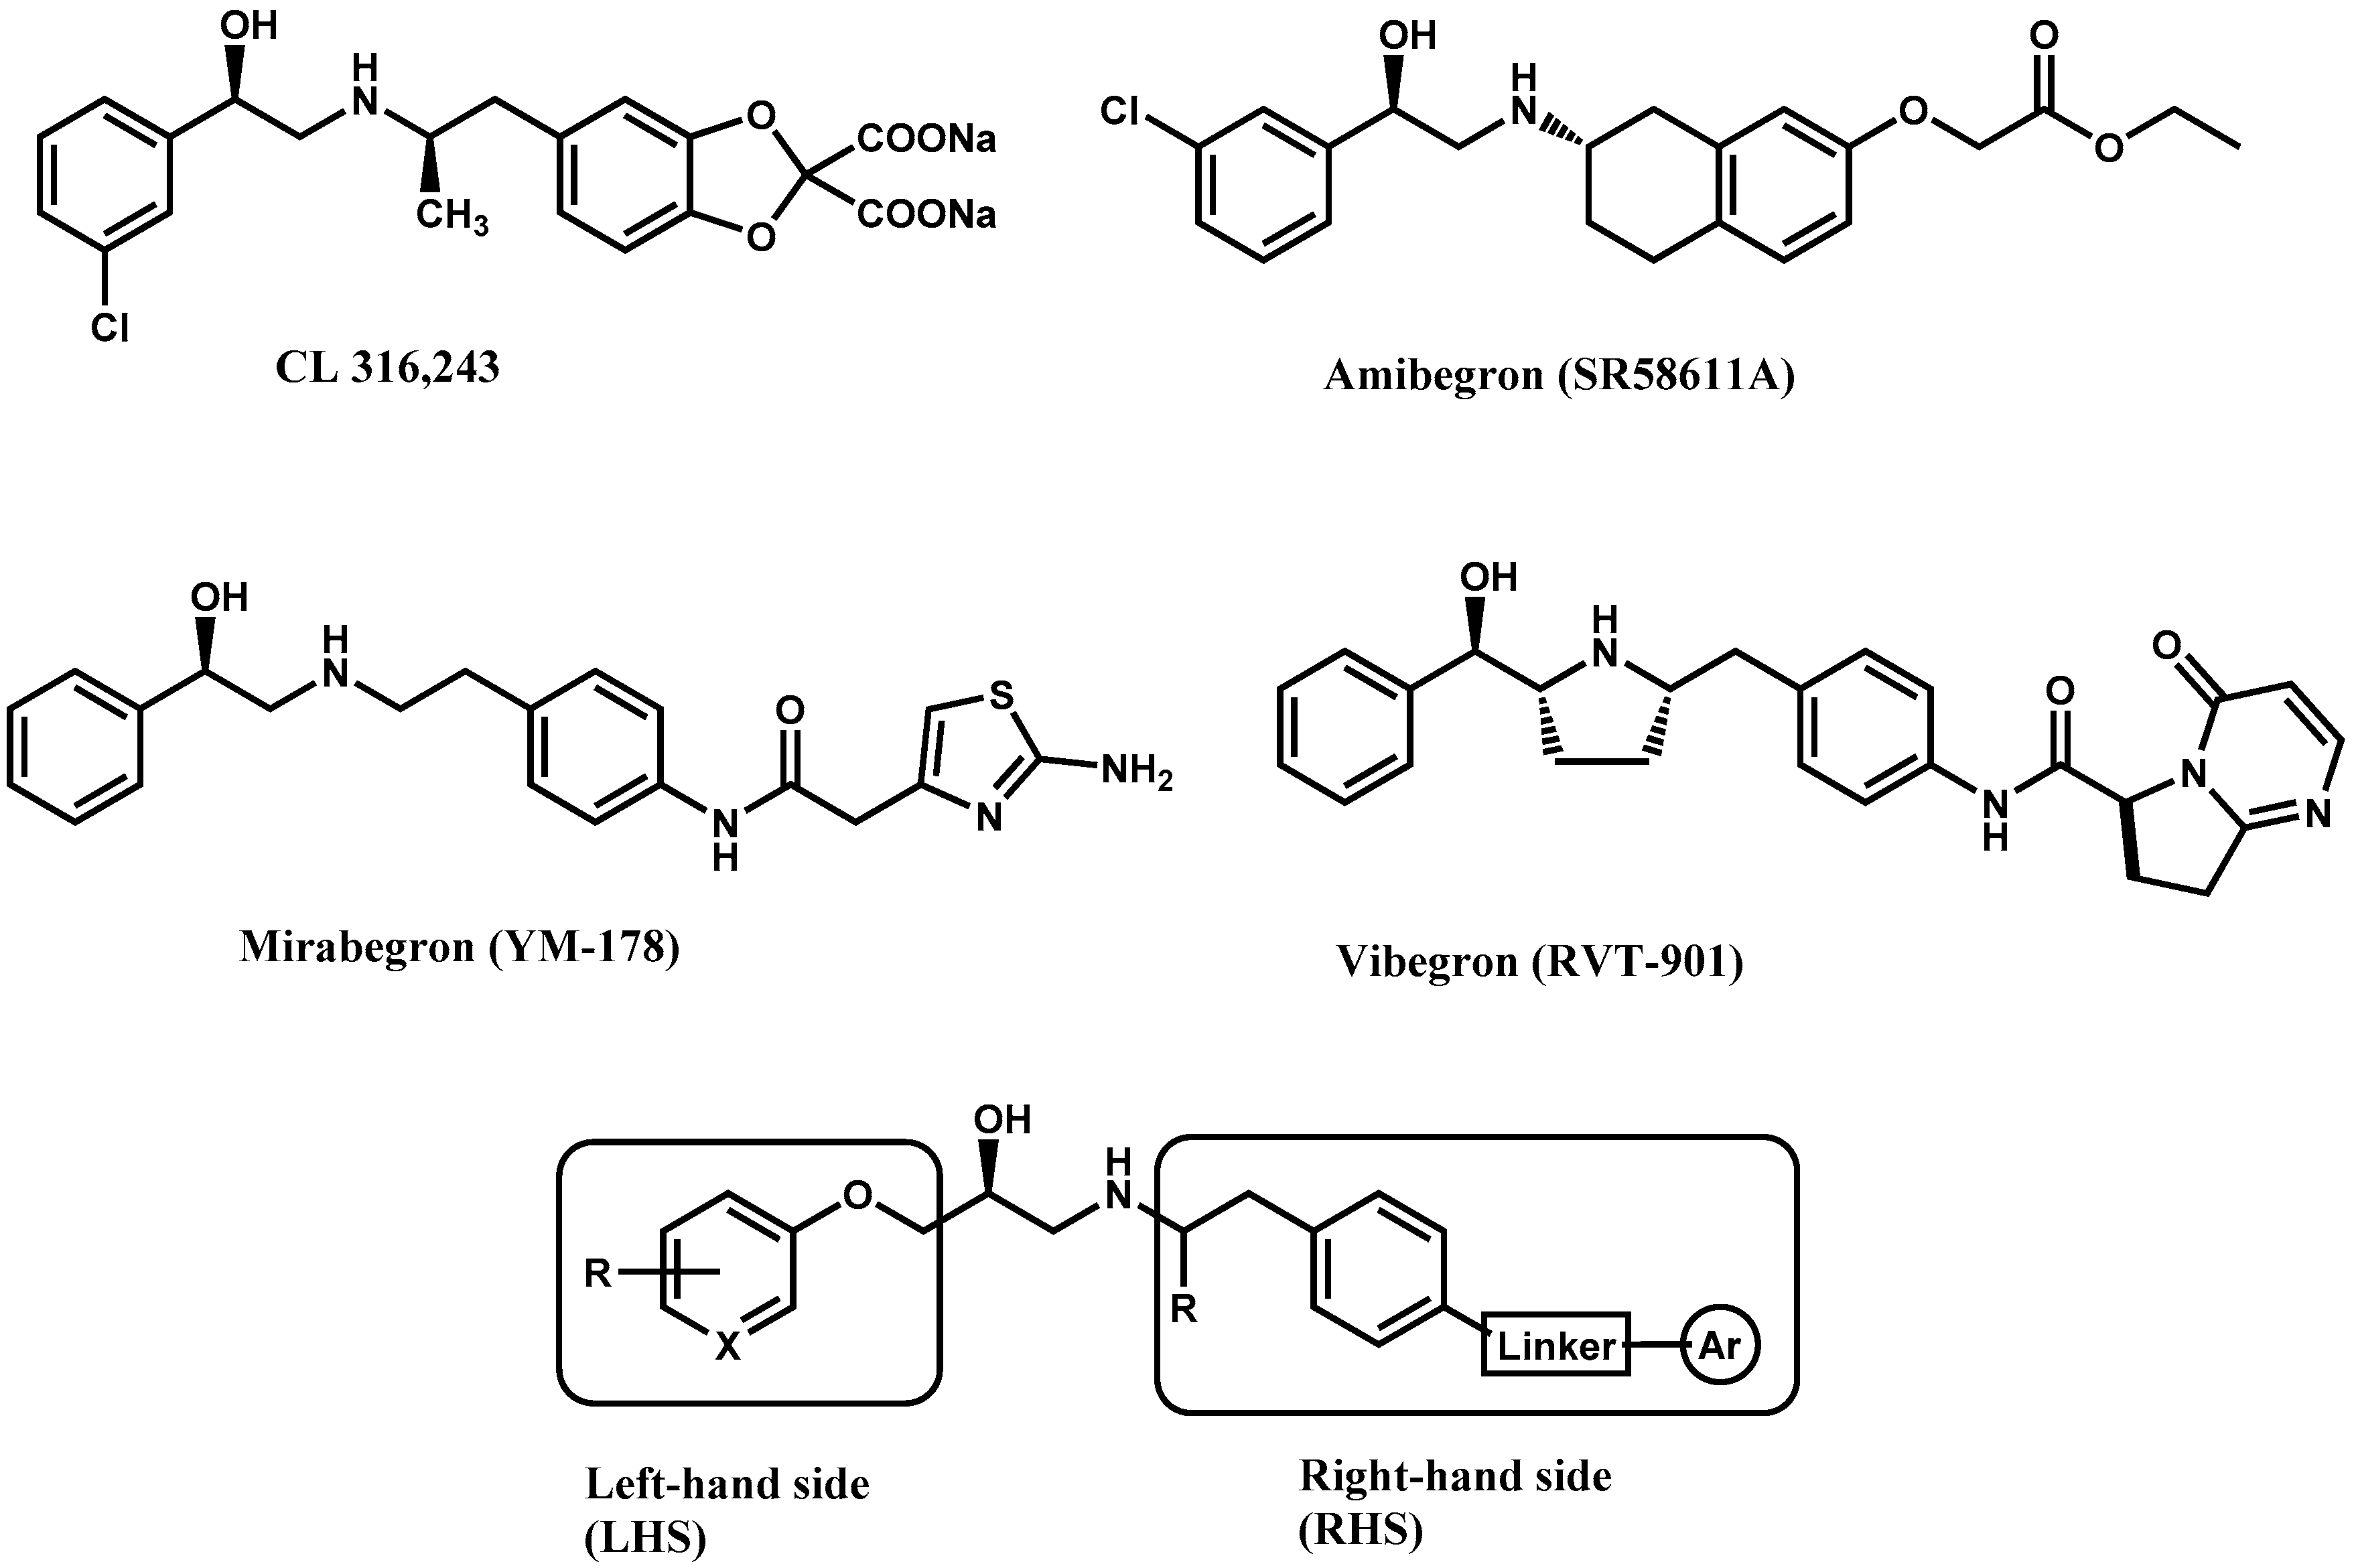
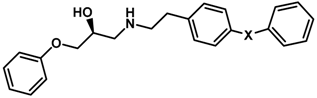
Structure-Activity Relationships Based on 3D-QSAR CoMFA/CoMSIA and Design of Aryloxypropanol-Amine Agonists with Selectivity for the Human β3-Adrenergic Receptor and Anti-Obesity and Anti-Diabetic Profiles


 ,
,  ,
,  and
and 
Abstract
:
1. Introduction
2. Results and Discussion
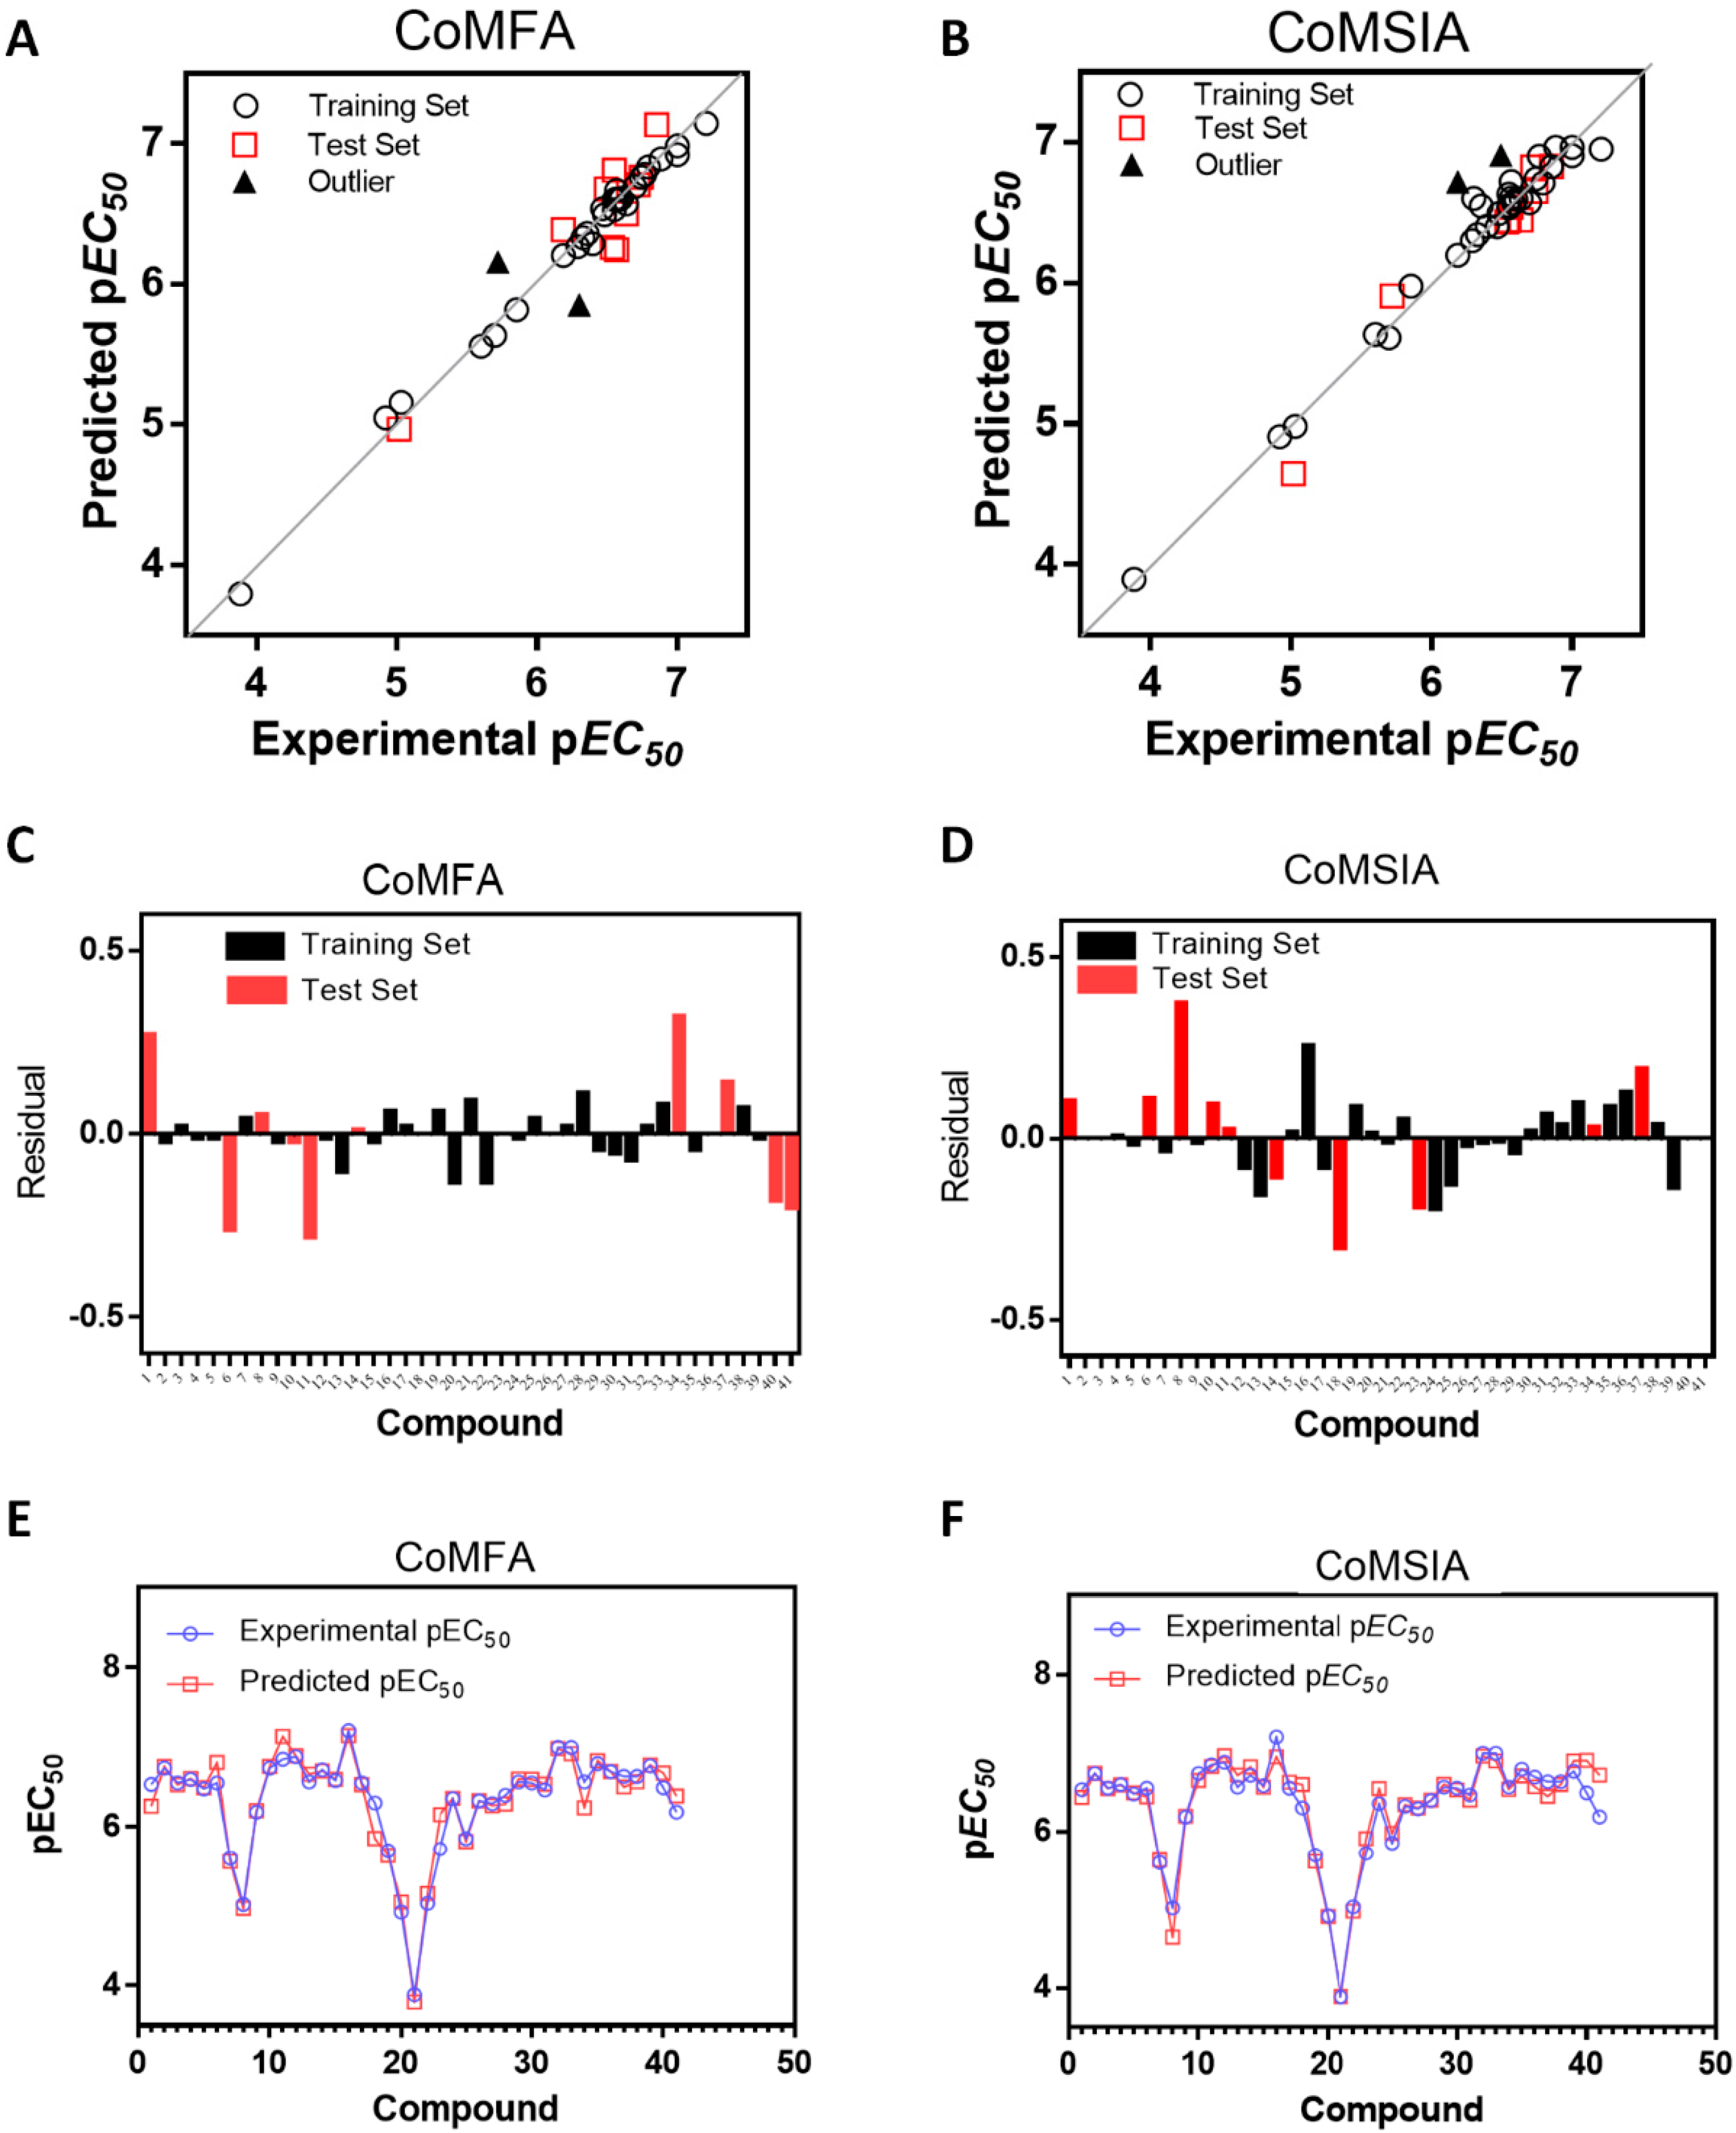
2.1. Statistical Results
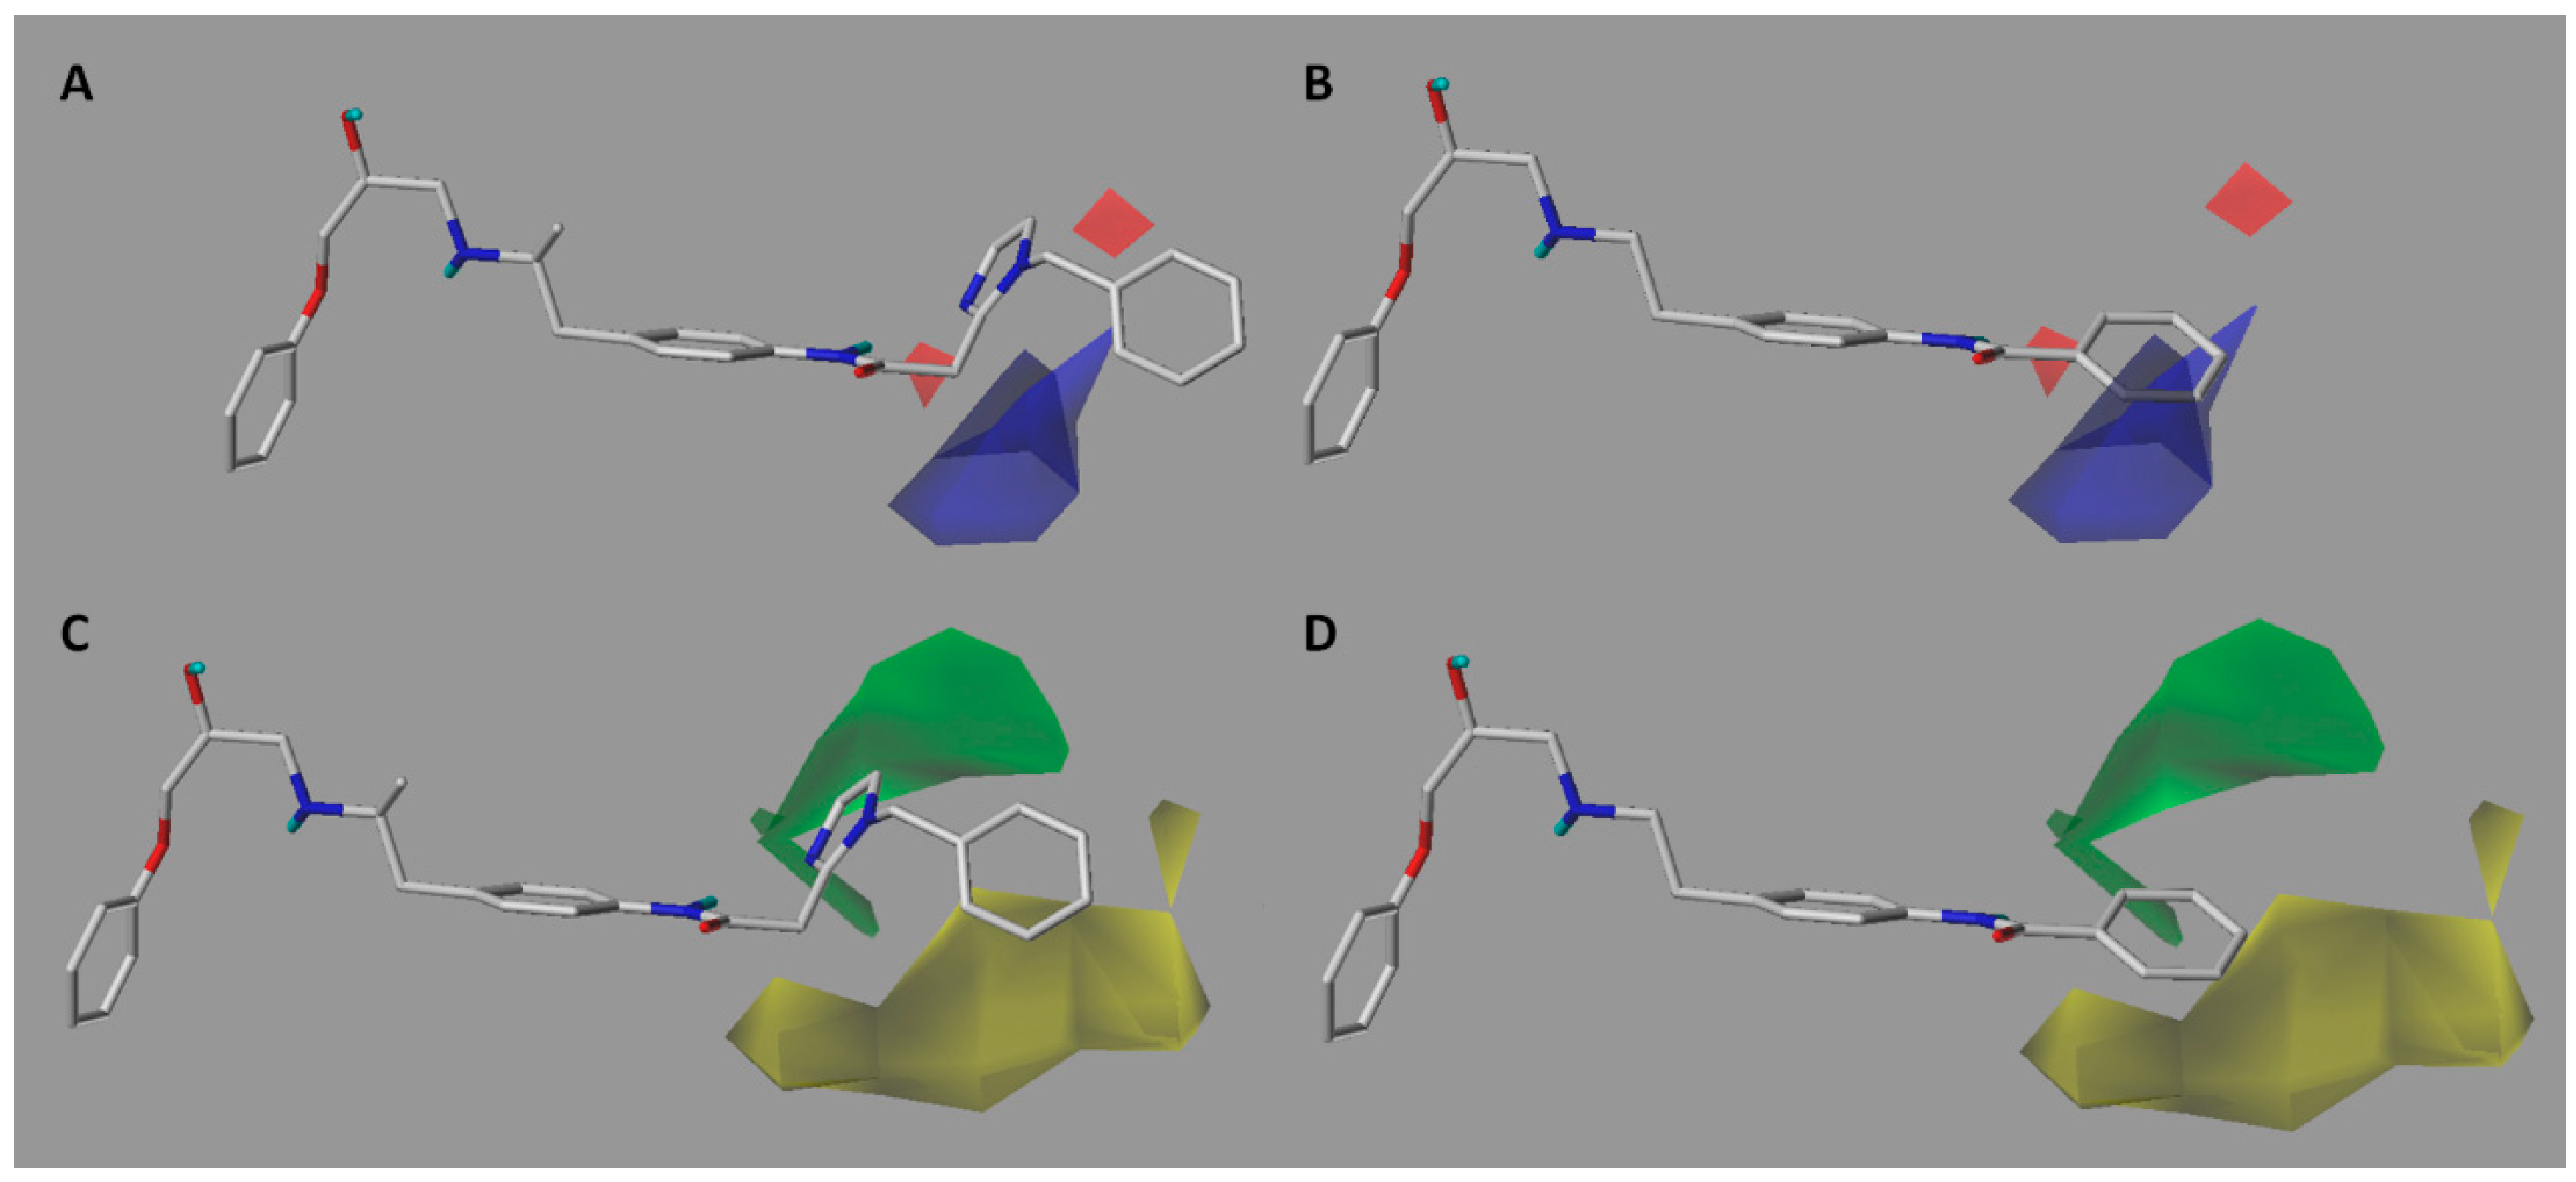
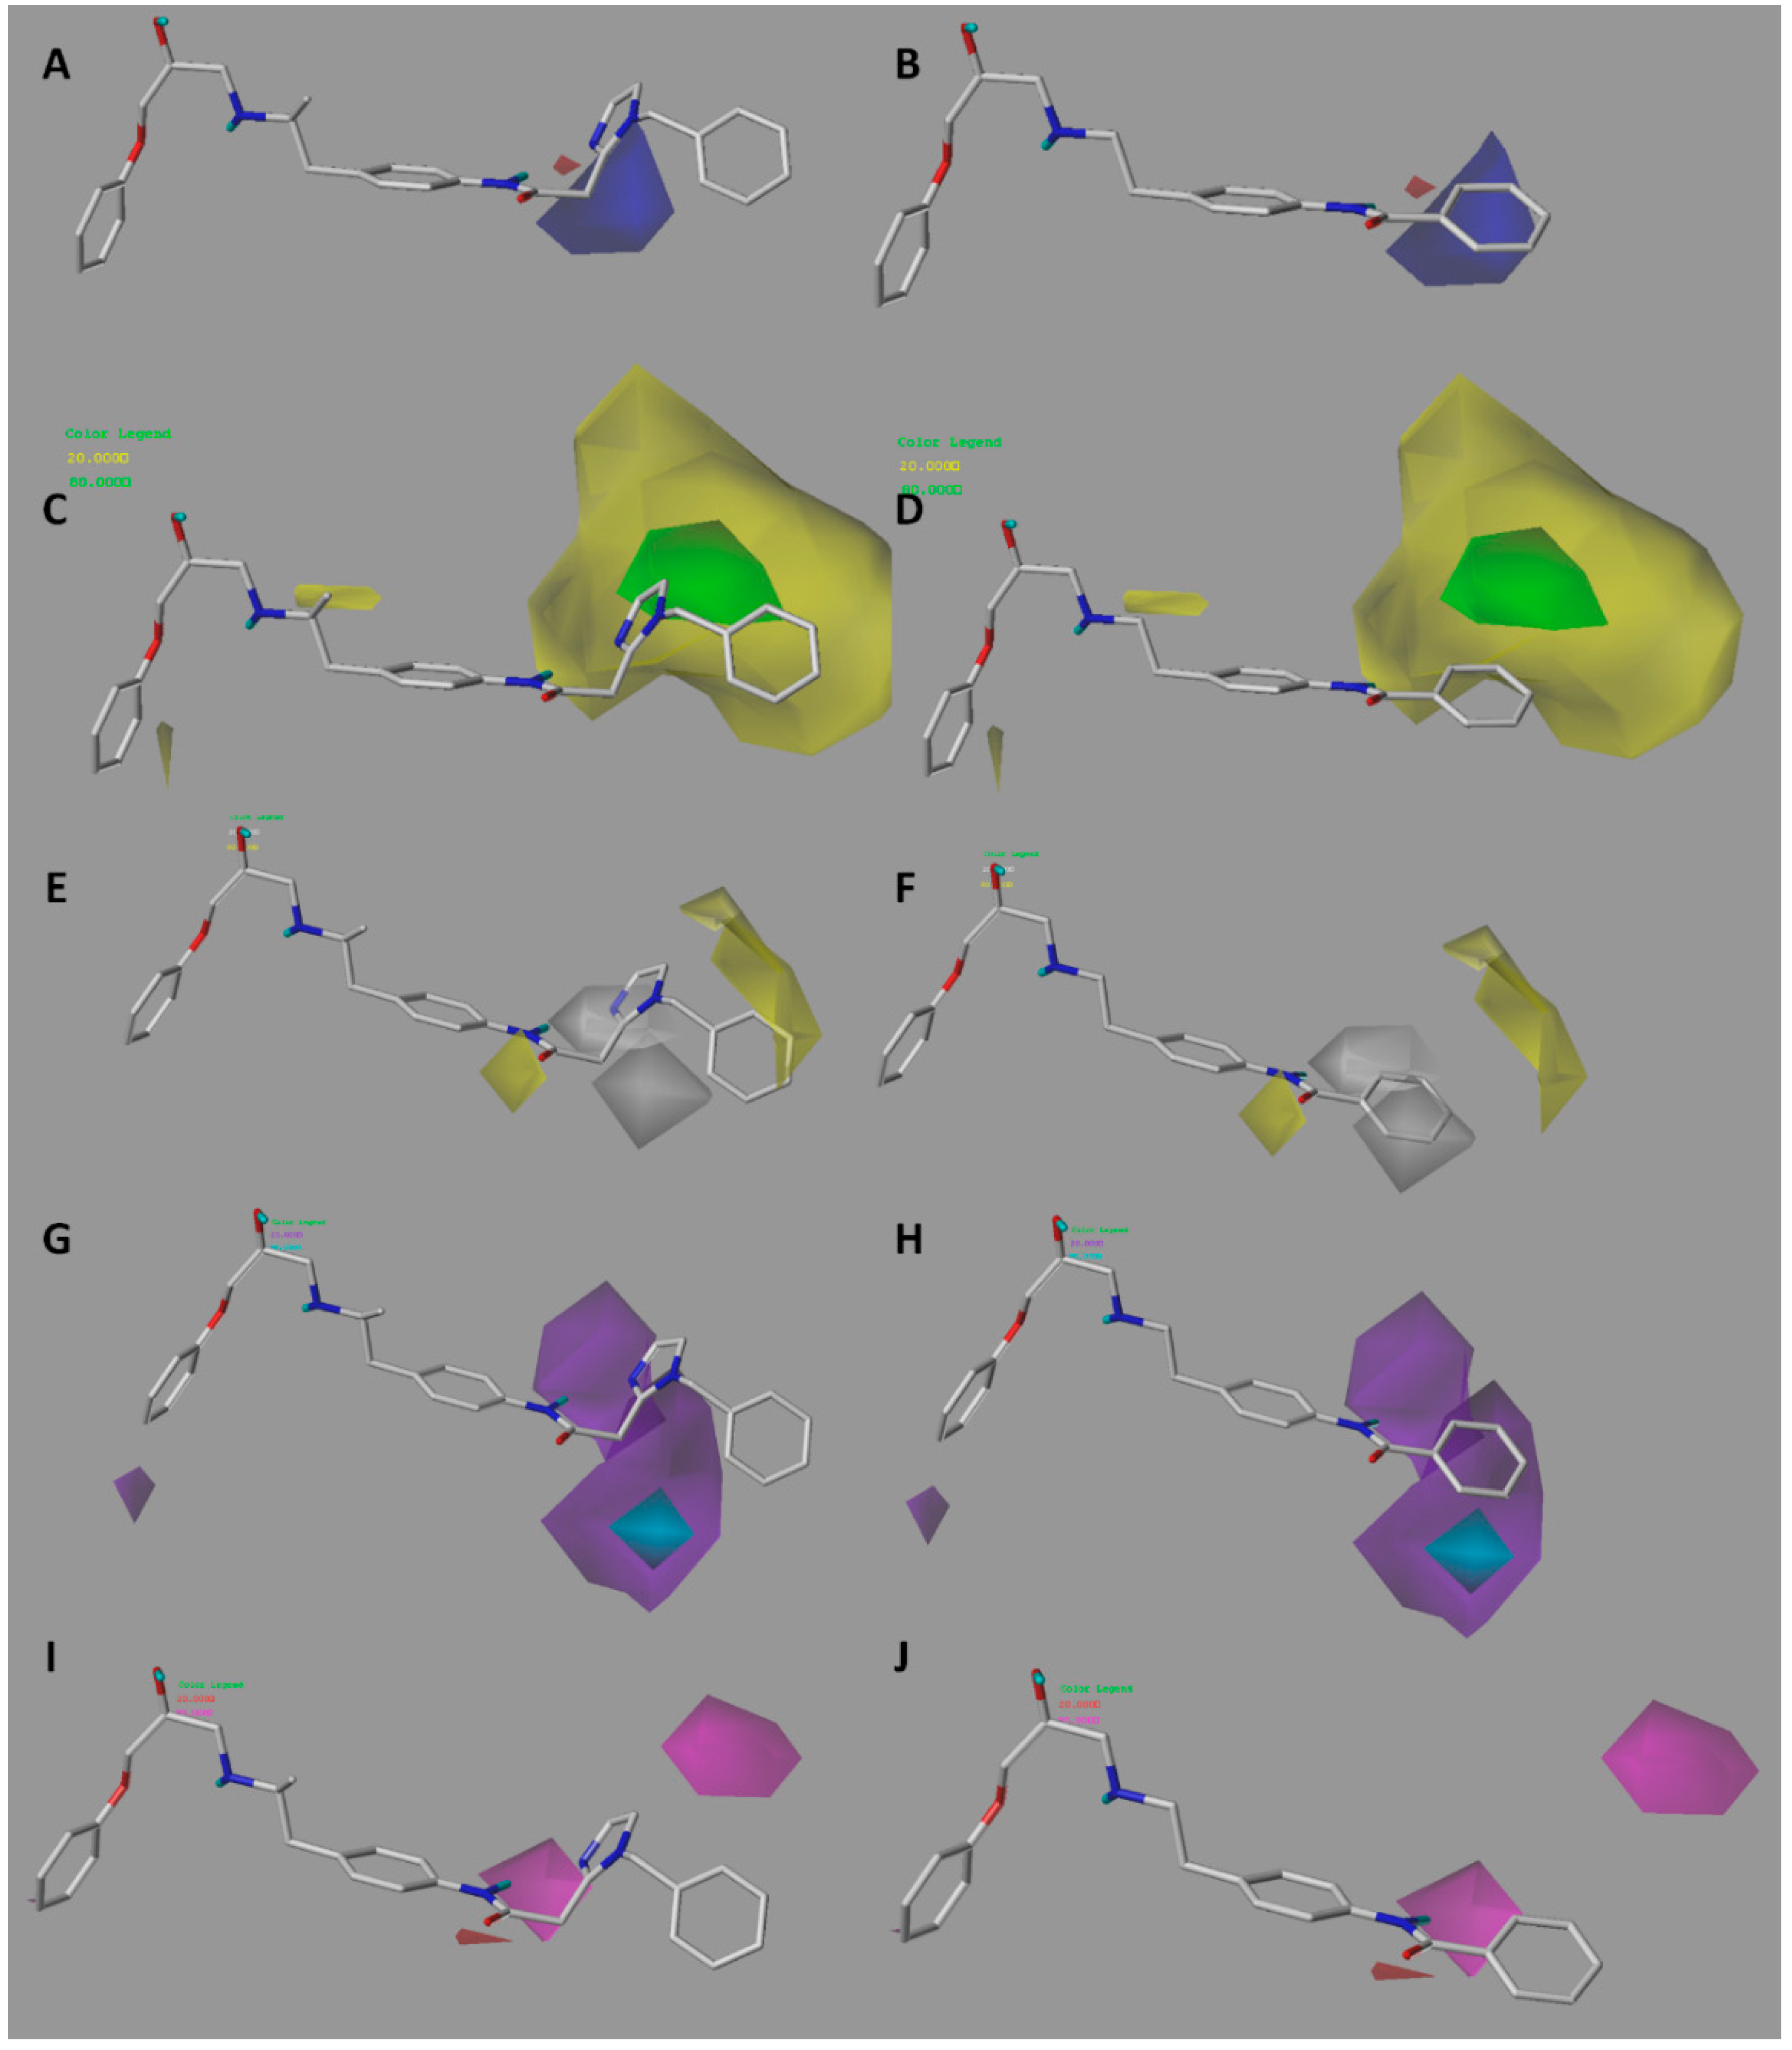
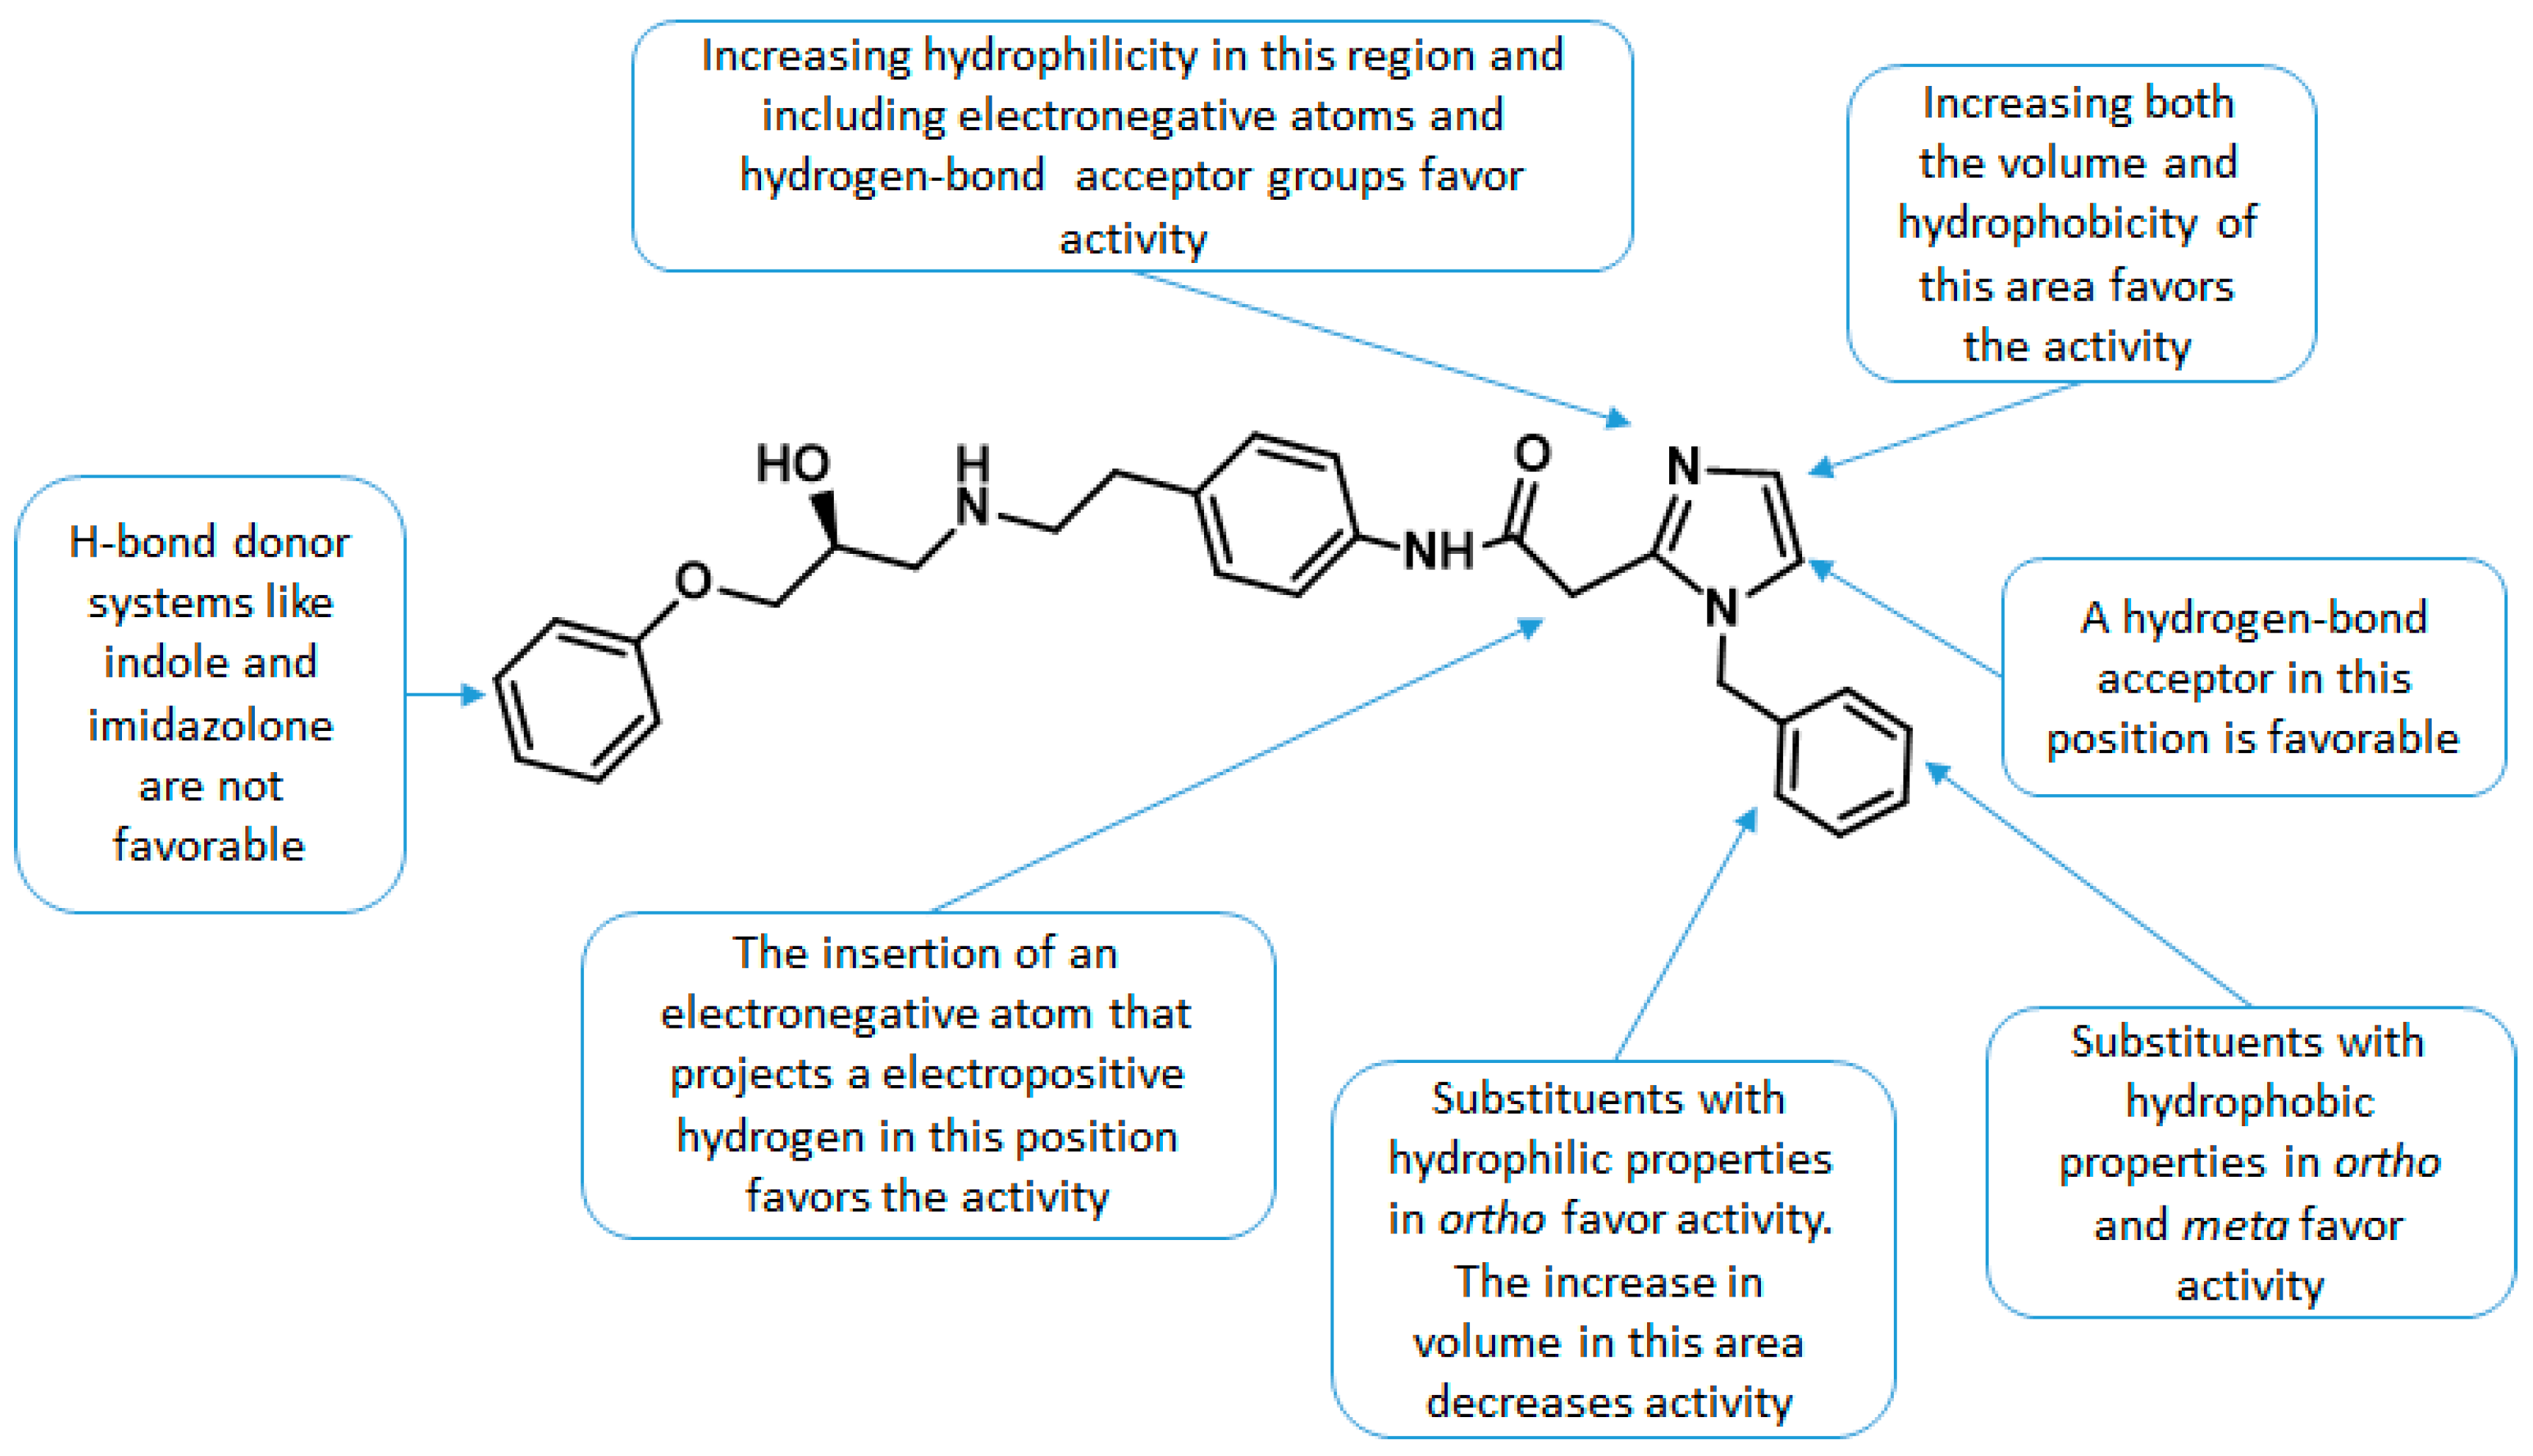
2.2. Contour Maps Analysis
2.2.1. CoMFA
2.2.2. CoMSIA
2.3. Outliers
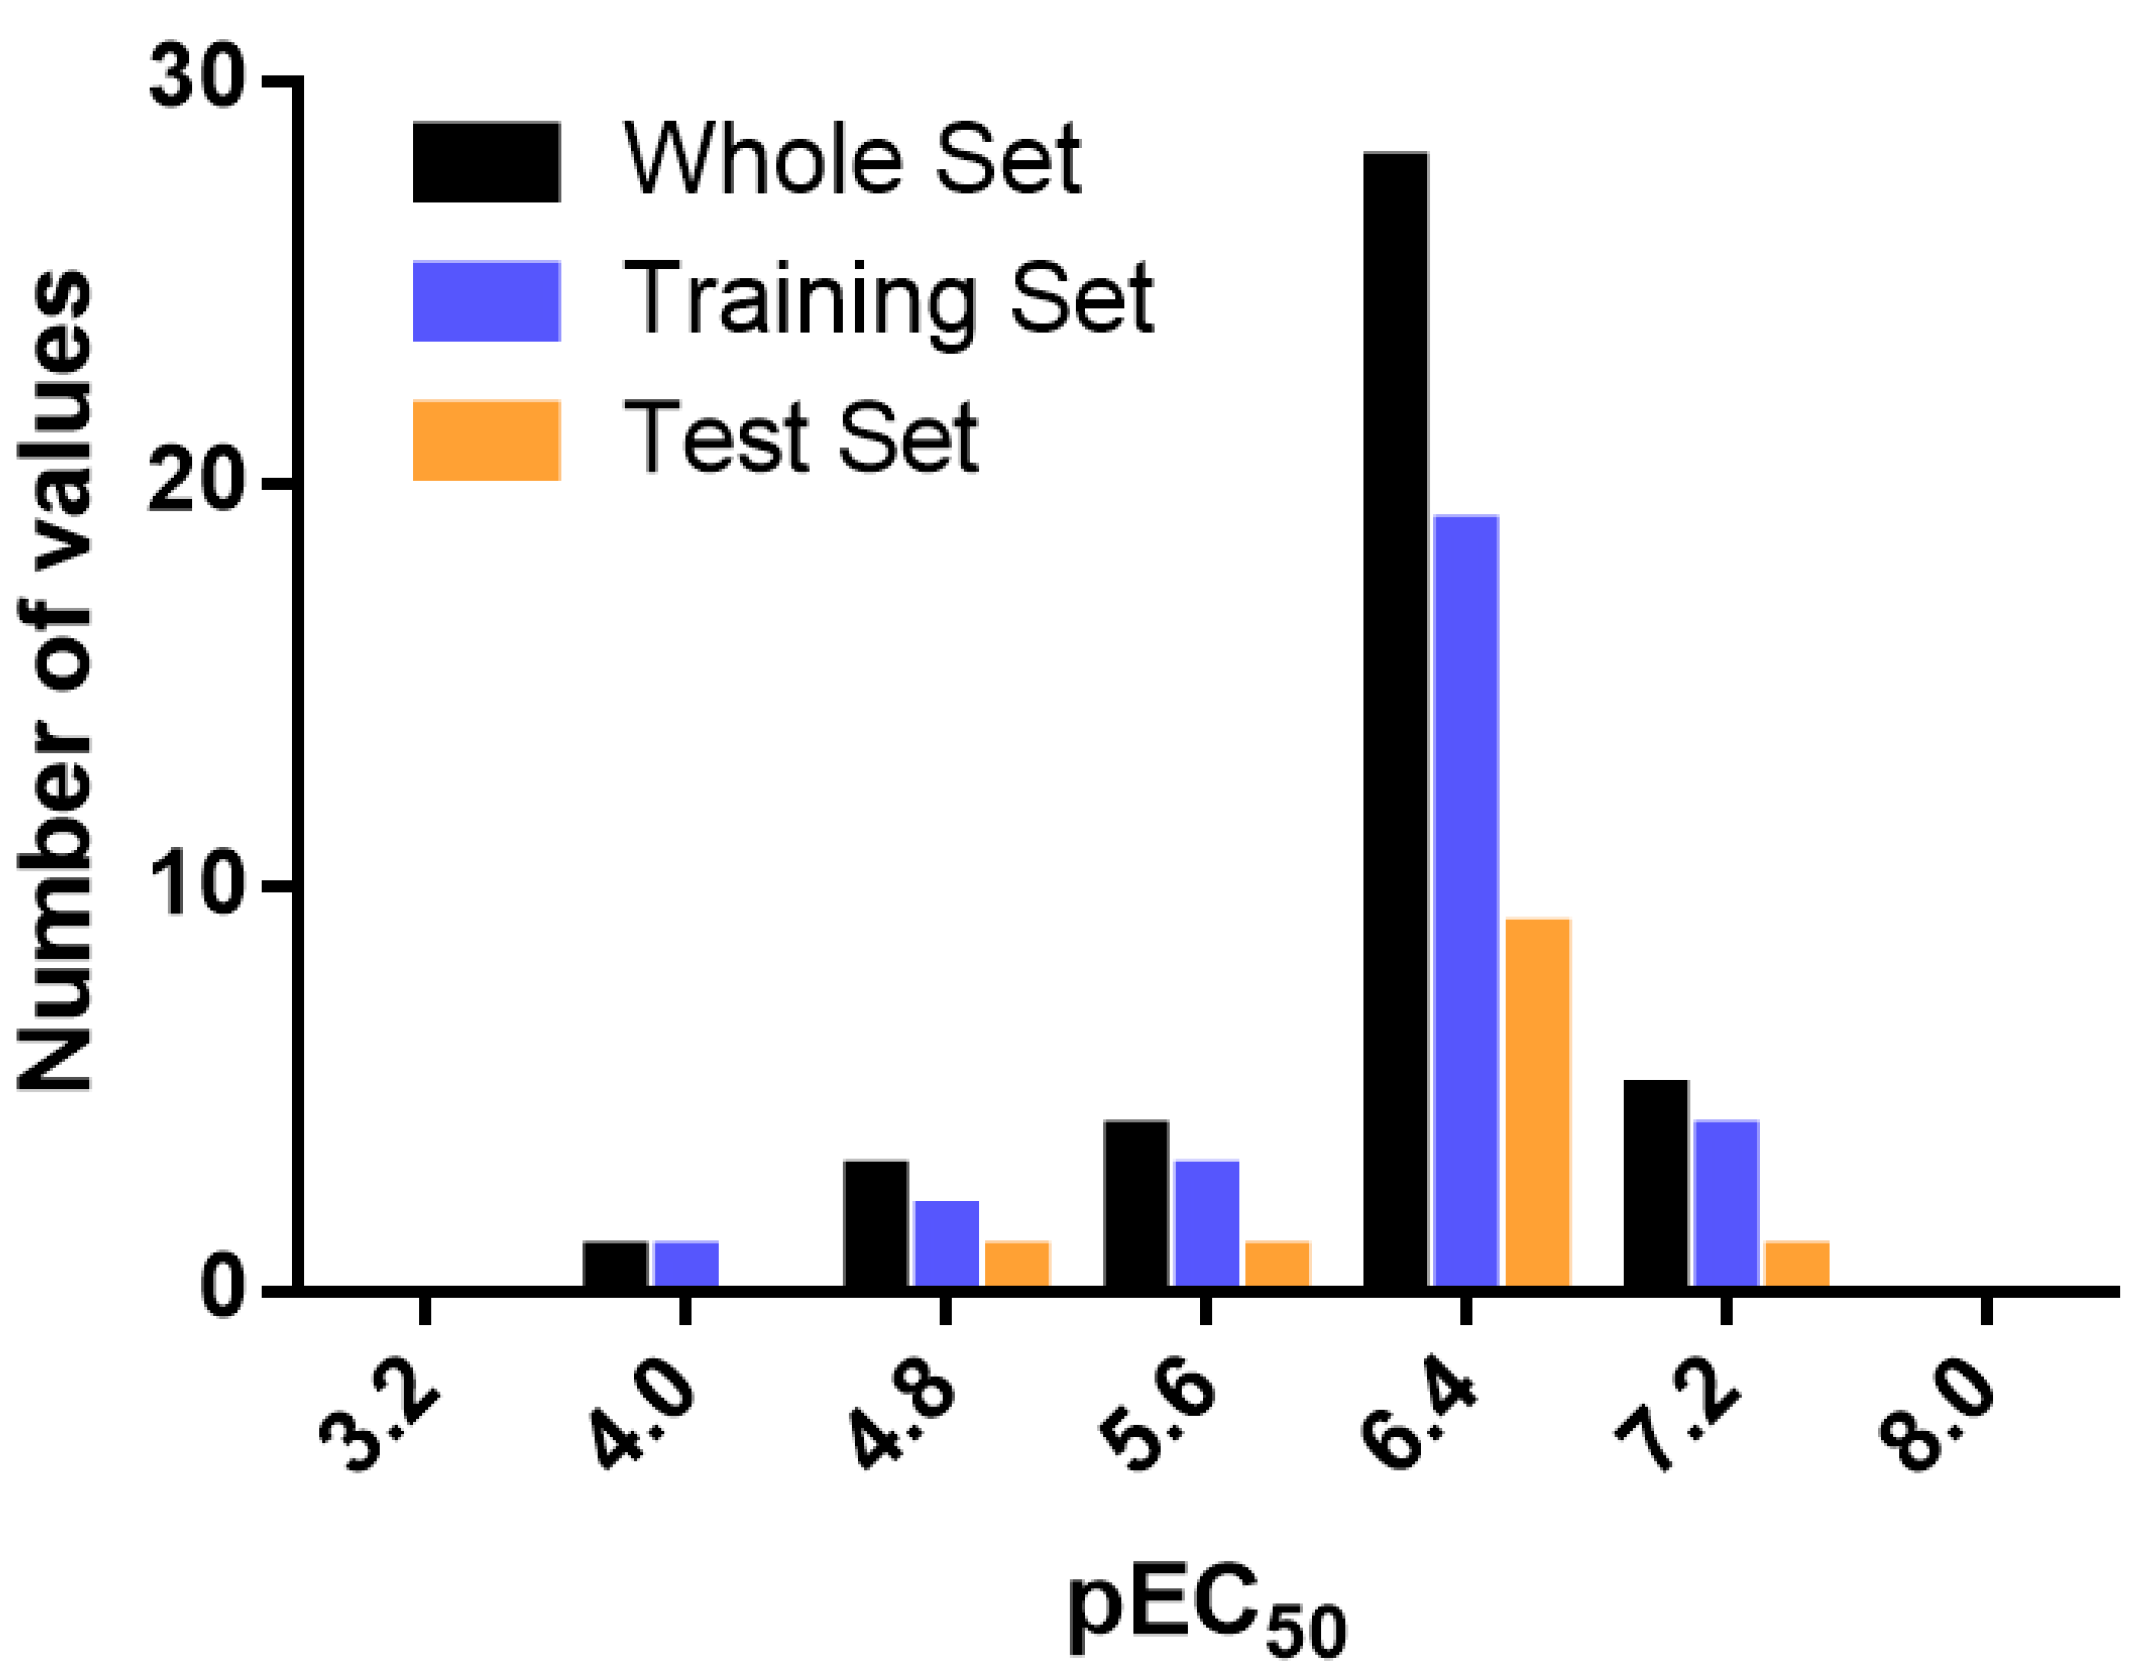
2.4. Applicability Domain
2.5. Design of Novel Derivatives
3. Materials and Methods
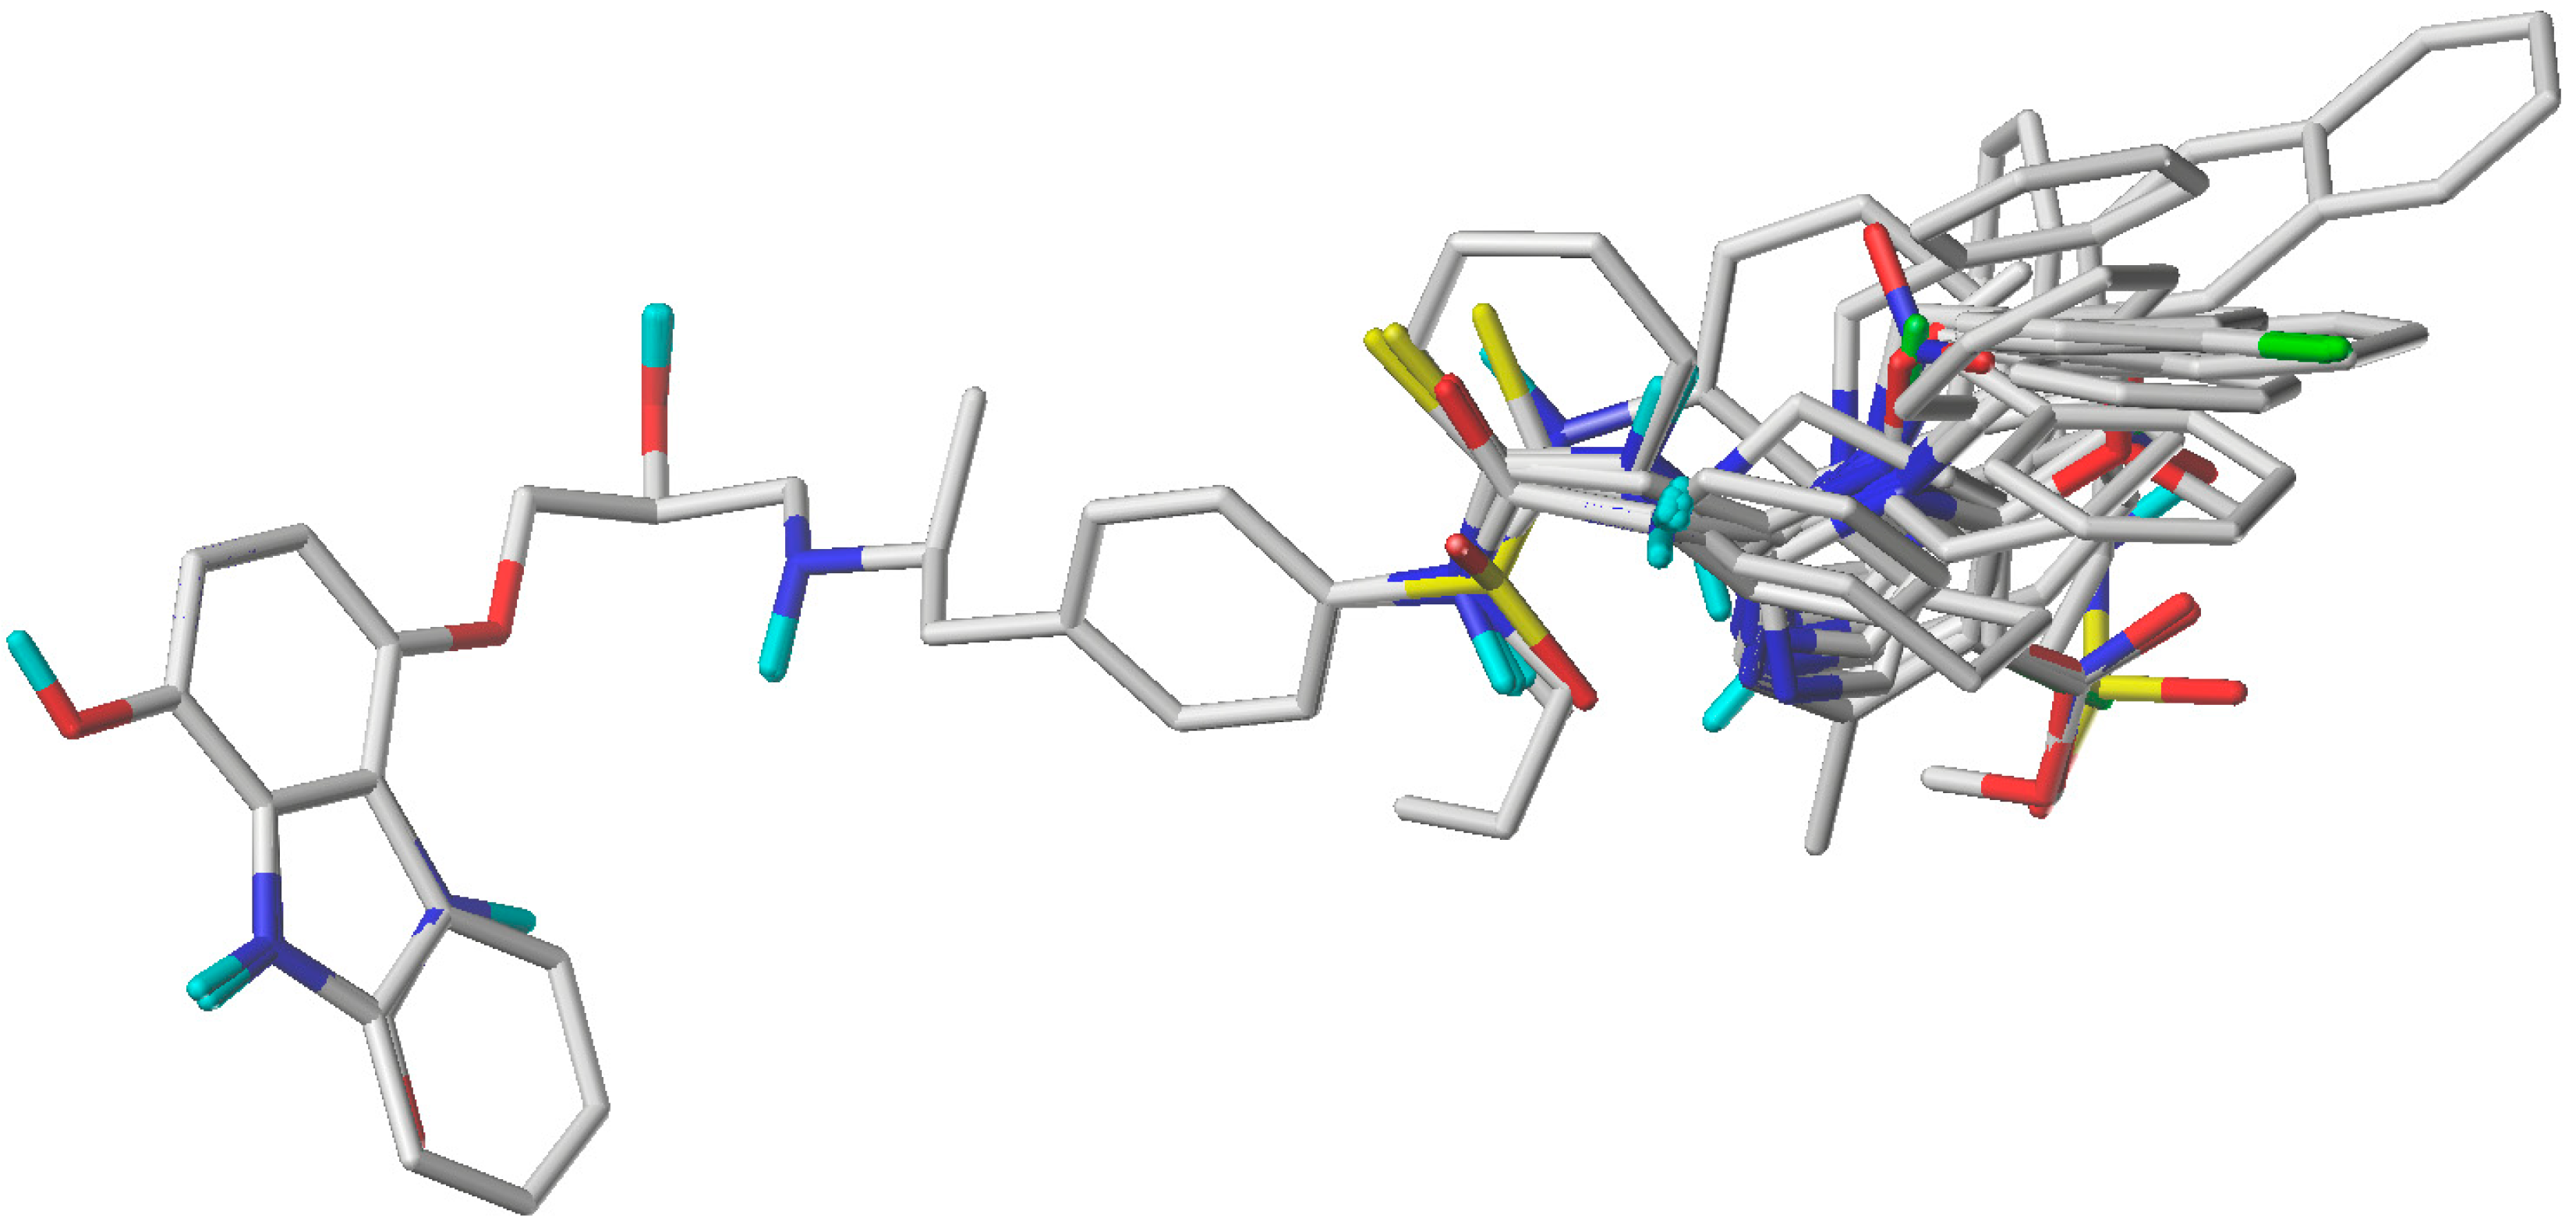
3.1. Selection of Conformers and Molecular Alignment
3.2. CoMFA and CoMSIA Field Calculation
3.3. Data Set Selection and β3-Adrenergic Activity
3.4. Internal Validation and Partial Least Squares (PLS) Analysis
3.5. External Validation
3.6. Applicability Domain Calculation
4. Conclusions
Supplementary Materials
Author Contributions
Acknowledgments
Conflicts of Interest
References
- Tan, S.; Curtis-Prior, P.B. Characterization of the beta-adrenoceptor of the adipose cell of the rat. Int. J. Obes. 1983, 7, 409–414. [Google Scholar] [PubMed]
- Emorine, L.J.; Marullo, S.; Briend-Sutren, M.M.; Patey, G.; Tate, K.; Delavier-Klutchko, C.; Strosberg, A.D. Molecular characterization of the human beta 3-adrenergic receptor. Science 1989, 245, 1118–1121. [Google Scholar] [CrossRef] [PubMed]
- Heel, R.C.; Brogden, R.N.; Speight, T.M.; Avery, G.S. Atenolol: A review of its pharmacological properties and therapeutic efficacy in angina pectoris and hypertension. Drugs 1979, 17, 425–460. [Google Scholar] [CrossRef] [PubMed]
- Paterson, J.W.; Evans, R.J.; Prime, F.J. SElectivity of broncholidlator action of salbutamol in asthmatic patients. Br. J. Dis. Chest 1971, 65, 21–38. [Google Scholar] [CrossRef]
- Rodriguez, M.; Carillon, C.; Coquerel, A.; Le Fur, G.; Ferrara, P.; Caput, D.; Shire, D. Evidence for the presence of beta 3-adrenergic receptor mRNA in the human brain. Brain Res. Mol. Brain Res. 1995, 29, 369–375. [Google Scholar] [CrossRef]
- Gauthier, C.; Tavernier, G.; Charpentier, F.; Langin, D.; Le Marec, H. Functional beta3-adrenoceptor in the human heart. J. Clin. Investig. 1996, 98, 556–562. [Google Scholar] [CrossRef] [PubMed]
- Krief, S.; Lonnqvist, F.; Raimbault, S.; Baude, B.; Van Spronsen, A.; Arner, P.; Strosberg, A.D.; Ricquier, D.; Emorine, L.J. Tissue distribution of beta 3-adrenergic receptor mRNA in man. J. Clin. Investig. 1993, 91, 344–349. [Google Scholar] [CrossRef] [PubMed]
- Stemmelin, J.; Cohen, C.; Terranova, J.P.; Lopez-Grancha, M.; Pichat, P.; Bergis, O.; Decobert, M.; Santucci, V.; Francon, D.; Alonso, R.; et al. Stimulation of the beta3-Adrenoceptor as a novel treatment strategy for anxiety and depressive disorders. Neuropsychopharmacology 2008, 33, 574–587. [Google Scholar] [CrossRef] [PubMed]
- Gauthier, C.; Rozec, B.; Manoury, B.; Balligand, J.L. Beta-3 adrenoceptors as new therapeutic targets for cardiovascular pathologies. Curr. Heart Fail. Rep. 2011, 8, 184–192. [Google Scholar] [CrossRef] [PubMed]
- Takasu, T.; Ukai, M.; Sato, S.; Matsui, T.; Nagase, I.; Maruyama, T.; Sasamata, M.; Miyata, K.; Uchida, H.; Yamaguchi, O. Effect of (R)-2-(2-aminothiazol-4-yl)-4′-{2-[(2-hydroxy-2-phenylethyl)amino]ethyl} acetanilide (YM178), a novel selective beta3-adrenoceptor agonist, on bladder function. J. Pharmacol. Exp. Therm. 2007, 321, 642–647. [Google Scholar] [CrossRef] [PubMed]
- Perrone, M.G.; Notarnicola, M.; Caruso, M.G.; Tutino, V.; Scilimati, A. Upregulation of beta3-adrenergic receptor mRNA in human colon cancer: A preliminary study. Oncology 2008, 75, 224–229. [Google Scholar] [CrossRef] [PubMed]
- Van Baak, M.A.; Hul, G.B.; Toubro, S.; Astrup, A.; Gottesdiener, K.M.; DeSmet, M.; Saris, W.H. Acute effect of L-796568, a novel beta 3-adrenergic receptor agonist, on energy expenditure in obese men. Clin. Pharmacol. Ther. 2002, 71, 272–279. [Google Scholar] [CrossRef] [PubMed]
- Moyes, C.R.; Berger, R.; Goble, S.D.; Harper, B.; Shen, D.M.; Wang, L.; Bansal, A.; Brown, P.N.; Chen, A.S.; Dingley, K.H.; et al. Design, synthesis, and evaluation of conformationally restricted acetanilides as potent and selective beta3 adrenergic receptor agonists for the treatment of overactive bladder. J. Med. Chem. 2014, 57, 1437–1453. [Google Scholar] [CrossRef] [PubMed]
- Maruyama, T.; Onda, K.; Suzuki, T.; Hayakawa, M.; Takahashi, T.; Matsui, T.; Takasu, T.; Nagase, I.; Ohta, M. Synthesis and evaluation of N-phenyl-(2-aminothiazol-4-yl)acetamides with phenoxypropanolamine moiety as selective beta3-adrenergic receptor agonists. Chem. Pharm. Bull. 2012, 60, 647–658. [Google Scholar] [CrossRef] [PubMed]
- Hertzberg, R.; Monreal Santiago, G.; Moberg, C. Synthesis of the beta3-adrenergic receptor agonist solabegron and analogous N-(2-ethylamino)-beta-amino alcohols from O-acylated cyanohydrins-expanding the scope of minor enantiomer recycling. J. Org. Chem. 2015, 80, 2937–2941. [Google Scholar] [CrossRef] [PubMed]
- Bloom, J.D.; Dutia, M.D.; Johnson, B.D.; Wissner, A.; Burns, M.G.; Largis, E.E.; Dolan, J.A.; Claus, T.H. Disodium (R,R)-5-[2-[[2-(3-chlorophenyl)-2-hydroxyethyl]-amino]propyl]-1,3-benzodioxole-2,2-dicarboxylate (CL 316,243). A potent beta-adrenergic agonist virtually specific for beta 3 receptors. A promising antidiabetic and antiobesity agent. J. Med. Chem. 1992, 35, 3081–3084. [Google Scholar] [CrossRef] [PubMed]
- Bianchetti, A.; Manara, L. In vitro inhibition of intestinal motility by phenylethanolaminotetralines: Evidence of atypical beta-adrenoceptors in rat colon. Br. J. Pharmacol. 1990, 100, 831–839. [Google Scholar] [CrossRef] [PubMed]
- Manara, L.; Bianchetti, A. Further heterogeneity of the beta-adrenoceptor. The phenylethanolaminotetralines: New selective agonists for atypical beta-adrenoceptors. Trends Pharmacol. Sci. 1990, 11, 229–230. [Google Scholar] [CrossRef]
- Edmondson, S.D.; Zhu, C.; Kar, N.F.; Di Salvo, J.; Nagabukuro, H.; Sacre-Salem, B.; Dingley, K.; Berger, R.; Goble, S.D.; Morriello, G.; et al. Discovery of Vibegron: A Potent and Selective beta3 Adrenergic Receptor Agonist for the Treatment of Overactive Bladder. J. Med. Chem. 2016, 59, 609–623. [Google Scholar] [CrossRef] [PubMed]
- Collins, S.; Daniel, K.W.; Petro, A.E.; Surwit, R.S. Strain-specific response to beta 3-adrenergic receptor agonist treatment of diet-induced obesity in mice. Endocrinology 1997, 138, 405–413. [Google Scholar] [CrossRef] [PubMed]
- Overstreet, D.H.; Stemmelin, J.; Griebel, G. Confirmation of antidepressant potential of the selective beta3 adrenoceptor agonist amibegron in an animal model of depression. Pharmacol. Biochem. Behav. 2008, 89, 623–626. [Google Scholar] [CrossRef] [PubMed]
- Gras, J. Mirabegron for the treatment of overactive bladder. Drugs Today 2012, 48, 25–32. [Google Scholar] [CrossRef] [PubMed]
- Myrbetriq. Available online: https://www.myrbetriqhcp.com/ (accessed on 10 May 2018).
- Van Gelderen, M.; Stolzel, M.; Meijer, J.; Kerbusch, V.; Collins, C.; Korstanje, C. An Exploratory Study in Healthy Male Subjects of the Mechanism of Mirabegron-Induced Cardiovascular Effects. J. Clin. Pharmacol. 2017, 57, 1534–1544. [Google Scholar] [CrossRef] [PubMed]
- Cramer, R.D.; Patterson, D.E.; Bunce, J.D. Comparative molecular field analysis (CoMFA). 1. Effect of shape on binding of steroids to carrier proteins. J. Am. Chem. Soc. 1988, 110, 5959–5967. [Google Scholar] [CrossRef] [PubMed]
- Klebe, G.; Abraham, U.; Mietzner, T. Molecular similarity indices in a comparative analysis (CoMSIA) of drug molecules to correlate and predict their biological activity. J. Med. Chem. 1994, 37, 4130–4146. [Google Scholar] [CrossRef] [PubMed]
- Telvekar, V.N.; Patel, D.J.; Jadhav, N.C.; Mishra, S.J. Three-dimensional QSAR and pharmacophore mapping of biphenyl benzoic acid derivatives as selective human β3-adrenergic receptor agonists. Med. Chem. Res. 2010, 19, 1174–1190. [Google Scholar] [CrossRef]
- Apablaza, G.; Montoya, L.; Morales-Verdejo, C.; Mellado, M.; Cuellar, M.; Lagos, C.F.; Soto-Delgado, J.; Chung, H.; Pessoa-Mahana, C.D.; Mella, J. 2D-QSAR and 3D-QSAR/CoMSIA Studies on a Series of (R)-2-((2-(1H-Indol-2-yl)ethyl)amino)-1-Phenylethan-1-ol with Human beta(3)-Adrenergic Activity. Molecules 2017, 22, 404. [Google Scholar] [CrossRef] [PubMed]
- Maruyama, T.; Onda, K.; Hayakawa, M.; Seki, N.; Takahashi, T.; Moritomo, H.; Suzuki, T.; Matsui, T.; Takasu, T.; Nagase, I.; et al. Synthesis and evaluation of novel phenoxypropanolamine derivatives containing acetanilides as potent and selective beta3-adrenergic receptor agonists. Bioorg. Med. Chem. 2009, 17, 3283–3294. [Google Scholar] [CrossRef] [PubMed]
- Maruyama, T.; Seki, N.; Onda, K.; Suzuki, T.; Kawazoe, S.; Hayakawa, M.; Matsui, T.; Takasu, T.; Ohta, M. Discovery of novel thiourea derivatives as potent and selective beta3-adrenergic receptor agonists. Bioorg. Med. Chem. 2009, 17, 5510–5519. [Google Scholar] [CrossRef] [PubMed]
- Golbraikh, A.; Tropsha, A. Beware of q2! J. Mol. Graph. Model. 2002, 20, 269–276. [Google Scholar] [CrossRef]
- Tropsha, A. Best Practices for QSAR Model Development, Validation, and Exploitation. Mol. Inform. 2010, 29, 476–488. [Google Scholar] [CrossRef] [PubMed]
- Rucker, C.; Rucker, G.; Meringer, M. y-Randomization and its variants in QSPR/QSAR. J. Chem. Inf. Model. 2007, 47, 2345–2357. [Google Scholar] [CrossRef] [PubMed]
- Roy, K.; Kar, S.; Ambure, P. On a simple approach for determining applicability domain of QSAR models. Chemometr. Intell. Lab. Syst. 2015, 145, 22–29. [Google Scholar] [CrossRef]
- Powell, M.J.D. An efficient method for finding the minimum of a function of several variables without calculating derivatives. Comput. J. 1964, 7, 155–162. [Google Scholar] [CrossRef]
- Clark, M.; Cramer, R.D.; Van Opdenbosch, N. Validation of the general purpose Tripos 5.2 force field. J. Comput. Chem. 1989, 10, 982–1012. [Google Scholar] [CrossRef]
- Roy, K.; Chakraborty, P.; Mitra, I.; Ojha, P.K.; Kar, S.; Das, R.N. Some case studies on application of “r(m)2” metrics for judging quality of quantitative structure-activity relationship predictions: Emphasis on scaling of response data. J. Comput. Chem. 2013, 34, 1071–1082. [Google Scholar] [CrossRef] [PubMed]
- Saxena, A.K.; Roy, K.K. Hierarchical virtual screening: Identification of potential high-affinity and selective beta(3)-adrenergic receptor agonists. SAR QSAR Environ. Res. 2012, 23, 389–407. [Google Scholar] [CrossRef] [PubMed]
Sample Availability: Not Available. |


| Model | q2 | N | SEP | SEE | r2ncv | F | r2 | Field Contributions | ||||
|---|---|---|---|---|---|---|---|---|---|---|---|---|
| S | E | H | D | A | ||||||||
| CoMFA-SE | 0.537 | 6 | 0.544 | 0.067 | 0.993 | 525.4 | 0.865 | 0.412 | 0.588 | |||
| CoMSIA-SE | 0.566 | 7 | 0.539 | 0.101 | 0.985 | 193.0 | 0.002 | 0.299 | 0.701 | |||
| CoMSIA-SEHA | 0.674 | 6 | 0.456 | 0.119 | 0.978 | 161.3 | 0.790 | 0.174 | 0.335 | 0.215 | 0.276 | |
| CoMSIA-SEA | 0.651 | 5 | 0.462 | 0.151 | 0.963 | 118.7 | 0.760 | 0.245 | 0.395 | 0.360 | ||
| CoMSIA-SEDA | 0.601 | 7 | 0.517 | 0.103 | 0.984 | 185.5 | 0.816 | 0.229 | 0.324 | 0.190 | 0.257 | |
| CoMSIA-SD | 0.551 | 6 | 0.536 | 0.217 | 0.926 | 46.2 | 0.347 | 0.470 | 0.530 | |||
| CoMSIA-SHD | 0.561 | 9 | 0.570 | 0.095 | 0.988 | 172.1 | 0.237 | 0.312 | 0.398 | 0.289 | ||
| CoMSIA-EHA | 0.598 | 6 | 0.507 | 0.136 | 0.971 | 123.0 | 0.765 | 0.427 | 0.299 | 0.274 | ||
| CoMSIA-EHDA | 0.508 | 7 | 0.574 | 0.111 | 0.982 | 160.3 | 0.716 | 0.375 | 0.261 | 0.156 | 0.208 | |
| CoMSIA-ALL | 0.669 | 6 | 0.460 | 0.101 | 0.984 | 225.9 | 0.918 | 0.165 | 0.279 | 0.181 | 0.159 | 0.215 |
| Condition | Parameters | Threshold Value | CoMFA | CoMSIA |
|---|---|---|---|---|
| 1 | >0.5 | 0.537 | 0.669 | |
| 2 | >0.6 | 0.865 | 0.918 | |
| 3a | Close to value of | 0.864 | 0.911 | |
| 3b | Close to value of | 0.834 | 0.885 | |
| 4a | 0.85 < < 1.15 | 1.002 | 0.996 | |
| 4b | 0.85 < k < 1.15 | 0.937 | 1.004 | |
| 5a | <0.1 | 0.001 | 0.007 | |
| 5b | <0.1 | 0.036 | 0.034 | |
| 6 | <0.3 | 0.031 | 0.027 | |
| 7 | >0.5 | 0.793 | 0.843 |
| CoMFA | CoMSIA | ||||
|---|---|---|---|---|---|
| Molecule | Experimental pEC50 | Predicted pEC50 | Residual | Predicted pEC50 | Residual |
| 1t | 6.538 | 6.263 | 0.27 | 6.435 | 0.10 |
| 2 | 6.745 | 6.760 | −0.02 | 6.743 | 0.00 |
| 3 | 6.553 | 6.532 | 0.02 | 6.552 | 0.00 |
| 4 | 6.602 | 6.610 | −0.01 | 6.596 | 0.01 |
| 5 | 6.482 | 6.494 | −0.01 | 6.496 | −0.01 |
| 6t | 6.553 | 6.811 | −0.26 | 6.444 | 0.11 |
| 7 | 5.602 | 5.559 | 0.04 | 5.635 | −0.03 |
| 8t | 5.018 | 4.969 | 0.05 | 4.646 | 0.37 |
| 9 | 6.187 | 6.205 | −0.02 | 6.197 | −0.01 |
| 10t | 6.745 | 6.761 | −0.02 | 6.651 | 0.09 |
| 11t | 6.854 | 7.136 | −0.28 | 6.830 | 0.02 |
| 12 | 6.886 | 6.893 | −0.01 | 6.965 | −0.08 |
| 13 | 6.569 | 6.667 | −0.10 | 6.721 | −0.15 |
| 14t | 6.721 | 6.707 | 0.01 | 6.826 | −0.10 |
| 15 | 6.585 | 6.601 | −0.02 | 6.569 | 0.02 |
| 16 | 7.208 | 7.144 | 0.06 | 6.953 | 0.26 |
| 17 | 6.553 | 6.530 | 0.02 | 6.632 | −0.08 |
| 18t,a | 6.301 | 5.853 | 0.45 | 6.601 | −0.30 |
| 19 | 5.699 | 5.636 | 0.06 | 5.613 | 0.09 |
| 20 | 4.921 | 5.049 | −0.13 | 4.908 | 0.01 |
| 21 | 3.886 | 3.794 | 0.09 | 3.894 | −0.01 |
| 22 | 5.032 | 5.157 | −0.13 | 4.980 | 0.05 |
| 23t,a | 5.721 | 6.157 | −0.44 | 5.908 | −0.19 |
| 24 | 6.357 | 6.362 | −0.01 | 6.549 | −0.19 |
| 25 | 5.854 | 5.818 | 0.04 | 5.979 | −0.13 |
| 26 | 6.328 | 6.331 | 0.00 | 6.345 | −0.02 |
| 27 | 6.292 | 6.269 | 0.02 | 6.303 | −0.01 |
| 28 | 6.398 | 6.288 | 0.11 | 6.404 | −0.01 |
| 29 | 6.569 | 6.604 | −0.04 | 6.605 | −0.04 |
| 30 | 6.553 | 6.601 | −0.05 | 6.534 | 0.02 |
| 31 | 6.469 | 6.539 | −0.07 | 6.403 | 0.07 |
| 32 | 7.000 | 6.984 | 0.02 | 6.964 | 0.04 |
| 33 | 7.000 | 6.921 | 0.08 | 6.904 | 0.10 |
| 34t | 6.569 | 6.244 | 0.32 | 6.539 | 0.03 |
| 35 | 6.796 | 6.835 | −0.04 | 6.710 | 0.09 |
| 36 | 6.699 | 6.696 | 0.00 | 6.572 | 0.13 |
| 37t | 6.638 | 6.503 | 0.14 | 6.448 | 0.19 |
| 38 | 6.638 | 6.570 | 0.07 | 6.601 | 0.04 |
| 39 | 6.770 | 6.781 | −0.01 | 6.902 | −0.13 |
| 40t,b | 6.495 | 6.678 | −0.18 | 6.910 | −0.42 |
| 41t,b | 6.187 | 6.390 | −0.20 | 6.718 | −0.53 |
| CoMFA | CoMSIA | |||
|---|---|---|---|---|
| Iteration | q2 | r2ncv | q2 | r2ncv |
| random_1 | −0.927 | 0.263 | −0.392 | 0.210 |
| random_2 | −0.111 | 0.321 | −0.075 | 0.204 |
| random_3 | −0.348 | 0.543 | −0.116 | 0.181 |
| random_4 | −0.315 | 0.427 | −0.036 | 0.259 |
| random_5 | −0.192 | 0.343 | −0.075 | 0.216 |
| random_6 | −0.192 | 0.332 | −0.171 | 0.154 |
| random_7 | −0.303 | 0.361 | −0.769 | 0.399 |
| random_8 | −0.051 | 0.345 | −0.004 | 0.283 |
| random_9 | −0.262 | 0.374 | −0.166 | 0.310 |
| random_10 | −0.001 | 0.339 | −0.092 | 0.175 |
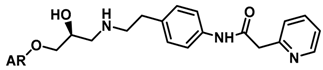
| Entry | Structure | Predicted pEC50 |
|---|---|---|
| 1x |  | 7.186 |
| 2x | 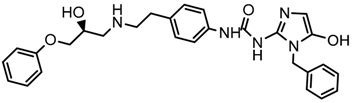 | 8.442 |
| 3x | 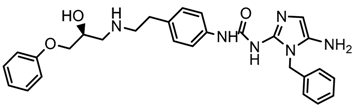 | 8.561 |
| 4x | 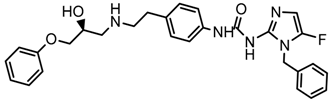 | 8.021 |
| 5x | 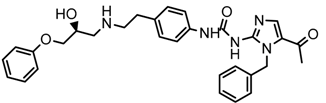 | 7.960 |
| 6x | 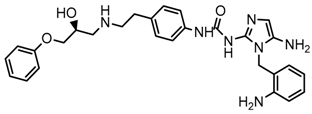 | 8.100 |
| 7x |  | 8.520 |
| 8x | 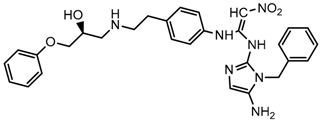 | 7.590 |
| 9x |  | 7.260 |
| 10x | 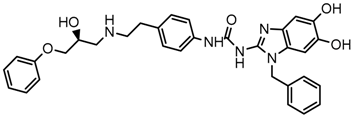 | 7.680 |
| 11x |  | 7.580 |
| 12x | 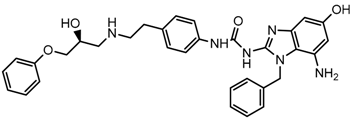 | 8.000 |
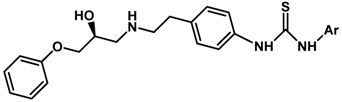
| Entry | Structure | EC50 (μM) | pEC50 | |
|---|---|---|---|---|
 | ||||
| 1 |  | 0.29 | 6.538 | |
| 2 |  | 0.18 | 6.745 | |
| 3 | 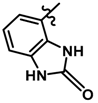 | 0.28 | 6.553 | |
| 4 |  | 0.25 | 6.602 | |
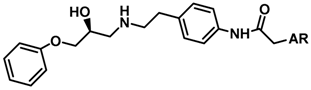 | ||||
| 5 |  | 0.33 | 6.481 | |
| 6 |  | 0.28 | 6.553 | |
| 7 | 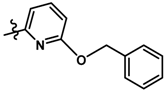 | 2.50 | 5.602 | |
| 8 |  | 9.60 | 5.018 | |
| 9 | 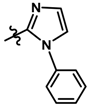 | 0.65 | 6.187 | |
| 10 |  | 0.18 | 6.745 | |
| 11 | 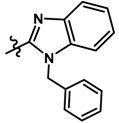 | 0.14 | 6.854 | |
| 12 |  | 0.13 | 6.886 | |
| 13 | 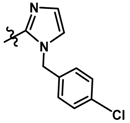 | 0.27 | 6.569 | |
| 14 | 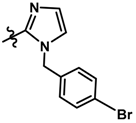 | 0.19 | 6.721 | |
| 15 |  | 0.26 | 6.585 | |
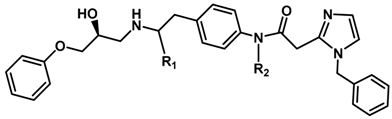 | ||||
| R1 | R2 | |||
| 16 | (S)-Me | H | 0.062 | 7.208 |
| 17 | H | Me | 0.28 | 6.553 |
| 18 | H | Propyl | 0.50 | 6.301 |
 | ||||
| 19 |  | 2.0 | 5.699 | |
| 20 |  | 12.0 | 4.921 | |
| 21 |  | 130 | 3.886 | |
| 22 |  | 9.30 | 5.032 | |
| 23 |  | 1.90 | 5.721 | |
| 24 | 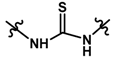 | 0.44 | 6.357 | |
 | 5.854 | |||
| 25 |  | 1.40 | 6.328 | |
| 26 |  | 0.47 | 6.292 | |
| 27 |  | 0.51 | 6.398 | |
| 28 |  | 0.40 | 5.854 | |
| 29 |  | 0.27 | 6.569 | |
| 30 |  | 0.28 | 6.553 | |
| 31 |  | 0.34 | 6.469 | |
| 32 |  | 0.10 | 7.000 | |
| 33 |  | 0.10 | 7.000 | |
| 34 |  | 0.27 | 6.569 | |
| 35 |  | 0.16 | 6.796 | |
| 36 |  | 0.20 | 6.699 | |
| 37 | 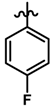 | 0.23 | 6.638 | |
| 38 |  | 0.23 | 6.638 | |
| 39 |  | 0.17 | 6.770 | |
| 40 | 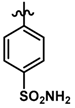 | 0.32 | 6.495 | |
| 41 |  | 0.65 | 6.187 | |
© 2018 by the authors. Licensee MDPI, Basel, Switzerland. This article is an open access article distributed under the terms and conditions of the Creative Commons Attribution (CC BY) license (http://creativecommons.org/licenses/by/4.0/).
Share and Cite
Lorca, M.; Morales-Verdejo, C.; Vásquez-Velásquez, D.; Andrades-Lagos, J.; Campanini-Salinas, J.; Soto-Delgado, J.; Recabarren-Gajardo, G.; Mella, J. Structure-Activity Relationships Based on 3D-QSAR CoMFA/CoMSIA and Design of Aryloxypropanol-Amine Agonists with Selectivity for the Human β3-Adrenergic Receptor and Anti-Obesity and Anti-Diabetic Profiles. Molecules 2018, 23, 1191. https://doi.org/10.3390/molecules23051191
Lorca M, Morales-Verdejo C, Vásquez-Velásquez D, Andrades-Lagos J, Campanini-Salinas J, Soto-Delgado J, Recabarren-Gajardo G, Mella J. Structure-Activity Relationships Based on 3D-QSAR CoMFA/CoMSIA and Design of Aryloxypropanol-Amine Agonists with Selectivity for the Human β3-Adrenergic Receptor and Anti-Obesity and Anti-Diabetic Profiles. Molecules. 2018; 23(5):1191. https://doi.org/10.3390/molecules23051191
Chicago/Turabian StyleLorca, Marcos, Cesar Morales-Verdejo, David Vásquez-Velásquez, Juan Andrades-Lagos, Javier Campanini-Salinas, Jorge Soto-Delgado, Gonzalo Recabarren-Gajardo, and Jaime Mella. 2018. "Structure-Activity Relationships Based on 3D-QSAR CoMFA/CoMSIA and Design of Aryloxypropanol-Amine Agonists with Selectivity for the Human β3-Adrenergic Receptor and Anti-Obesity and Anti-Diabetic Profiles" Molecules 23, no. 5: 1191. https://doi.org/10.3390/molecules23051191
APA StyleLorca, M., Morales-Verdejo, C., Vásquez-Velásquez, D., Andrades-Lagos, J., Campanini-Salinas, J., Soto-Delgado, J., Recabarren-Gajardo, G., & Mella, J. (2018). Structure-Activity Relationships Based on 3D-QSAR CoMFA/CoMSIA and Design of Aryloxypropanol-Amine Agonists with Selectivity for the Human β3-Adrenergic Receptor and Anti-Obesity and Anti-Diabetic Profiles. Molecules, 23(5), 1191. https://doi.org/10.3390/molecules23051191