Quality Evaluation of Apocyni Veneti Folium from Different Habitats and Commercial Herbs Based on Simultaneous Determination of Multiple Bioactive Constituents Combined with Multivariate Statistical Analysis

 , and
, and
Abstract
:1. Introduction
2. Results and Discussion
2.1. Optimization of Sample Preparation
2.2. Optimization of UFLC Conditions
2.3. Optimization of MS Conditions
2.4. Method Validation
2.5. Sample Determination
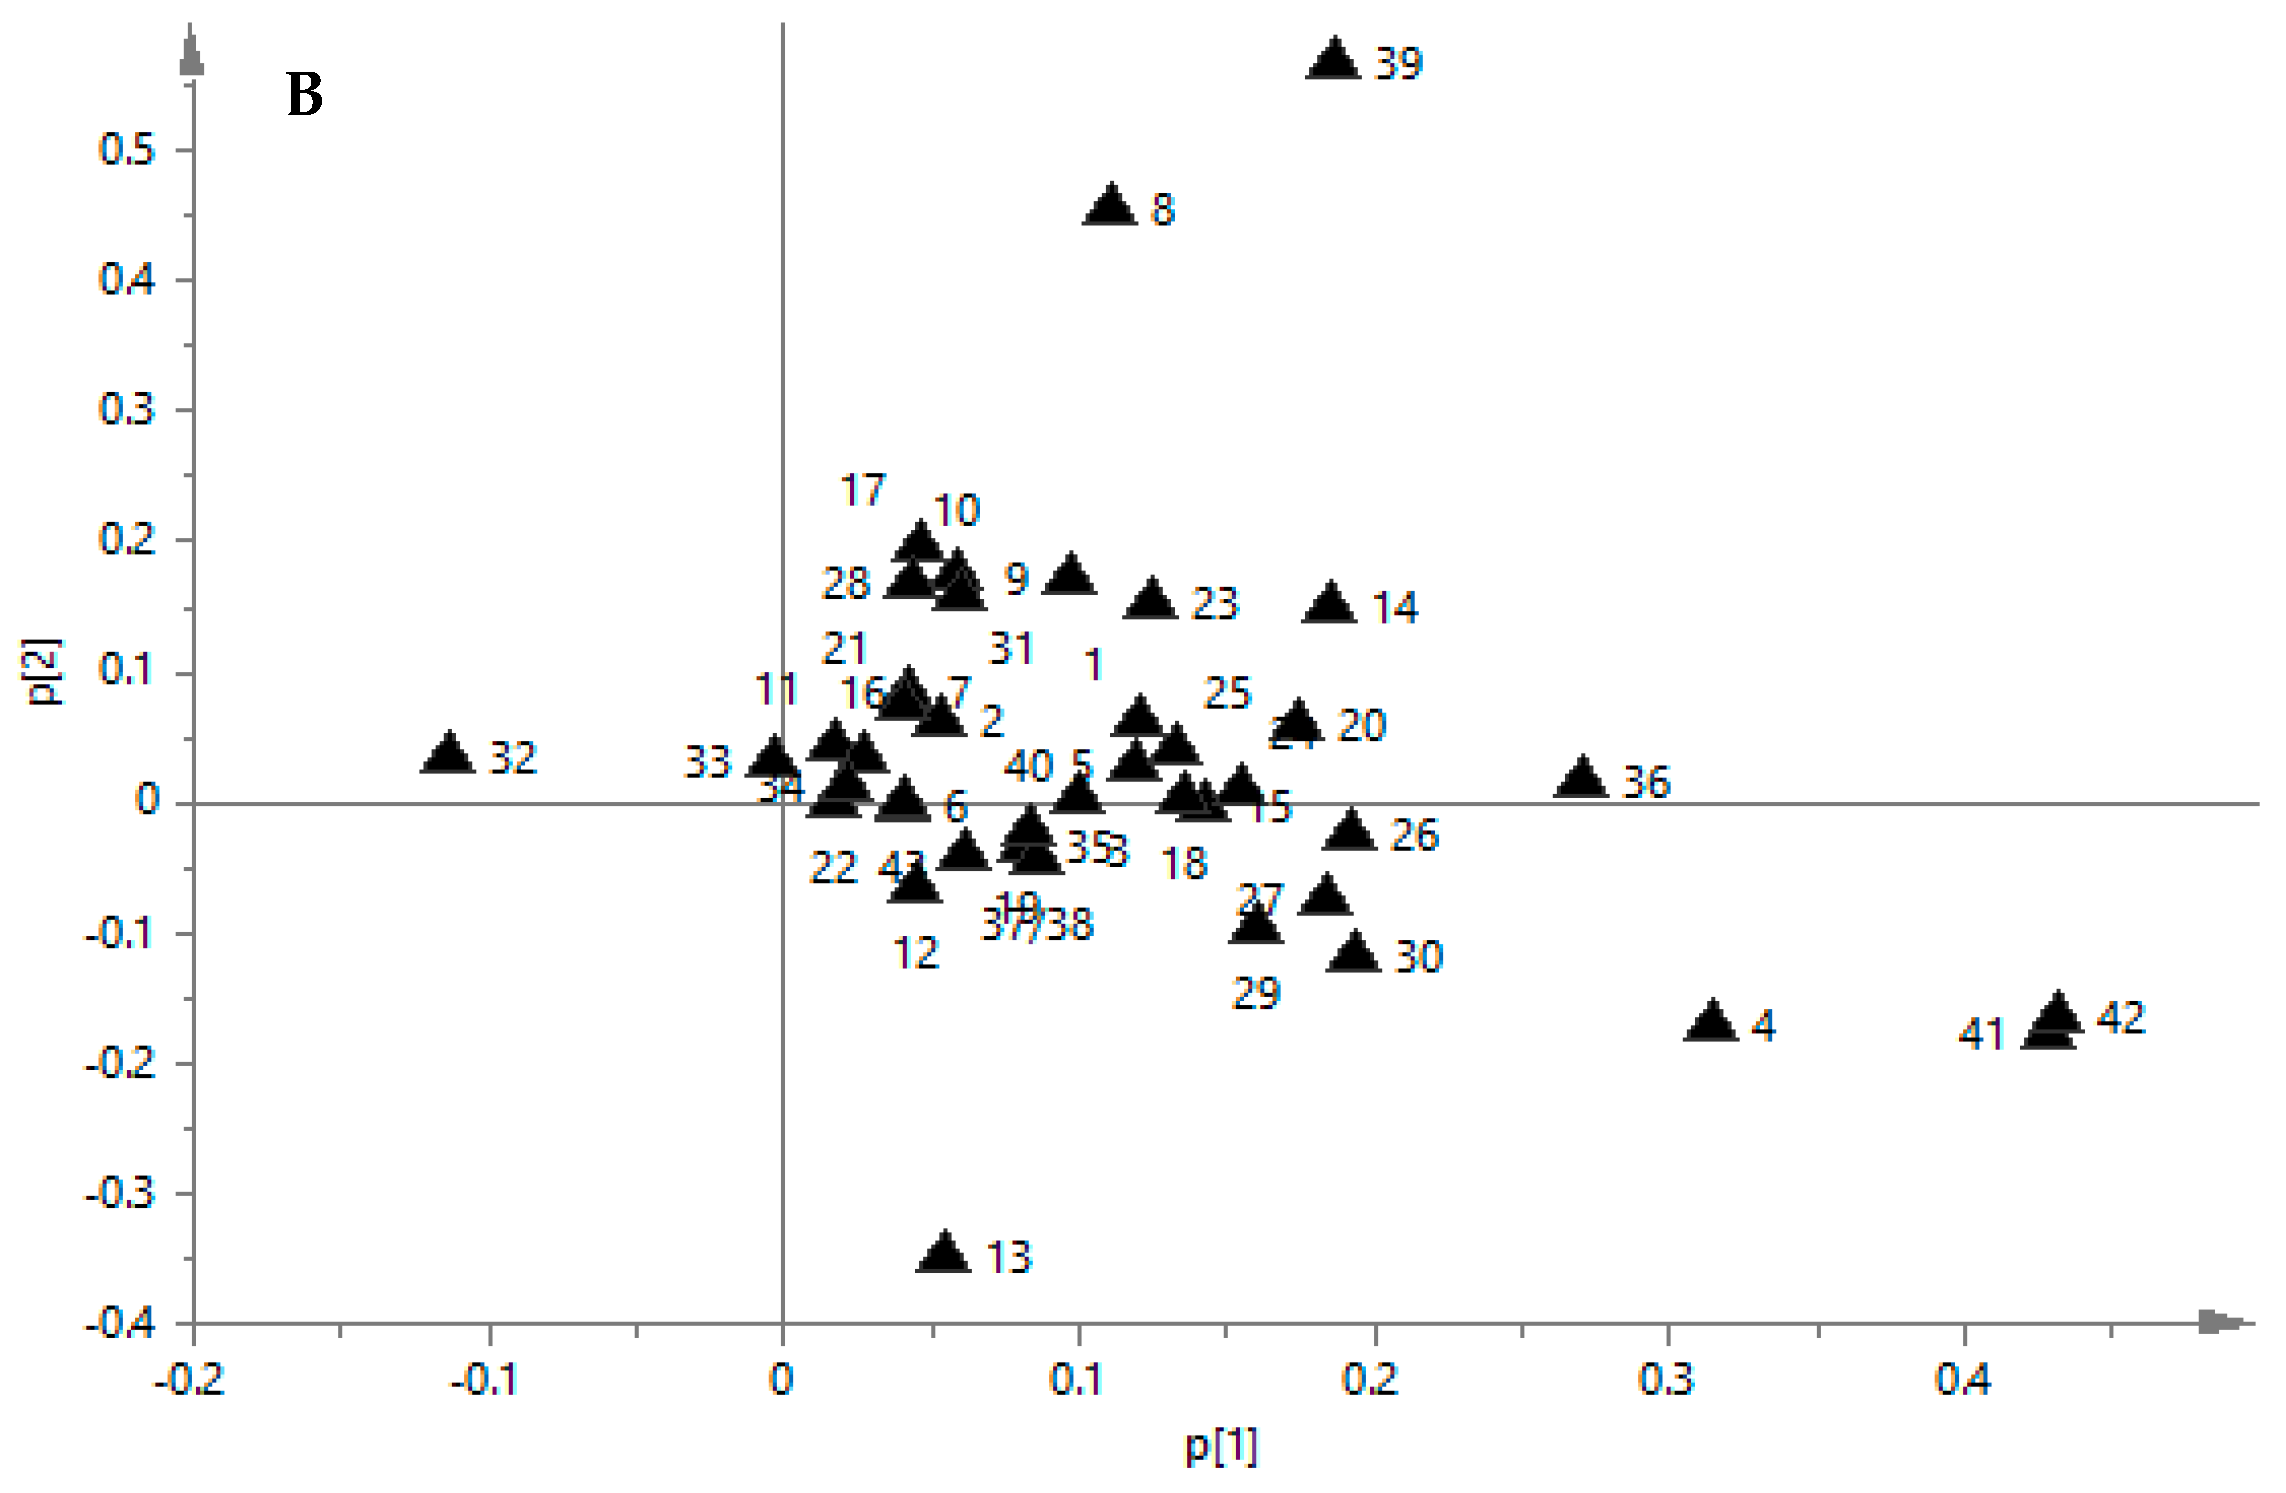
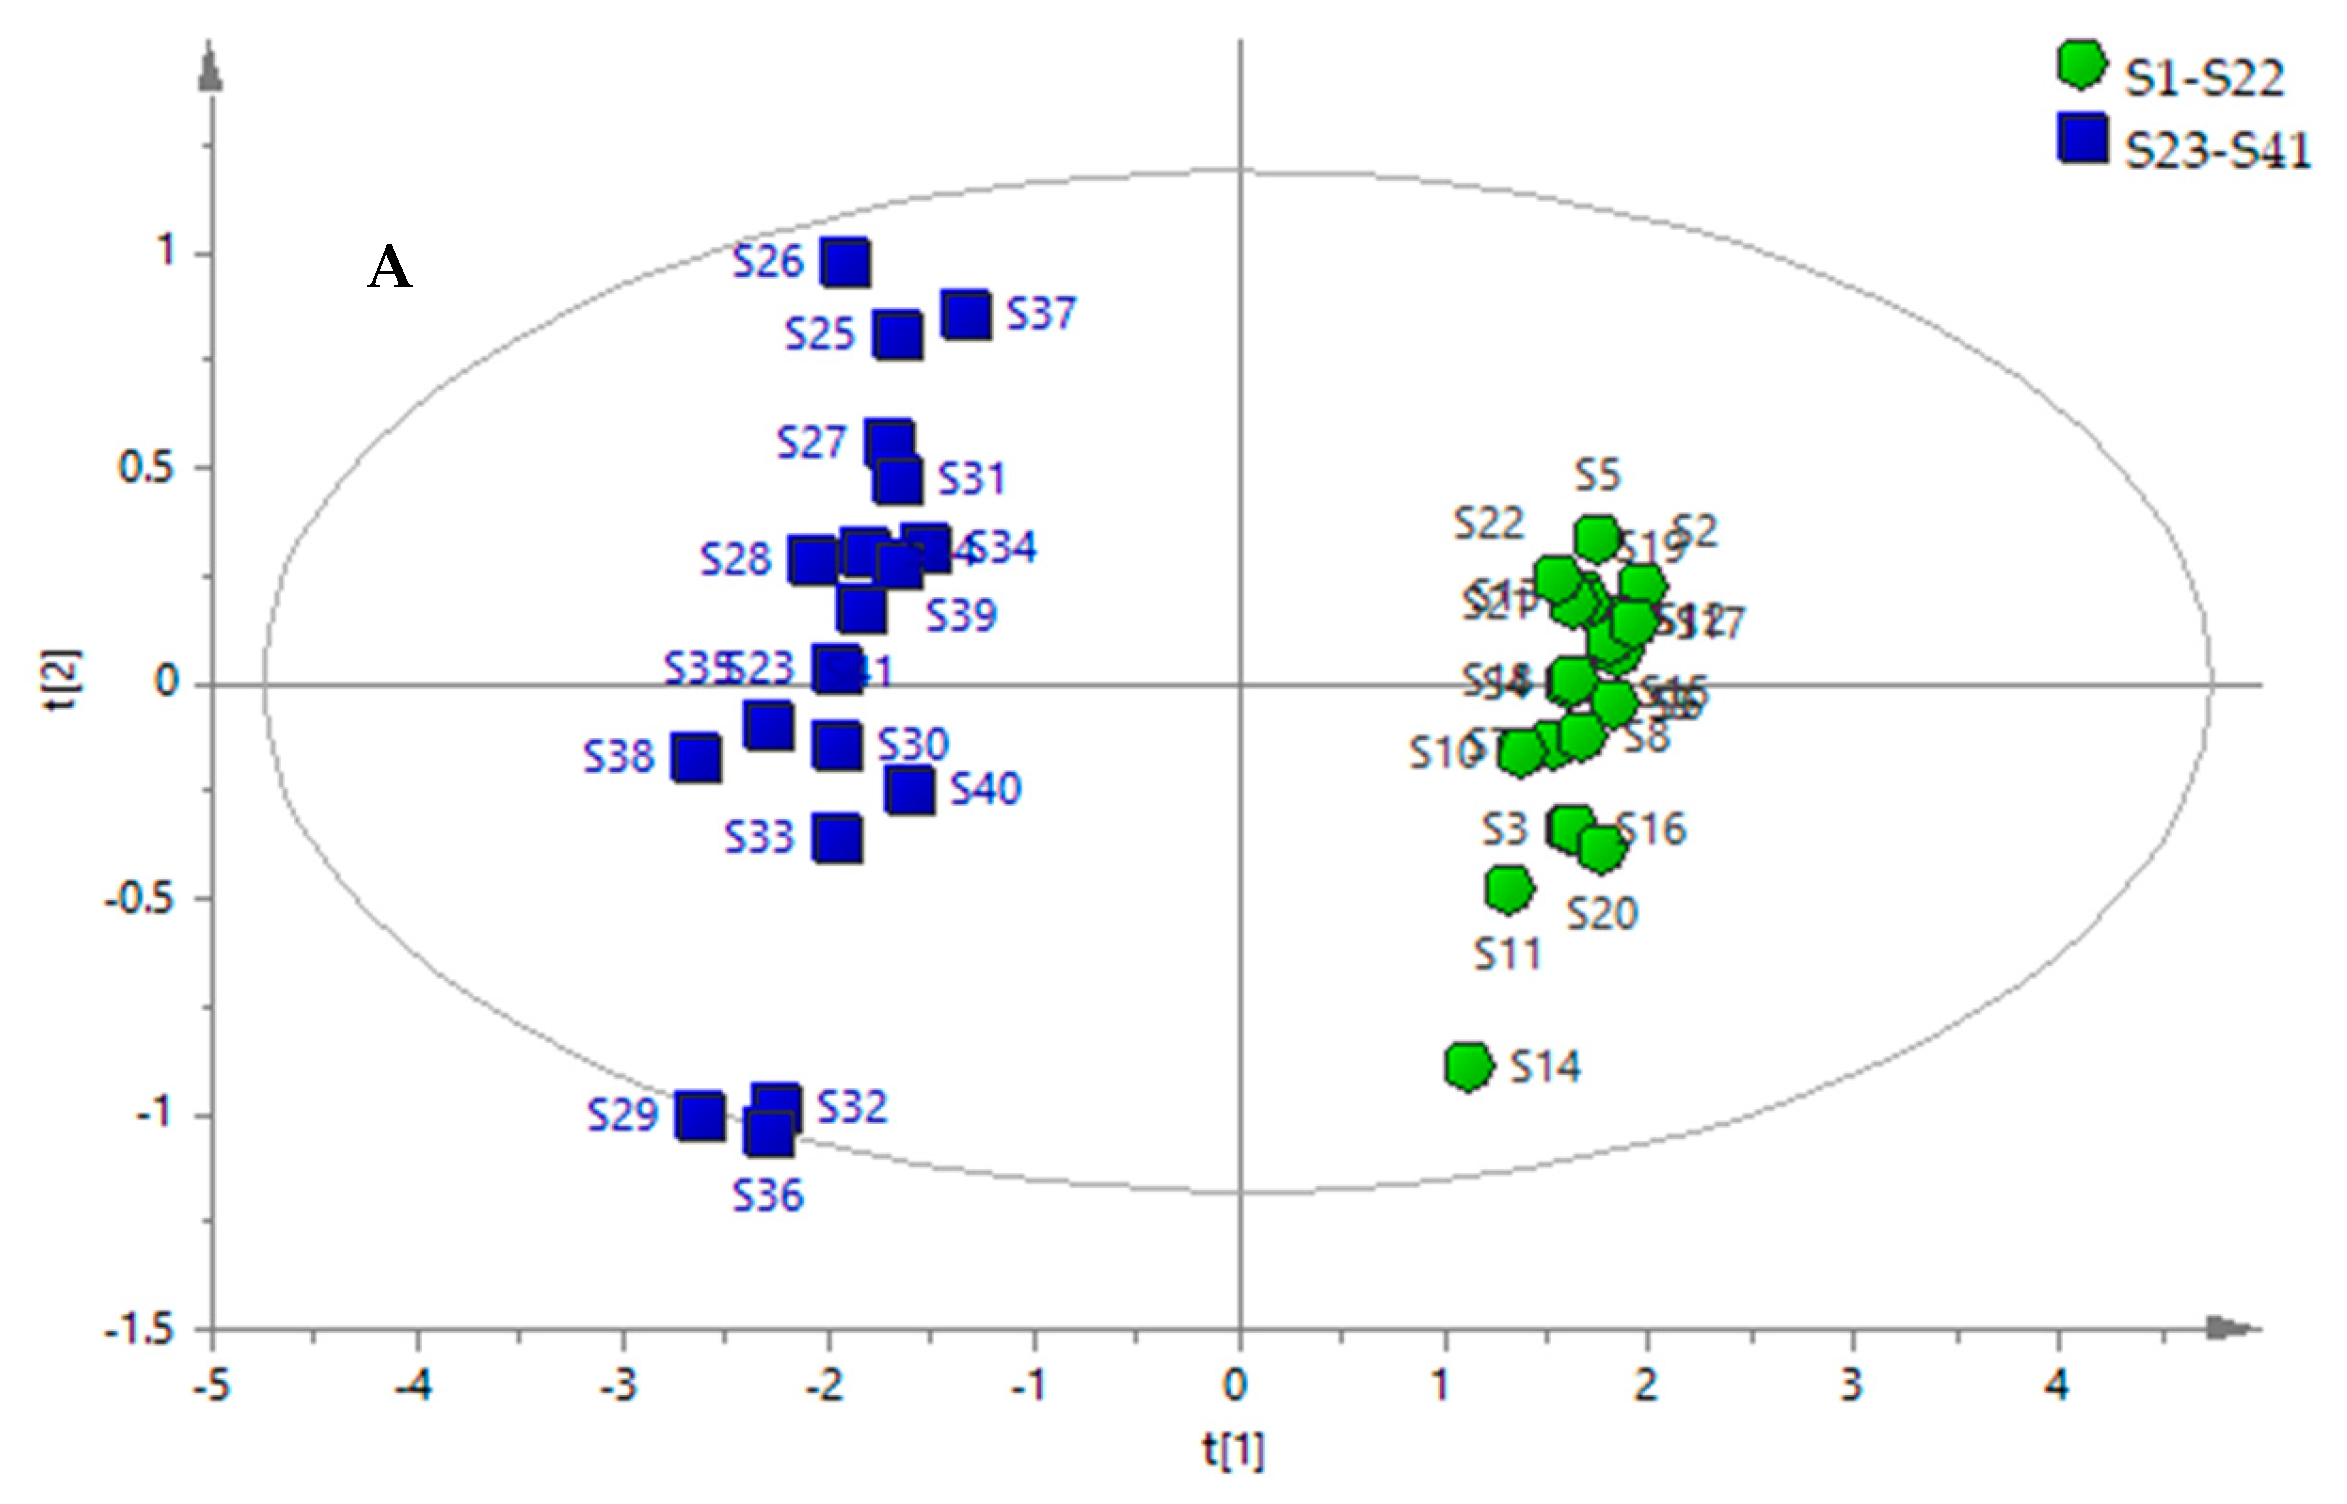
2.6. PCA of Samples
2.7. GRA of Samples
3. Materials and Methods
3.1. Chemicals and Reagents
3.2. Plant Materials
3.3. Preparation of Standard Solutions
3.4. Preparation of Sample Solutions
3.5. Chromatographic Conditions
3.6. Mass Spectrometric Conditions
3.7. Method Validation
3.7.1. Linearity, LOD, and LOQ
3.7.2. Precision, Repeatability, Stability, Accuracy, and Matrix Effect
3.8. Multivariate Statistical Analysis
4. Conclusions
Supplementary Materials
Acknowledgments
Author Contributions
Conflicts of Interest
References
- The Pharmacopoeia Committee of the Health Ministry of People’s Republic of China. Pharmacopoeia of People’s Republic of China; Guangdong Scientific Technologic Publisher: Guangzhou, China, 1995; p. 182. [Google Scholar]
- Chen, C.H.; Xu, H.; Liu, X.H.; Zou, L.S.; Wang, M.; Liu, Z.X.; Fu, X.S.; Zhao, H.; Yan, Y. Site-specific accumulation and dynamic change of flavonoids in Apocyni Veneti Folium. Microsc. Res. Tech. 2017, 80, 1315–1322. [Google Scholar] [CrossRef] [PubMed]
- Zhi, L.; Wang, C.Y.; Zhang, S.P.; Wang, J.L.; Zhang, X.M. Effect of total flavonoids in Apocynum venetum leaves on rat hypertension induced by high fat and high salt and its molecular mechanisms. Chin. Tradit. Herbal Drugs 2012, 43, 540–545. [Google Scholar]
- Zheng, M.Z.; Fan, J.Y.; Xiu, J.; Shi, D.F.; Liu, C.M. Studies on the antidepressant-lie effect and 5-HT mechanisms of flavonoids extracted from Apocynum venetum leaves. J. Liaoning Univ. Tradit. Chin. Med. 2012, 39, 935–937. [Google Scholar]
- Xiong, Q.B.; Fan, W.Z.; Tezuka, Y.; Adnyana, I.K.; Stampoulis, P.; Hattori, M.; Namba, T.; Kadota, S. Hepatoprotective effect of Apocynum venetum and its active constituents. Planta Med. 2000, 6, 127–133. [Google Scholar] [CrossRef] [PubMed]
- Grundmann, O.; Nakajima, J.I.; Seo, S.; Butterweck, V. Anti-anxiety effects of Apocynum venetum L. in the elevated plus maze test. J. Ethnopharmacol. 2007, 110, 406–411. [Google Scholar] [CrossRef] [PubMed]
- Irie, K.; Sato, T.; Tanaka, I.; Nakajima, J.I.; Kawaguchi, M.; Himi, T. Cardiotonic effect of Apocynum venetum L. extracts on isolated guinea pig atrium. J. Natl. Med. 2009, 63, 111–116. [Google Scholar] [CrossRef] [PubMed]
- Yokozawa, T.; Kashiwada, Y.; Hattori, M.; Chung, H.Y. Study on the components of luobuma with peroxynitrite-scavenging activity. Biol. Pharm. Bull. 2002, 25, 748–752. [Google Scholar] [CrossRef] [PubMed]
- Qian, Z.N.; Song, L.H.; Gu, Z.L.; Chen, B.Q.; Zhang, K.P.; Li, H.Z.; Peng, Y.K. An experimental observation on the diuretic effect of extract of luobuma ( Apocynum venetum ) leaves. Chin. J. Chin. Mater. Med. 1988, 13, 44–46. [Google Scholar]
- Xie, W.Y.; Zhan, X.Y.; Wang, T.; Hu, J.J. Botany, traditional uses, phytochemistry and pharmacology of Apocynum venetum L. (Luobuma): A review. J. Ethnopharmacol. 2012, 141, 1–8. [Google Scholar] [CrossRef] [PubMed]
- Thevs, N.; Zerbe, S.; Kyosev, Y.; Rozi, A.; Tang, B.; Abdusalih, N.; Novitskiy, Z. Apocynum venetum L. and Apocynum pictum Schrenk (Apocynaceae) as multi-functional and multi-service plant species in Central Asia: a review on biology, ecology, and utilization. J. Appl. Bot. Food Qual. 2012, 85, 159–167. [Google Scholar]
- Zhang, Y.C.; Liu, C.M.; Zhang, Z.K.; Wang, J.; Wu, G.M.; Li, S.N. Comprehensive separation and identification of chemical constituents from Apocynum venetum leaves by high-performance counter-current chromatography and high performance liquid chromatography coupled with mass spectrometry. J. Chromatogr. B 2010, 878, 3149–3155. [Google Scholar] [CrossRef] [PubMed]
- Zhang, Y.C.; Liu, C.M.; Qi, Y.J.; Zhang, Z.K. Comparison of the constituents of Apocynum venetum and acidified Apocynum venetum by liquid chromatography–UV diode array detection–electrospray ionisation mass spectrometry. Med. Chem. Res. 2012, 21, 1684–1691. [Google Scholar] [CrossRef]
- Cao, J.G.; Xia, X.; Chen, X.F.; Xiao, J.B.; Wang, Q.X. Characterization of flavonoids from Dryopteris erythrosora and evaluation of their antioxidant, anticancer and acetylcholinesterase inhibition activities. Food Chem. Toxicol. 2013, 51, 242–250. [Google Scholar] [CrossRef] [PubMed]
- Rao, Y.K.; Fang, S.H.; Tzeng, Y.M. Anti-inflammatory activities of flavonoids isolated from Cayaponiapulcherrima. J. Ethnopharmacol. 2005, 100, 249–253. [Google Scholar] [CrossRef] [PubMed]
- Li, Y.L.; But, P.; Ooi, V. Antiviral activity and mode of action of caffeoylquinic acids from Schefflera heptaphylla (L.) Frodin. Antiviral Res. 2005, 68, 1–9. [Google Scholar] [CrossRef] [PubMed]
- Xiong, J.H.; Li, S.C.; Wang, W.J.; Hong, Y.P.; Tang, K.J.; Luo, Q.S. Screening and identification of the antibacterial bioactive compounds from Lonicera japonica Thunb. leaves. Food Chem. 2013, 138, 327–333. [Google Scholar] [CrossRef] [PubMed]
- Anfossi, G.; Russo, I.; Massucco, P.; Mattiello, L.; Cavalot, F.; Trovati, M. Ns-acetyl-L-cysteine exerts direct anti-aggregating effect on human platelets. Eur. J. Clin. Investig. 2001, 31, 452. [Google Scholar] [CrossRef]
- Wang, H.Q.; Duan, J.A.; Guo, S.S.; Qian, D.W.; Shang, E.X. Development and validation of a hydrophilic interaction ultra-high-performance liquid chromatography with triple quadrupole MS/MS for the absolute and relative quantification of amino acids in Sophora alopecuroides L. J. Sep. Sci. 2013, 36, 2244–2252. [Google Scholar] [CrossRef] [PubMed]
- Ferraro, V.; Sousa, S.C.; Marques, C.; Calhau, C.; Pintado, M.E. Antioxidant and Anti-hypertensive Activity, and Cytotoxicity of Amino Acids-Enriched Salt Recovered from Codfish (Gadus morhua L.) Salting Wastewater. Waste Biomass Valor. 2015, 6, 1115–1124. [Google Scholar] [CrossRef]
- Priyakumar, U.D., Jr.; MacKerell, A.D., Jr. Role of the Adenine Ligand on the Stabilization of the Secondary and Tertiary Interactions in the Adenine Riboswitch. J. Mol. Biol. 2010, 39, 1422–1438. [Google Scholar] [CrossRef] [PubMed]
- An, H.J.; Wang, H.; Lan, Y.X.; Hashi, Y.; Chen, S.Z. Simultaneous qualitative and quantitative analysis of phenolic acids and flavonoids for the quality control of Apocynum venetum L. leaves by HPLC–DAD–ESI–IT–TOF–MS and HPLC–DAD. J. Pharmaceut. Biomed. 2013, 85, 295–304. [Google Scholar] [CrossRef] [PubMed]
- Shi, J.Y.; Li, G.L.; Zhang, R.; Zheng, J.; Suo, Y.R.; You, J.M.; Liu, Y.J. A validated HPLC-DAD-MS method for identifying and determining the bioactive components of two kinds of luobuma. J. Liq. Chromatogr. Relat. Technol. 2011, 34, 537–547. [Google Scholar] [CrossRef]
- Song, C.H.; Zhang, C.Q.; Li, G.L.; Zhang, X.L.; Chen, G.; You, J.M. Highly selective and sensitive determination of free and total amino acids in Apocynum venetum L. (Luobuma tea) by a developed HPLC–FLD method coupled with pre-column fluorescent labelling. Int. J. Food Sci. Nutr. 2012, 63, 170–177. [Google Scholar]
- Cao, Y.; Zhang, X.; Fang, Y.; Ye, J. Determination of active ingredients of Apocynum venetum by capillary electrophoresis with electrochemical detection. Microchim. Acta 2001, 137, 57–62. [Google Scholar] [CrossRef]
- Munro, N.; Huang, Z.; Finegold, D.; Landers, J. Indirect fluorescence detection of amino acids on electrophoretic microchips. Anal. Chem. 2000, 72, 2765–2773. [Google Scholar] [CrossRef] [PubMed]
- Tan, Z.J.; Yi, Y.J.; Wang, H.Y.; Zhou, W.L.; Wang, C.Y. Extraction, Preconcentration and Isolation of Flavonoids from Apocynum venetum L. Leaves Using Ionic Liquid-Based Ultrasonic-Assisted Extraction Coupled with an Aqueous Biphasic System. Molecules 2016, 21, 262. [Google Scholar] [CrossRef] [PubMed]
- Guo, S.; Duan, J.A.; Tang, Y.P.; Qian, T.F.; Zhao, J.L.; Qian, D.W.; Su, S.L.; Shang, E. Simultaneous qualitative and quantitative analysis of triterpenic acids, saponins and flavonoids in the leaves of two Ziziphus species by HPLC–PDA–MS/ELSD. J. Pharmaceut. Biomed. 2011, 56, 264–270. [Google Scholar] [CrossRef] [PubMed]
- Zhou, C.L.; Gao, G.H.; Zhou, X.M.; Yu, D.; Chen, X.H.; Bi, K.S. Simultaneous determination of five active components in traditional Chinese medicine Apocynum venetum L. by RP-HPLC–DAD. J. Med. Plants Res. 2011, 5, 735–742. [Google Scholar]
- Zhang, Y.C.; Liu, C.M.; Zhang, Z.K.; Qi, Y.J.; Wu, G.M.; Li, S.N. Fast differentiation of Apocynum venetum with related species by UPLC/MS and UPLC/SPE/NMR. Med. Chem. Res. 2012, 21, 1077–1083. [Google Scholar] [CrossRef]
- Fifield, F.W.; Haines, P.J. Environmental Analytical Chemistry; Blackwell Publishing: Hoboken, NJ, USA, 2000; pp. 4–5. [Google Scholar]
- Aurelio, M.; Arruda, Z. Trends in Sample Preparation; Nova Publishers: Hauppauge, NY, USA, 2006; pp. 15–18. [Google Scholar]
- Xu, X.; Xu, S.; Zhang, Y.; Zhang, H.; Liu, M.N.; Liu, H.; Gao, Y.; Xue, X.; Xiong, H.; Lin, R.; et al. Chemical Comparison of Two Drying Methods of Mountain Cultivated Ginseng by UPLC-QTOF-MS/MS and Multivariate Statistical Analysis. Molecules 2017, 22, 717. [Google Scholar] [CrossRef] [PubMed]
Sample Availability: Samples of the compounds are available from the authors. |


| No. | Constituents | tR (min) | [M + H]+ m/z | [M − H]− m/z | Precursor Ion | Product Ion | FV (V) | CE (eV) |
|---|---|---|---|---|---|---|---|---|
| 1 | Glutamic acid | 2.02 | 147.13 | - | 147.08 | 83.92 | 83 | 14 |
| 2 | Histidine | 2.05 | 155 | - | 156.08 | 110.03 | 95 | 16 |
| 3 | Arginine | 2.06 | 174.2 | - | 175.12 | 70.02 | 88 | 18 |
| 4 | Asparagine | 2.15 | 133.06 | - | 133.06 | 73.87 | 65 | 14 |
| 5 | Serine | 2.18 | 105.09 | - | 106.05 | 59.99 | 67 | 8 |
| 6 | Lysine | 2.19 | 146.19 | - | 147.11 | 83.91 | 66 | 14 |
| 7 | Glutamine | 2.23 | 147.08 | - | 148.06 | 83.91 | 58 | 14 |
| 8 | Cysteine | 2.29 | 122.15 | - | 122.03 | 75.93 | 85 | 17 |
| 9 | Cytidine | 2.41 | 243.22 | - | 244.09 | 112 | 61 | 10 |
| 10 | Guanine | 2.51 | 151.12 | - | 152 | 135 | 62 | 15 |
| 11 | 2′-deoxycytidine | 2.57 | 227.3 | - | 228.2 | 112.05 | 76 | 13 |
| 12 | Uracil | 2.96 | 112.09 | - | 113.04 | 70 | 103 | 13 |
| 13 | Hypoxanthine | 3.2 | 136.11 | - | 137.05 | 137.05 | 51 | 24 |
| 14 | Tyrosine | 3.81 | 182.1 | - | 182.16 | 136.08 | 46 | 17 |
| 15 | Isoleucine | 3.99 | 131.18 | - | 132.1 | 86.05 | 98 | 10 |
| 16 | Guanosine | 4.1 | 283.24 | - | 284.3 | 152 | 62 | 15 |
| 17 | Inosine | 4.17 | 268.23 | - | 269 | 137.07 | 46 | 15 |
| 18 | 2′-deoxyguanosine | 4.36 | 267.2 | - | 268.1 | 152.1 | 61 | 15 |
| 19 | Fumaric acid | 4.51 | - | 115 | 114.8 | 70.8 | −50 | −10 |
| 20 | Leucine | 4.6 | 131.18 | - | 132.1 | 86.05 | 98 | 10 |
| 21 | Gallic acid | 5.28 | - | 169.01 | 168.9 | 125 | −120 | −18 |
| 22 | Thymidine | 6.05 | 242.23 | - | 243.1 | 127.07 | 61 | 13 |
| 23 | Phenylalanine | 6.47 | 165.19 | - | 166.1 | 120.05 | 56 | 14 |
| 24 | Neochlorogenic acid | 8.28 | - | 353.09 | 305.01 | 125 | −95 | −20 |
| 25 | Tryptophan | 9 | 205.09 | - | 205.03 | 188.1 | 61 | 13 |
| 26 | Epigallocatechin | 9.18 | - | 305.07 | 305.1 | 125 | −55 | −25 |
| 27 | Chlorogenic acid | 10.14 | - | 353.09 | 305.01 | 125 | −95 | −20 |
| 28 | Catechin | 10.26 | - | 289.07 | 289 | 244.8 | −135 | −20 |
| 29 | Cryptochlorogenic acid | 10.44 | - | 353.09 | 305.01 | 125 | −95 | −20 |
| 30 | Caffeic acid | 11.8 | - | 179.03 | 178.97 | 134.6 | −125 | −20 |
| 31 | Epicatechin | 11.84 | - | 289.07 | 289 | 244.8 | −135 | −20 |
| 32 | Quercetin-3-O-sophoroside | 12.6 | 627.17 | - | 626.9 | 303 | 111 | 23 |
| 33 | Quercitrin | 12.99 | - | 447.09 | 447 | 301 | −165 | −30 |
| 34 | Avicularin | 13 | 435.09 | - | 435 | 303 | 51 | 15 |
| 35 | Astragalin | 13.01 | - | 447.09 | 447.1 | 283.9 | −100 | −36 |
| 36 | Trifolin | 13.02 | 449.11 | - | 449 | 287 | 46 | 21 |
| 37 | Hyperoside | 13.04 | - | 463.09 | 463.003 | 299.9 | −160 | −36 |
| 38 | Isoquercitrin | 13.04 | - | 463.09 | 463.015 | 300.0 | −180 | −36 |
| 39 | Kaempferol-3-O-rutinoside | 13.06 | 595.17 | - | 595 | 287.2 | 36 | 25 |
| 40 | Rutin | 13.09 | - | 609.15 | 609.06 | 300 | −245 | −46 |
| 41 | Amentoflavone | 13.44 | 539.1 | - | 539 | 377 | 251 | 57 |
| 42 | Apigenin | 13.6 | - | 269.05 | 268.8 | 116.9 | −129 | −40 |
| 43 | Gallocatechin | 13.7 | - | 305.07 | 305.1 | 125 | −55 | −25 |
| Analytes | Calibration Curves | r2 | Linear Range ng/mL | LOD | LOQ | Precision (% RSD, n = 6) | Repeatability (% RSD, n = 6) | Stability (% RSD, n = 6) | Recovery% | Matrix Effect | ||||||
|---|---|---|---|---|---|---|---|---|---|---|---|---|---|---|---|---|
| Intra-day | Inter-day | Low | Medium | High | ||||||||||||
| Mean | RSD | Mean | RSD | Mean | RSD | |||||||||||
| Glutamic acid | Y = 642x – 21,200 | 0.9999 | 5.02–5020 | 0.5 | 1.67 | 1.85 | 2.31 | 2.45 | 2.34 | 98.99 | 3.95 | 96.09 | 3.33 | 100.79 | 2.39 | 1.04 |
| Histidine | Y = 1920x – 31,400 | 0.9999 | 3.22–3220 | 0.32 | 1.07 | 2.71 | 3.45 | 4.37 | 3.25 | 102.23 | 3.67 | 101.85 | 3.8 | 97.32 | 2.61 | 1.06 |
| Arginine | Y = 654x + 20,300 | 0.9993 | 1.93–3860 | 1.93 | 6.43 | 2.12 | 2.56 | 2.56 | 2.99 | 99 | 2.29 | 102.26 | 2.99 | 98.92 | 3.45 | 1.00 |
| Asparagine | Y = 130x + 35,400 | 0.9992 | 21.37–21,368 | 2.14 | 7.12 | 1.23 | 1.13 | 3.24 | 4.78 | 98.41 | 2.54 | 102.81 | 4 | 97.79 | 3.04 | 0.98 |
| Serine | Y = 143x + 15,500 | 0.9995 | 5.72–5720 | 5.72 | 19.07 | 0.75 | 2.39 | 2.47 | 1.62 | 99.27 | 4.71 | 96.2 | 2.27 | 98.24 | 3.64 | 1.03 |
| Lysine | Y = 1800x + 358,000 | 0.9991 | 4.58–4580 | 0.46 | 1.53 | 3.55 | 2.53 | 2.8 | 3.41 | 99.06 | 4.18 | 99.08 | 2.02 | 104 | 3.64 | 1.00 |
| Glutamine | Y = 382x + 36,200 | 0.9993 | 12.31–12,308 | 1.23 | 4.1 | 1.24 | 2.36 | 3.1 | 2.47 | 102.56 | 2.46 | 102.43 | 3.09 | 96.27 | 1.82 | 1.01 |
| Cysteine | Y = 3.04x + 949 | 0.9999 | 3.31–3310 | 0.33 | 1.1 | 2.14 | 2.27 | 3.35 | 1.21 | 103.24 | 2.3 | 96.77 | 3.21 | 100.42 | 3.64 | 1.00 |
| Cytidine | Y = 1760x + 68,000 | 0.9991 | 7.00–7004 | 7 | 23.35 | 3.18 | 4.32 | 2.23 | 4.28 | 98.22 | 1.23 | 103.83 | 4 | 101.79 | 3.03 | 0.99 |
| Guanine | Y = 472x + 43,200 | 0.9994 | 2.57–2570 | 2.57 | 8.57 | 3.12 | 2.15 | 4.12 | 2.19 | 96.45 | 3.66 | 99.22 | 4.22 | 95.84 | 1.97 | 1.01 |
| 2′-deoxycytidine | Y = 3870x – 88,500 | 0.9992 | 2.38–2380 | 2.38 | 7.93 | 1.93 | 3.86 | 2.43 | 3.66 | 103.08 | 3.81 | 99.77 | 2.87 | 97.14 | 1.84 | 0.97 |
| Uracil | Y = 113x − 5400 | 0.9993 | 1.20–602 | 1.2 | 4.01 | 2.67 | 1.2 | 3.05 | 2.76 | 99.48 | 2 | 97.99 | 2 | 99.14 | 1.9 | 1.01 |
| Hypoxanthine | Y = 3160x + 8150 | 0.9994 | 1.31–654 | 1.31 | 4.36 | 4.6 | 2.67 | 3.23 | 2.12 | 95.12 | 2.89 | 98.22 | 2.01 | 94.31 | 1.71 | 1.03 |
| Tyrosine | Y = 959x + 51,900 | 0.9992 | 3.05–3053 | 0.31 | 1.02 | 4.14 | 3.79 | 1.77 | 3.08 | 100.09 | 2.31 | 98.28 | 3.2 | 98.12 | 2.72 | 1.02 |
| Isoleucine | Y = 1980x + 52,800 | 0.9992 | 7.92–7918 | 0.79 | 2.64 | 4.6 | 3.88 | 3 | 3.09 | 97.8 | 3.63 | 103.2 | 2.74 | 96.67 | 2.62 | 1.04 |
| Guanosine | Y = 1790x − 71,200 | 0.9998 | 1.16–579 | 1.16 | 3.86 | 3.96 | 3.23 | 2.91 | 4.67 | 97.23 | 2.95 | 98.2 | 2.81 | 94.1 | 2.8 | 1.02 |
| Inosine | Y = 2410x − 39,800 | 0.9998 | 4.04–4040 | 4.04 | 13.47 | 2.13 | 4.3 | 2.44 | 2.1 | 98.55 | 1.89 | 95.98 | 1.98 | 96.3 | 2.55 | 0.95 |
| 2′-deoxyguanosine | Y = 2500x – 31,200 | 0.9991 | 6.94–6939 | 6.94 | 23.13 | 3.71 | 1.59 | 4.11 | 3.45 | 102.49 | 2.11 | 99.27 | 2.17 | 97.26 | 4.23 | 1.00 |
| Fumaric acid | Y = 106x + 35,600 | 0.9998 | 4.44–8880 | 4.44 | 14.8 | 1.85 | 1.43 | 3.2 | 1.23 | 102.13 | 3.99 | 98.12 | 4.36 | 97.9 | 2.52 | 0.99 |
| Leucine | Y = 1800x + 358,000 | 0.9991 | 5.68–5680 | 5.68 | 18.93 | 2.34 | 3.41 | 3.45 | 3.12 | 100.01 | 4.29 | 100.2 | 4 | 94.32 | 1.83 | 1.01 |
| Gallic acid | Y = 661x – 69,900 | 0.9991 | 1.49–1488 | 1.49 | 4.96 | 2.1 | 3.41 | 3.74 | 1.87 | 96.98 | 2.84 | 101.87 | 2.54 | 97.93 | 1.64 | 0.96 |
| Thymidine | Y = 708x – 32,500 | 0.9996 | 3.50–1750 | 3.5 | 11.67 | 2.83 | 4.37 | 2.89 | 4.15 | 97.09 | 4.76 | 100.9 | 4.65 | 102 | 3.37 | 1.03 |
| Phenylalanine | Y = 1480x + 120,000 | 0.9997 | 3.21–3210 | 0.32 | 1.07 | 2.21 | 3.42 | 2.68 | 4.11 | 101.32 | 2.3 | 100.7 | 3.71 | 98.93 | 2.31 | 1.00 |
| Neochlorogenic acid | Y = 516x + 104,000 | 0.9996 | 63.59–254,359 | 31.79 | 105.98 | 2.23 | 2.63 | 1.05 | 1.41 | 99.65 | 1.53 | 103.21 | 3.3 | 101.2 | 3.65 | 1.00 |
| Tryptophan | Y = 1600x + 518,000 | 0.9996 | 17.18–17,184 | 1.72 | 5.73 | 2.68 | 2.76 | 3.07 | 2.54 | 98.85 | 2.85 | 99.9 | 3.7 | 98.99 | 2.81 | 1.01 |
| Epigallocatechin | Y = 253x – 12,900 | 0.9993 | 48.60–48,600 | 24.3 | 81 | 1.74 | 1.53 | 1.45 | 2.47 | 97.49 | 1.42 | 95.61 | 1.18 | 97.15 | 0.86 | 1.02 |
| Chlorogenic acid | Y = 678x + 650,000 | 0.9993 | 45.20–45,200 | 4.52 | 15.07 | 2.88 | 1.85 | 2.02 | 2.31 | 97.15 | 1.69 | 96.21 | 2.32 | 96.07 | 3.96 | 1.01 |
| Catechin | Y = 142x + 9680 | 0.9991 | 6.93–6930 | 6.93 | 23.1 | 1.72 | 2.39 | 2.07 | 3.64 | 96.24 | 3.61 | 102.08 | 2.35 | 100.22 | 3.11 | 0.96 |
| Cryptochlorogenic acid | Y = 240x – 102,000 | 0.9997 | 23.80–95,200 | 2.38 | 7.93 | 2.63 | 1.33 | 3.57 | 2.32 | 96.91 | 2.39 | 99.86 | 3.45 | 96.29 | 2.72 | 1.04 |
| Caffeic acid | Y = 824x + 184,000 | 0.9997 | 16.25–16,250 | 1.63 | 5.42 | 2.47 | 1.57 | 2.91 | 0.95 | 100.08 | 4.6 | 104.3 | 2.99 | 101.4 | 2.06 | 1.03 |
| Epicatechin | Y = 163x + 129,000 | 0.9996 | 13.43–26,864 | 6.72 | 22.39 | 2.46 | 1.67 | 2.24 | 1.62 | 96.01 | 1.44 | 103.43 | 4.01 | 99.01 | 3.14 | 1.02 |
| Quercetin-3-O-sophoroside | Y = 825x – 109,000 | 0.9995 | 21.47–85,867 | 10.73 | 35.78 | 1.99 | 1.27 | 2.88 | 2.29 | 95.46 | 2.07 | 97.06 | 2.69 | 102.25 | 1.18 | 0.98 |
| Quercitrin | Y = 691x – 41,200 | 0.9995 | 3.29–3292 | 3.29 | 10.97 | 1.48 | 2.8 | 2.49 | 2.74 | 97.03 | 3.46 | 100.97 | 4.06 | 95.65 | 3.69 | 1.02 |
| Avicularin | Y = 1220x − 387,000 | 0.9994 | 13.86–13,864 | 1.39 | 4.62 | 2.63 | 2.97 | 3.24 | 2.13 | 97.37 | 1.74 | 100.01 | 1.52 | 97.94 | 2.14 | 1.01 |
| Astragalin | Y = 679x + 1,080,000 | 0.9993 | 21.22–21,217 | 10.61 | 35.36 | 2.12 | 1.74 | 1.92 | 2.9 | 96.64 | 2.3 | 98.6 | 1.3 | 95.16 | 2.45 | 0.97 |
| Trifolin | Y = 5240x + 631,000 | 0.9992 | 7.22–14,445 | 3.61 | 12.04 | 1.65 | 2.55 | 2.96 | 2.15 | 95.48 | 1.77 | 102.22 | 3.42 | 101.19 | 4.05 | 1.01 |
| Hyperoside/Isoquercitrin | Y = 517x + 1,200,000 | 0.9995 | 41.14–123,420 | 41.14 | 137.13 | 3.21 | 3.97 | 3.90 | 1.02 | 98.1 | 3.9 | 98.1 | 4.2 | 101.2 | 2.9 | 1.03 |
| Kaempferol-3-O-rutinoside | Y = 1190x + 220,000 | 0.9994 | 5.83–11,668 | 5.83 | 19.45 | 1.2 | 1.84 | 1.57 | 2.77 | 97.7 | 1.69 | 99.89 | 1.8 | 100.5 | 1.07 | 0.98 |
| Rutin | Y = 0.633x + 363 | 0.999 | 4.45–4455 | 4.45 | 14.85 | 1.9 | 2.14 | 2.81 | 2.15 | 95.99 | 4.23 | 100.99 | 4.46 | 97.74 | 3.19 | 1.03 |
| Amentoflavone | Y = 4.09x − 1690 | 0.9992 | 5.58–11,150 | 5.58 | 18.58 | 2.31 | 2.16 | 2.12 | 2.38 | 95.64 | 1.53 | 102.82 | 2.77 | 96.2 | 2.29 | 1.04 |
| Apigenin | Y = 27.5x − 7930 | 0.9994 | 6.92–13,840 | 6.92 | 23.07 | 1.55 | 2.59 | 2.75 | 2.25 | 96.06 | 1.53 | 99.75 | 0.95 | 98.05 | 3 | 0.98 |
| Gallocatechin | Y = 218x + 80,100 | 0.9993 | 18.08–18,080 | 9.04 | 30.13 | 1.58 | 1.64 | 3.31 | 2.55 | 98.46 | 1.68 | 96.34 | 1.75 | 99.87 | 2.49 | 0.97 |
| Samples | No. | Habits | Batch No. | Origin |
|---|---|---|---|---|
| AVF | S1 | Jilin | 150601 | Simcare |
| S2 | Tianjin | 17010001 | Jiangxi Pharmaceutical Company Limited company | |
| S3 | Tianjin | 160214 | Songqing Hall pharmacy | |
| S4 | Tianjin | 170117003 | Jiangxi Pharmaceutical Company Limited company | |
| S5 | Tianjin | 160419 | Changqingteng pharmacy | |
| S6 | Tianjin | 170106005 | Jiangxi Pharmaceutical Company Limited company | |
| S7 | Tianjin | 17010001 | Jiangxi Pharmaceutical Company Limited company | |
| S8 | Jilin | 150653 | Simcare | |
| S9 | Tianjin | 170106009 | Jiangxi Pharmaceutical Company Limited company | |
| S10 | Tianjin | 170116001 | Jiangxi Pharmaceutical Company Limited company | |
| S11 | Tianjin | 170108001 | Jiangxi Pharmaceutical Company Limited company | |
| S12 | Tianjin | Baixinyuan Pharmacy of Yangzhou | ||
| S13 | Xinjiang | Local collection | ||
| S14 | Tianjin | 170123005 | Jiangxi Pharmaceutical Company Limited company | |
| S15 | Tianjin | 161125002 | Jiangxi Pharmaceutical Company Limited company | |
| S16 | Tianjin | 170101 | Zhongda Ku of province | |
| S17 | Tianjin | 161126025 | Jiangxi Pharmaceutical Company Limited company | |
| S18 | Jiangsu | Local herbal medicine market | ||
| S19 | Tianjin | 170109006 | Jiangxi Pharmaceutical Company Limited company | |
| S20 | Jilin | 20141201 | Caizhilin Pharmacy | |
| S21 | Tianjin | 170115001 | Jiangxi Pharmaceutical Company Limited company | |
| S22 | Tianjin | 170121031 | Jiangxi Pharmaceutical Company Limited company | |
| PHF | S23 | Xinjiang | 170122005 | Jiangxi Pharmaceutical Company Limited company |
| S24 | Tianjin | Local collection | ||
| S25 | Xinjiang | 170123005 | Jiangxi Pharmaceutical Company Limited company | |
| S26 | Xinjiang | 170107006 | Jiangxi Pharmaceutical Company Limited company | |
| S27 | Xinjiang | Local herbal medicine market | ||
| S28 | Xinjiang | 170120008 | Jiangxi Pharmaceutical Company Limited company | |
| S29 | Xinjiang | 0016M60820 | Local herbal medicine market | |
| S30 | Xinjiang | 161120023 | Jiangxi Pharmaceutical Company Limited company | |
| S31 | Xinjiang | 170122006 | Jiangxi Pharmaceutical Company Limited company | |
| S32 | Xinjiang | 170108005 | Jiangxi Pharmaceutical Company Limited company | |
| S33 | Xinjiang | 170110008 | Jiangxi Pharmaceutical Company Limited company | |
| S34 | Xinjiang | 170129006 | Jiangxi Pharmaceutical Company Limited company | |
| S35 | Hebei | Local herbal medicine market | ||
| S36 | Xinjiang | 170107006 | Jiangxi Pharmaceutical Company Limited company | |
| S37 | Xinjiang | 170103006 | Jiangxi Pharmaceutical Company Limited company | |
| S38 | Guangxi | Local herbal medicine market | ||
| S39 | Nei Menggol | Local herbal medicine market | ||
| S40 | Xinjiang | 170125001 | Jiangxi Pharmaceutical Company Limited company | |
| S41 | Tianjin | 161218-5 | Local herbal medicine market |
| Samples | ri | Quality-Ranking | Samples | ri | Quality-Ranking |
|---|---|---|---|---|---|
| S1 a | 0.5461 | 11 | S23 | 0.3371 | 31 |
| S2 | 0.5873 | 2 | S24 | 0.3349 | 33 |
| S3 | 0.5448 | 12 | S25 | 0.3628 | 25 |
| S4 | 0.5484 | 10 | S26 | 0.3284 | 35 |
| S5 | 0.5504 | 9 | S27 | 0.3427 | 30 |
| S6 | 0.5701 | 6 | S28 | 0.3262 | 36 |
| S7 | 0.5309 | 14 | S29 | 0.3780 | 23 |
| S8 | 0.5532 | 8 | S30 | 0.3333 | 34 |
| S9 | 0.5895 | 1 | S31 | 0.3535 | 27 |
| S10 | 0.4942 | 20 | S32 | 0.3239 | 37 |
| S11 | 0.4915 | 21 | S33 | 0.3352 | 32 |
| S12 | 0.5805 | 3 | S34 | 0.3542 | 26 |
| S13 | 0.5284 | 16 | S35 | 0.3114 | 39 |
| S14 | 0.4653 | 22 | S36 | 0.3152 | 38 |
| S15 | 0.5717 | 5 | S37 | 0.3670 | 24 |
| S16 | 0.5258 | 17 | S38 | 0.2937 | 41 |
| S17 | 0.5774 | 4 | S39 | 0.3512 | 28 |
| S18 | 0.5238 | 18 | S40 | 0.2944 | 40 |
| S19 | 0.5589 | 7 | S41 | 0.3494 | 29 |
| S20 | 0.5300 | 15 | |||
| S21 | 0.5401 | 13 | |||
| S22 | 0.5161 | 19 |
© 2018 by the authors. Licensee MDPI, Basel, Switzerland. This article is an open access article distributed under the terms and conditions of the Creative Commons Attribution (CC BY) license (http://creativecommons.org/licenses/by/4.0/).
Share and Cite
Chen, C.; Liu, Z.; Zou, L.; Liu, X.; Chai, C.; Zhao, H.; Yan, Y.; Wang, C. Quality Evaluation of Apocyni Veneti Folium from Different Habitats and Commercial Herbs Based on Simultaneous Determination of Multiple Bioactive Constituents Combined with Multivariate Statistical Analysis. Molecules 2018, 23, 573. https://doi.org/10.3390/molecules23030573
Chen C, Liu Z, Zou L, Liu X, Chai C, Zhao H, Yan Y, Wang C. Quality Evaluation of Apocyni Veneti Folium from Different Habitats and Commercial Herbs Based on Simultaneous Determination of Multiple Bioactive Constituents Combined with Multivariate Statistical Analysis. Molecules. 2018; 23(3):573. https://doi.org/10.3390/molecules23030573
Chicago/Turabian StyleChen, Cuihua, Zixiu Liu, Lisi Zou, Xunhong Liu, Chuan Chai, Hui Zhao, Ying Yan, and Chengcheng Wang. 2018. "Quality Evaluation of Apocyni Veneti Folium from Different Habitats and Commercial Herbs Based on Simultaneous Determination of Multiple Bioactive Constituents Combined with Multivariate Statistical Analysis" Molecules 23, no. 3: 573. https://doi.org/10.3390/molecules23030573
APA StyleChen, C., Liu, Z., Zou, L., Liu, X., Chai, C., Zhao, H., Yan, Y., & Wang, C. (2018). Quality Evaluation of Apocyni Veneti Folium from Different Habitats and Commercial Herbs Based on Simultaneous Determination of Multiple Bioactive Constituents Combined with Multivariate Statistical Analysis. Molecules, 23(3), 573. https://doi.org/10.3390/molecules23030573