Article

An Interaction of Rhamnolipids with Cu2+ Ions

Institute of Agrophysics, Polish Academy of Sciences, Doświadczalna 4, 20-290 Lublin, Poland
*
Author to whom correspondence should be addressed.
Molecules 2018, 23(2), 488; https://doi.org/10.3390/molecules23020488
Submission received: 10 January 2018 / Revised: 19 February 2018 / Accepted: 21 February 2018 / Published: 23 February 2018
(This article belongs to the Section Nanochemistry)

Abstract

:
This study was focused on the description of interaction between Cu2+ ions and the 1:1 mono- and dirhamnolipid mixtures in the premicellar and aggregated state in water and 20 mM KCl solution at pH 5.5 and 6.0. The critical micelle concentration of biosurfactants was determined conductometrically and by the pH measurements. Hydrodynamic diameter and electrophoretic mobility were determined in micellar solutions using dynamic light scattering and laser Doppler electrophoresis, respectively. The copper immobilization by rhamnolipids, methylglycinediacetic acid (MGDA), and ethylenediaminetetraacetic acid (EDTA) was estimated potentiometrically for the Cu2+ to chelating agent molar ratio from 16:100 to 200:100. The degree of ion binding and the complex stability constant were calculated at a 1:1 metal to chelant molar ratio. The aggregates of rhamnolipids (diameter of 43–89 nm) were negatively charged. Biosurfactants revealed the best chelating activities in premicellar solutions. For all chelants studied the degree of metal binding decreased with the increasing concentration of the systems. The presence of K+ lowered Cu2+ binding by rhamnolipids, but did not modify the complex stability significantly. Immobilization of Cu2+ by biosurfactants did not cause such an increase of acidification as that observed in MGDA and EDTA solutions. Rhamnolipids, even in the aggregated form, can be an alternative for the classic chelating agents.

1. Introduction

Rhamnolipids are the anionic biosurfactants which are synthesized by Pseudomonas aeruginosa. Their molecules are composed of one or two rhamnose units glycosidically linked with the beta-hydroxydecanoic acid units [1]. The acidic character of rhamnolipids results from the presence of carboxylic groups (pKa 5.6) in their molecules [1,2]. Due to the low toxicity, high biodegradability, and emulsifying activity [1,3] they are promising substances which can replace the synthetic surfactants. The possible areas of their application include, e.g., food production and protection, the pharmaceutical and cosmetic industry, agriculture, and natural environment protection [4,5]. Affinity of rhamnolipids to metals is studied mostly in a context of remediation of the soil contaminated with heavy metals [6,7,8,9]. However, some of divalent metals (e.g., Cu, Zn), which show toxicity to live organisms at high concentration, belong simultaneously to the microelements, which are necessary for proper functioning of these organisms. Such micronutrients are often supplemented in the chelated form.
Ethylenediaminetetraacetic acid (EDTA) is probably the most popular chelating agent belonging to aminopolycarboxylates. It is used in cosmetics and pharmaceuticals without the toxic or harmful effects on human health [10]. However, its complexes with metals are very stable and by the persisting in the environment cause the perturbations of natural metal speciation. Moreover, it was shown by Sillanpää and Oikari [11] that EDTA, in the form of chelate with metal, is much more toxic than in the free state. Low biodegradability of aminopolycarboxylates resulted in looking for the other more environmentally friendly components.
Methylglycinediacetic acid (MGDA) is a complexing agent belonging to a new generation of biodegradable chelants [12,13,14]. It forms water-soluble complexes with polyvalent ions, but is degraded in the natural environment two times faster than EDTA [13]. Considering the above, MGDA is a greener alternative to EDTA [15].
The chemical structures of the above discussed compounds are shown in Figure 1.
There is an observed increase in interest in the application of natural, biodegradable, and effective compounds in different areas of industry to replace synthetic ones, which have been used so far. Rhamnolipids, due to their both surface activity and metals mobilization could be compounds which play the role of emulsifying and complexing agent, simultaneously, in different formulations. Therefore, the aim of research was to characterize the interaction between Cu2+ ions and the 1:1 mono- and dirhamnolipids mixture in premicellar and aggregated state in water and 20 mM KCl solution at pH 5.5 and 6.0, and to compare it with that of MGDA and EDTA. The above mentioned pH values were chosen as the most often applied and appropriate for both the plant care [16] and cosmetic product [17] formulations.

2. Results and Discussion

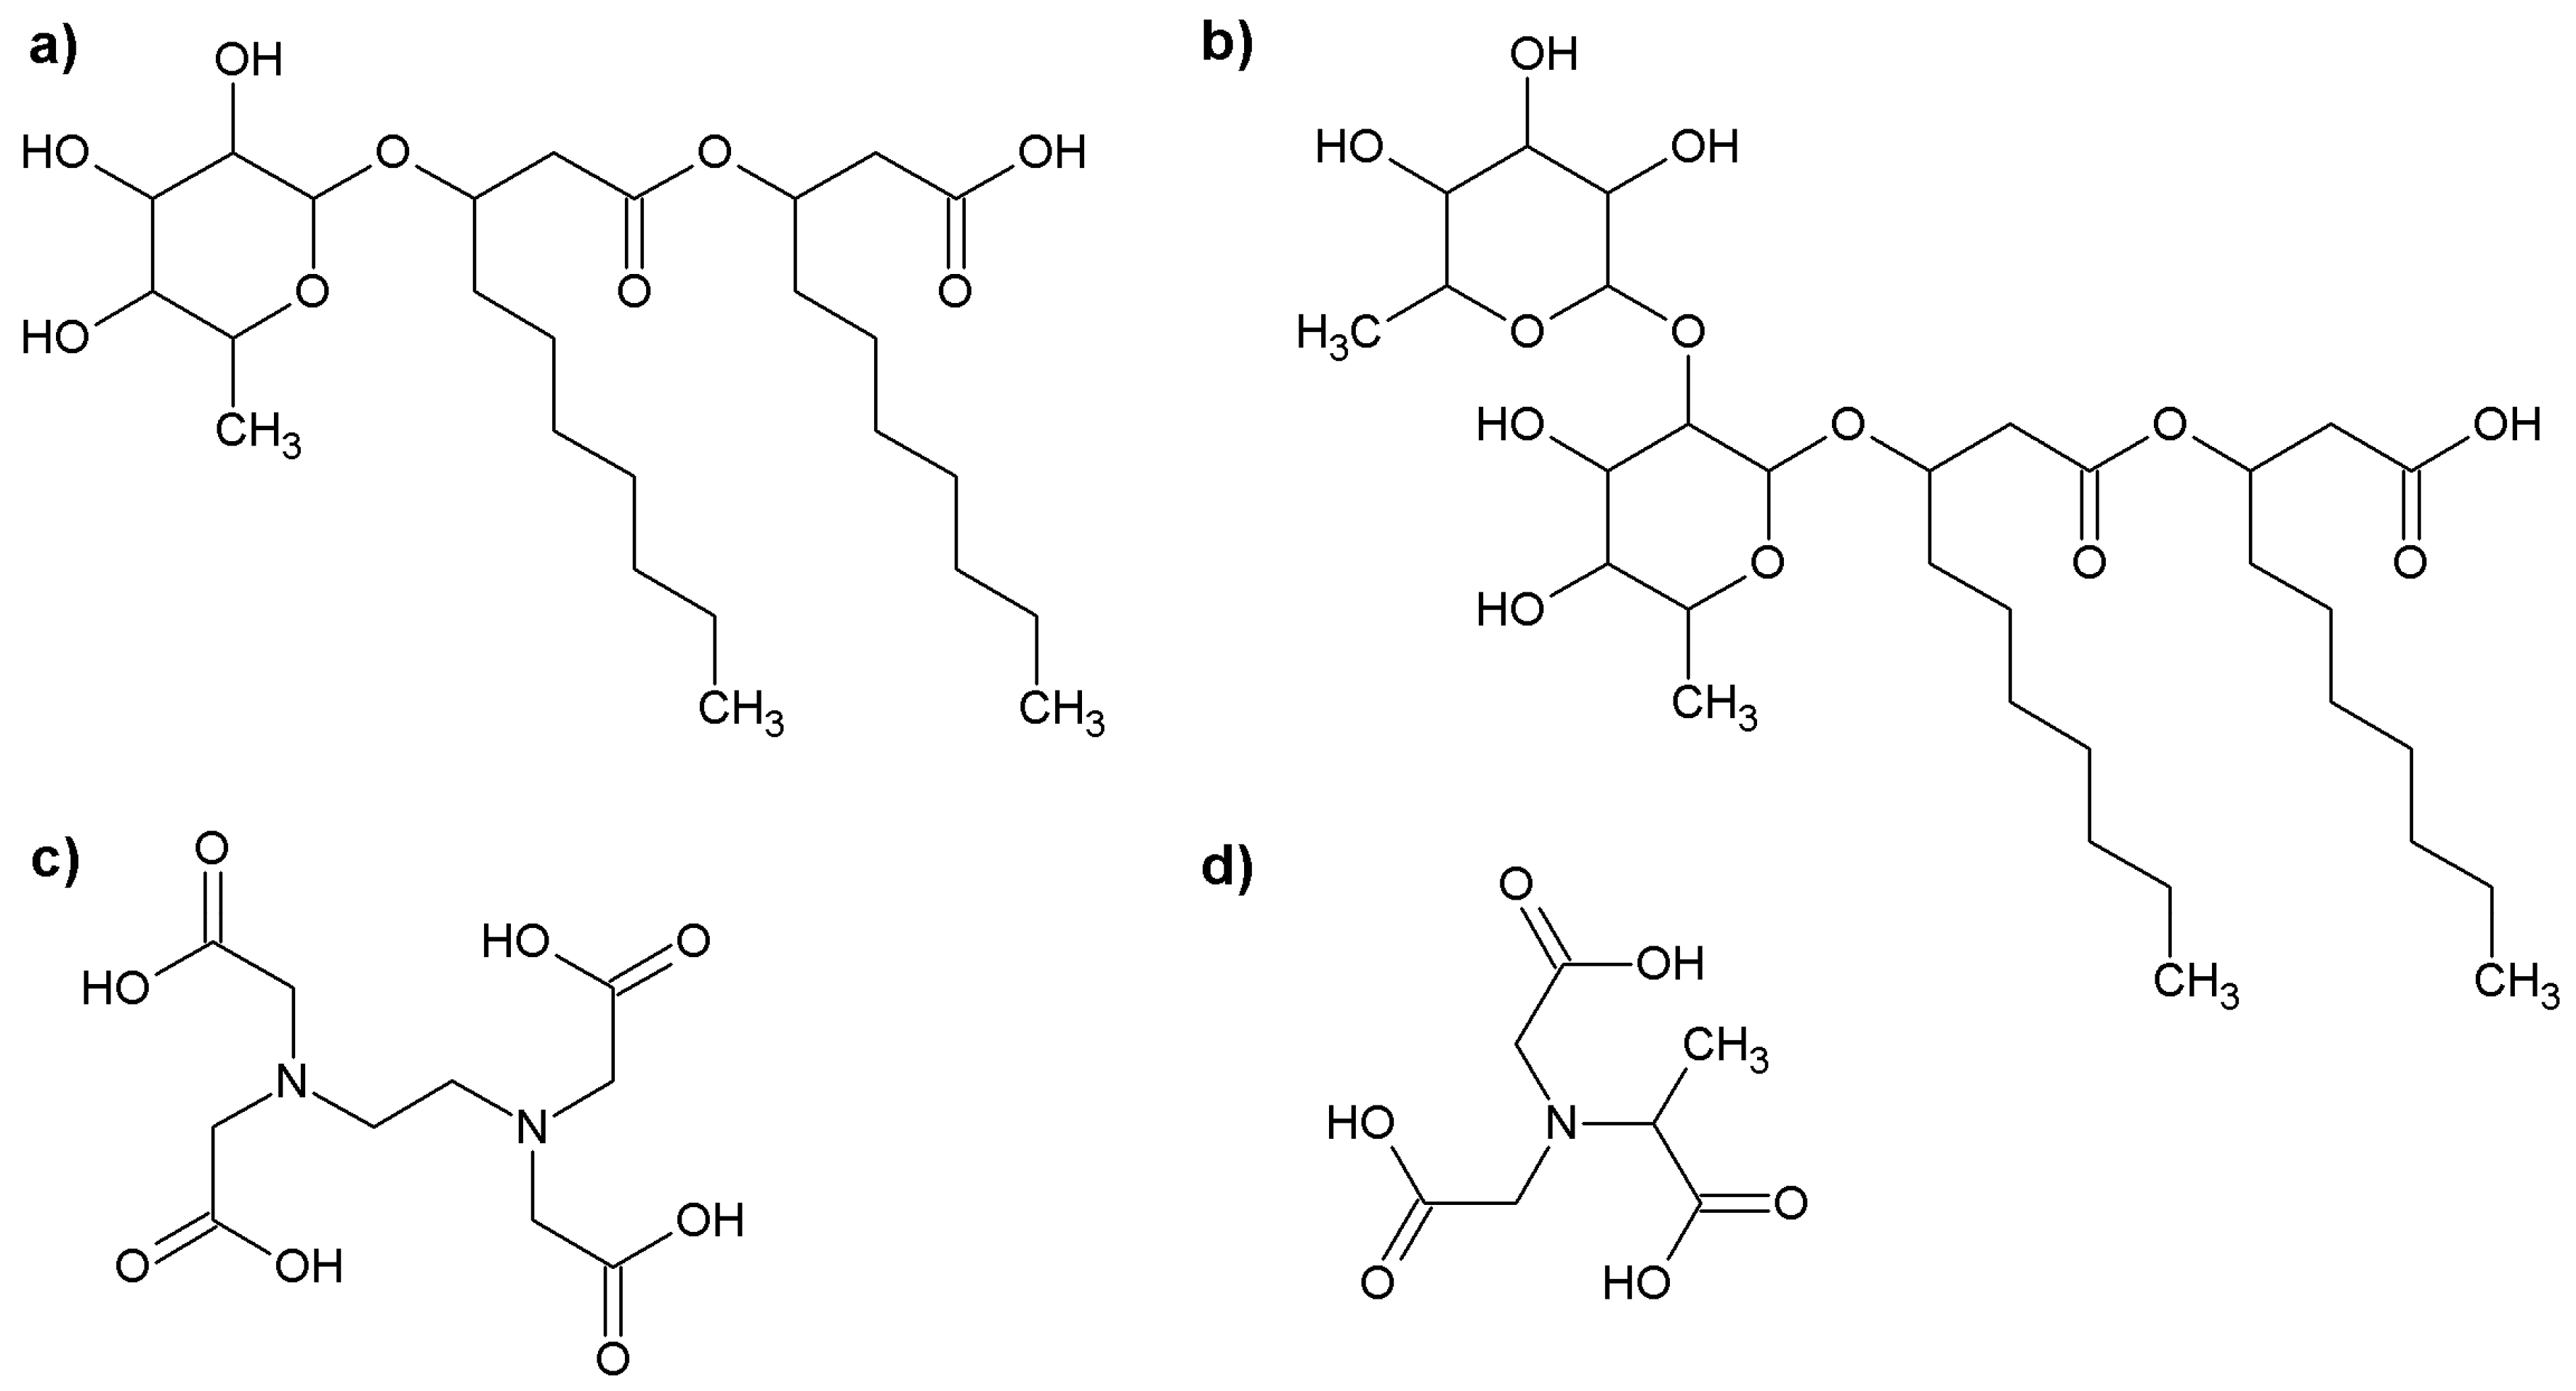
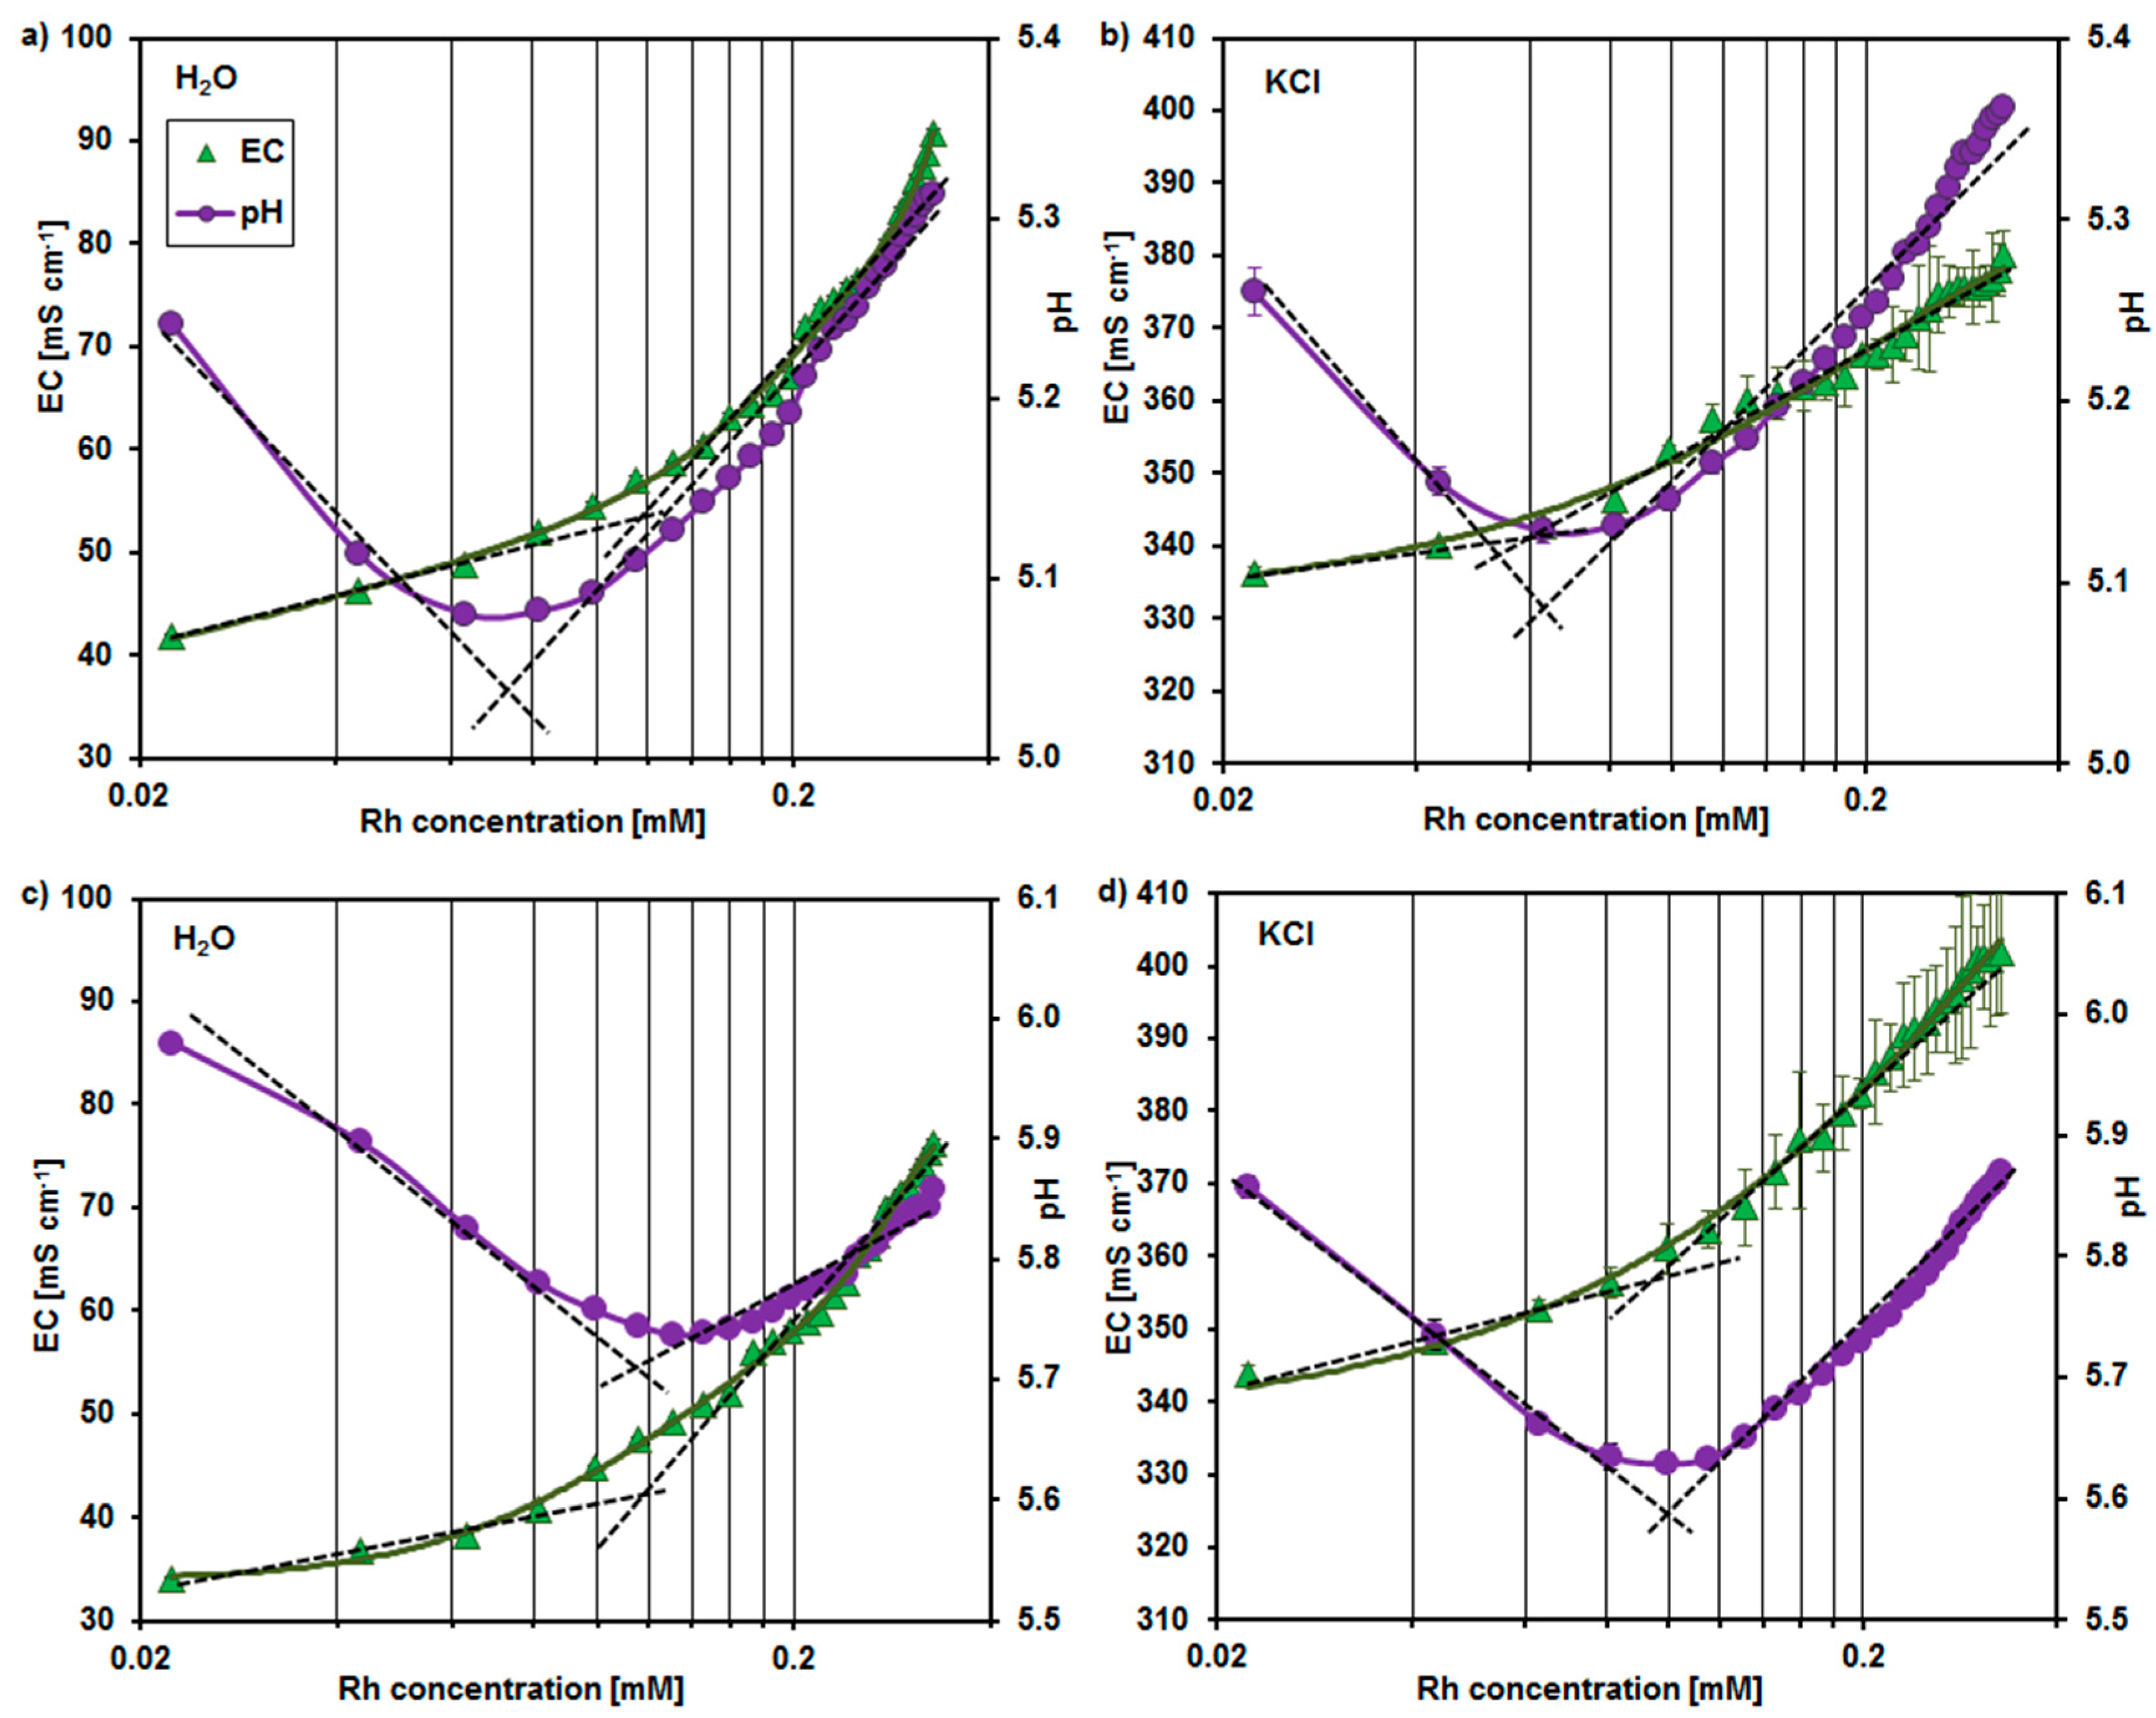
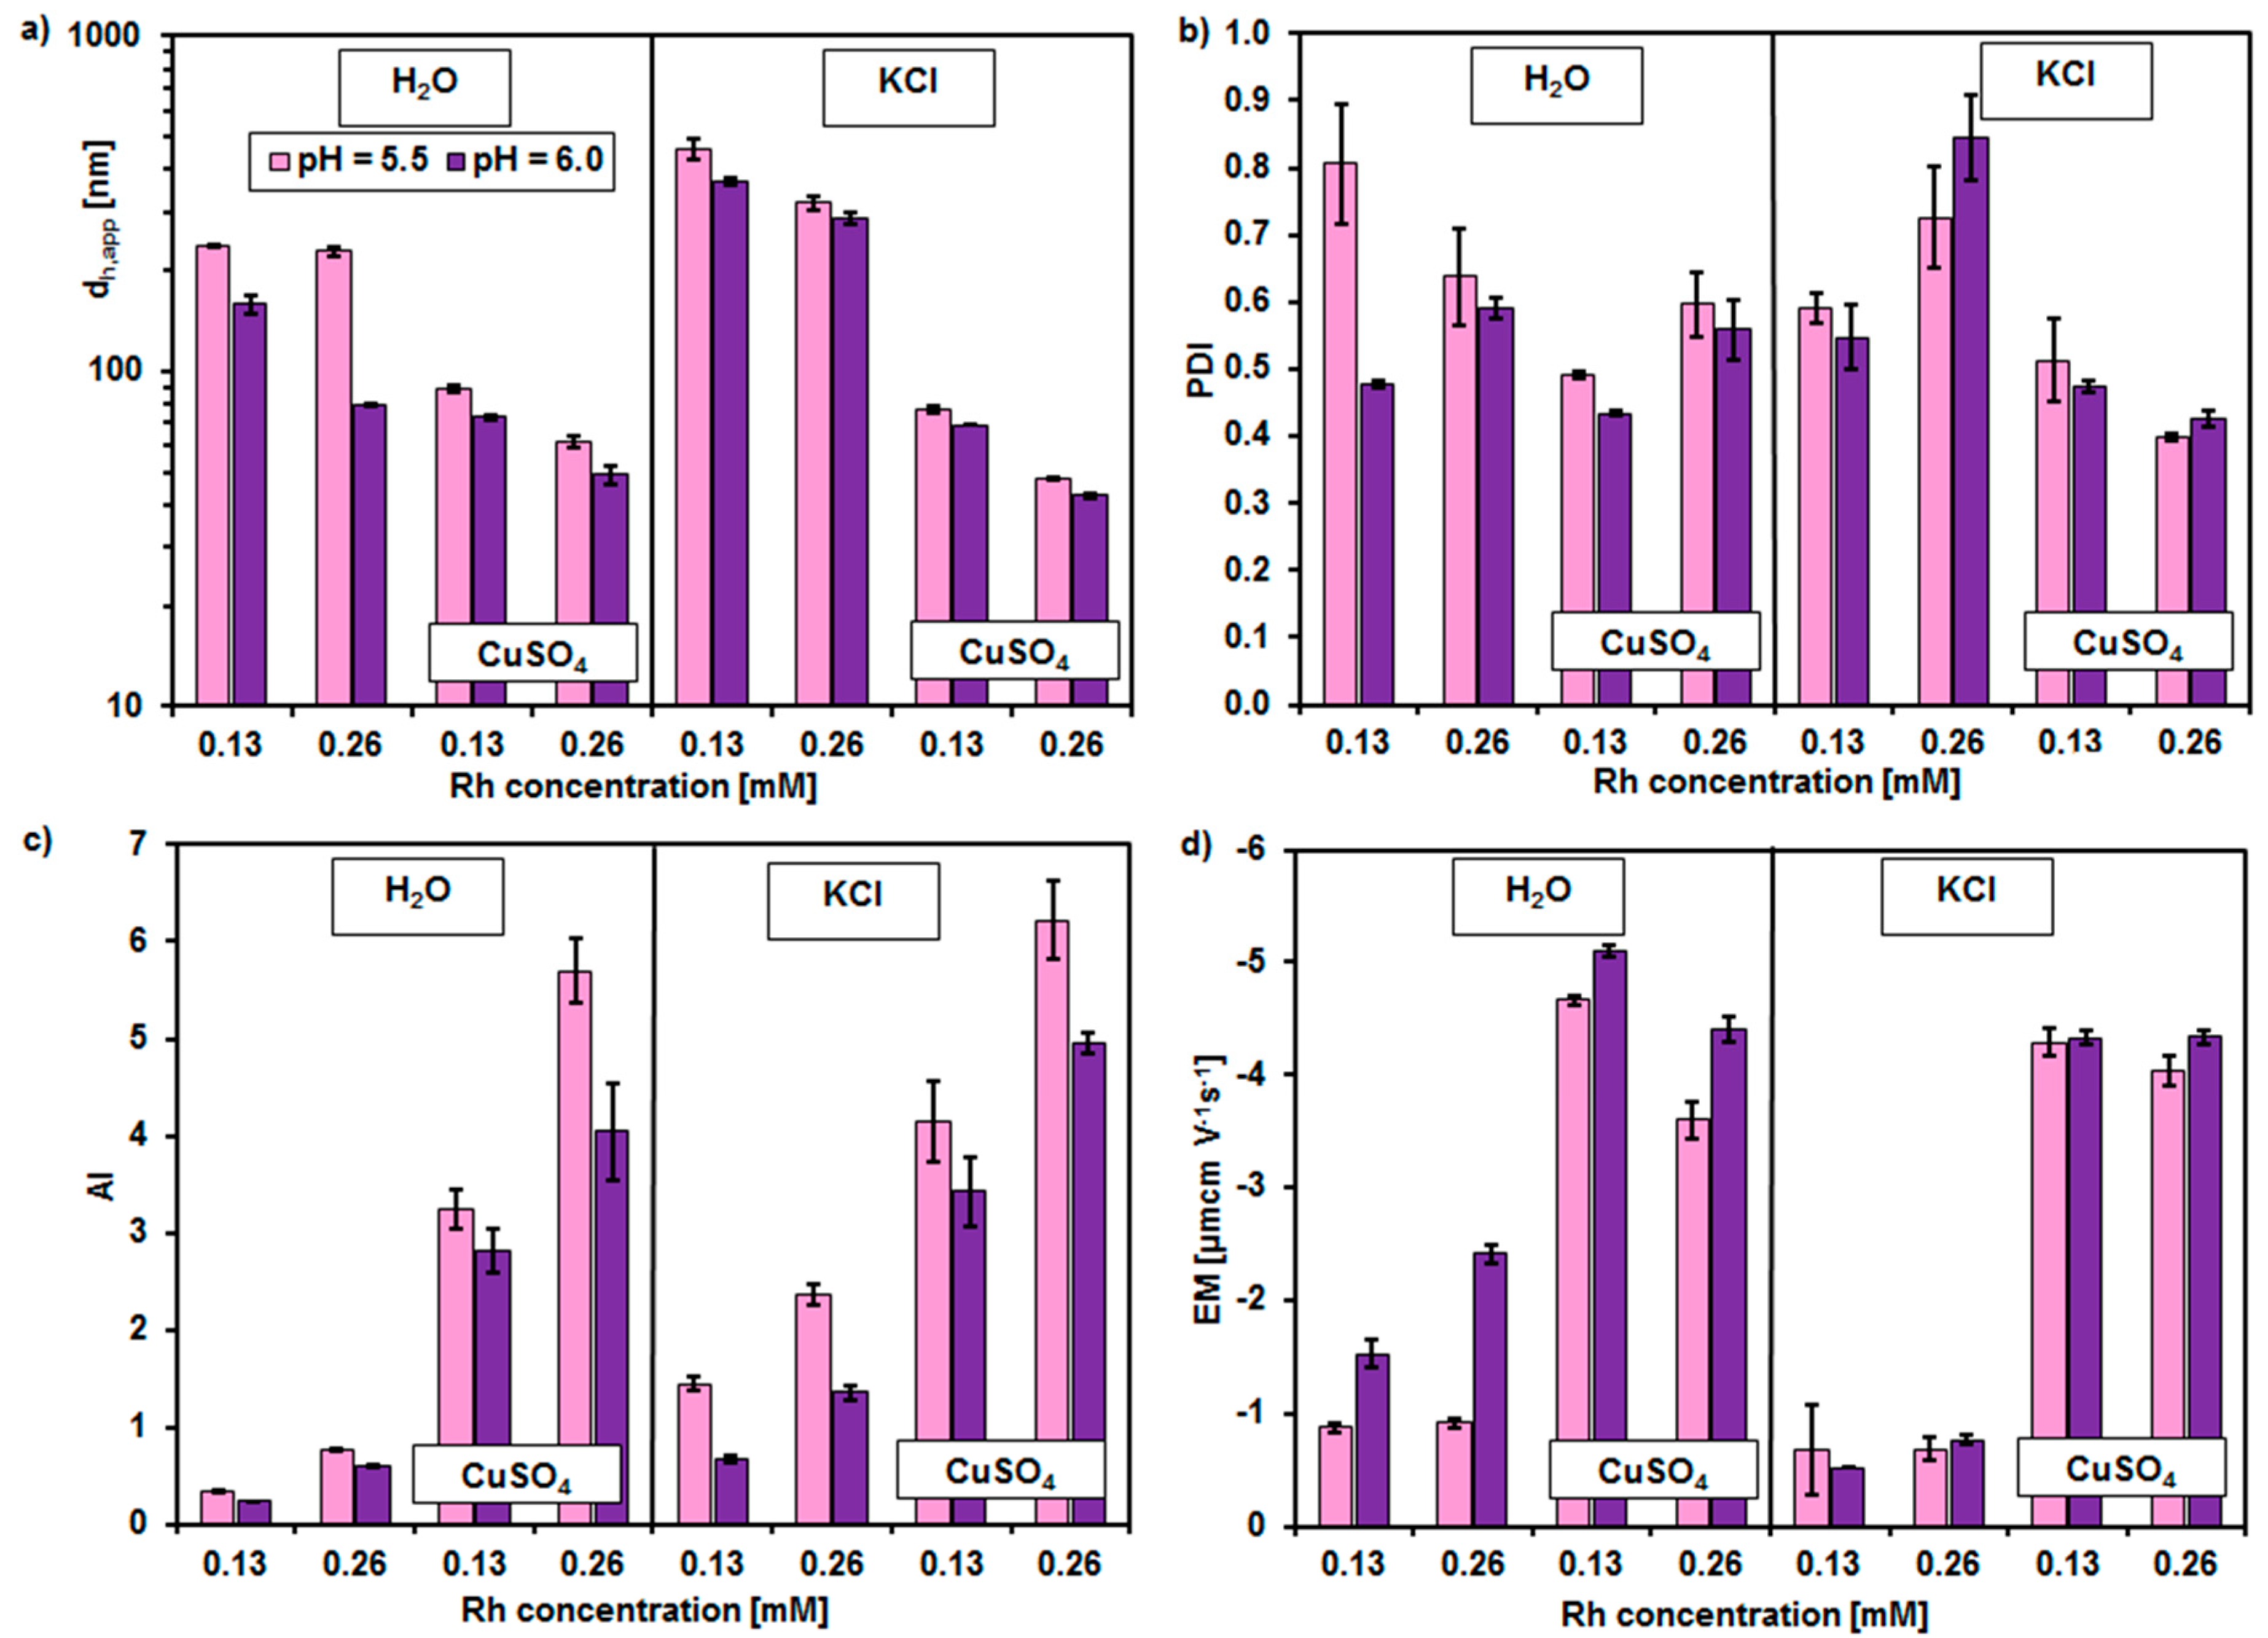
2.1. The Aggregation of the Rhamnolipid Molecules

In the first step of investigations the critical micelle concentration (CMC) of rhamnolipids was determined at pH 5.5 and 6.0. It was based on the analysis of the pH and electrolytic conductivity (EC) changes with an increasing rhamnolipid concentration in both the water and 20 mM KCl solution. The obtained results are shown in Figure 2.
In the premicellar solutions the EC increased whereas pH decreased with an increasing rhamnolipid content. It was due to the acidic character of studied biosurfactants. The rising amount of rhamnolipids in solution resulted in an increasing concentration of the hydrated H+ ions and led to the EC enhancing.
In the micellar solutions the rate of EC increase with the increasing biosurfactant content was slowed down by the process of rhamnolipid aggregation. It is known that the dissociation degree of surfactants in micellar form is lower than this of their free molecules in bulk solution [18]. As a consequence, at the rhamnolipid concentration higher than CMC the acidity of solutions decreased with the increasing amount of surfactants, and pH value tended to that of the stock solution (i.e., pH 5.5 or 6.0).
Determination of the break points of the presented in Figure 2 curves allowed to obtain the CMC values for the rhamnolipid solutions with initial pH of 5.5 and 6.0, respectively. The results are summarized in Table 1.
It can be seen that the CMC was lowered with the increasing ionic strength and the decreasing pH of solution. Moreover, the CMC values, which were estimated on the base of EC analysis, were comparable with these coming from the studies of pH changes. This suggests that the pH measurements can be useful for indication of the CMC of acidic surfactants. To our knowledge such method of CMC determination has not been used so far.
The results which were obtained for the 1:1 mixture of mono- and dirhamnolipids correspond to the literature data. The CMC of dirhamnolipids which was determined by Sánchez et al. [19] on the base of the surface tension measurements and the isothermal titration calorimetry was 0.010 mM and 0.110 mM at pH 4.0 and 7.4, respectively. Dirhamnolipids, which were analyzed by Özdemir et al. [20], aggregated at concentrations of 0.040 mM and 0.150 mM at pH 5.0 and 6.8, respectively. The CMC of monorhamnolipids, which was determined using conductometry, was equal to 0.040 mM at pH 5.0 and 0.100 mM at pH 6.8 of pure aqueous solution [20]. In the 50 mM NaCl solution at pH 6.8 the monorhamnolipids’ CMC was equal to 0.100 mM, whereas the CMC of dirhamnolipids was equal to 0.080 mM [21].

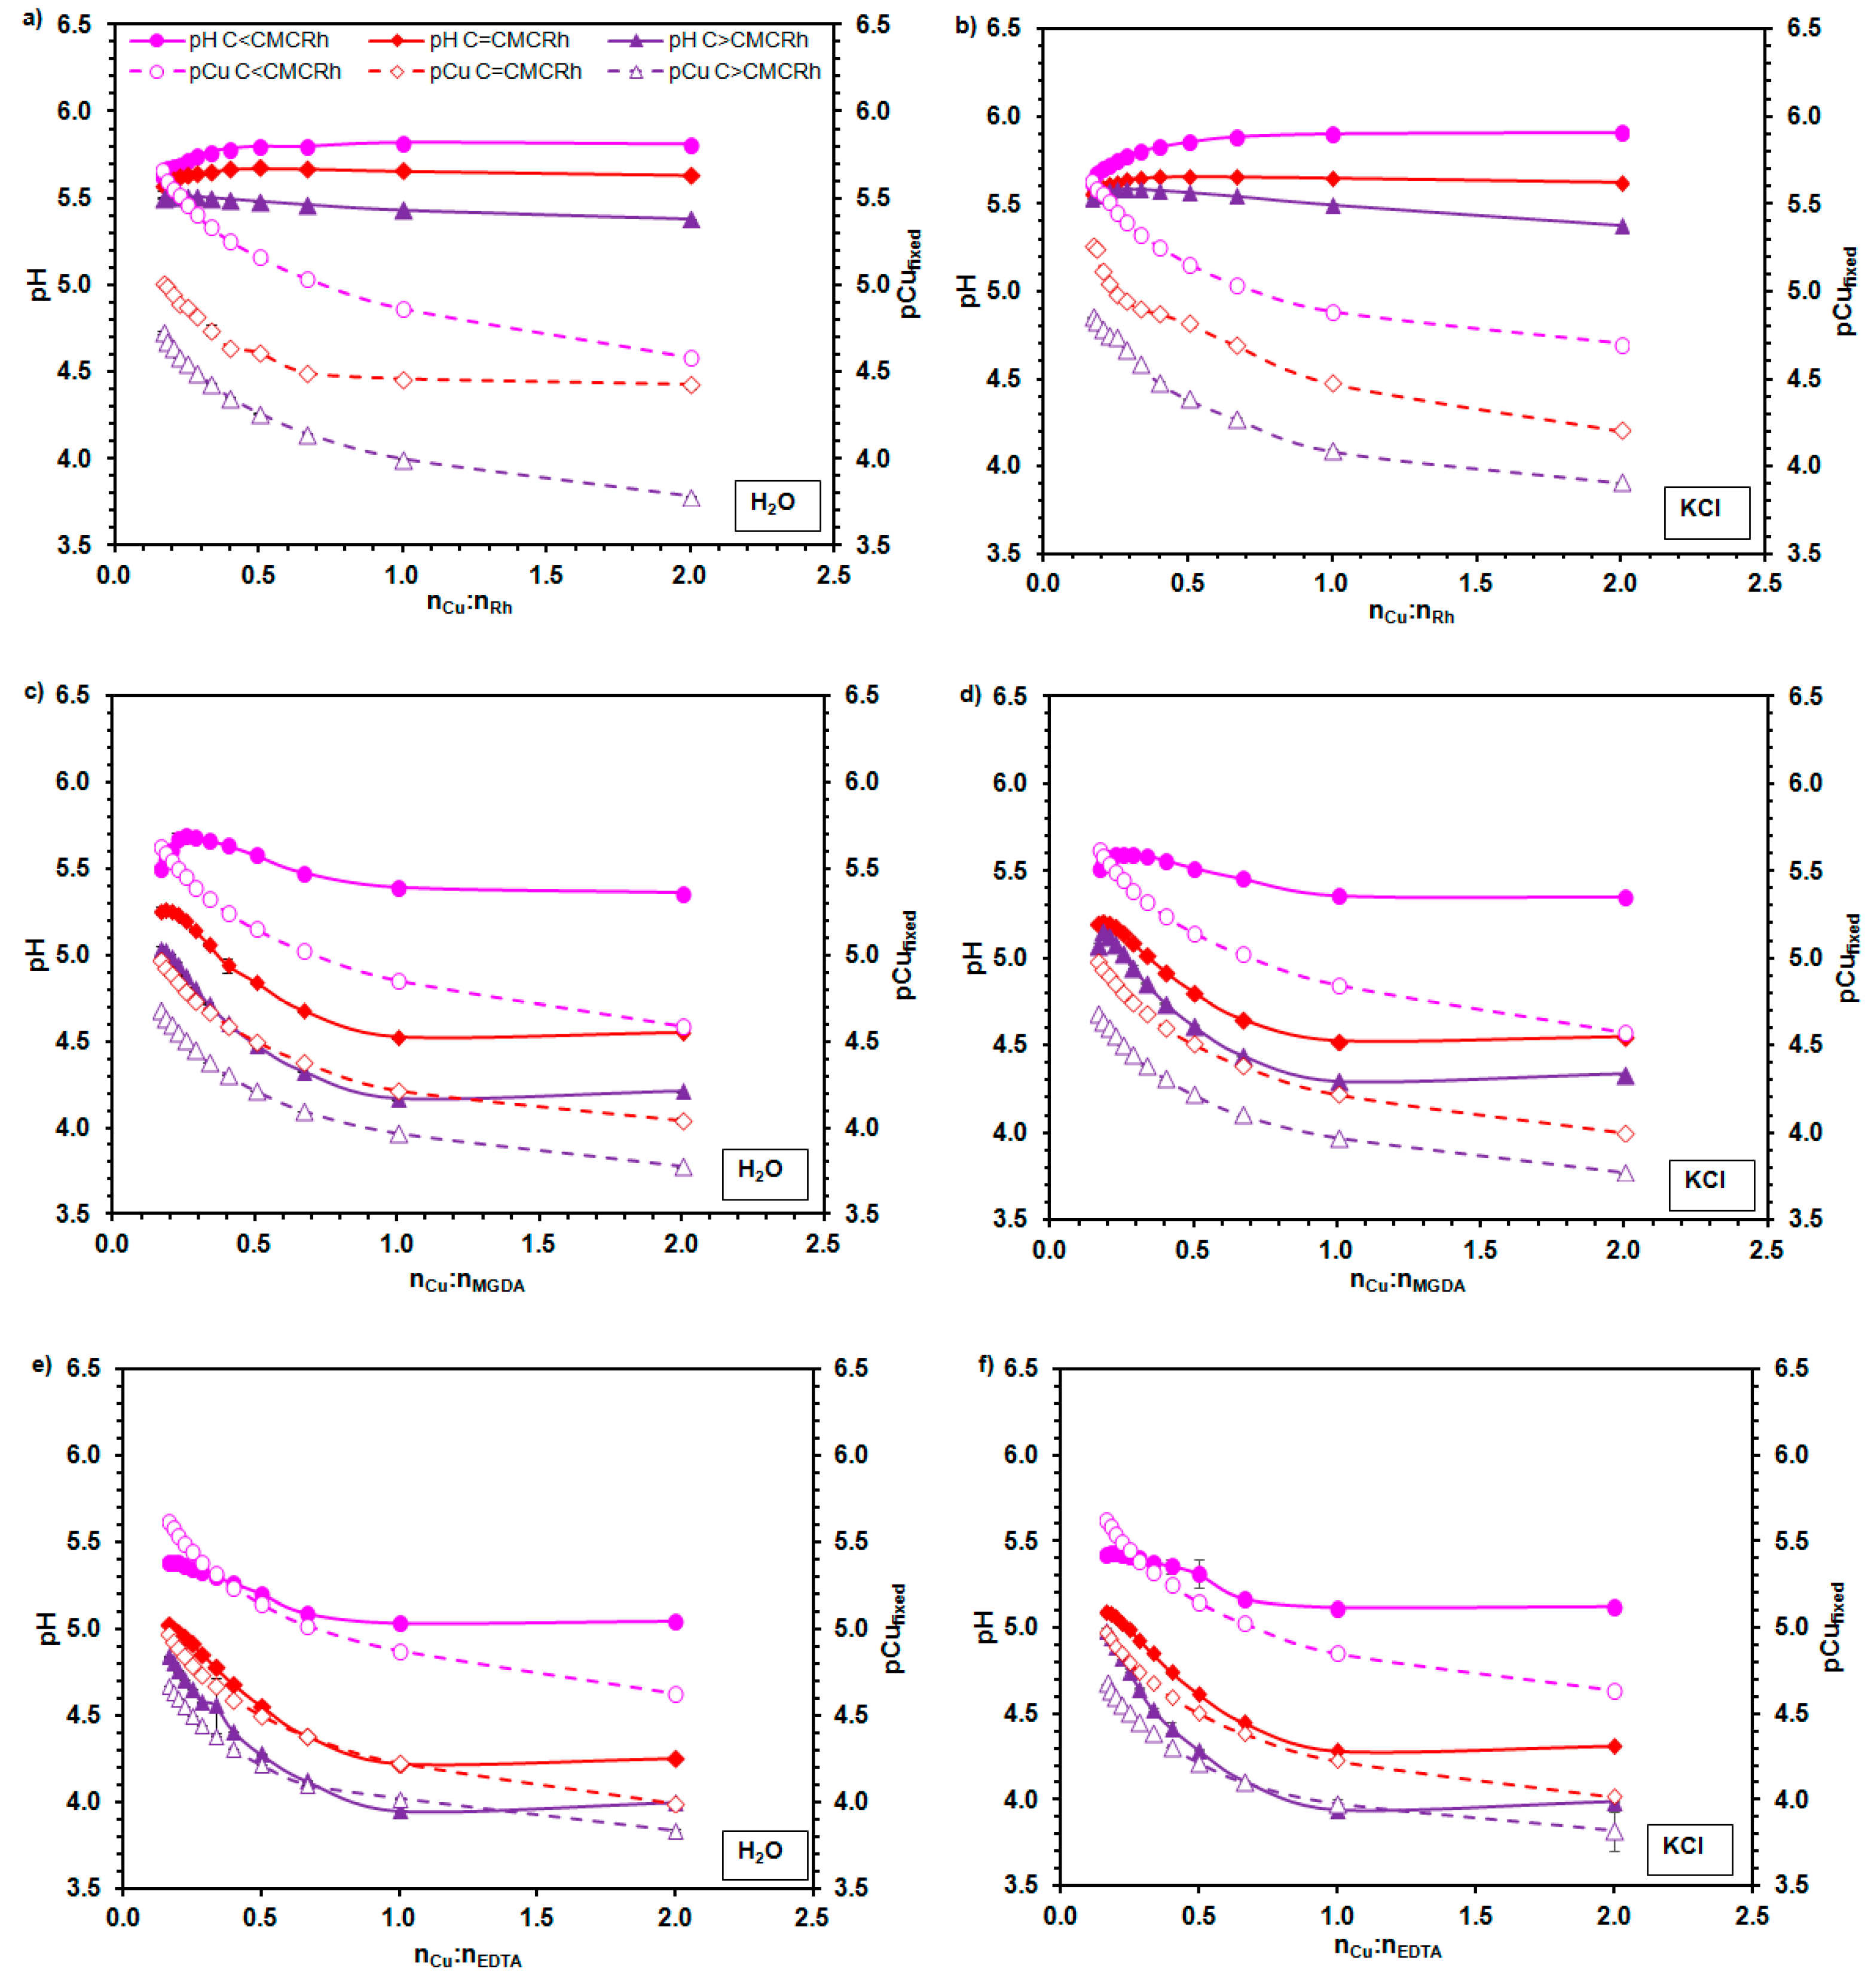
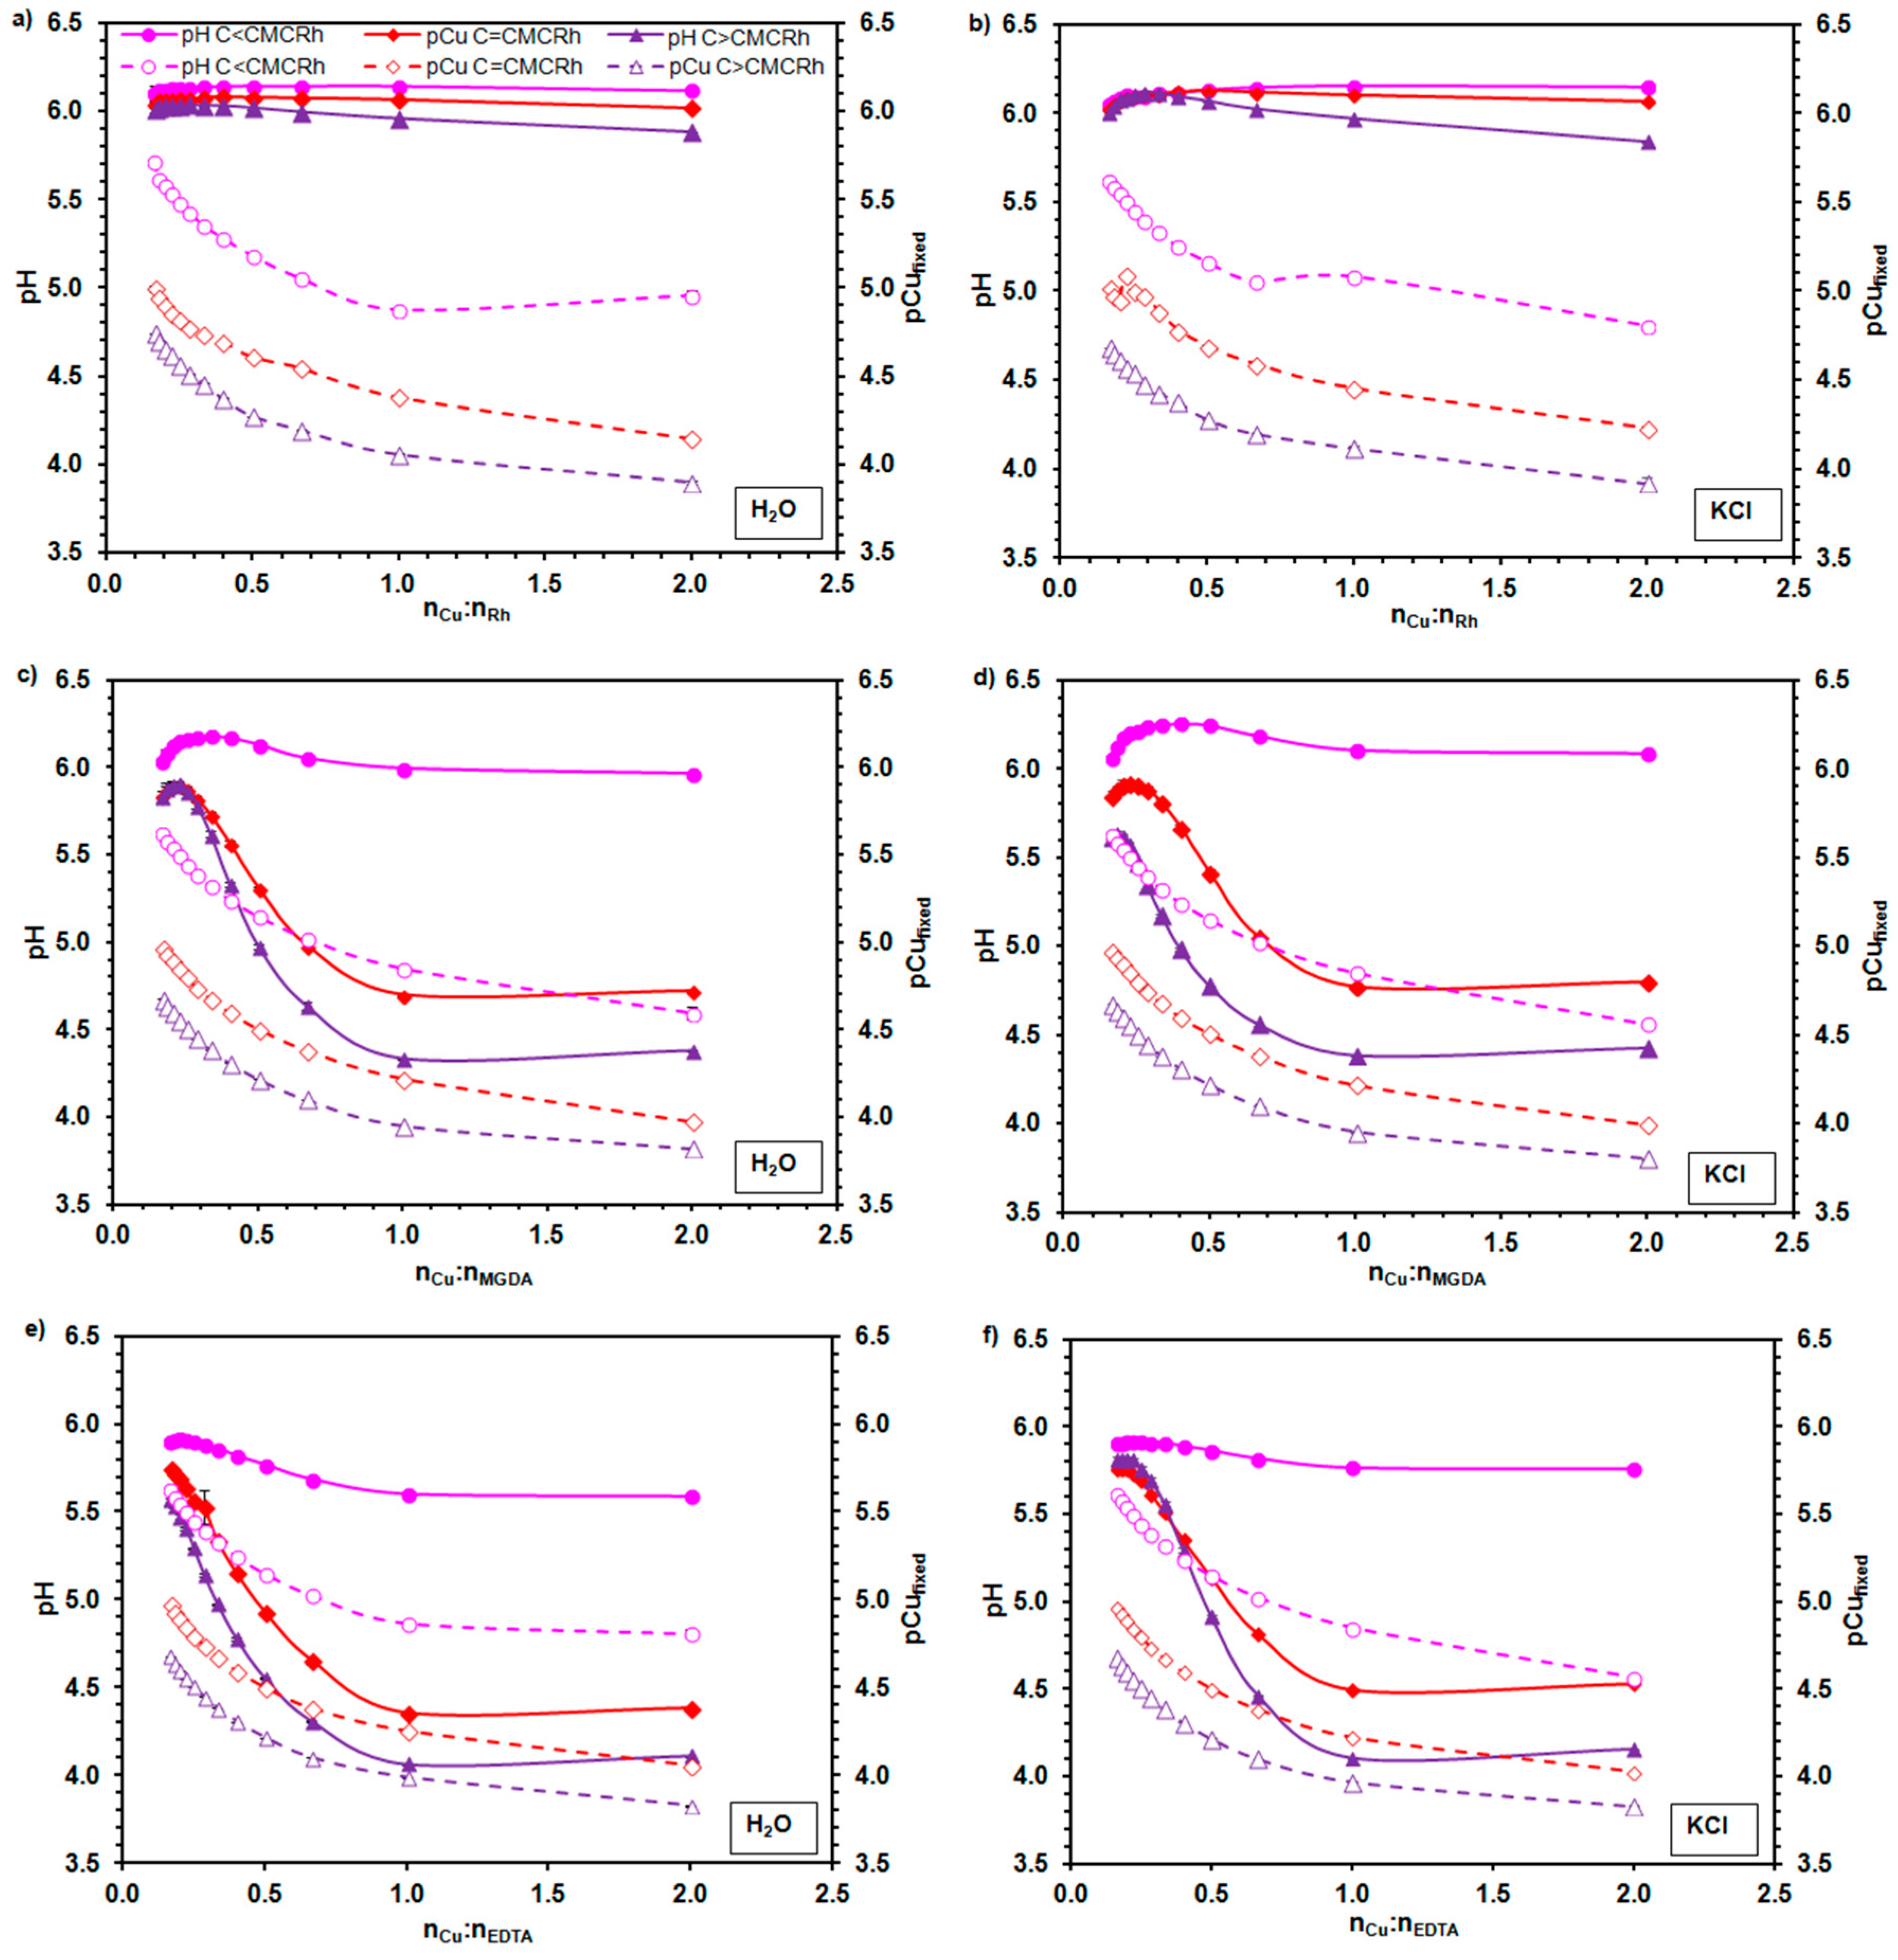
2.2. The Complexation of Cu2+ Ions by Rhamnolipids

The micellar solutions of rhamnolipids with and without the presence of Cu2+ ions were characterized in respect to the particles size (dh,app), polydispersity (PDI), aggregation (AI), and electrophoretic mobility (EM). The results are shown in Figure 3.
For all the systems analyzed the increase of rhamnolipid concentration from 0.13 to 0.26 mM resulted in a decrease of hydrodynamic diameter of micelles (Figure 3a). It was from 237 ± 2.2 nm to 227.5 ± 7.1 nm at pH 5.5 and from 158.6 ± 9.7 nm to 79.7 ± 1 nm at pH 6.0 in pure micellar solution. The addition of Cu2+ ions resulted in decrease of particles size but the lowering of hydrodynamic diameter with the increasing content of rhamnolipids was still visible. When the biosurfactants concentration changed from 0.13 mM to 0.26 mM at pH 5.5 the aggregates diameter decreased from 88.9 ± 1.7 nm to 61.6 ± 2.6 nm, whereas at pH 6.0 it decreased from 73.1 ± 1.1 nm to 49.1 ± 3.5 nm. In the 20 mM KCl solution similar effect of biosurfactants concentration was observed. Without the Cu2+ ions added the particles size decreased from 461 ± 34.9 nm to 317.8 ± 13.8 nm and from 367.9 ± 7.1 to 287 ± 11.2 nm at pH 5.5 and 6.0, respectively. In a presence of Cu2+ ions in this system the decrease was from 77.1 ± 1.8 nm to 47.9 ± 0.3 nm at pH 5.5 and from 69.3 ± 0.2 nm to 42.6 ± 0.7 nm at pH 6.0. At the given concentration of rhamnolipids the particles size decreased with both the pH and the ionic strength increase.
The observed decrease of particles size with the increasing concentration of biosurfactants was probably a consequence of electrostatic repulsion between the aggregates. Similar effect was found for the synthetic anionic surfactant sodium dodecyl sulfate (SDS) [22]. An enhancement of the ionic strength of dispersing medium over the 1 M can eliminate the influence of electrostatic interaction on the particles size determined by dynamic light scattering (DLS) method in the micellar solution of ionic surfactants [23]. The change of pH affect the morphology of rhamnolipid aggregates [24,25]. It was observed by Dahrazma et al. [24] that in acidic conditions the vesicles with a radius about 55–60 nm whereas, in more alkaline conditions, the small micelles were formed by the rhamnolipids.
The rhamnolipids’ micellar solutions were characterized by different values of PDI (Figure 3b). Generally, the polydispersity ranged from 0.5 to 0.8 in the pure micellar solutions. In the presence of Cu2+ ions the PDI values equaled 0.4–0.6 and 0.4–0.5, in the systems without and with KCl, respectively. An increase of pH did not affect PDI significantly, in exception of the aqueous systems at the lowest concentration of rhamnolipids (0.13 mM), where PDI decreased with an increasing alkalization.
The index of aggregation (Figure 3c) increased with the biosurfactants content in all analyzed systems. In the pure aqueous solution AI increased from 0.3 ± 0.1 to 0.8 ± 0.1 at pH 5.5 and from 0.2 ± 0.1 to 0.6 ± 0.1 at pH 6.0. In the presence of KCl the increase was from 1.4 ± 0.1 to 2.4 ± 0.1 at pH 5.5 and from 0.7 ± 0.1 to 1.4 ± 0.1 at pH 6.0. In the aqueous systems containing Cu2+ ions the AI changed from 3.2 ± 0.2 to 5.7 ± 0.3 at pH 5.5 and from 2.8 ± 0.2 to 4.0 ± 0.5 at pH 6.0. In the systems with KCl and CuSO4 the AI increased from 4.1 ± 0.4 to 6.2 ± 0.4 at pH 5.5 and from 3.4 ± 0.4 to 5.0 ± 0.1 at pH 6.0 when the rhamnolipids content changed from 0.13 mM to 0.26 mM. In all cases, the lower the pH was, the higher the AI values were. It was connected with the effect of pH on the micellization process. At a given concentration of rhamnolipids their molecules were more aggregated at a lower pH (see Table 1). The addition of both KCl and CuSO4 resulted in higher values of AI than these in the systems without the salts. It is consistent with the literature data. It is known, that in a presence of electrolyte the aggregates of ionic surfactants are composed of higher number of monomers than those in the pure aqueous systems [18].
The electrophoretic mobility of rhamnolipid aggregates was characterized by the negative sign (Figure 3d), what was a consequence of dissociation of carboxylic groups in the micelle hydrophilic surface/bulk solution interface [1]. The concentration of biosurfactants influenced the EM values differently. At pH 5.5, in both the pure aqueous solution and 20 mM KCl solution, EM was on the level of −0.9 µm cm V−1 s−1 and −0.7 µm cm V−1 s−1, respectively, and was independent from the rhamnolipid content. At pH 6.0 in pure aqueous solution the EM changed from −1.5 ± 0.1 µm cm V−1 s−1 to −2.4 ± 0.1 µm cm V−1 s−1 whereas, in the presence of KCl, it was from −0.5 ± 0.1 µm cm V−1 s−1 to −0.8 ± 0.1 µm cm V−1 s−1 with the rhamnolipid concentration increasing from 0.13 mM to 0.26 mM. This increase of the absolute value of EM was connected with a decrease of the particles size (Figure 3a). In a presence of Cu2+ ions in aqueous solutions the absolute value of EM decreased with an increasing content of biosurfactants. It was from 4.7 ± 0.1 µm cm V–1 s–1 to 3.6 ± 0.2 µm cm V–1 s–1 and 5.1 ± 0.1 µm cm V−1 s–1 to 4.4 ± 0.1 µm cm V–1 s−1 at pH 5.5 and 6.0, respectively. The presence of Cu2+ ions in the systems containing KCl reduced the influence of the rhamnolipid concentration on EM. At both pH 5.5 and 6.0 the EM value was about −4.3 ± 0.1 µm cm V–1 s–1. Generally, the absolute value of EM increased with the pH increase. It resulted from the increase of the amount of ionized biosurfactant molecules. The adjustment of the ionic strength by KCl eliminated this effect. The increase of the absolute value of EM after the addition of Cu2+ can be confusing. It is known that the electrical double layer is more compact in the presence of electrolyte, so these values should be lower than in the systems without CuSO4. However, it can be seen that, in the presence of Cu2+ ions, the rhamnolipid aggregates were smaller and possessed higher AI values than those observed in the pure aqueous and KCl systems (Figure 3a,c). The smaller the size of the particle, the higher its velocity during electrophoresis [26].
The immobilization of Cu2+ ions by rhamnolipid molecules in premicellar and micellar solutions at pH 5.5 and 6.0 with and without KCl was determined by the potentiometric measurements. Both the pH and Cu2+ ions activity was monitored at the molar ratio of copper ions to rhamnolipids ranging from 16:100 to 2:1. The experiments were performed for the studied biosurfactants and two chelating agents (MGDA and EDTA). Three concentrations of the studied compounds were applied to check the chelating activity of rhamnolipids below the CMC, close to the CMC and in strongly aggregated form (over the CMC). The obtained results are shown in Figure 4 and Figure 5.
It can be seen, that for both the 5.5 and 6.0 pH values, as well as all the ionic strengths and chemical compounds used, the changes of pCufixed vs. the Cu2+ to the chelating agent molar ratio were similar. Approximately to the 1:1 the Cu2+ to chelating agent molar ratio, the fast increase of the amount of immobilized Cu2+ ions with the increasing total concentration of the Cu2+ added was observed. A further increase of the Cu2+ to chelating agent molar ratio did not cause such a significant increase of the Cu2+ immobilization. It should be marked that in this experiment the molar concentration of rhamnolipids refers to the number of moles of the mono- and dirhamnolipid pairs per liter of solution. Therefore, the results presented in Figure 4 and Figure 5 indicate that Cu2+ ions were complexed by two molecules of rhamnolipids at the 1:1 Cu2+ to chelating agent molar ratio. Moreover, it can be seen that the higher the concentration of chelating agents applied (i.e., below the CMC < about the CMC < over the CMC), the higher the copper fixation.
The shapes of dependences of pH on the Cu2+ to chelating agent molar ratio, which were obtained for both MGDA and EDTA, were different from those observed for the rhamnolipid solutions. For the MGDA and EDTA solutions the Cu2+ ions immobilization occurred simultaneously with the pH decrease. The CuSO4 hydrolysis did not cause such pH changes of the solutions, so the observed effect was connected with the process of cation chelation. In the case of rhamnolipids, at a concentration lower than the CMC, an increase of pH was noticed. Only for the highest concentrations of biosurfactants the slight decrease of pH with an increase of the Cu2+ to chelating agent molar ratio was observed. However, the recorded pH changes were not so significant, as in the case of MGDA and EDTA. It was found by Raza et al. [25] that in the 2 mM Sr2+ or Pb2+ ion solutions the CMC of rhamnolipids decrease twice with respect to that in the pure aqueous solution. Considering this, the smallest addition of CuSO4 to the premicellar solution of rhamnolipids initiated the aggregation process.
The pH of rhamnolipid solutions was established initially. The molecules in the premicellar solutions were more ionized that those in the aggregated state. The micellization and the cation immobilization, which occurred simultaneously, did not cause the increase of acidification in this case. In the micellar solutions of rhamnolipids at the concentration close to the CMC the copper fixation also did not lead to significant changes of pH. This suggests that the cations, which interacted with the free ions of rhamnolipids, intensified the aggregation process [25] and/or neutralized the initially ionized hydrophilic heads of monomers in the existing micelles. Only for the micellar solutions with the highest concentration of rhamnolipids did the partial exchange between Cu2+ and H+ ions occur, which led to a slight lowering of pH. The revealed properties of rhamnolipids can be important, e.g., when the pH of solutions should be constant during the cation chelation.
In the solutions of MGDA and EDTA in all studied cases the immobilization of Cu2+ led to the release of H+ ions.
An interaction of all the studied compounds with metal ions was characterized by the degree of Cu2+ immobilization and the stability constants of the formed complexes at 1:1 molar ratio of Cu2+ ions and chelating agent. The obtained results are summarized in Table 2 and Table 3.
The rhamnolipids revealed the best ability to immobilize copper ions in premicellar solution without KCl (over 90%) at all applied pH values. The obtained values correspond to those recorded for MGDA and EDTA. The competition between the Cu2+ and K+ ions lowered the copper fixation by rhamnolipids. An increase of concentration of the studied systems led to decrease of Cu2+ immobilization by all chelating agents. It should also be stressed that in the most aggregated state (C > CMCRh), in the pure aqueous solution, the rhamnolipids showed Cu2+ immobilization at a similar level as MGDA and EDTA (about 70%). The worst results were obtained for rhamnolipids at the concentration close to CMC (50–60%). Both the MGDA and EDTA were not so sensitive to the presence of KCl as the rhamnolipids. The results obtained for MGDA and EDTA correspond to the literature data. The theoretical chemical simulations, which were performed at a 1:5 metal to chelating agent molar ratio, showed that at least 80% of Cu2+ should be complexed by these compounds at a pH ranging from about 1.5 to 10.0 [27].
The stability constants of the copper ions complexes with rhamnolipids, MGDA and EDTA decreased with the increase of the system’s concentration. The increase of pH and the addition of KCl lowered the values of the stability constants of the complexes formed by rhamnolipids. The stability of complexes formed by MGDA and EDTA was not so sensitive to pH and ionic strength. The obtained values correspond to these presented in the literature, i.e., 18.8 for EDTA [27] and 13.9 for MGDA [28] at 25 °C and 100 mM ionic strength. The values of stability constants which were calculated for the 1:1 mixture of mono- and dirhamnolipids are also comparable to those presented by Hogan et al. [29] for dirhamnolipids (i.e., 7.43–11.10).
The obtained results show that the mixture of mono- and dirhamnolipids is a good alternative to other ‘green’ (MGDA) or classically used (EDTA) chelating agents. However, its effectiveness depends on the system composition and pH conditions.

3. Materials and Methods

3.1. The Chemicals Used

The rhamnolipid R-95 (the 1:1 mixture of mono- and dirhamnolipids with the HPLC purity; the mean molecular weight of 577 g mol−1, pKa = 5.6), methylglycinediacetic acid (MGDA; analytical grade, pKa = 14.6 [28]), ethylenediaminetetraacetic acid (EDTA; analytical grade), potassium chloride (KCl), copper (II) sulfate (CuSO4; analytical grade), potassium hydroxide (KOH; analytical grade), and sulfuric acid (H2SO4) were purchased from Sigma Aldrich (Poznan, Poland) company.
Distilled filtrated (0.2 µm Whatman filters; GE Healthcare UK Ltd., Little Chalfont, UK) water with the electrolytic conductivity of 0.001 ms cm–1 at 20 ± 0.1 °C) was used for the solutions preparation.

3.2. Estimation of the Rhamnolipid Critical Micelle Concentration (CMC)

The CMC of the rhamnolipid mixtures was determined at pH 5.5 and 6.0, with ionic strengths of 0 and 20 mM at 20 °C. The rhamnolipid solutions with a concentration range from 0.022 mM (12.9 mg L−1) to 0.330 mM (189 mg L−1) were prepared by the addition of an appropriate volume of 0.690 mM (400 mg L–1) stock solution to water or 20 mM KCl solution. The pH of the rhamnolipid stock solution, as well as the water and KCl solution was established by the addition of 0.1 M KOH or 0.1 M H2SO4 to avoid the systems dilution. The ionic strength was adjusted by the use of 3 M KCl solution. The electrolytic conductivity (CDM210 conductivity meter with a CDC866T four–ring platinum electrode; Radiometer Analytical SAS, Lyon, France) and pH (TitraLab® Titration Workstation D21T043 with a combined pH electrode; Radiometer Analytical SAS, Lyon, France) of rhamnolipid solutions were measured at 20 ± 1 °C in six replicates. The break points of the electrolytic conductivity and the pH vs. the rhamnolipid concentration curves were determined to estimate the CMC values.

3.3. Determination of the Particles Size and Electrophoretic Mobility in the Rhamnolipid Micellar Solutions

Micellar solutions of rhamnolipids (75.11 mg L−1, i.e., 0.130 mM and 150.21 mg L−1, i.e., 0.260 mM) at the ionic strength of 0 and 20 mM and pH 5.5 and 6.0 without and with the Cu2+ (1:1 molar ratio of Cu2+ to chelating agent) were characterized using the dynamic light scattering [30,31,32] and laser Doppler electrophoresis [33,34] methods. The measurements were carried out by means of a Zetasizer Nano ZS apparatus (Malvern Instruments Ltd., Malvern, UK) with the ‘size and zeta potential’ folded capillary cell in three repetitions at 20 °C. The viscosity (η) and the refractive index (RI) of the dispersant were those of pure water and 20 mM KCl solution (containing the appropriate amount of CuSO4), whereas RI of dispersed phase was that of the rhamnolipid’s saturated solution.
The mean hydrodynamic diameter dh,app of surfactant aggregates was obtained using the 173° backscatter detection. Additionally, their mean diameter was determined using the forward detection (12.8°). Results of size measurements were used for the aggregation index (AI) calculation. This index is defined as a difference between the ratio of hydrodynamic diameters obtained at forward and backscatter and the number 1 [35]. The higher the value of AI, the more the system is aggregated [35].
The samples’ heterogeneity in respect to the particle sizes was described by the polydispersity index (PDI). The lower the PDI, the more homogeneous the system [30].

3.4. The Evaluation of Rhamnolipids’ Ability to Form Cu2+ Chelates

Solutions of rhamnolipids, MGDA and EDTA were prepared, respectively, at concentrations of 0.014 mM, 0.065 mM, and 0.130 mM in pure water and 20 mM KCl at pH 5.5 and 6.0. In the case of rhamnolipids this was the concentration of the monorhamnolipid-dirhamnolipid pair (i.e., the molecular weight of 1154 g mol−1) possessing two –COOH groups. Next, the 0.001 M CuSO4 at pH = 5.686 and the known ionic strength (0 or 20 mM KCl) was added to these solutions to obtain the 16:100, 18:100, 20:100, 22:100, 25:100, 28:100, 33:100, 40:100, 50:100, 67:100, 1:1, and 2:1 Cu2+ to chelating agent molar ratios. The activity of free Cu2+ ions in solution was measured potentiometrically (Cole–Parmer Replaceable Membrane ISE Probe–Copper; Cole Palmer, Vernon Hills, IL, USA) in three replicates. The copper electrode was calibrated using the series of CuSO4 solutions at the ionic strengths adjusted to those of the studied samples. The pH of the Cu2+ and chelating agent solutions was determined (TitraLab® Titration Workstation D21T043 with a combined pH electrode; Radiometer Analytical SAS, Lyon, France) in six repetitions. To estimate the effect of CuSO4 hydrolysis on the solutions acidity and the Cu2+ ions content the pH of water and 20 mM KCl (pH 5.5 and 6.0) with the appropriate copper sulfate addition was measured.
All experiments were made at the temperature of 20 ± 1 °C.
Knowing the free Cu2+ ion concentration at a given CuSO4 content, the degree (%) of the metal binding was calculated at 1:1 metal ions to chelating agent molar ratio: β = [Cu2+fixed] × 100%/[CuSO4].
Considering that Cu2+ ions form with the rhamnolipids, MGDA and EDTA the complexes of MLn type (M + nL ↔ MLn), the complexing constants (logK, where: K = [MLn]/([Mfree][Lfree]n) were calculated at the 1:1 metal ions to chelating agent molar ratio.

4. Conclusions

The 1:1 mono- and dirhamnolipid mixtures form aggregates at 0.094 mM and 0.115 mM in pure aqueous solutions at pH 5.5 and 6.0, respectively. In 20 mM KCl the critical micelle concentration of these biosurfactants was equal to 0.057 mM at pH 5.5, and 0.098 mM at pH 6.0. The aggregates possessed the negative surface charge.
In the presence of Cu2+ ions the diameter of rhamnolipid micelles ranged from 43 to 89 nm, dependently on the dispersing medium composition. The biosurfactant was in a strongly aggregated state (small-sized particles with the high values of the aggregation index).
Rhamnolipids revealed the best chelating activities in the premicellar solutions (over 90% of Cu2+ ions were bonded; the stability constant range: 10.75–11.10), a lower in the strongly aggregated state (over 60% of Cu2+ ions were bonded; the stability constant range: 8.07–8.38) and the lowest ones at the concentration close to the CMC (over 50% of Cu2+ ions were immobilized; the stability constant about 8.50). The presence of K+ ions lowered the Cu2+ binding by rhamnolipids without the significant effect on the complexes’ stability. The degree of metal binding as well as the stability constants of complexes formed by all chelants decreased with the increasing concentration of systems.
The immobilization of Cu2+ by rhamnolipids did not lead to a significant increase of acidification, opposite to the effect observed in the MGDA and EDTA solutions. That was probably connected with the surfactant molecules’ aggregation and structural reorganization in solutions.
The mixture of mono- and dirhamnolipids can be an alternative for the usually used synthetic chelating agents. However, its effectiveness depends on the system composition and pH conditions.

Acknowledgments

The investigations were performed in a frame of Statutory Research and did not receive any specific grant from funding agencies.

Author Contributions

J.C. conceived and designed the experiments; M.K. performed the experiments; J.C. and M.K. analyzed the data; J.C. wrote the paper; and J.C., M.K. and A.B. reviewed and corrected the document.

Conflicts of Interest

The authors declare no conflict of interest. The founding sponsors had no role in the design of the study; in the collection, analyses, or interpretation of data; in the writing of the manuscript; or in the decision to publish the results.

References

  1. Hommel, R.K. Formation and function of biosurfactants for degradation of water-insoluble substrates. In Biochemistry of Microbial Degradation; Ratledge, C., Ed.; Springer: Dordrecht, The Netherlands, 1994; pp. 63–87. [Google Scholar]
  2. Bai, G.; Brusseau, M.L.; Miller, R.M. Influence of cation type, ionic strength, and pH on solubilization and mobilisation of residual hydrocarbon by a biosurfactant. J. Contam. Hydrol. 1998, 30, 265–279. [Google Scholar] [CrossRef]
  3. Müller, F.; Hönzke, S.; Luthardt, W.-O.; Wong, E.L.; Unbehauenb, M.; Bauer, J.; Haag, R.; Hedtrich, S.; Rühl, S.; Rademann, J. Rhamnolipids form drug-loaded nanoparticles for dermal drug delivery. Eur. J. Pharm. Biopharm. 2016, 116, 31–37. [Google Scholar] [CrossRef] [PubMed]
  4. Sinumvayo, J.P.; Ishimwe, N. Agriculture and Food Applications of Rhamnolipids and its Production by Pseudomonas Aeruginosa. J. Chem. Eng. Process. Technol. 2015, 6, 1–8. [Google Scholar] [CrossRef]
  5. Rodrigues, L.; Banat, I.M.; Teixeira, J.; Oliveira, R. Biosurfactants: Potential applications in medicine. J. Antimicrob. Chemother. 2006, 57, 609–618. [Google Scholar] [CrossRef] [PubMed] [Green Version]
  6. Asci, Y.; Nurbas, M.; Acikel, Y.S. A comparative study for the sorption of Cd(II) by soils with different clay contents and mineralogy and the recovery of Cd(II) using rhamnolipid biosurfactant. J. Hazard. Mater. 2008, 154, 663–673. [Google Scholar] [CrossRef] [PubMed]
  7. Juwarkar, A.A.; Dubey, K.V.; Nair, A.; Singh, S.K. Bioremediation of multi-metal contaminated soil using biosurfactant—A novel approach. Indian J. Microbiol. 2008, 48, 142–146. [Google Scholar] [CrossRef] [PubMed]
  8. Dahrazma, B.; Mulligan, C.N. Investigation of the removal of heavy metals from sediments using rhamnolipid in a continuous flow configuration. Chemosphere 2007, 69, 705–711. [Google Scholar] [CrossRef] [PubMed]
  9. Wang, S.; Mulligan, C.N. Rhamnolipid foam enhanced remediation of cadmium and nickel contaminated soil. Water Air Soil Pollut. 2004, 157, 315–330. [Google Scholar] [CrossRef]
  10. Nowack, B.; VanBriesen, J.M. Chelating agents in the environment. In Biogeochemistry of Chelating Agents; Nowack, B., VanBriesen, J.M., Eds.; ACS Symposium Series: Washington, DC, USA, 2005; pp. 1–18. [Google Scholar]
  11. Sillanpää, M.; Oikari, A. Assessing the impact of complexation by EDTA and DTPA on heavy metal toxicity using microtox bioassay. Chemosphere 1996, 32, 1485–1497. [Google Scholar] [CrossRef]
  12. Cao, A.; Carucci, A.; Lai, T.; La Colla, P.; Tamburini, E. Effect of biodegradable chelating agents on heavy metals phytoextraction with Mirabilis jalapa and on its associated bacteria. Eur. J. Soil Biol. 2007, 43, 200–206. [Google Scholar] [CrossRef]
  13. Kos, B.; Lestan, D. Influence of a biodegradable ([S,S]-EDDS) and nondegradable (EDTA) chelate and hydrogel modified soil water sorption capacity on Pb phytoextraction and leaching. Plant Soil 2003, 253, 403–411. [Google Scholar] [CrossRef]
  14. Jachuła, J.; Kołodyńska, D.; Hubicki, Z. Methylglycinediacetic acid as a new complexing agent for removal of heavy metal ions from industrial wastewater. Solvent Extr. Ion Exch. 2012, 30, 181–196. [Google Scholar] [CrossRef]
  15. Jessop, P.G.; Ahmadpour, F.; Buczynski, M.A.; Burns, T.J.; Green, N.B., II; Korwin, R.; Long, D.; Massad, S.K.; Manley, J.B.; Omidbakhsh, N.; et al. Opportunities for greener alternatives in chemical formulations. Green Chem. 2015, 17, 2664–2678. [Google Scholar] [CrossRef]
  16. Deshpande, P.; Dapkekar, A.; Oak, M.D.; Paknikar, K.M.; Rajwade, J.M. Zinc complexed chitosan/TPP nanoparticles: A promising micronutrient nanocarrier suited for foliar application. Carbohydr. Polym. 2017, 165, 394–401. [Google Scholar] [CrossRef] [PubMed]
  17. Jaeger, T.; Rothmaier, M.; Zander, H.; Ring, J.; Gutermuth, J.; Anliker, M.D. Acid-coated Textiles (pH 5.5–6.5)—A New Therapeutic Strategy for Atopic Eczema? Acta Derm. Venereol. 2015, 95, 659–663. [Google Scholar] [CrossRef] [PubMed]
  18. Rosen, M.J.; Kunjappu, J.T. Micelle Formation by Surfactants. In Surfactants and Interfacial Phenomena, 4th ed.; Rosen, M.J., Kunjappu, J.T., Eds.; John Wiley & Sons, Inc.: Hoboken, NJ, USA, 2012; pp. 123–201. [Google Scholar]
  19. Sánchez, M.; Aranda, F.J.; Espuny, M.J.; Marqués, A.; Teruel, J.A.; Manresa, A.; Ortiz, A. Aggregation behaviour of a dirhamnolipid biosurfactant secreted by Pseudomonas aeruginosa in aqueous media. J. Colloid Interface Sci. 2007, 307, 246–253. [Google Scholar]
  20. Özdemir, G.; Peker, S.; Helvaci, S.S. Effect of pH on the surface and interfacial behavior of rhamnolipids R1 and R2. Colloids Surf. A Physicochem. Eng. Asp. 2004, 234, 135–143. [Google Scholar] [CrossRef]
  21. Helvaci, S.S.; Peker, S.; Özdemir, G. Effect of electrolytes on the surface behavior of rhamnolipids R1 and R2. Colloids Surf. B Biointerfaces 2004, 35, 225–233. [Google Scholar] [CrossRef] [PubMed]
  22. Cieśla, J.; Bieganowski, A.; Narkiewicz-Michałek, J.; Szymula, M. Use of dynamic light scattering technique for SDS/water/pentanol studies. J. Disper. Sci. Technol. 2013, 34, 566–574. [Google Scholar] [CrossRef]
  23. Zhang, W.; Li, G.; Mu, J.; Shen, Q.; Zheng, L.; Liang, H.; Wu, C. Effect of KBr on the micellar properties of CTAB. Chin. Sci. Bull. 2000, 45, 1854–1857. [Google Scholar] [CrossRef]
  24. Dahrazma, B.; Mulligan, C.N.; Nieh, M.-P. Effects of additives on the structure of rhamnolipid (biosurfactant): A small-angle neutron scattering (SANS) study. J. Colloid Interface Sci. 2008, 319, 590–593. [Google Scholar] [CrossRef] [PubMed]
  25. Raza, Z.A.; Khalid, Z.M.; Khan, M.S.; Banat, I.M.; Rehman, A.; Naeem, A.; Saddique, M.T. Surface properties and sub-surface aggregate assimilation of rhamnolipid surfactants in different aqueous systems. Biotechnol. Lett. 2010, 32, 811–816. [Google Scholar] [CrossRef] [PubMed]
  26. Hunter, R.J. The Calculation of Zeta Potential. In Zeta Potential in Colloid Science, Principles and Applications, 1st ed.; Academic Press: London, UK, 1988; pp. 59–124. [Google Scholar]
  27. Pinto, I.S.; Neto, I.F.; Soares, H.M. Biodegradable chelating agents for industrial, domestic, and agricultural applications—A review. Environ. Sci. Pollut. Res. 2014, 21, 11893–11906. [Google Scholar] [CrossRef] [PubMed]
  28. BASF. Technical Information Ti/EVD 1418 e—Trilon® M Types; BASF: Ludwigshafen, Germany, 2007. [Google Scholar]
  29. Hogan, D.E.; Curry, J.E.; Pemberton, J.E.; Maier, R.M. Rhamnolipid biosurfactant complexation of rare earth elements. J. Hazard. Mater. 2017, 340, 171–178. [Google Scholar] [CrossRef] [PubMed]
  30. ISO 13321. Particle Size Analysis—Photon Correlation Spectroscopy, International Organization for Standardization; ISO: Geneva, Switzerland, 1996. [Google Scholar]
  31. Kaszuba, M.; McKnight, D.; Connah, M.T.; McNeil-Watson, F.K.; Nobbmann, U. Measuring sub nanometre sizes using dynamic light scattering. J. Nanopart. Res. 2008, 10, 823–829. [Google Scholar] [CrossRef]
  32. Pecora, R. Dynamic Light Scattering Measurement of Nanometer Particles in Liquids. J. Nanopart. Res. 2000, 2, 123–131. [Google Scholar] [CrossRef]
  33. Malvern Instruments. Zetasizer Nano Series User Manual, MAN0317; Issue 1.1; Malvern Instruments Ltd.: Malvern, UK, 2004. [Google Scholar]
  34. Mayinger, F. (Ed.) Optical Measurements Techniques and Applications; Springer: Berlin, Germany, 1994. [Google Scholar]
  35. Malvern Instruments. Zetasizer Nano Application Note, Enhanced Protein Aggregation Detection Using Dual Angle Dynamic Light Scattering, MRK1441-01; Malvern Instruments Ltd.: Malvern, UK, 2010. [Google Scholar]
Sample Availability: Samples of the compounds rhamnolipids, methylglycinediacetic acid and ethylenediaminetetraacetic acid are not available from the authors.
Figure 1. The structures of (a) monorhamnolipid; (b) dirhamnolipid; (c) ethylenediaminetetraacetic acid (EDTA); and (d) methylglycinediacetic acid (MGDA).
Molecules 23 00488 g001
Figure 2. Dependence of electrolytic conductivity (EC) and pH on the rhamnolipids (Rh) concentration in water (a,c) and KCl solution (b,d) at pH 5.5 (a,b) and 6.0 (c,d); bars represent standard deviation.
Molecules 23 00488 g002
Figure 3. (a) Hydrodynamic diameter (dh,app); (b) polydispersity index (PDI); (c) aggregation index (AI); and (d) electrophoretic mobility (EM), which were determined in micellar solutions of rhamnolipids (Rh) in water and 20 mM KCl at pH 5.5 and 6.0 without and with the presence of Cu2+ ions (at the 1:1 Cu2+ to rhamnolipid molar ratio).
Molecules 23 00488 g003
Figure 4. Dependence of pH and pCufixed (the negative logarithm of the concentration of Cu2+ ions fixed by chelating agent) on the Cu2+ to chelating agent molar ratio (nCu:nchelating agent) in water (a,c,e) and KCl solution (b,d,f) at pH 5.5; (a,b) rhamnolipids (Rh); (c,d) methylglycinediacetic acid (MGDA); and (e,f) ethylenediaminetetraacetic acid (EDTA); CMCRh means the rhamnolipids’ critical micelle concentration.
Molecules 23 00488 g004
Figure 5. Dependence of pH and pCufixed (the negative logarithm of the concentration of Cu2+ ions fixed by chelating agent) on the Cu2+ to chelating agent molar ratio (nCu:nchelating agent) in water (a,c,e) and KCl solution (b,d,f) at pH 6.0; (a,b) rhamnolipids (Rh); (c,d) methylglycinediacetic acid (MGDA); and (e,f) ethylenediaminetetraacetic acid (EDTA); CMCRh means the rhamnolipids’ critical micelle concentration.
Molecules 23 00488 g005
Table 1. The critical micelle concentration (CMC) of 1:1 mono- and dirhamnolipid mixtures in water and 20 mM KCl solutions at pH 5.5 and 6.0.
pHAnalyzed PropertyThe CMC Determined in:
H2O20 mM KCl
mg L–1mMmg L–1mM
5.5pH42.460.07432.140.056
EC ##66.390.11534.040.059
54.42 *0.094 *33.09 *0.057 *
6.0pH69.640.11258.280.101
EC ##68.090.11855.390.096
68.86 *0.115 *56.83 *0.098 *
* The mean value of CMC; ## EC means electrolytic conductivity.
Table 2. Amount of Cu2+ ions (%) immobilized by the analyzed compounds at a 1:1 molar ratio of Cu2+ to chelating agent in the different dispersing media, pH, and concentration applied.
pHSubstanceH2O20 mM KCl
C < CMCRhC = CMCRhC > CMCRhC < CMCRhC = CMCRhC > CMCRh
5.5Rhamnolipids95.82 ± 0.1253.61 ± 1.3777.63 ± 0.4491.37 ± 0.5151.72 ± 0.8463.13 ± 1.34
MGDA98.24 ± 0.0393.50 ± 0.0383.08 ± 0.0998.58 ± 0.0193.86 ± 0.0182.63 ± 0.17
EDTA92.37 ± 0.2091.28 ± 0.2873.34 ± 0.2198.44 ± 0.0391.54 ± 0.1581.65 ± 6.60
6.0Rhamnolipids93.66 ± 0.1864.06 ± 0.9868.08 ± 0.5858.08 ± 0.6754.46 ± 0.4758.83 ± 1.27
MGDA98.47 ± 0.0392.83 ± 0.0286.32 ± 0.0998.58 ± 0.0093.85 ± 0.0185.96 ± 0.18
EDTA95.13 ± 0.3485.76 ± 0.1479.23 ± 0.2098.58 ± 0.0092.52 ± 0.0882.78 ± 0.12
MGDA means methylglycinediacetic acid; EDTA means ethylenediaminetetraacetic acid; C means the chelating agent concentration; CMCRh is the rhamnolipids’ critical micelle concentration.
Table 3. The stability constants of complexes formed by Cu2+ ions and the analyzed compounds at a 1:1 molar ratio of Cu2+ to chelating agent in the different dispersing media, pH, and concentration applied.
pHSubstanceH2O20 mM KCl
C < CMCRhC = CMCRhC > CMCRhC < CMCRhC = CMCRhC > CMCRh
5.5Rhamnolipids11.10 ± 0.018.50 ± 0.028.38 ± 0.0110.75 ± 0.038.48 ± 0.018.07 ± 0.03
MGDA14.86 ± 0.0112.30 ± 0.0010.93 ± 0.0014.95 ± 0.0012.33 ± 0.0010.92 ± 0.00
EDTA18.22 ± 0.0115.53 ± 0.0113.75 ± 0.0018.93 ± 0.0115.57 ± 0.0113.95 ± 0.15
6.0Rhamnolipids10.51 ± 0.018.29 ± 0.027.77 ± 0.019.50 ± 0.018.12 ± 0.017.60 ± 0.02
MGDA14.91 ± 0.0312.24 ± 0.0011.03 ± 0.0014.94 ± 0.0012.31 ± 0.0011.02 ± 0.00
EDTA18.26 ± 0.0115.12 ± 0.0013.72 ± 0.0018.81 ± 0.0015.43 ± 0.0013.82 ± 0.00
MGDA means methylglycinediacetic acid; EDTA means ethylenediaminetetraacetic acid; C means the chelating agent concentration; CMCRh is the rhamnolipids’ critical micelle concentration.

