Article

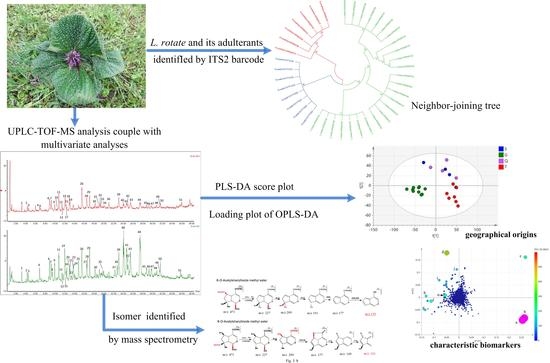
Lamiophlomis rotata Identification via ITS2 Barcode and Quality Evaluation by UPLC-QTOF-MS Couple with Multivariate Analyses

1
College of Traditional Chinese Medicine, Chongqing Medical University, Chongqing 400016, China
2
Chongqing Key Laboratory of Traditional Chinese Medicine for Prevention and Cure of Metabolic Diseases, Chongqing 400016, China
3
School of Bio-information, Chongqing University of Post and Telecommunications, Chongqing 400065, China
4
Chongqing Academy of Chinese Materia Medica, Chongqing 404000, China
5
College of Ethnic Medicine, Chengdu University of Traditional Chinese Medicine, Chengdu 611130, China
6
Institute of Medicinal Plant Development, Chinese Academy of Medical Sciences, Peking Union Medical College, Beijing 100700, China
*
Author to whom correspondence should be addressed.
Molecules 2018, 23(12), 3289; https://doi.org/10.3390/molecules23123289
Submission received: 9 October 2018 / Revised: 2 December 2018 / Accepted: 5 December 2018 / Published: 11 December 2018
(This article belongs to the Section Natural Products Chemistry)

Abstract

:
Lamiophlomis rotata (L. rotata), is known as “Daba” in the Tibetan region, Ajuga ovalifolia and Oreosolen wartii have also been utilized as substitutes for “Daba”, however, only L. rotata has been officially listed in the Chinese Pharmacopoeia for hemostasis preparations. To safely apply the traditional uses of the herb, internal transcribed spacer 2 (ITS2) DNA barcodes were employed to discriminate L. rotata from its adulterants. For further evaluation of the quality of different originating habitats, the chemical profiles of 25 samples were determined by ultra-high-performance liquid chromatography coupled with time-of-flight mass spectrometry (UPLC-QTOF-MS) coupled with multivariate analyses. ITS2 DNA barcodes differentiated L. rotata from O. wartii and A. ovalifolia accurately. A neighbor-joining (NJ) tree showed that three origins clustered into three clades. Forty-nine compounds were identified in the total ion current (TIC) profile of L. rotata. Additionally, two pairs of isomers were identified for the first time by using mass spectrometry fragmentation. The differences between the variable habitats were determined by multivariate statistical analysis of the UPLC-QTOF-MS data from 25 specimens. Ten compounds were identified as the characteristic markers distinguishing the sample from four geographical origins. The results also suggest that samples from Qinghai and Sichuan province would be the most suitable choice for traditional prescriptions and preparations.

Graphical Abstract

1. Introduction

Lamiophlomis rotata (Benth.) kudo (L. rotata), a plant growing at high altitude in China, has been used to treat rheumatic arthritis and grasserie for more than 2000 years in the Traditional Tibetan System (TTS). It is known as “Daba” and “Dabuba” in the TTS, additionally, Ajuga ovalifolia (A. ovalifolia) and Oreosolen wartii (O. wartii) have been utilized as substitutes for Daba in the TTS [1]. However, after extensive clinical use and investigation, only L. rotata (Duyiwei in Chinese) was officially listed in the Chinese Pharmacopoeia in 1989 for hemostasis and analgesic preparations [2], such as Duyiwei Capsules, Duyiwei Pills, Qizheng Xiaotong Plaster, etc. The herb has been, and continues to be, used for different therapeutic purposes in various folk medicines. Therefore, a method for simple and accurate identification of L. rotata is necessary to assure efficacy and biosafety. A number of publications using morphological, histological, and molecular biological methods for species identification of L. rotata or O. wartii origin have been reported [3,4,5]. Nevertheless, few of these methods are aimed at distinguishing L. rotata from O. wartii and A. ovalifolia.
Recently, internal transcribed spacer (ITS) DNA barcodes have been developed for the identification of plant species. Among these DNA barcodes, ITS2, being part of ITS, is relatively easy to be amplified using one pair of universal primers, and is one of the best performing barcodes identified for medicinal plants thus far [6,7,8,9]. In the current study, we utilized ITS2 as a DNA barcode to differentiate the three medicinal plants in order to ensure safe application of L. rotata in traditional uses.
Raw plant materials used for medicinal products from different geographical regions are often inconsistent in chemical composition [10]. Although ITS2 may distinguish L. rotata from its adulterants; this technique failed to assay the variability of bioactive chemical in L. rotata from different habitats. Dozens of compounds have been found in the herb, with principal efficiency ingredients being iridoids, flavonoids, and phenylethanoids [11,12,13]. Since 2005, Luteolin and total flavonoids have been used for the quality control of the herb preparations in the Chinese Pharmacopoeia [14]. Consequently, various methods have been developed to qualitatively and quantitatively analyze flavonoids to measure the quality of L. rotata and its preparations [15,16]. In 2010, shanzhiside methyl ester and 8-O-acetyl shanzhiside ethyl ester were selected as the marker compound for quality control of the herb. Additionally, total flavonoids has also been used to reasonably control the quality of preparations [17]. Therefore, a series of analytical methods have also been developed for quantitative analyses of iridoid glycosides over the last ten years [18,19,20,21]. However, these methods may cause confusion when investigating the similarity and variability in samples from different geographical origins, because of quantification according to different quality standards with one or few marker compounds. In view of the above reasons, it is necessary to achieve comprehensive chemical composition analyses to evaluate the variability in L. rotata from different geographical origins.
To achieve the second goal, a method using ultra-high-performance liquid chromatography coupled with time-of-flight mass spectrometry (UPLC-QTOF-MS) was developed, and a metabolomic approach was employed with principal component analysis (PCA) and partial least-squares discriminant analysis (PLS-DA). The UPLC-QTOF-MS data were assayed to characterize components in L. rotata from different geographical regions, and to further explore the relationship between different samples to ensure the intended therapeutic effects.

2. Results

2.1. Measurement of DNA Divergence for ITS2

2.1.1. Sequence and Inter-/Intra-Specific Variation Analysis

ITS2 segments were successfully extracted from all samples. The polymerase chain reaction (PCR) amplification success rates for ITS2 were 100%. All PCR products were successfully sequenced, and high-quality bidirectional sequences were obtained.
The sequence characteristics are summarized in Table 1. The average G-C contents of the ITS2 sequences in L. rotata and A. ovalifolia were 70% to 72% and 65%. ITS2 sequences of L. rotata ranged from 0 bp to 219 bp with five variable sites; five haplotypes were identified from 25 samples. ITS2 sequences of A. ovalifolia ranged from 0 bp to 229 bp with three variable sites, and three haplotypes were identified. In general, gene segments are available when the minimum inter-specific distances are larger than the maximum intra-specific distances by the Kimura 2-Parameter (K2P) model. In this experiment, the minimum inter-specific distances were 0.258 cM, and the maximum intra-specific distances were 0.021 cM (Table 1). Therefore, the ITS2 region could be an ideal barcode for discriminating the three origins of L. rotata, A. ovalifolia, and O. wartii.

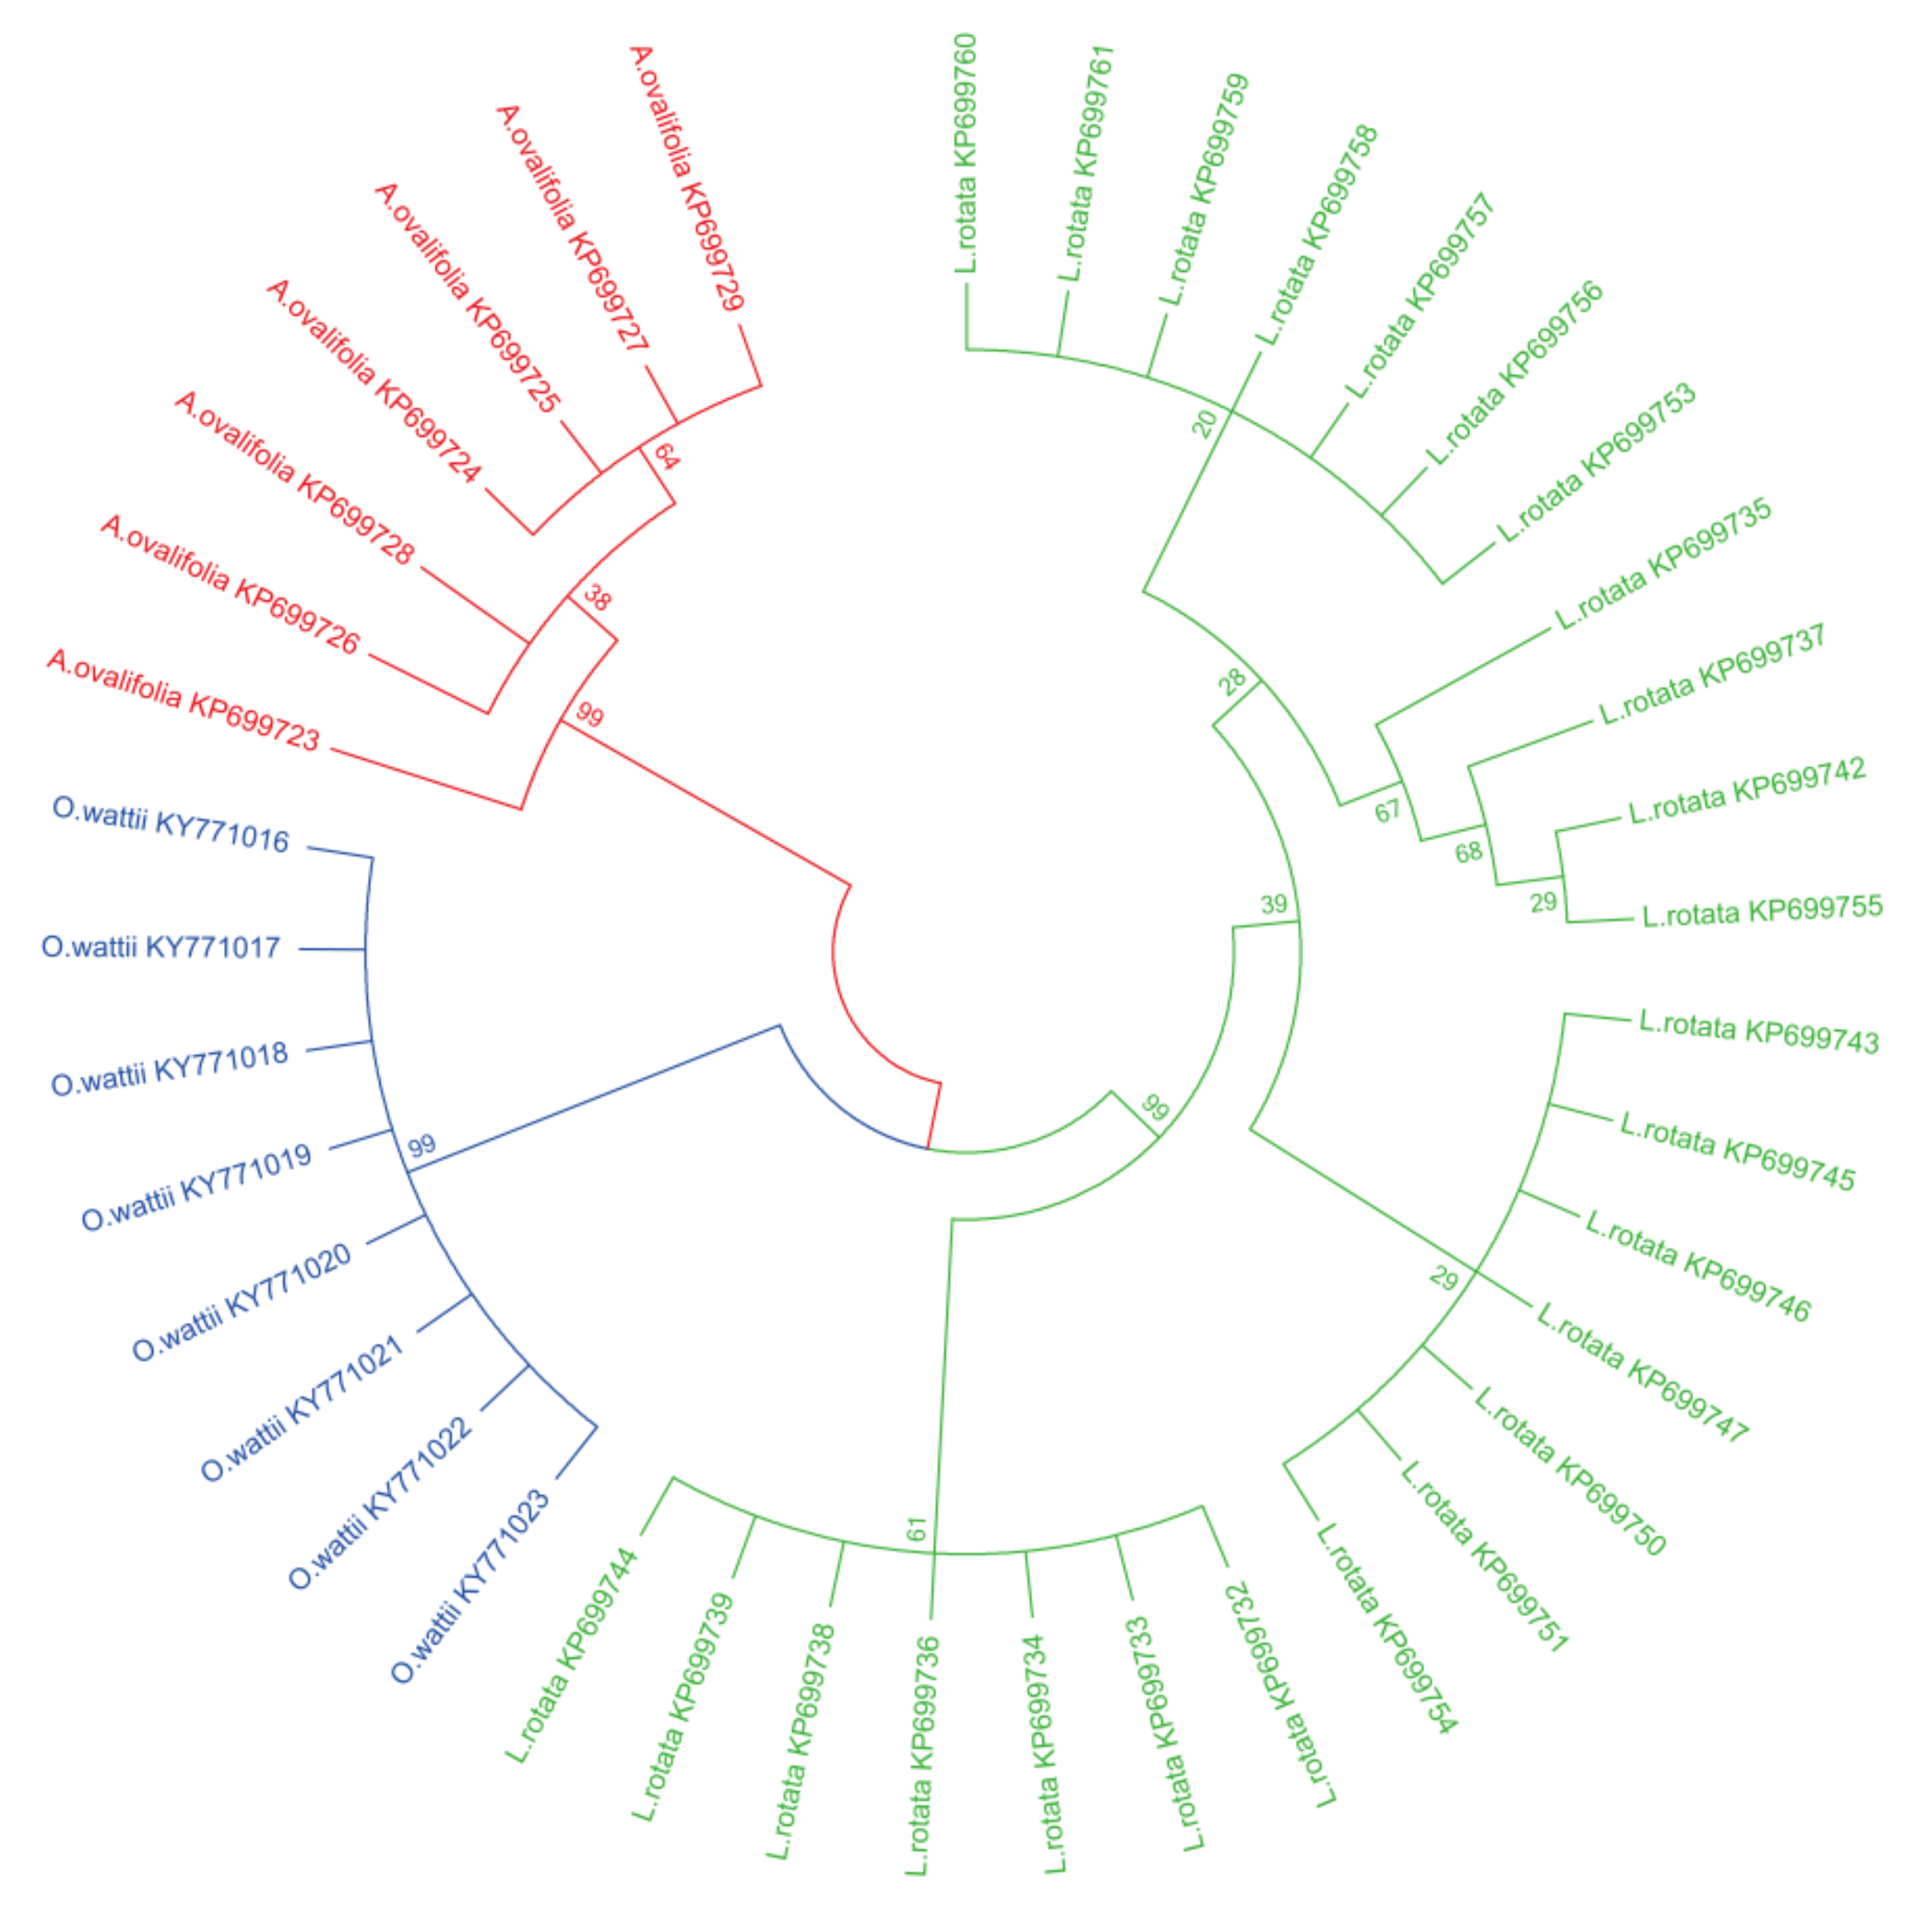
2.1.2. Neighbor-Joining (NJ) Tree Analysis

In this study, a phylogenetic tree was constructed using the neighbor-joining (NJ) method, with 1000 bootstrap replicates for ITS2 regions (Figure 1). All species were clearly identified, including the medicinal and non-medicinal species. Each of the three species is in one branch of the phylogenetic tree. Specifically, the NJ tree also showed that all samples of L. rotata were clustered into three subgroups according to their geographical origins. The samples from Tibet, and Gansu, are gathered into one branch each and the samples of Sichuan and Qinghai are gathered together into another branch.

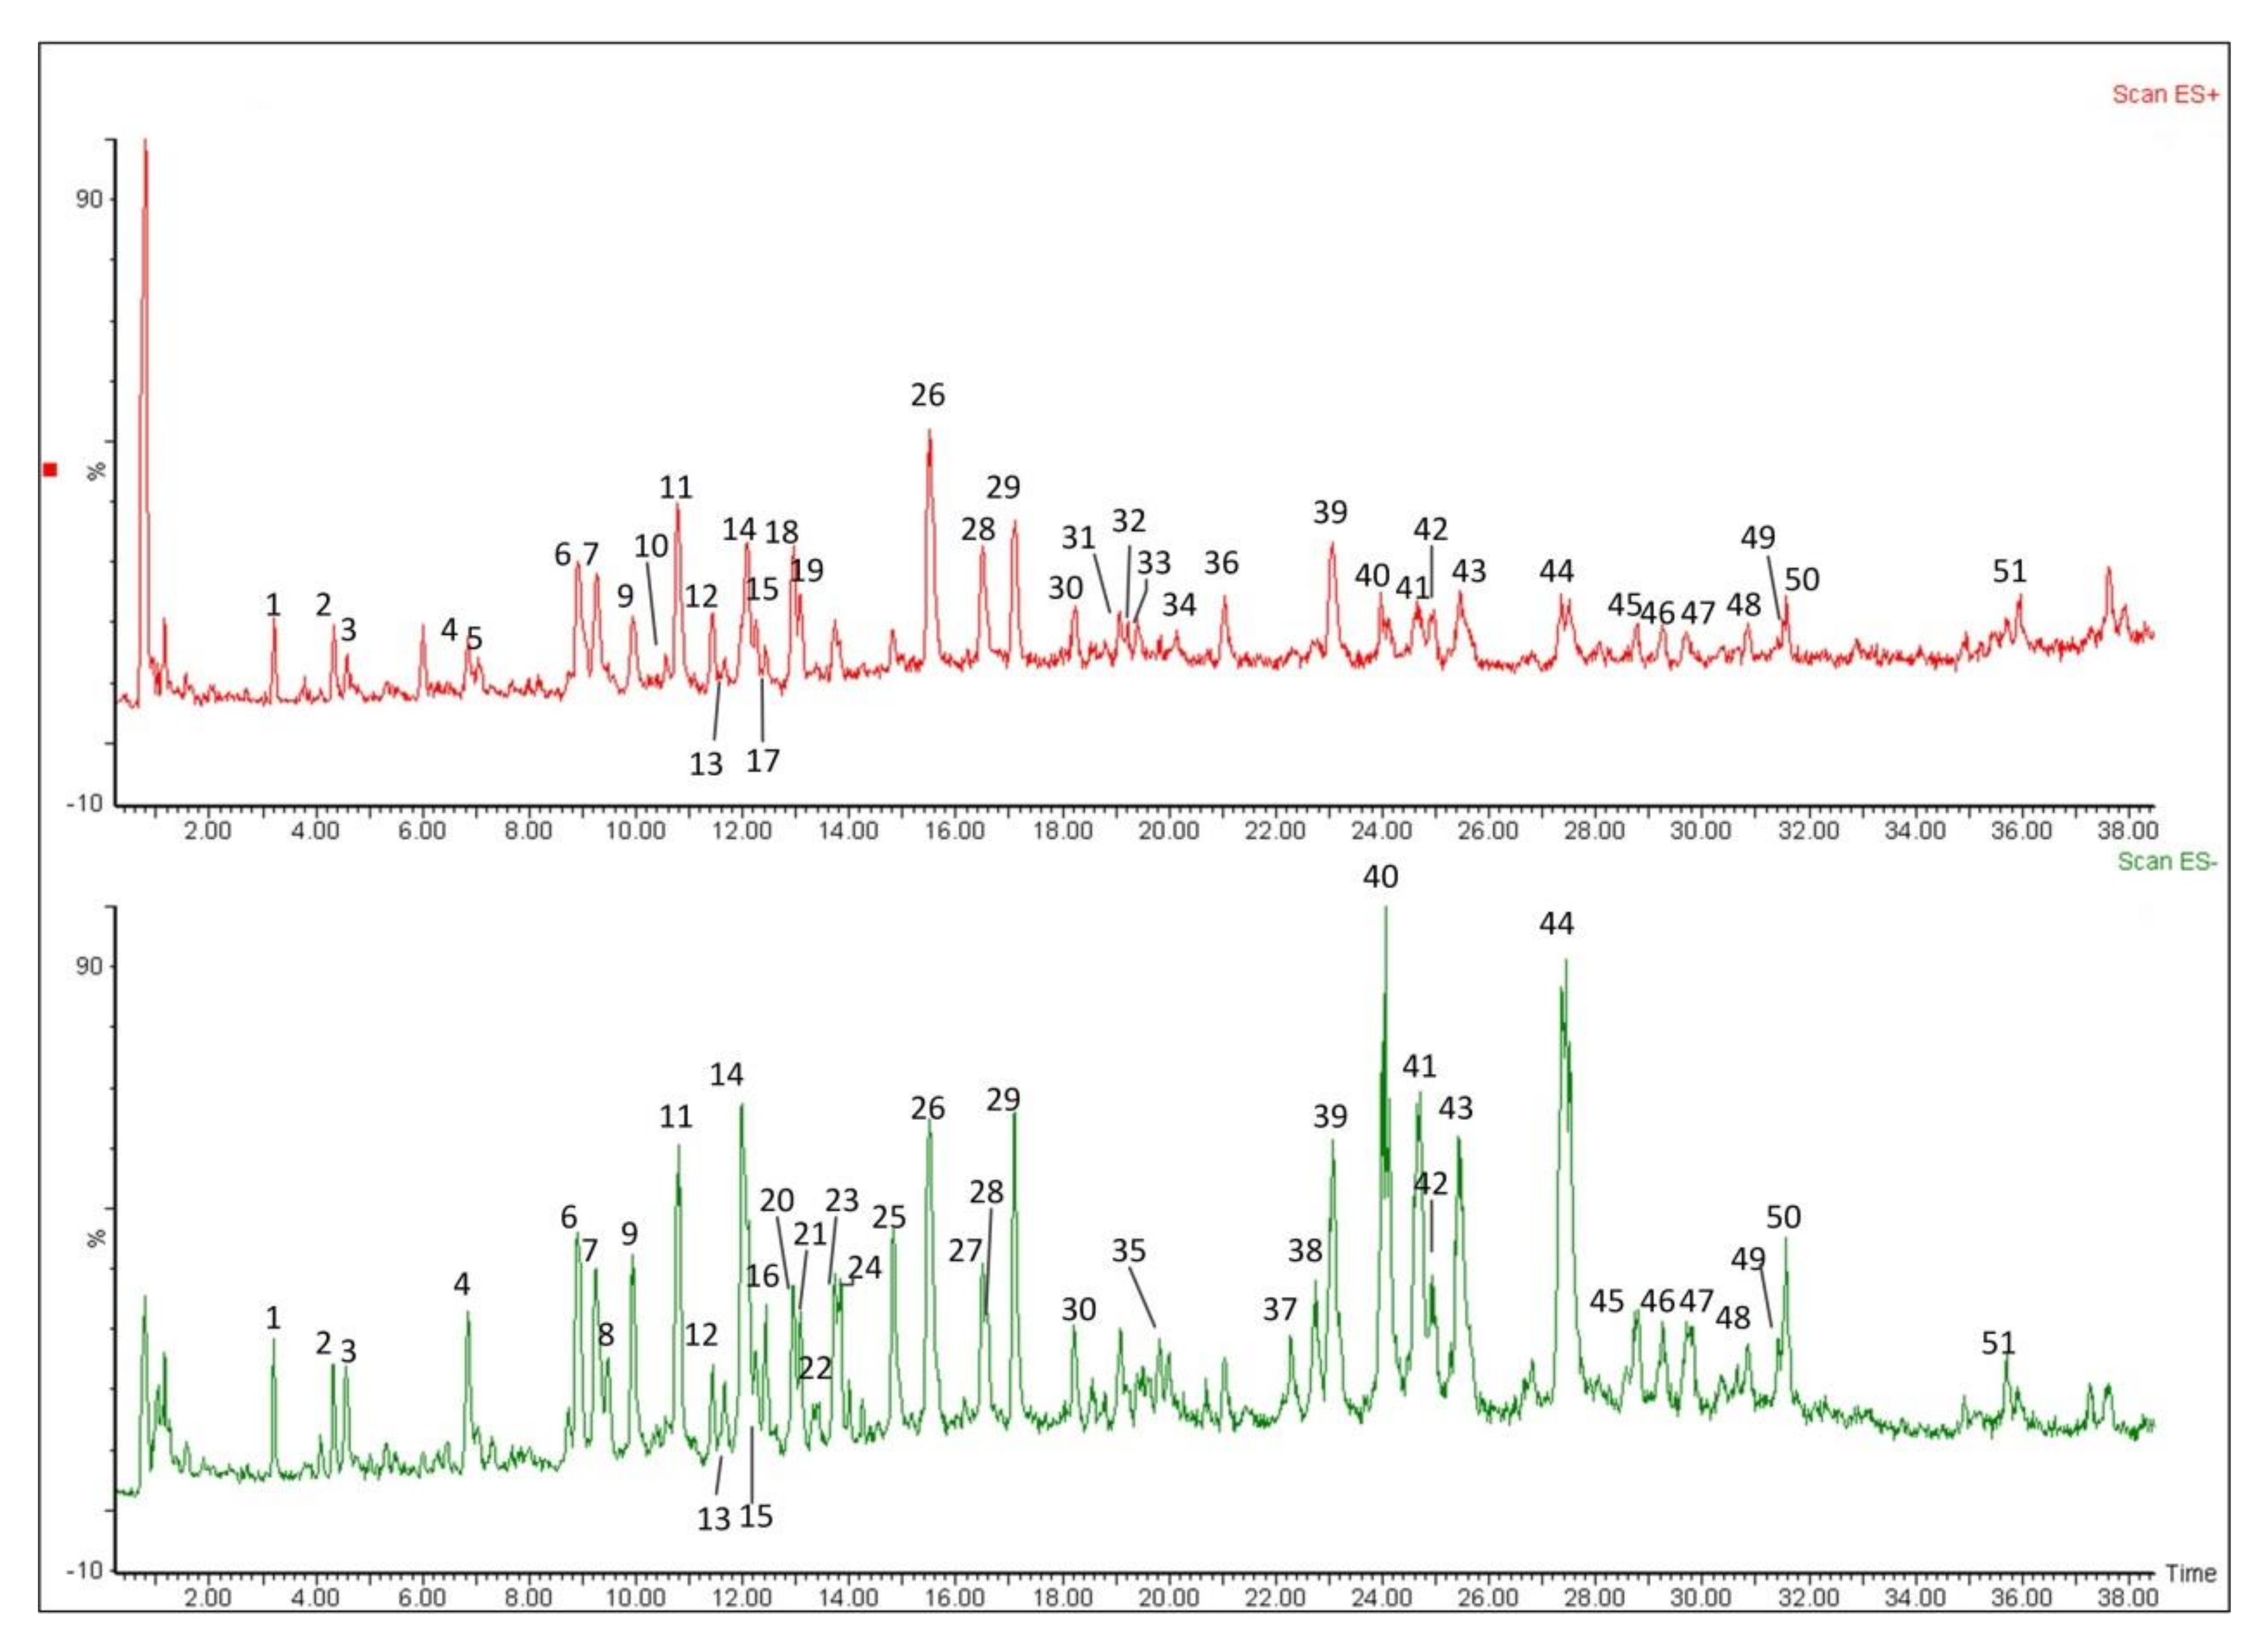
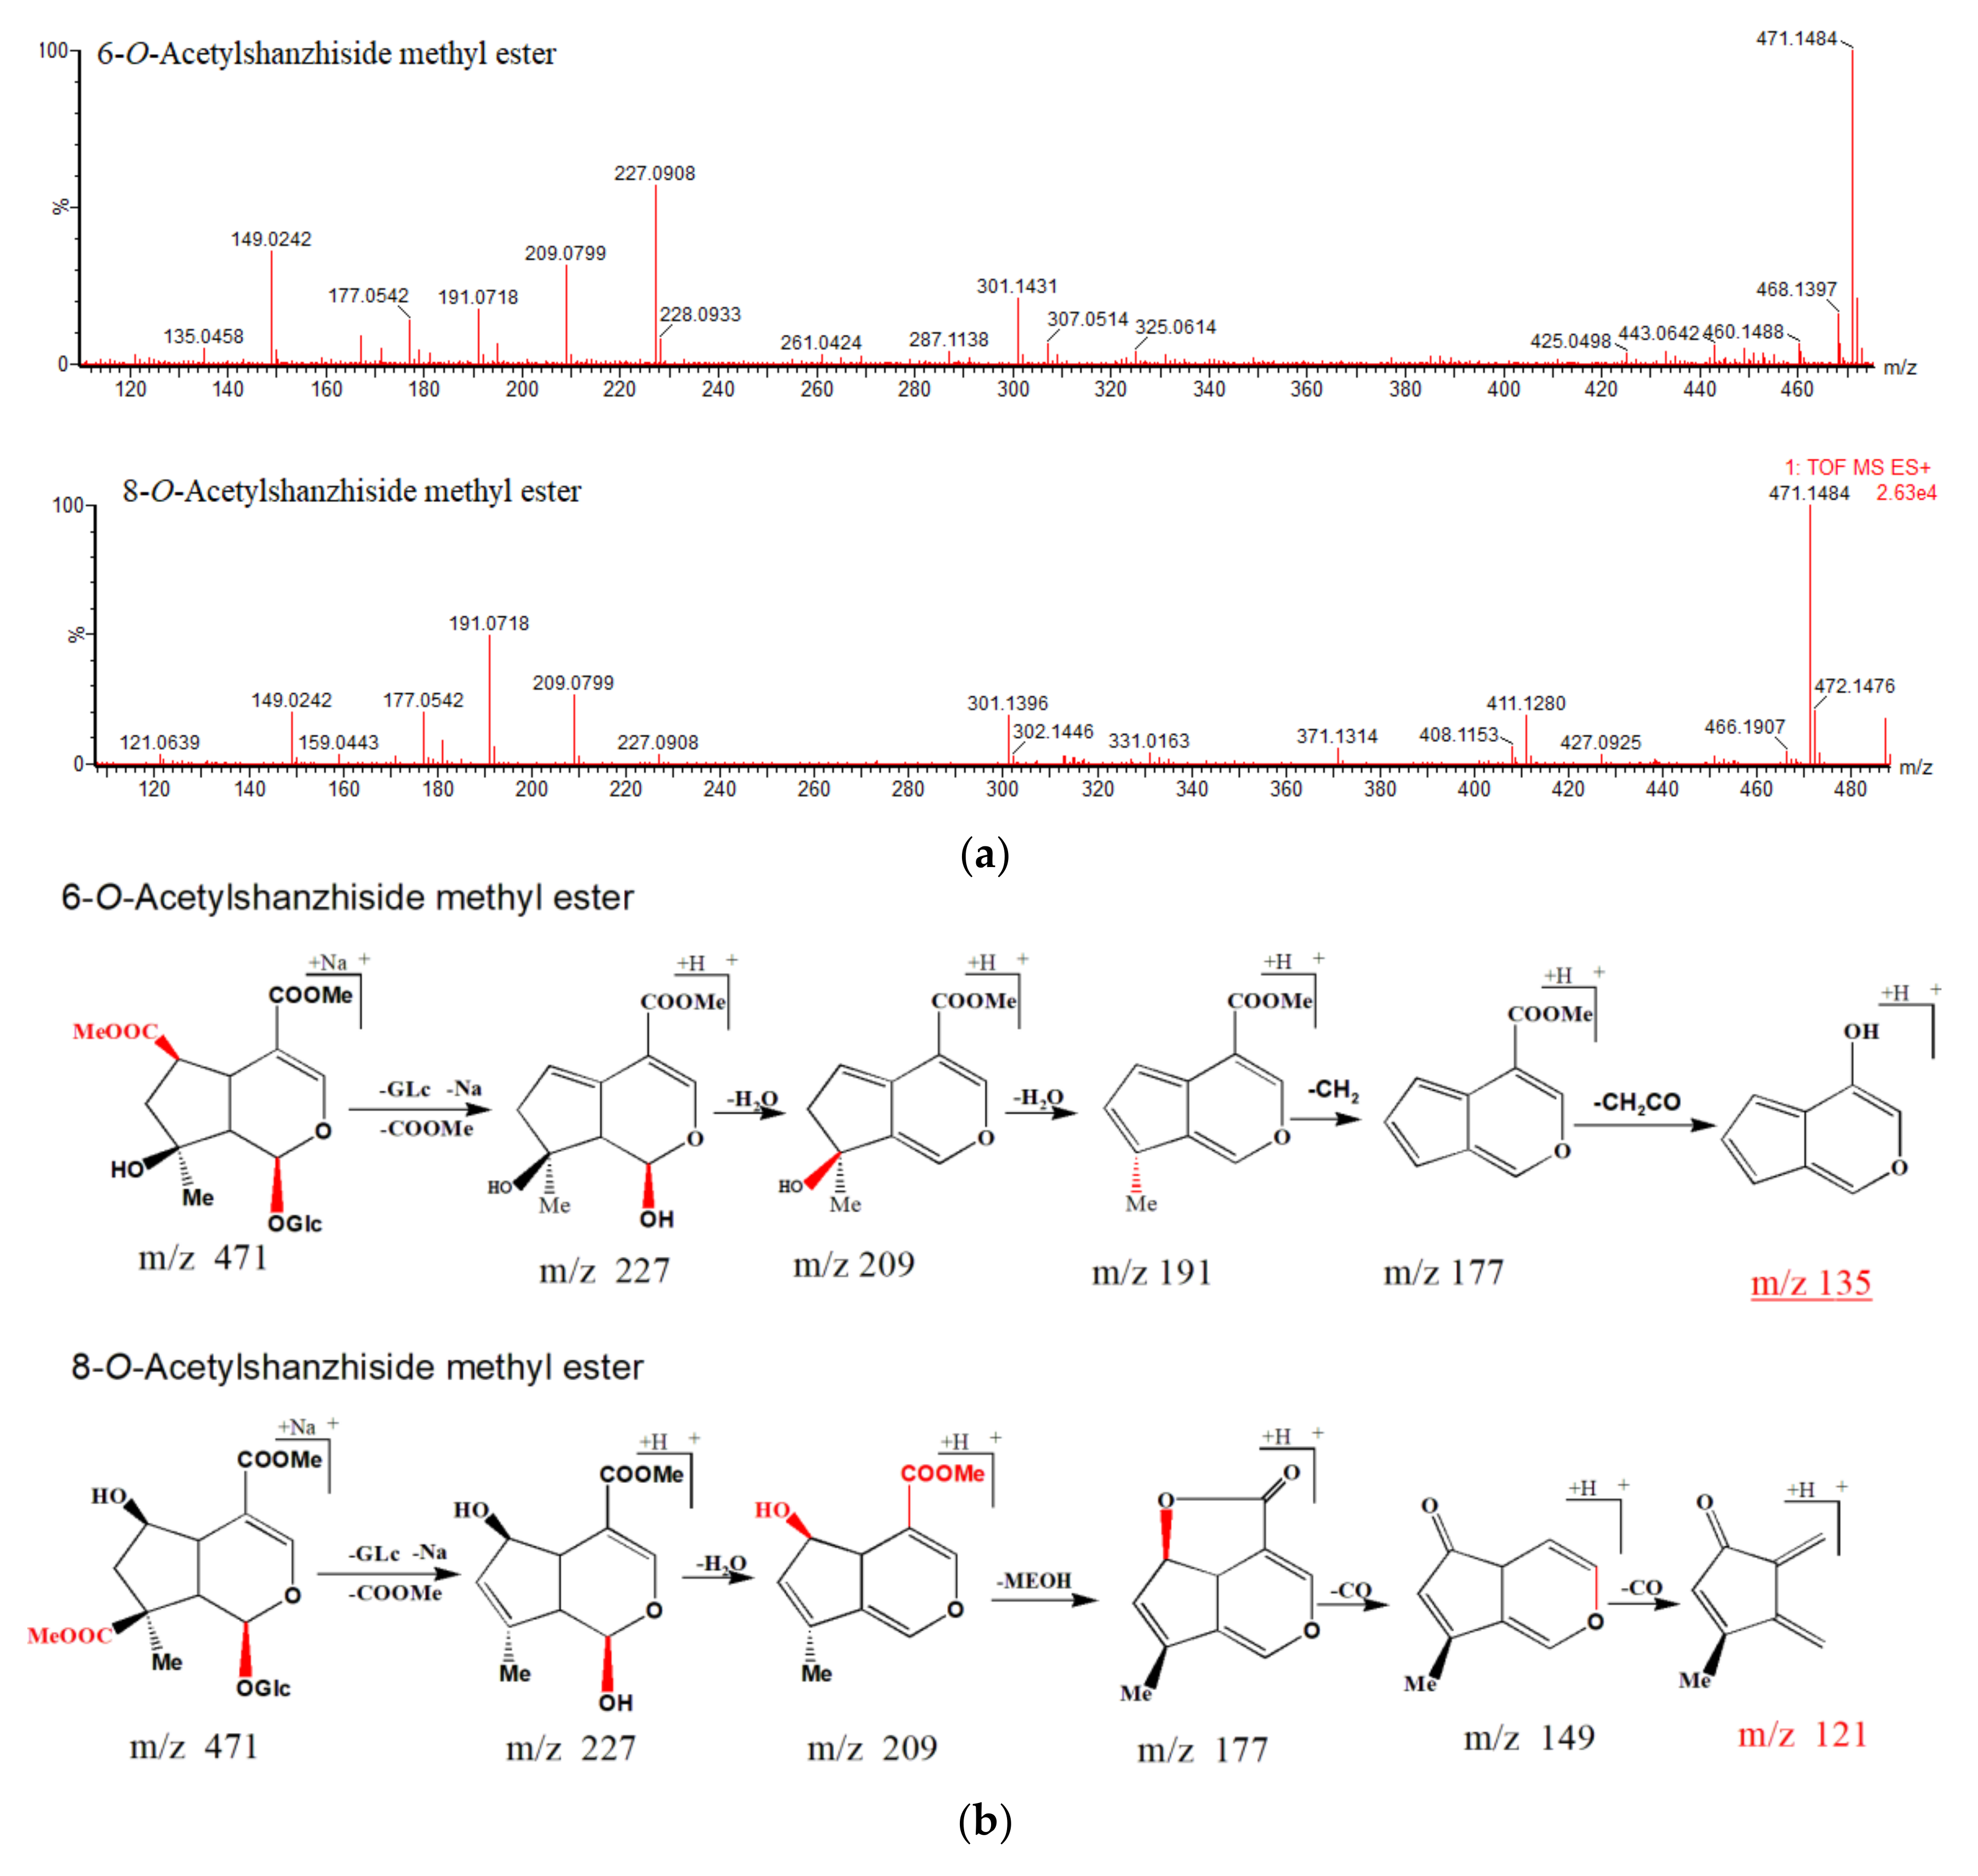
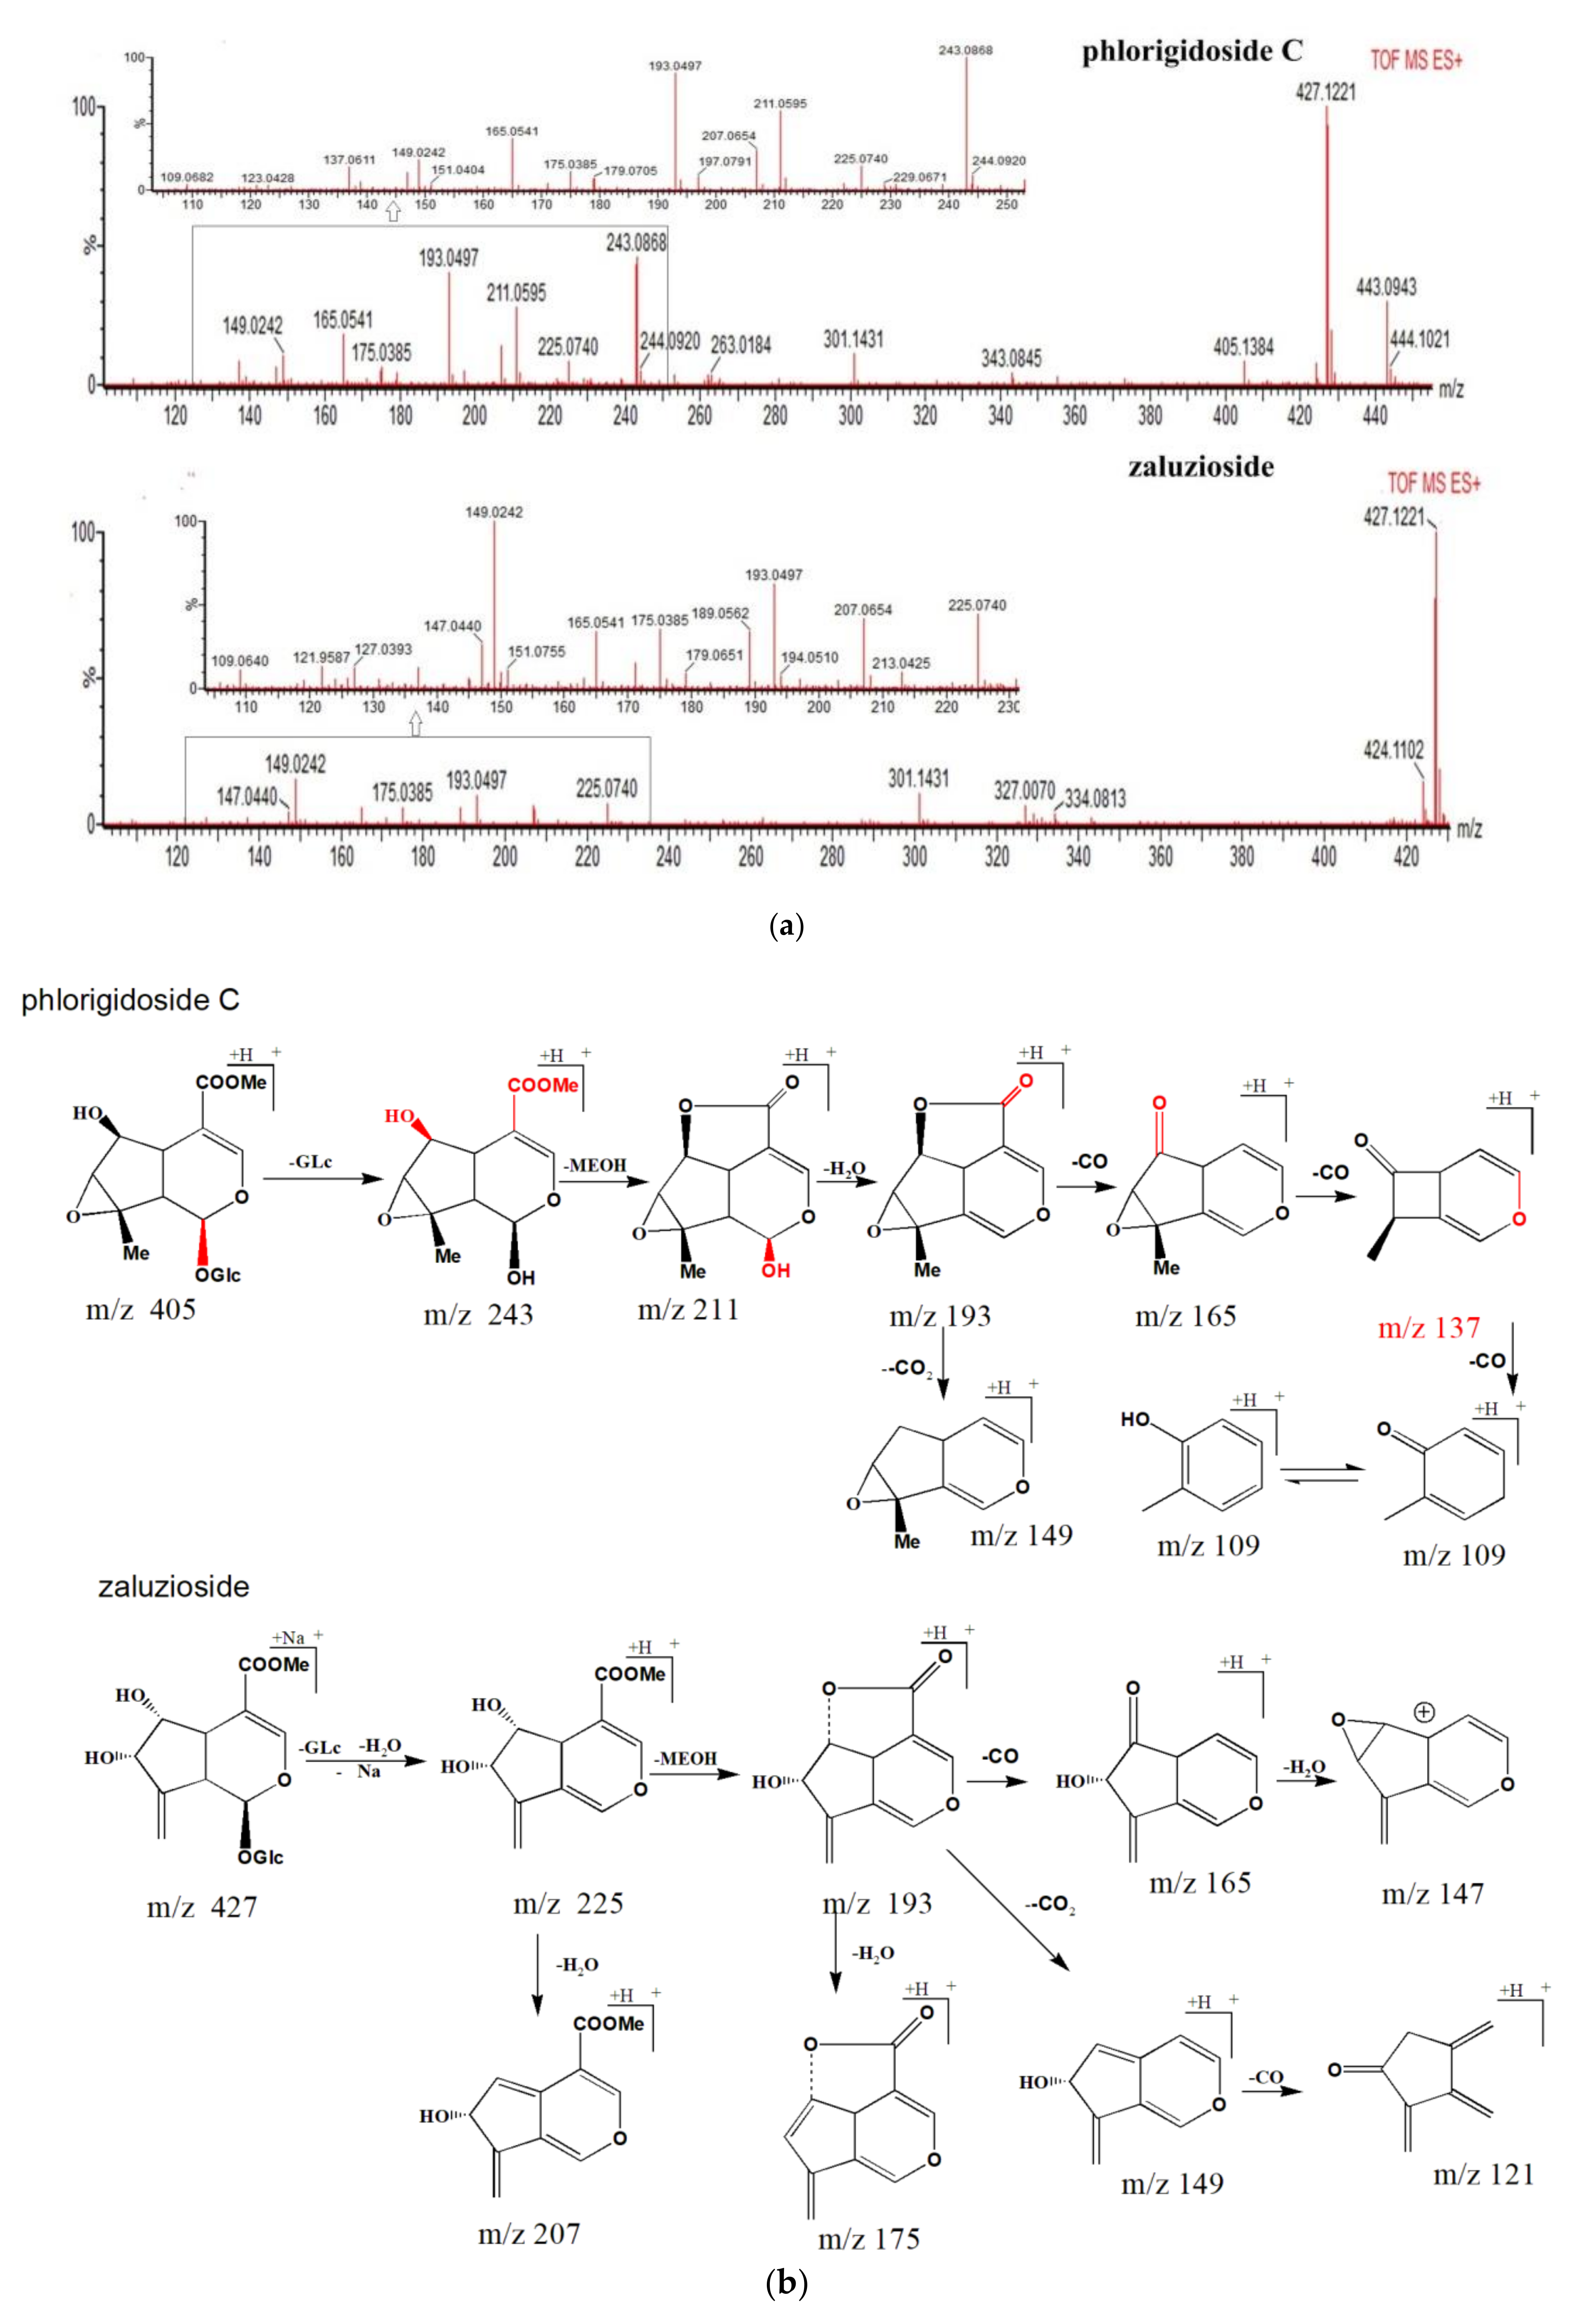
2.2. Identification of the Constituents in L. rotata by UPLC-QTOF-MS Spectra

Crude extracts of L. rotata were analyzed by mass and MSn in negative and positive ion modes (Figure 2). The SciFinder Scholar and PubChem data bases were searched for the spectral data of compounds reported previously in the L. rotata and Lamium species [22,23,24,25,26,27], and a total of 51 compounds in four classes were detected in the total ion current (TIC) profile of L. rotata, and 49 of these were identified by comparing the retention times and mass spectra of the compounds to those of authentic standards, including 23 iridoids, 16 phenylethanoid glycosides, nine flavanoids and one phenolic acid (Table 2).
For the first time, two pairs of isomers (8-O-acetylshanzhiside methyl ester and 6-O-acetylshanzhiside methyl ester, phlorigidoside C, and zaluzioside) were identified by mass spectrometry based on their different group substitution positions. Peaks 19 and 29 exhibited the same [M + Na]+ ions at m/z 471 in the positive mode, consistent with a molecular formula of C19H28O12, they both product the ions at m/z 227 and 209 Da. However, a hydroxyl group was linked to C-6 in compound 29, so it easily lost a methanol molecule to form a lactone with the carboxymethyl (COOCH3) group at the C-4 position. This came, with a (neutral) loss of 32 Da, and successive losses of two CO groups, which yielded further peaks simultaneously appearing at m/z 177 Da (m/z 209→177, Δm = 32 Da, MeOH group loss), 149 Da (m/z 177→149, Δm = 28 Da, CO group loss), and the characteristic ion at m/z 121 Da (m/z 149→121, Δm = 28 Da, CO group loss). Since there was no hydroxyl group substituted at the C-6 position in compound 19, after successive losses of H2O, CH2, and CH2O groups, the peak yielded ions at m/z 191 Da (m/z 209→191, Δm = 18 Da, H2O group loss), 177 Da (m/z 191→177, Δm = 14 Da, CH2 group loss), and the distinctive ion at m/z 135 Da (m/z 177→135, Δm = 42 Da, CH2CO group loss). The proposed fragmentation pathways of the isomers are shown in Figure 3a, b.
Peaks 9 and 33 exhibited the same molecular formula of C19H28O12 with losses of 162 Da (glucose unit), 32 Da (methanol unit), and 18 Da (H2O unit), the pair of isomers produced the same ion at m/z 193 Da. For peak 9, the compound successively lost three CO groups, the peak yielded ions at m/z 165 Da (m/z 193→165, Δm = 28 Da, CO group loss), and distinctive ions at m/z 137 Da (m/z 165→137, Δm = 28 Da, CO group loss), 109 Da (m/z 137→109, Δm = 28 Da, CO group loss). With the 5,6-di-OH substituted into compound 33, the ion at m/z 149 Da (m/z 193→149, Δm = 44 Da, CO2 group loss) and the characteristic ion at m/z 121 Da (m/z 149→121, Δm = 28 Da, CO group loss), was observed in peak 33. Additionally, the compound provided characteristic ions at m/z 147 Da (m/z 193→165, Δm = 28 Da, CO group loss; m/z 165→147, Δm = 18 Da, H2O group loss). The proposed fragmentation pathway of phlorigidoside C and zaluzioside are shown in Figure 4a, b. Furthermore, 6-O-β-d-glucopyranosyl shanzhiside, leucosceptoside A, phlorigidoside A/phlorigidoside B, and forsythoside C/campneoside II, are reported for the first time in MS metabolomics profiles of L. rotata.

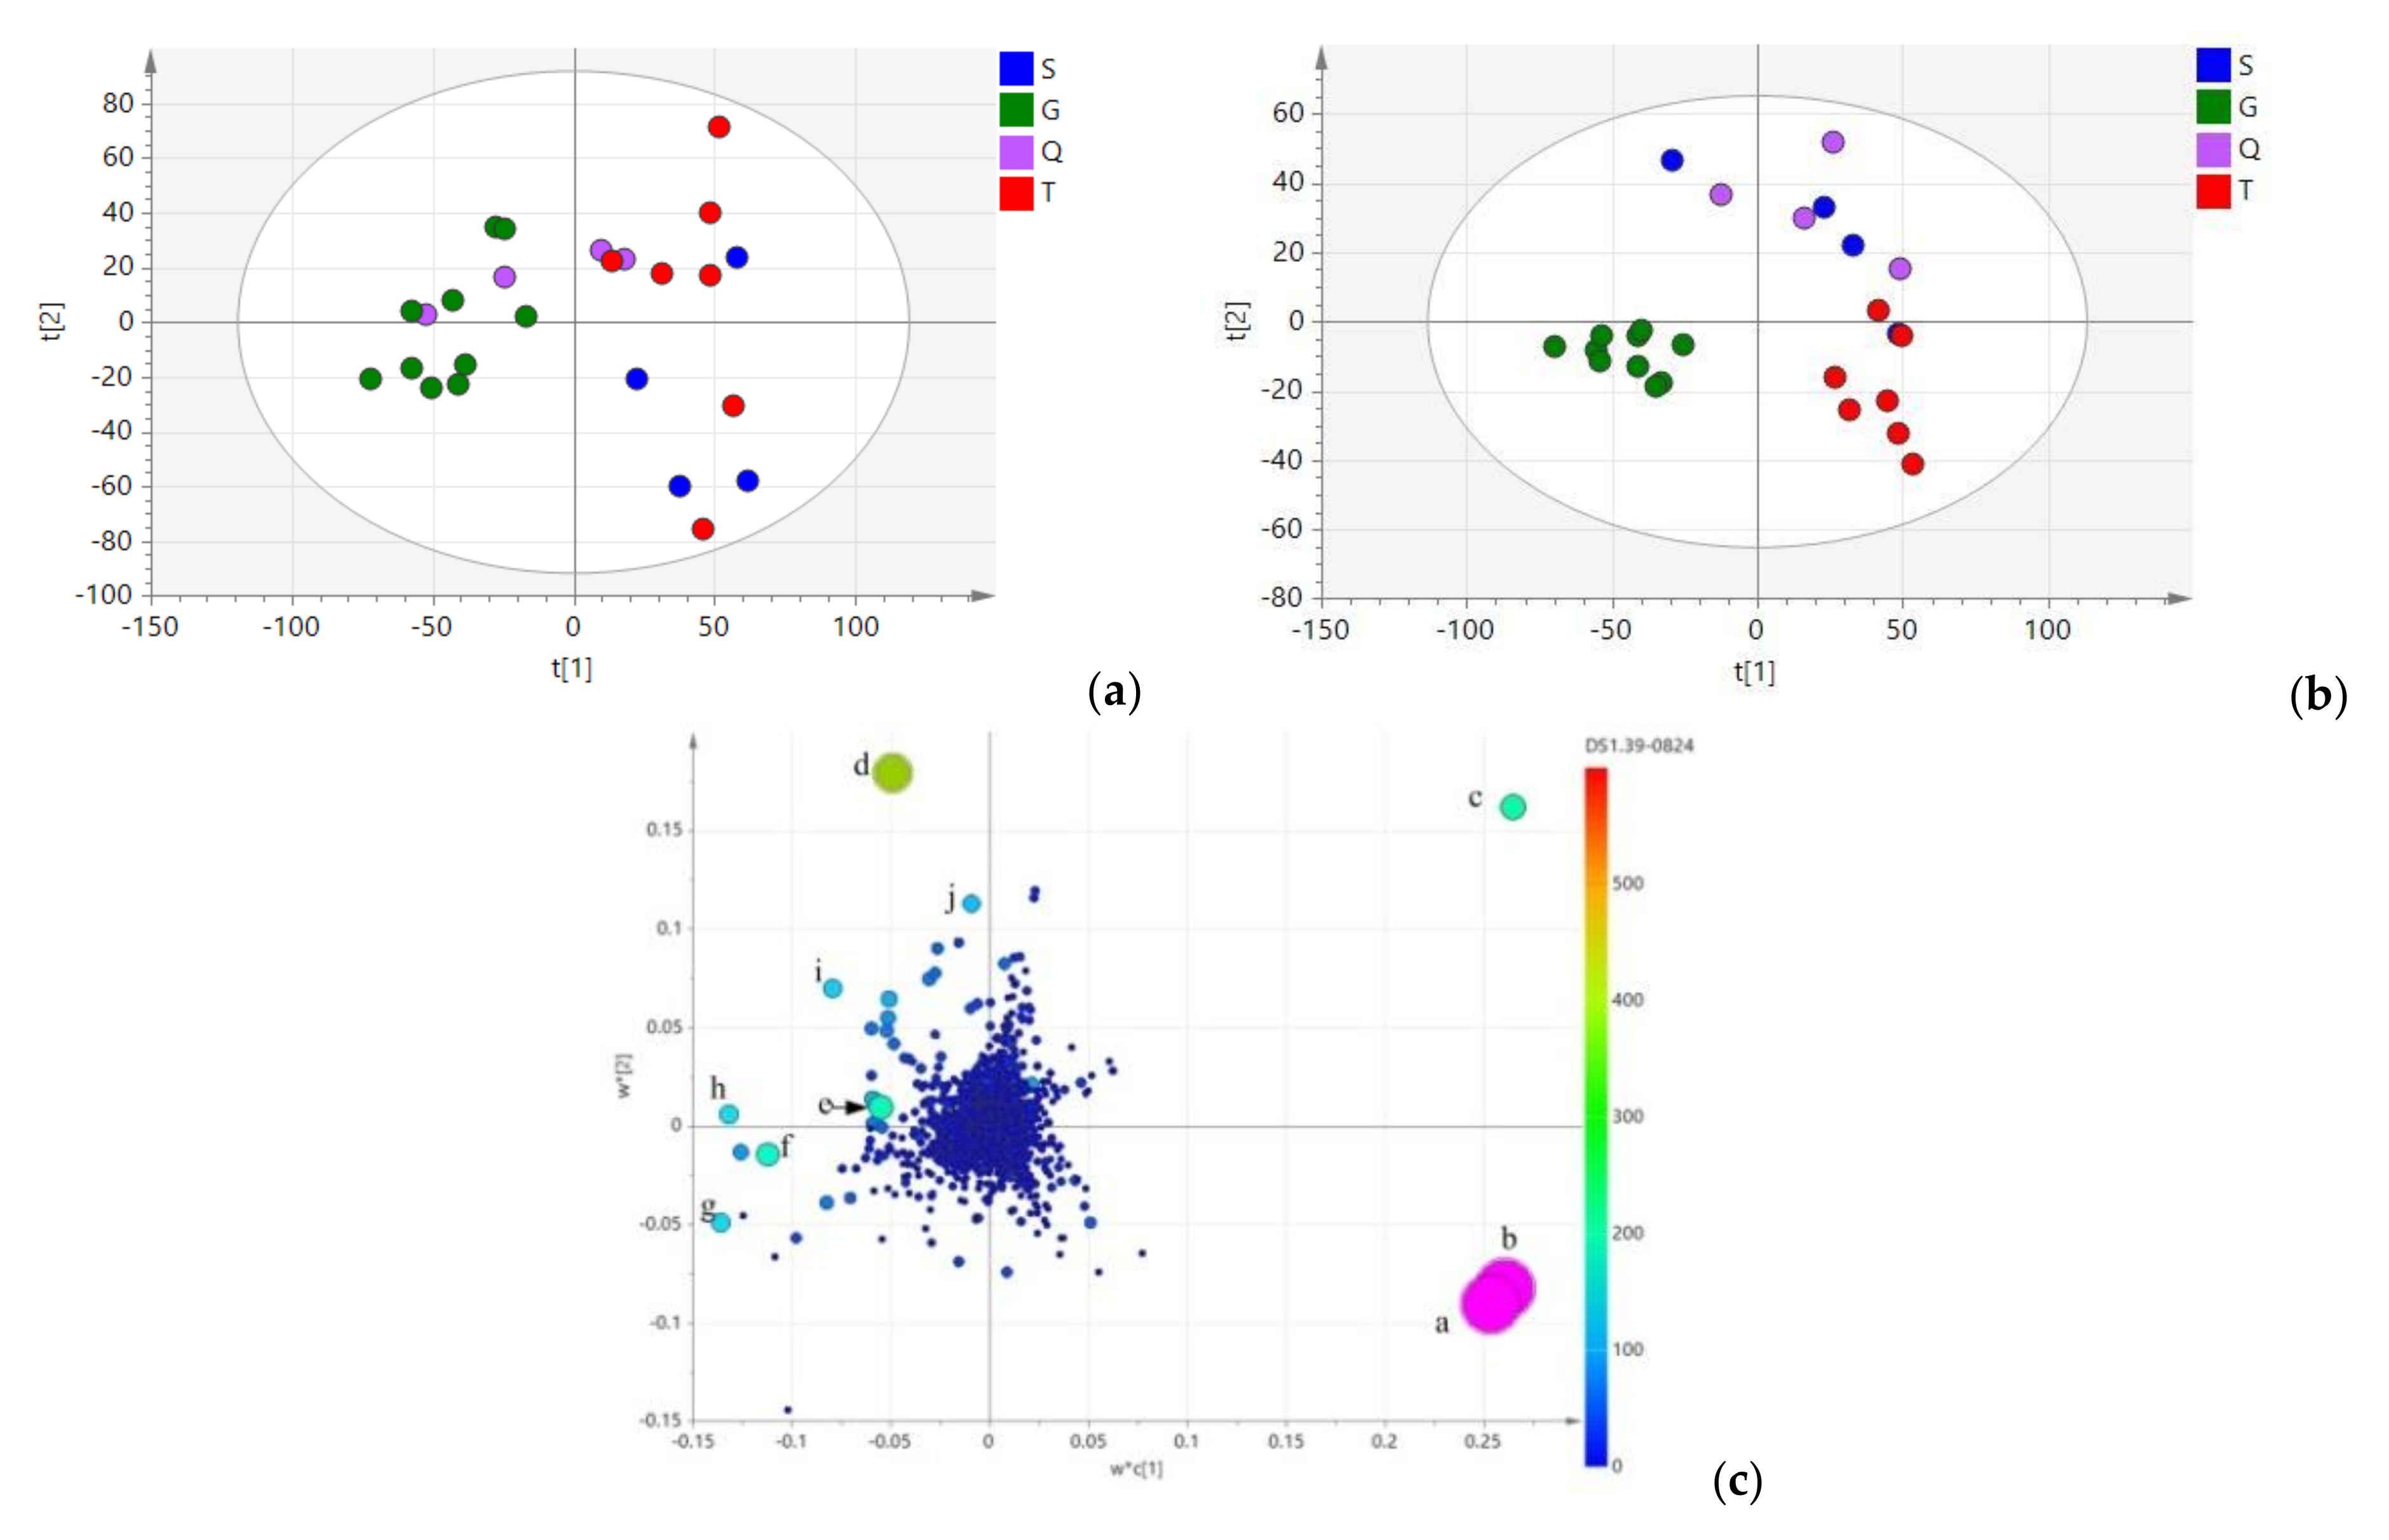
2.3. Multivariate Statistical Analysis

Principle component analysis (PCA) was used to maximize the discrimination and present the metabolite differences among groups (Figure 5a), the result demonstrated that 25 samples were separated into two groups; all samples from Gansu Province and two samples from Qinghai Province were clustered into group Ⅰ, other samples were clustered into group Ⅱ. Moreover, the 13 samples of group Ⅱ were branched into two subgroups. Partial least-squares discriminant analysis (PLS-DA) was also used for a better understand of the geographical origins of the collected samples. As shown in Figure 5b, all of the L. rotata samples were clustered into three groups. The high R2Y (0.814) of this model presented a goodness of fit, and the Q2 at 0.316 indicated good predictivity. The samples of group Ⅰ were from Gansu Province (green dots), whereas group Ⅱ was composed of samples from Tibet (red dots). Notably, the samples from Qinghai and Sichuan province (purple dot and blue dots, respectively) forming group Ⅲ, could not be distinguished from each other, this is because, these populations come from a similar natural environment, which it was referred to as the “Amdo Tibetan area” during the Qing Dynasty.
As shown in the loading and score plots of serum different serum (Figure 5c), there were ten biomarkers found to characterize samples from the four geographical origins. According to their significance in discriminating geographical characteristics, these compounds were identified as a (forsythoside B, tR 24.04 min, m/z 755.1098), b (verbascoside, tR 24.04 min, m/z 623.0175), c (kaempferol-3-glycoside, tR 13.83 min, m/z 593.1594), d (phlorigidoside C, tR 9.36 min, m/z 427.1621), e (chlorogenic acid, tR 4.59 min, m/z 353.0718) f (loganin, tR 21.02 min, m/z 413.1342), g (luteolin-7-O -β-d-glucopyranside, tR 24.65 min, m/z 447.1927), h (5-deoxypulchelloside I, tR 11.99 min, m/z 429.0361), i (7-epi-loganin, tR 18.23 min, m/z 412.9987), and j (decaffeoylcrenatoside, tR 14.26 min, m/z 459.2102). It is also clearly shown that samples from Tibet are characterized by a high content of phenylethanoid glycosides compound a and b, but a low content of iridoid and flavonoid glycosides. Samples from the Gansu location had a higher relative concentration of compound g and f, and a low content of phenylethanoid and flavonoids glycosides. Similarly, samples from the Qinghai and Sichuan province were branched into one group, and are characterized by a high content of compound c, d, e, h, i, and j. The results also suggest that these samples are characterized by a high content of flavonoids glycosides, a moderate content of iridoid glycosides, and a low content of phenylethanoid glycosides. Since iridoid glycoside and total flavonoids contents are used to qualitatively and quantitatively analyze L. rotata and the preparations in the latest Chinese Pharmacopoeia [28], the above result shows that, samples from the Qinghai and Sichuan provinces would be the most suitable choice for traditional prescriptions and preparations.

3. Discussion

Liu et al. reported the detection of L. rotata from three genetic groups corresponding to three geographic regions using inter simple sequence repeats (ISSR) and randomly amplified polymorphic DNA (RAPD) techniques [3]. Pan et al. investigated the systematic positions of Lamiophlomis and Paraphlomis (Lamiaceae) based on ITS DNA barcodes and chloroplast rpl16 and trn L-F sequences [4]. In this paper, the variation at the genus and species level among L. rotata, O. wartii and A. ovalifolia was distinguished for the first time using ITS2 DNA barcodes, the result confirmed that ITS2 DNA barcodes are one of the best-performing barcodes for identifying medicinal plants characteristics.
In our previous study, we reported a method using 1H nuclear magnetic resonance (NMR) spectroscopy with multivariate analysis to discriminate the extracts in deuterium reagents of L. rotata from the Gansu, Tibet, and Qinghai provinces. The result of that study revealed that the Gansu samples had a higher iridoid glycoside contents, and the Tibet samples had a high content of phenylethanoid glycosides. However, as NMR spectroscopy lacks sensitivity, compounds present at low levels were not analyzed in previous studies, but were found by the UPLC-QTOF-MS method. Trace compounds, such as, 5-deoxypulchelloside I, kaempferol-3-glycoside, and 7-epi-loganin, have been found to characterize samples of four geographical origins, a comprehensive chemical composition profile of 25 samples were revealed, and the result also confirmed that of our previous study, that Tibetan samples had higher content of phenylethanoid glycosides while individuals from the Gansu province had a higher iridoid glycoside contents. In this study, variation was seen in the overall pattern of metabolites between samples from different geographical locations. Duan et al. also found that growth locations have greater impact on the metabolite composition and quantity than the genotypes (cultivated versus wild) in Menggu Huangqi (Astragalus mongholicus) [29]; Huang et al. reported that the chemical level and composition of Cistanche deserticola was affected by the key factors of temperature, moisture, and illumination [30]. Additionally, samples from the Sichuan provinces were employed for a more comprehensive origin study than that undertaken in our previous studies. Altogether, this study contributes to closing knowledge gaps in the topic of systematic characterization of L. rotata and its safe application in traditional uses.

4. Materials and Methods

4.1. Plant Materials, Reagents, and Chemicals

Twenty-five populations of L. rotata were collected from throughout the geographical distribution of official source plants, including the Tibet, Qinghai, Sichuan, and Gansu provinces (Table 3). The sampling strategy covered most of its presently known populations [29]. Eight individual samples of A. ovalifolia were also collected from Qinghai and Gansu provinces, and eight ITS2 sequences of O. wartii were downloaded from Gen Bank. Details of the Gen Bank accession numbers, haplotypes of ITS2 sequences, and the locations of the sampling areas are provided in Table 3. The voucher samples were deposited in the College of Ethnic Medicine (Chengdu University of Traditional Chinese Medicine, Chengdu, China) and the Chongqing Academy of Chinese Materia Medica (Chongqing, China). We included all sequences in the final analysis.
Decaffeoylcrenatoside, verbascoside, forsythoside B, luteolin-7-O-β-d-glucopyranside, shanzhiside methyl ester, 8-O-acetylshanzhiside methyl ester, sesamoside, 7,8-dehydro- penstemoside, phlorigidoside C, 7-epi-phlomiol, loganin, and phloyoside II, were purified from L. rotata in our laboratory and identified by direct comparison of their 1H-NMR and 13C-NMR spectra to those in the literature [13,20,21,22,23]; all purities were determined to be >95% by high performance liquid chromatography.
HPLC-grade methanol and formic acid were purchased from Merck (Darmstadt, Germany) and Tedia (Fairfield, OH, USA). Deionized water was prepared using a Millipore water treatment system (Bedford, MA, USA). All other reagents were of analytical grade.

4.2. DNA Barcoding: DNA Extraction, PCR Amplification and Sequencing

DNA extraction was performed according to the method described in reference [31]. In brief, samples taken from dried stems of L. rotata and A. ovalifolia (30 mg) were rubbed for 2 min at a frequency of 30 r/s. DNA was extracted using a Plant Genomic DNA Kit (Tiangen Biotech Co., Beijing, China) in accordance with the manufacturer’s instructions. PCR was carried out according to the following program: 94 °C for 5 min followed by 40 cycles of 94 °C for 30 s, 56 °C for 30 s, and 72 °C for 45 s with DNA polymerase (Biocolor BioScience & Technology Co., Shanghai, China). ITS2-specific primers were used as follows: GTTATGCATGAACGTAATGCTC (5ʹ–3ʹ) as the forward primer and CGCGCATGGTGGATTCACAATCC (5ʹ–3ʹ) as the reverse primer. PCR products were separated and detected using 1% agarose gel electrophoresis. PCR products were purified following the manufacturer’s protocol and directly subjected to sequencing.
The PCR products were visualized on agarose gels (the electrophoresis was run in 1 × TBE for 20 min at a constant voltage 120 V). After electrophoresis, purified PCR products were bidirectionally sequenced using the same primers as were used for PCR in a 3730XL sequencer (Applied Biosystems, Foster, CA, USA).

4.3. Sequence Alignment and Analysis

ITS2 sequences of O. wartii were collected from the Gen Bank database. Sequences attained from sequencing of the samples were submitted to Gen Bank database (Table 3).
Proofreading and coting assembly of the sequencing peak diagrams was performed using Codon Code Aligner 3.7.1 (Codon Code Co., Centreville, MA, USA). The ITS2 region was obtained using the annotation method based on the Hidden Markov model(HMMer) to remove the 5.8S and 28S sections at both ends of the sequences. All sequences were aligned (MUSCLE option) by MEGA 6.0 (Center for Evolutionary Medicine and Informatics, Tempe, AZ, USA), and the genetic distances were calculated according to the K2P model. The distribution of intra-versus/inter-specific variability was assessed by DNA barcoding gaps. An NJ tree was constructed and bootstrap resampling (1000 replicates) was conducted to assess the confidence in the phylogenetic analysis by MEGA 6.0 [32].

4.4. Sample Preparation

Dried stems samples of L. rotata (1.0 g of powder each) were extracted into 10 mL of 70% aqueous methanol in an ultrasonic bath for 30 min and cooled at room temperature. The extraction was repeated three times using fresh aliquots of the solvent. After combining the three aliquots, the solutions were centrifuged at 12,000 rpm for 10 min and filtered through 0.22-μm pore membranes prior to UPLC-QTOF-MS analysis.

4.5. UPLC-QTOF-MS Conditions

Analyses were performed with a Waters Acquity UPLC system (Waters, Milford, MA, USA) equipped with a binary solvent delivery system, an auto-sampler, and photodiode-array detection (DAD) system. The column was a Waters Acquity UPLC BEH C18 column (100 mm × 2.1 mm, 1.8 μm particle size). The mobile phases were (a) water with 0.1% (v/v) formic acid and (b) methanol with 0.1% (v/v) formic acid. The optimized elution conditions were as follows: Holding at 7% B for 1 min; a linear gradient from 7% to 11% B (all v/v) (1 to 4 min), 11% to 13% B (5 to 10 min), 13% to 19% B (15 to 19 min), 19% to 31% B (19 to 24 min), 31% to 45% B (24 to 29 min), 45% to 55% B (29 to 35 min), 55% to 100% B (35 to 36 min), isocratic 100% B for 1 min, and then back to 7%) B in 1 min. The flow rate was 0.3 mL/min. The column temperature was 35 °C. The injection volume was 2 μL.
Mass spectrometry data were obtained using a Xevo G2 Q/TOF (Waters MS Technologies, 129 Manchester, UK) fitted with an electron spray ionization source. Each sample was analyzed twice, once in positive ionization mode and once in negative ionization mode. MS full scans were acquired mode over the range (m/z) 100 to 1000 Da in two channels with a scan time of 1 s. The capillary voltages were set to 2500 V and the cone voltage to 40 V [33]. Nitrogen gas was used both as a nebulizer and for desolvation. The desolvation and cone gas flow rates were 650 and 50 L·h−1, respectively. The desolvation temperature was 300 °C, and the source temperature was 100 °C, the capillary voltage and cone voltage were set to 2700 V and 35 V. The Leu-Enkephalin ions at m/z 556.2771 and 554.2615 were used to calibrate the mass accuracy.

4.6. Data Processing and Statistical Analysis

The original data were processed for alignment, data reduction, and normalization by Marker Lynx software (Waters, Manchester, UK), and the processed data were exported to SIMCA-P software (ver. 13.0; Umetrics, Umeå, Sweden) for data analysis. A list of the intensities of detected peaks was generated using the retention time (tR) and the mass data (m/z) pairs to identify each peak. An arbitrary ID was assigned to each tRm/z pair in the order of their UPLC elution to facilitate data alignment. This procedure was repeated for each run. Ions from different samples were considered to be identical when they had the same tR (tolerance within 0.01 min) and m/z (tolerance within 0.01 Da). If a peak was not detected in a particular sample, that ion intensity was recorded as zero. In multivariate analysis of statistical significance, p < 0.05 and variable importance for projection (VIP) > 3, respectively, were set as the screening criteria for potential markers responsible for the discrimination of different groups.

5. Conclusions

In summary, using ITS2 DNA barcodes, L. rotata was accurately differentiated from O. wartii and A. ovalifolia. Additionally, an NJ tree showed that all samples of L. rotata were clustered into three subgroups according to their geographical origins. For further evaluation of the quality of the herbs from different habitats, a method coupling UPLC-QTOF-MS with multivariate analysis was implemented. Ten compounds were identified as the characteristic markers distinguishing samples from the four geographical origins. The results also suggest that samples from Qinghai and Sichuan province would be the most suitable choice for traditional prescriptions and preparations.

Supplementary Materials

Supplementary File 1

Author Contributions

Z.P. conceived and designed the study, J.W., Y.-L.G., L.X., Y.-L.C. and Y.-W.C. performed the detailed experiments; Y.Z. provided the data analysis; Z.P., J.W., Y.-L.G., and Y.-L.C. wrote the manuscript.

Funding

This research was funded by the Science Foundation Project (CSTC2016jcyj A0288) of Chong Qing, Research Program of Chongqing Municipal Education Commission (KJ1702030), and the Program of Chongqing Health and Family Planning Commission (zy201602066).

Acknowledgments

We also thank Qinghai Key Laboratory of Qinghai-Tibet Plateau Biological Resources (2017-ZJ-Y10), and national key research and development plan “research on the modernization of Traditional Chinese Medicine”-important special projects-inheritance of ethnic medicine (No. 2017YFC1703904) for samples and financial support.

Conflicts of Interest

The authors declare no conflicts of interest associated with this manuscript.

References

  1. Yang, Y.C. Flora of Tibetan Medicine; Qinghai people’s Publishing House: Xining, China, 1991; p. 119. ISBN 7225004263. [Google Scholar]
  2. Zhu, B.; Gong, N.; Fan, H.; Peng, C.S.; Ding, X.J.; Jiang, Y.; Wang, Y.X. Lamiophlomis rotata, an orally available Tibetan herbal painkiller, specifically reduces pain hypersensitivity states through the activation of spinal glucagon-like peptide-1 receptors. Anesthesiology 2014, 121, 835–851. [Google Scholar] [CrossRef] [PubMed]
  3. Liu, J.M.; Wang, L.; Geng, Y.P.; Wang, Q.B.; Luo, L.G.; Zhong, Y. Genetic diversity and population structure of Lamiophlomis rotata (Lamiaceae), an endemic species of Qinghai–Tibet Plateau. Genetica 2006, 128, 385–394. [Google Scholar] [CrossRef] [PubMed]
  4. Pan, Y.Z.; Fang, L.Q.; Hao, G.; Cai, J.; Gong, X. Systematic positions of Lamiophlomis and Paraphlomis (Lamiaceae) based on nuclear and chloroplast sequences. J. Syst. Evol. 2009, 47, 535–542. [Google Scholar] [CrossRef]
  5. Jensen, S.R.; Li, H.Q.; Albach, D.C.; Gotfredsen, C.H. Phytochemistry and molecular systematics of Triaenophora rupestris and Oreosolen wattii (Scrophulariaceae). Phytochemistry 2008, 69, 2162–2166. [Google Scholar] [CrossRef] [PubMed]
  6. China Plant BOL Group. Comparative analysis of a large dataset indicates that internal transcribed spacer (ITS) should be incorporated into the core barcode for seed plants. Proc. Natl. Acad. Sci. USA 2011, 108, 19641–19646. [Google Scholar] [CrossRef] [Green Version]
  7. Chen, S.L.; Pang, X.H.; Song, J.Y.; Shi, L.C.; Yao, H.; Han, J.P.; Leon, C. A renaissance in herbal medicine identification: From morphology to DNA. Biotechnol. Adv. 2014, 15, 1237–1244. [Google Scholar] [CrossRef] [PubMed]
  8. Zhou, Y.; Du, X.L.; Zheng, X.; Huang, M.; Li, Y.; Wang, X.M. ITS2 barcode for identifying the officinal rhubarb source plants from its adulterants. Biochem. Syst. Ecol. 2017, 70, 177–185. [Google Scholar] [CrossRef]
  9. Xin, T.X.; Su, C.; Lin, Y.L.; Wang, S.H.; Xu, Z.C.; Song, J.Y. Precise species detection of traditional Chinese patent medicine by shotgun metagenomic sequencing. Phytomedicine 2018, 47, 40–47. [Google Scholar] [CrossRef]
  10. Pan, Z.; Fan, G.; Yang, R.P.; Luo, W.Z.; Zhou, X.D.; Zhang, Y. Discriminating Lamiophlomis rotata according to geographical origin by 1H-NMR spectroscopy and multivariate analysis. Phytochem. Anal. 2015, 26, 247–252. [Google Scholar] [CrossRef]
  11. Yi, J.H.; Zhang, G.L.; Li, B.G.; Chen, Y.Z. Phenylpropanoid glycosides from Lamiphlomis rotata. Phytochemistry 1999, 51, 825–828. [Google Scholar] [CrossRef]
  12. Yue, H.L.; Zhao, X.H.; Wang, Q.L.; Tao, Y.D. Separation and purification of water soluble iridoid glucosides by high speed counter-current chromatography combined with macroporous resin column separation. J. Chromatogr. B 2013, 936, 57–62. [Google Scholar] [CrossRef] [PubMed]
  13. Zhang, F.; Wu, Z.J.; Sun, L.N.; Wang, J.; Tao, X.; Chen, W.S. Iridoid glucosides and a C₁₃-norisoprenoid from Lamiophlomis rotata and their effects on NF-κB activation. Bioorg. Med. Chem. Lett. 2012, 22, 4447–4452. [Google Scholar] [CrossRef] [PubMed]
  14. State Pharmacopoeia Commission. Chinese Pharmacopoeia; Chemical and Technologic Press: Beijing, China, 2005; pp. 184–185. ISBN 7-117-06983-X. [Google Scholar]
  15. Luo, M.N.; Ma, H.Q.; Liu, X.; Jiang, S.X. HPLC Analysis of Flavonoids in Lamiophlomis rotate. Acta Chromatogr. 2008, 20, 247–257. [Google Scholar] [CrossRef]
  16. Luo, M.N.; Lu, H.W.; Ma, H.Q.; Liu, X.; Jiang, S.X. Separation and determination of flavonoids in Lamiophlomis rotata by capillary electrophoresis using borate as electrolyte. J. Pharm. Biomed. Anal. 2007, 44, 881–886. [Google Scholar] [CrossRef]
  17. State Pharmacopoeia Commission. Chinese Pharmacopoeia; Chemical and Technologic Press: Beijing, China, 2010; pp. 245–246. ISBN 978-7-30-603708-4. [Google Scholar]
  18. La, M.P.; Zhang, F.; Gao, S.H.; Liu, X.W.; Wu, Z.J.; Sun, L.N.; Tao, X.; Chen, W.S. Constituent analysis and quality control of Lamiophlomis rotata by LC-TOF/MS and HPLC-UV. J. Pharm. Biomed. Anal. 2015, 102, 366–376. [Google Scholar] [CrossRef] [PubMed]
  19. Pan, Z.; Mao, Q.; Jiang, S.; Fan, G.; Zhang, Y. Metabonomics and pattern recognition study on the different parts of Lamiophlomis rotata (Benth.) Kudo. Chin. Trad. Pat. Med. 2015, 37, 567–570. [Google Scholar]
  20. Zhang, D.; Gao, Y.L.; Jiang, S.; Chen, Y.W.; Zhang, Y.; Pan, Z. The similarity and variability of iridoid glycosides profile and antioxidant capacity of aerial and underground parts from Lamiophlomis rotata using UPLC-TOF-MS and multivariate analyses. RSC Adv. 2018, 8, 2459–2468. [Google Scholar] [CrossRef]
  21. Li, M.X.; Zhang, R.X.; Li, C.X.; Fan, P.C.; Zhang, Q.L.; Jia, Z.P. Development of a validated HPLC- PAD-APCI/MS method for the identification and determination of iridoid glycosides in Lamiophlomis rotate. Anal. Methods 2010, 2, 714–721. [Google Scholar] [CrossRef]
  22. Amor, I.L.B.; Boubaker, J.; Sgaier, M.B.; Skandrani, I.; Bhouri, W.; Neffati, A.; Kilani, S.; Bouhlel, I.; Ghedira, K.; Chekir-Ghedira, L. Phytochemistry and biological activities of Phlomis species. J. Ethnopharmacol. 2009, 125, 183–202. [Google Scholar] [CrossRef]
  23. Alipieva, K.; Kokubun, T.; Taskova, R.; Evstatieva, L.; Handjieva, N. LC-ESI-MS analysis of iridoid glucosides in Lamium species. Biochem. Syst. Ecol. 2007, 35, 17–22. [Google Scholar] [CrossRef]
  24. Alipieva, K.I.; Taskova, R.M.; Evstatieva, L.N.; Handjieva, N.V.; Popov, S.S. Benzoxazinoids and iridoid glucosides from four Lamium species. Phytochemistry 2003, 64, 1413–1417. [Google Scholar] [CrossRef] [PubMed]
  25. Yi, J.H.; Zhong, C.C.; Luo, Z.Y.; Xiao, Z.Y. Studies on the chemical constituents from the roots of Lamiophlomis rotata (Benth.) Kudo, a medical plant in Xizhang (Tibet). Acta Pharmacol. Sin. 1990, 26, 37–41. [Google Scholar]
  26. Zhang, C.Z.; Li, C.; Feng, S.I.; Shi, J.G. Iridoid glucosides from Phlomis rotate. Phytochemistry 1991, 30, 4156–4158. [Google Scholar] [CrossRef]
  27. Pan, Z.; Xing, L.X.; Liu, S.R.; Gao, Y.L. Chemical constituents from Lamiophlomis rotata. Chin. Tra. Pat. Med. 2018, 40, 629–632. [Google Scholar]
  28. State Pharmacopoeia Commission. Chinese Pharmacopoeia; Chemical and Technologic Press: Beijing, China, 2015; p. 262. ISBN 978-7-50-674439-3. [Google Scholar]
  29. Duan, L.X.; Chen, T.L.; Li, M.; Chen, M.; Zhou, Y.Q.; Cui, G.H.; Zhao, A.H.; Jia, W.; Huang, L.Q.; Qi, X.Q. Use of the metabolomics approach to characterize Chinese medicinal material Huangqi. Mol. Plant 2012, 5, 376–386. [Google Scholar] [CrossRef] [PubMed]
  30. Huang, L.F.; Zheng, S.H.; Wu, L.B.; Jiang, X.; Chen, S.L. Ecotypes of Cistanche deserticola based on chemical component and molecular traits. Sci. Sin. Vit. 2014, 44, 1–11. [Google Scholar]
  31. Gao, T.; Yao, H.; Song, J.Y.; Liu, C.; Zhu, Y.J.; Ma, X.Y.; Pang, X.H.; Xu, H.X.; Chen, S.L. Identification of medicinal plants in the family Fabaceae using a potential DNA barcode ITS2. J. Ethnopharmacol. 2010, 130, 116–121. [Google Scholar] [CrossRef] [PubMed]
  32. Chen, S.L.; Yao, H.; Han, J.P.; Liu, C.; Song, J.Y.; Shi, L.C.; Zhu, Y.J.; Ma, X.Y.; Gao, T.; Pang, X.H.; et al. Validation of the ITS2 region as a novel DNA barcode for identifying medicinal plant species. PLoS ONE 2010, 5, e8613. [Google Scholar] [CrossRef] [PubMed]
  33. Li, S.L.; Song, J.Z.; Qiao, C.F.; Zhou, Y.; Qian, K.; Lee, K.H.; Xu, H.X. A novel strategy to rapidly explore potential chemical markers for the discrimination between raw and processed Radix Rehmanniae by UHPLC–TOFMS with multivariate statistical analysis. J. Pharm. Biomed. Anal. 2010, 51, 812–823. [Google Scholar] [CrossRef] [PubMed]
Figure 1. Neighbor-joining trees of L. rotata, A.ovalifolia, and O.wartii by internal transcribed spacer 2 (ITS2). The bootstrap scorers (1000 replicates) are shown (≥50%) for L. rotata and its adulterants.
Molecules 23 03289 g001
Figure 2. Total ion current chromatograms of substances in the extract of L. rotata, under positive and negative ionization modes.
Molecules 23 03289 g002
Figure 3. (a). MS2 spectra of 8-O-acetylshanzhiside methyl ester and 6-O-acetylshanzhiside methyl ester. (b) Possible mass fragmentation pathways of 8-O-acetylshanzhiside methyl ester and 6-O-acetylshanzhiside methyl ester.
Molecules 23 03289 g003
Figure 4. (a) MS2 spectra of phlorigidoside C and zaluzioside. (b) Possible mass fragmentation pathways of phlorigidoside C and zaluzioside.
Molecules 23 03289 g004
Figure 5. (a): Principal component analysis (PCA) score plot of L. rotata in four geographical origins. (b): Partial least-squares discriminant analysis (PLS-DA) score plot of L. rotata in four geographical origins. (c): Loading plot of PLS-DA analysis of L. rotata. a: forsythoside B (tR 24.04 min, m/z 755.1098), b: verbascoside (tR 24.04 min, m/z 623.0175), c: Kaempferol-3-glycoside (tR 13.83 min, m/z 593.1594), d: Luteolin-7-O-β-d-glucopyranside (tR 24.65 min, m/z 447.1927), e: Chlorogenic acid (tR 4.59 min, m/z 353.0718), f: Phlorigidoside C (tR 9.36 min, m/z 427.1621), g: Loganin (tR 21.02 min, m/z 413.1342), h: 5-deoxy-pulchelloside I (tR 11.99 min, m/z 429.0361), i: 7-epi-loganin (tR 18.23 min, m/z 412.9987), j: Decaffeoylcrenatoside (tR 14.26 min, m/z 459.2102).
Molecules 23 03289 g005
Table 1. The Sequence information and intra/inter-specific genetic distance of internal transcribed spacer 2 (ITS2).
SpeciesLength (bp)GC Content (%)Intraspecific DistanceInterspecific Distance cM (mean)
L. rotata21970–720–0.0210.258–0.286
A. ovalifolia229650–0.0160.262–0.286
O. wartii2086300.258–0.350
Table 2. The Identification constituents of the constituents in L. rotate by ultra-high-performance liquid chromatography coupled with time-of-flight mass spectrometry (UPLC-QTOF-MS) spectra.
Peak NumberRT (min)CompoundFormulaCalculated (Da)Selected IonPrecursor Ion (Da)Error (ppm)
13.2127-epi-Phlomiol bC17H26O13438.1373[M + Na]+461.21831.98
24.339Schismoside aC17H26O12422.1424[M + Na]+445.13980.17
34.585Chlorogenic acid cC17H22O8354.1315[M − H]353.0718−1.47
46.855Lamalbide aC17H26O12422.1424[M + Na]+445.23252.25
57.031Phlomiol/Phloyoside I aC17H26O13438.1373[M + Na]+461.13750.23
68.890Shanzhiside aC16H24O11392.1319[M + Na]+415.1109−0.26
79.284Penstemoside aC17H26O11406.1475[M + Na]+429.14820.25
89.478Luteolin-7-glucuronide aC21H18O12462.0798[M − H]461.17192.17
99.935Phlorigidoside C aC17H24O11404.1319[M + H]+405.13843.05
1010.552UnknownC17H24O11404.1319[M + Na]+427.0109−2.59
1110.798Shanzhiside methyl ester bC17H26O11406.1475[M + Na]+429.19691.39
1211.432Lamiridoside aC17H24O12420.1268[M + Na]+443.0158−2.28
1311.6526’-O-β-d-glucopyranosylshanzhiside cC22H34O16554.18[M + Na]+577.38043.65
1411.9865-Deoxypulchelloside I aC17H26O11406.1475[M + Na]+429.0361−2.36
1512.012Deoxypulchelloside I aC17H26O11406.1475[M + Na]+429.19570.72
1612.268Kaempferol-3’methyl aC16H12O6300.0634[M − H]299.10311.59
1712.4267,8-Dehydropenstemoside aC17H24O11404.1319[M + Na]+427.18211.41
1812.4615-Desoxylamiide aC17H26O11406.1475[M + Na]+429.1239−0.32
1912.9456-O-Acetylshanzhiside methyl ester bC19H28O12448.1581[M + Na]+ 471.14841.01
2013.324Rossicaside C/Rossicaside D aC30H36O14620.2105[M − H]619.1026−2.27
2113.421Lagotoside B/Lagotoside C aC17H22O8354.1315[M − H]353.1308−1.60
2213.729Rossicaside D/Rossicaside C aC30H36O14620.2105[M − H]619.1036−1.61
2313.834Kaempferol-3-glycoside aC30H26O13594.1373[M − H]593.15940.51
2413.993Decaffeoylcrenatoside aC20H28O12460.1581[M − H]459.21020.21
2514.257Seguinoside E aC25H30O14554.1636[M − H]553.19571.31
2615.515Phloyoside II bC17H25ClO12456.1034[M + Na]+479.18511.91
2716.483Unknown C16H24O12408.1267[M + Na]+431.11710.90
2816.571Chlorotuberroside aC17H25ClO11440.1085[M + Na]+463.14160.93
2917.1178-O-Acetylshanzhiside methyl ester bC19H28O12448.1581[M + Na]+471.14841.01
3018.2317-epi-Loganin aC17H26O10390.1526[M + Na]+412.9987−3.48
3118.763Phlorigidoside A/Phlorigidoside B a,cC19H28O13464.153[M + Na]+487.24362.07
3219.0717,8-Dehydropenstemonoside aC17H20O10388.1369[M + Na]+411.22862.47
3319.229Zaluzioside aC17H24O11404.1319[M + Na]+427.18211.41
3419.2708-epideoxyloganic acid aC17H24O11404.1319[M + Na]+427.1221−0.04
3519.5203,4-dihydroxyphenylethanol-8-O-[4-O-transcaffeoyl-β-d-apiofuranosyl(1→3)-β-d-glucopyranosyl-(1→6)]-β-d-glucopyranoside aC34H44O20772.2426[M − H]771.33471.72
3621.024Loganin aC17H26O10390.1526[M + Na]+413.1342−0.20
3722.292Forsythoside C/Campneoside II a,cC29H36O16640.2003[M − H]639.20240.16
3820.699Echinacoside aC35H46O20786.2583[M − H]785.38541.72
3922.732Forsythoside C/Campneoside II a,cC29H36O16640.2003[M − H]639.0087−2.87
4024.043Forsythoside B aC34H44O19756.2477[M − H]755.1098−1.72
4124.651Luteolin-7-O-β-d-glucopyranside bC21H20O11448.1006[M − H]447.19272.24
4224.906Isoverbascoside aC29H36O15624.2054[M − H]623.30751.77
4325.434Leuteolin-7-O-[β-d-apiose(6→1)]-β-glucoside aC26H28O15580.1428[M − H]579.33493.45
4427.441Verbascoside aC29H36O15624.2054[M − H]623.0175−2.89
4528.743Apigenin-7-O-β-d-glucopyranoside aC21H20O10432.1056[M − H]431.12770.70
4629.711Crenatoside/Orobanchoside aC29H34O15622.1898[M − H]621.0619−1.93
4731.419Leucosceptoside A a,cC30H38O15638.2211[M − H]637.1132−1.57
4831.577Lamiophlomioside A aC36H48O19784.279[M − H]783.32160.65
4931.419Tenuifoliside C aC35H44O19768.2476[M − H]767.1397−1.30
5031.577Luteolin-7-O-β-d-(6-O-acetate)-glucopyranoside aC21H30O13490.1686[M − H]489.22071.23
5135.924Apigenin7-O-(6”-(E)-p-coumaroyl-β-d-galactopyran-osid aC30H26O12578.1424[M − H]577.0445−1.56
a Identified by the reference compounds reported previously in L. rotata and Lamium species. b Identified these compounds with standards. c Compounds were found in this plant for the first time.
Table 3. The origins of the materials and GenBank accession numbers of ITS2 sequences.
No.SpeciesSourcesGPS CoordinatesGenBank Accession Number
L1-7L. rotataMaQu and LuQu county in GansuE:101°W:33°KP699732-34, 36, 44, 38-39
L8-14L. rotataBianBa, LeiWuQI, NaQu, BiRu BaSu county in TibetE:93°W:31°KP699743/45-4750-51/54
L15-21L. rotataDeGe, ShiQu and SeDa, county in SichuanE:102°W:32°KP699753, 56-61
L22-25L. rotataZhiDuo, JiuZhi and HeNan county in QinghaiE:99°W:34°KP699735, 37, 42, 55
A1-7A. ovalifoliaHongyuan, SeDa and DeGe county in SichuanE:102°W:32°KP699723-29
O1O. wartiiGenBank--KY771016-23

