Solution Conformation of Heparin Tetrasaccharide. DFT Analysis of Structure and Spin–Spin Coupling Constants

Abstract
1. Introduction
2. Results and Discussion
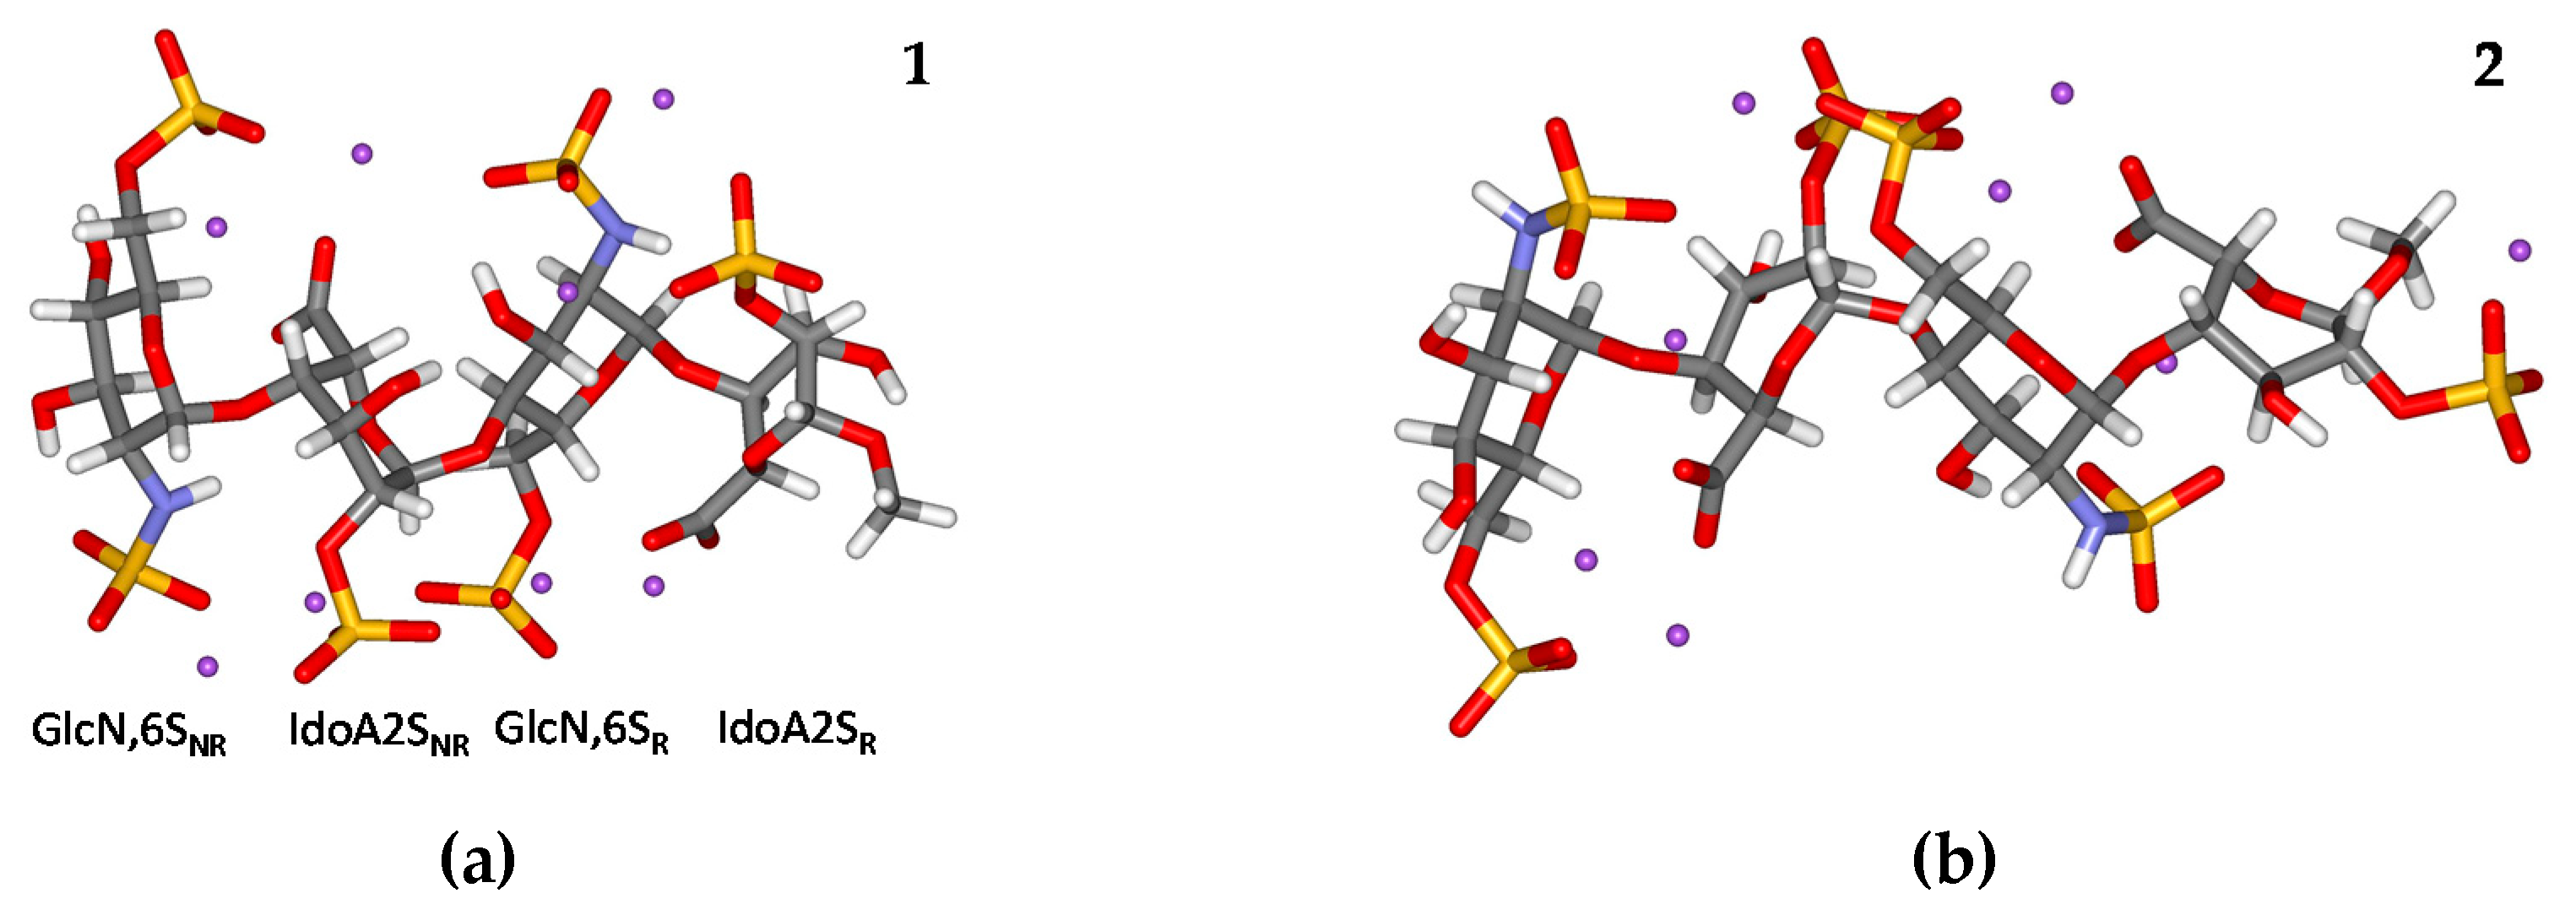
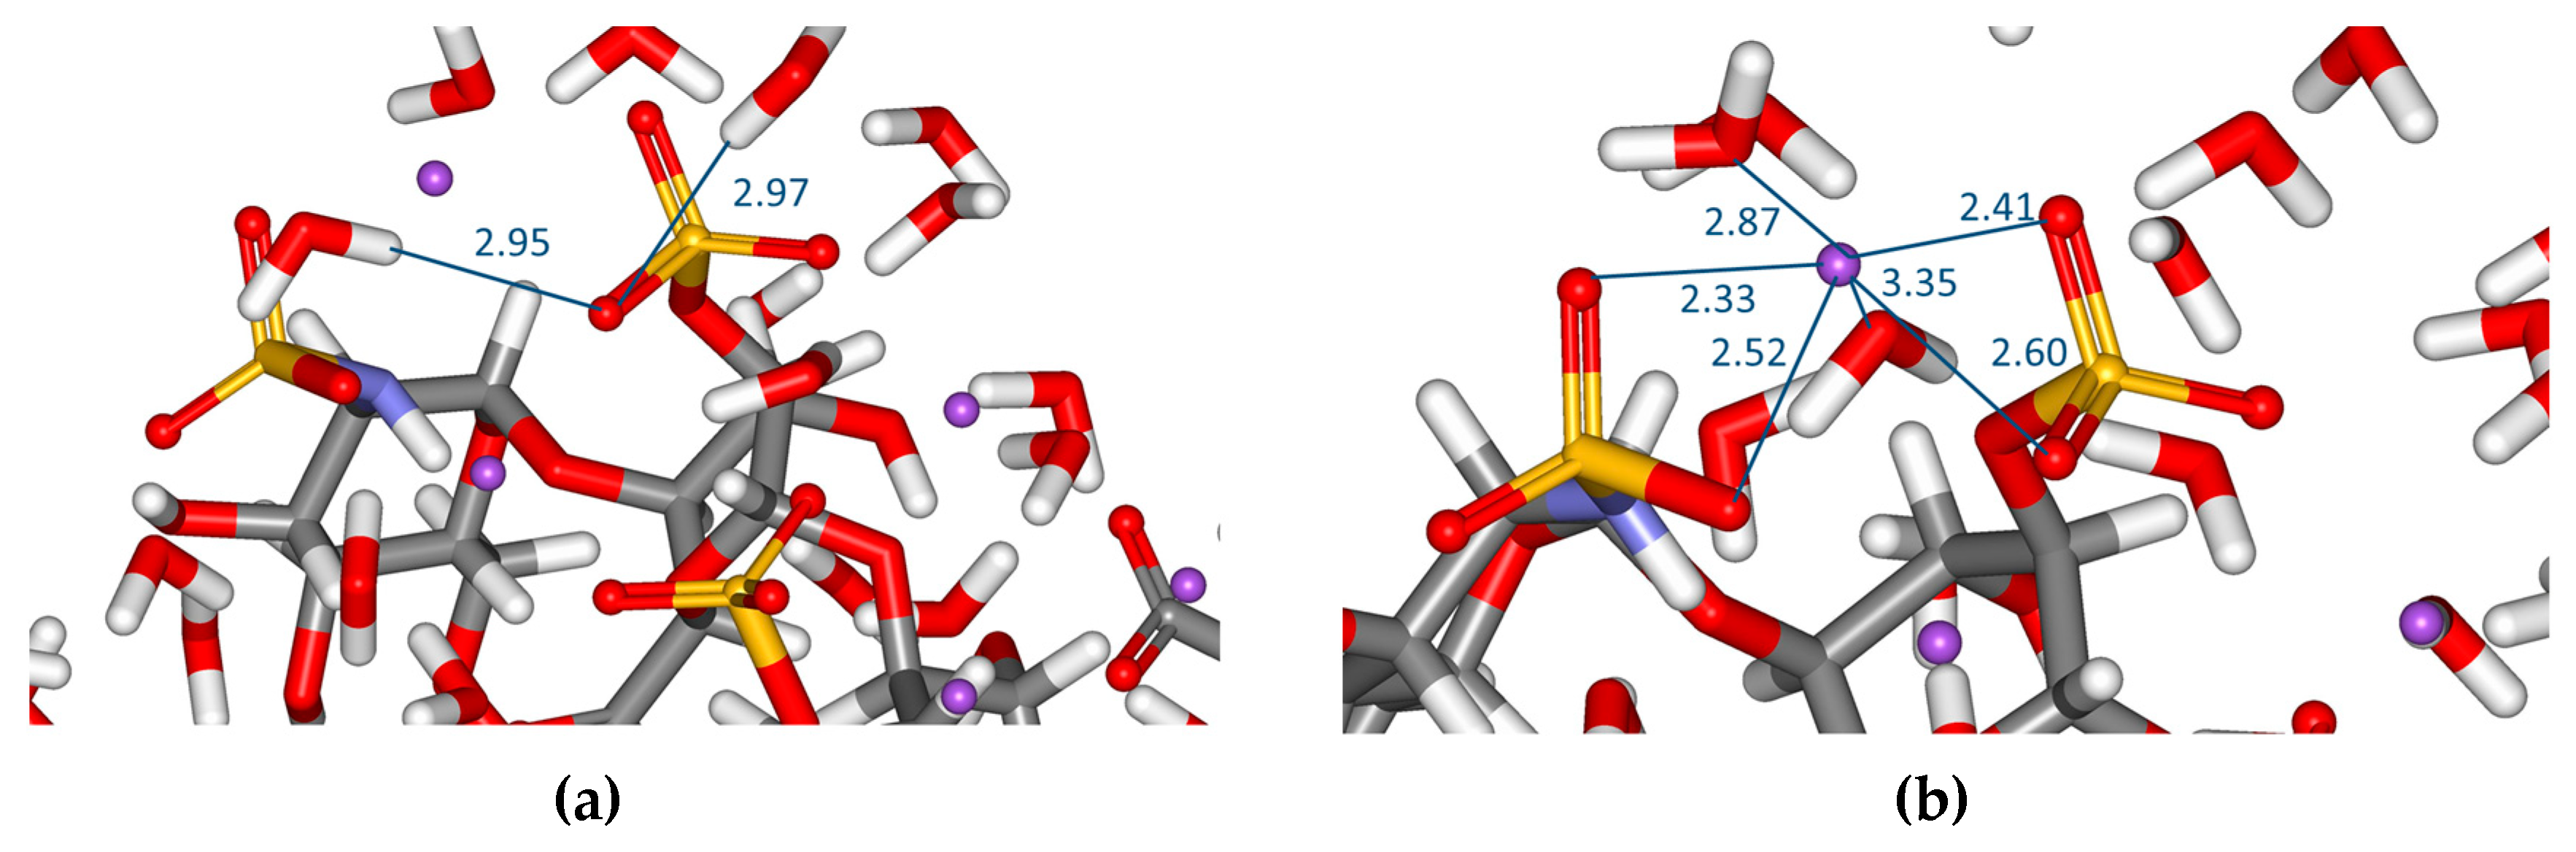
2.1. Geometry
2.2. NMR Spin-Spin Coupling Constants
3. Materials and Methods
4. Conclusions
Author Contributions
Funding
Conflicts of Interest
References
- Conrad, H.E. Heparin-Binding Proteins; Academic Press: San Diego, CA, USA, 1998. [Google Scholar]
- Casu, B.; Lindahl, U. Structure and biological interactions of heparin and heparan sulfate. Adv. Carbohydr. Chem. 2001, 57, 159–206. [Google Scholar] [CrossRef]
- Powell, A.K.; Yates, E.A.; Fernig, D.G.; Turnbull, J.E. Interactions of heparin/heparan sulfate with proteins: Appraisal of structural factors and experimental approaches. Glycobiology 2004, 14, 17–30. [Google Scholar] [CrossRef] [PubMed]
- Torri, G.; Naggi, A. Heparin centenary—An ever-young life-saving drug. Int. J. Cardiol. 2016, 212, 51–54. [Google Scholar] [CrossRef]
- Yates, E.A.; Rudd, T.R. Recent innovations in the structural analysis of heparin. Int. J. Cardiol. 2016, 212, 55–59. [Google Scholar] [CrossRef]
- Mulloy, B.; Forster, M.J. Conformation and dynamics of heparin and heparan sulfate. Glycobiology 2000, 10, 1147–1156. [Google Scholar] [CrossRef] [PubMed]
- Almond, A. Multiscale modeling of glycosaminoglycan structure and dynamics: Current methods and challenges. Curr. Opin. Struct. Biol. 2018, 50, 58–64. [Google Scholar] [CrossRef] [PubMed]
- Guerrini, M.; Mourier, P.A.J.; Torri, G.; Viskov, C. Antithrombin-binding oligosaccharides: Structural diversities in a unique function? Glycoconj. J. 2014, 31, 409–416. [Google Scholar] [CrossRef] [PubMed]
- Pomin, V.H. Solution NMR conformation of glycosaminoglycans. Prog. Biophys. Mol. Biol. 2014, 114, 61–68. [Google Scholar] [CrossRef] [PubMed]
- Nieto, P.M.; Angulo, J.; Canales, A.; Jiménez-Berbero, J. Major applications in therapeutic glycomics—Fibroblast growth factors (FGFs) interactions with GAGs: NMR studies using synthetic oligosaccharides. In New Developments in Therapeutic Glycomics; Delehedde, M., Lortat-Jacob, H., Eds.; Research Signpost: Kerala, India, 2006; pp. 227–250. [Google Scholar]
- Toukach, F.V.; Ananikov, V.P. Recent advances in computational predictions of NMR parameters for the structure elucidation of carbohydrates: Methods and limitations. Chem. Soc. Rev. 2013, 42, 8376–8415. [Google Scholar] [CrossRef] [PubMed]
- Langeslay, D.J.; Young, R.P.; Beni, S.; Beecher, C.N.; Mueller, L.J.; Larive, C.K. Sulfamate proton solvent exchange in heparin oligosaccharides: Evidence for a persistent hydrogen bond in the antithrombin-binding pentasaccharide Arixtra. Glycobiology 2012, 22, 1173–1182. [Google Scholar] [CrossRef] [PubMed]
- Rudd, T.R.; Hussain, R.; Siligardi, G.; Yates, E.A. Raman and Raman optical activity of glycosaminoglycans. Chem. Commun. 2010, 46, 4124–4126. [Google Scholar] [CrossRef] [PubMed]
- Beecher, C.N.; Young, R.P.; Langeslay, D.J.; Mueller, L.J.; Larive, C.K. Hydroxyl-proton hydrogen bonding in the heparin oligosaccharide arixtra in aqueous solution. J. Phys. Chem. B 2014, 118, 482–491. [Google Scholar] [CrossRef] [PubMed]
- Rudd, T.R.; Yates, E.A.; Hricovíni, M. Spectroscopic and Theoretical Approaches for the Determination of Heparin Saccharide Structure and the Study of Protein-Glycosaminoglycan Complexes in Solution. Curr. Med. Chem. 2009, 16, 4750–4766. [Google Scholar] [CrossRef] [PubMed]
- Hughes, A.; Meneghetti, M.; Huang, T.Y.; Hung, S.C.; Elli, S.; Guerrini, M.; Rudd, T.; Lima, M.; Yates, E. Investigating the relationship between temperature, conformation and calcium binding in heparin model oligosaccharides. Carbohydr. Res. 2017, 438, 58–64. [Google Scholar] [CrossRef] [PubMed]
- Guerrini, M.; Guglieri, S.; Beccati, D.; Torri, G.; Viskov, C.; Mourier, P. Conformational transitions induced in heparin octasaccharides by binding with antithrombin III. Biochem. J. 2006, 399, 191–198. [Google Scholar] [CrossRef] [PubMed]
- Ferro, D.R.; Provasoli, A.; Ragazzi, M.; Torri, G.; Casu, B.; Gatti, G.; Jacquinet, J.-C.; Sinaÿ, P.; Petitou, M.; Choay, J. L-iduronate residue in heparin and in synthetic heparin. J. Am. Chem. Soc. 1986, 108, 6773–6778. [Google Scholar] [CrossRef]
- Rabenstein, D.L.; Robert, J.M.; Peng, J. Multinuclear magnetic resonance studies of the interaction of inorganic cations with heparin. Carbohydr. Res. 1995, 278, 239–256. [Google Scholar] [CrossRef]
- Forster, M.J.; Mulloy, B. Molecular dynamics study of iduronate ring conformation. Biopolymers 1993, 33, 575–588. [Google Scholar] [CrossRef]
- Hricovíni, M. B3LYP/6-311++G** study of structure and spin-spin coupling constant in methyl 2-O-sulfo-α-l-iduronate. Carbohydr. Res. 2006, 341, 2575–2580. [Google Scholar] [CrossRef] [PubMed]
- Pol-Fachin, L.; Verli, H. Depiction of the forces participating in the 2-O-sulfo-α-l-iduronic acid conformational preference in heparin sequences in aqueous solutions. Carbohydr. Res. 2008, 343, 1435–1445. [Google Scholar] [CrossRef] [PubMed]
- Samsonov, S.A.; Pisabarro, M.T. Importance of IdoA and IdoA(2S) ring conformations in computational studies of glycosaminoglycan-protein interactions. Carbohydr. Res. 2013, 381, 133–137. [Google Scholar] [CrossRef] [PubMed]
- Sawada, T.; Fedorov, D.G.; Kitaura, K. Rationale for mixing exact exchange with density functional approximations. Int. J. Quantum Chem. 1996, 109, 2033–2045. [Google Scholar] [CrossRef]
- Hricovíni, M. Effect of solvent and counterions upon structure and NMR spin-spin coupling constants in heparin disaccharide. J. Phys. Chem. B 2011, 115, 1503–1511. [Google Scholar] [CrossRef] [PubMed]
- Hricovíni, M.; Driguez, P.A.; Malkina, O. NMR and DFT Analysis of Trisaccharide from Heparin Repeating-Sequence. J. Phys. Chem. B 2014, 118, 11931–11942. [Google Scholar] [CrossRef] [PubMed]
- Hricovíni, M. Solution Structure of Heparin Pentasaccharide: NMR and DFT Analysis. J. Phys. Chem. B 2015, 119, 12397–12409. [Google Scholar] [CrossRef] [PubMed]
- Poletti, L.; Fleischer, M.; Vogel, C.; Guerrini, M.; Torri, G.; Lay, L. A rational approach to heparin-related fragments—Synthesis of differently sulfated tetrasaccharides as potential ligands for fibroblast growth factors. European J. Org. Chem. 2001, 2727–2734. [Google Scholar] [CrossRef]
- Becke, A.D. Density-functional thermochemistry. III. The role of exact exchange. J. Chem. Phys. 1993, 98, 5648–5652. [Google Scholar] [CrossRef]
- Krishnan, R.; Binkley, J.S.; Seeger, R.; Pople, J.A. Self-consistent molecular orbital methods. XX. A basis set for correlated wave functions. J. Chem. Phys. 1980, 72, 650–654. [Google Scholar] [CrossRef]
- Casewit, C.J.; Colwell, K.S.; Rappé, A.K. Application of a Universal Force Field to Organic Molecules. J. Am. Chem. Soc. 1992, 114, 10035–10046. [Google Scholar] [CrossRef]
- Frisch, M.J.; Trucks, G.W.; Schlegel, H.B.; Scuseria, G.E.; Robb, M.A.; Cheeseman, J.R.; Scalmani, G.; Barone, V.; Mennucci, B.; Petersson, G.A.; et al. Gaussian 09, Revision D01; Gaussian, Inc.: Wallingford, UK, 2009. [Google Scholar]
- Lamba, D.; Glover, S.; Mackie, W.; Rashid, A.; Sheldrick, B.; Pérez, S. Insights into stereochemical features of sulphated carbohydrates: X-ray crystallographic and modelling investigations. Glycobiology 1994, 4, 151–163. [Google Scholar] [CrossRef] [PubMed]
- Yates, E.A.; Mackie, W.; Lamba, D. The crystal and molecular structure of 2-sulfamino-2-deoxy-α-d-glucopyranose sodium salt·2H2O (glucosamine 2-sulfate). Int. J. Biol. Macromol. 1995, 17, 219–226. [Google Scholar] [CrossRef]
- Ragazzi, M.; Ferro, D.R.; Perly, B.; Sinaÿ, P.; Petitou, M.; Choay, J. Conformation of the pentasaccharide corresponding to the binding site of heparin for antithrombin III. Carbohydr. Res. 1990, 195, 169–185. [Google Scholar] [CrossRef]
- Godbout, N.; Salahub, D.R.; Andzelm, J.; Wimmer, E. Optimization of Gaussian-type basis sets for local spin density functional calculations. Part I. Boron through neon, optimization technique and validation. Can. J. Chem. 1992, 70, 560–571. [Google Scholar] [CrossRef]
Sample Availability: Not available. |


| Residue | Bond | 1 | 2 |
|---|---|---|---|
| GlcNS,6SNR | C1-C2 | 1.546 | 1.531 |
| C1-O5 | 1.405 | 1.417 | |
| C1-O1 | 1.411 | 1.415 | |
| O1-C4IdoA2S(NR) | 1.409 | 1.444 | |
| IdoA2SNR | C1-C2 | 1.544 | 1.540 |
| C1-O5 | 1.388 | 1.407 | |
| C1-O1 | 1.451 | 1.424 | |
| O1-C4GlcN,6S(R) | 1.430 | 1.443 | |
| C6-O51 | 1.270 | 1.256 | |
| C6-O52 | 1.239 | 1.260 | |
| GlcNS,6SR | C1-C2 | 1.544 | 1.532 |
| C1-O5 | 1.416 | 1.422 | |
| C1-O1 | 1.397 | 1.414 | |
| O1-C4IdoA2S(NR) | 1.434 | 1.436 | |
| IdoA2SR | C1-C2 | 1.540 | 1.539 |
| C1-O5 | 1.408 | 1.422 | |
| C1-O1 | 1.418 | 1.431 | |
| C6-O51 | 1.263 | 1.257 | |
| C6-O52 | 1.248 | 1.256 | |
| GlcNS,6SNR | O5-C1-C2 | 113.4 | 109.0 |
| O5-C1-O1 | 112.4 | 111.0 | |
| C1-O1-C4IdoA2S(NR) | 123.3 | 117.0 | |
| IdoA2SNR | O5-C1-C2 | 115.2 | 115.1 |
| O5-C1-O1 | 113.2 | 113.4 | |
| C1-O1-C4GlcN,S(R) | 119.7 | 120.1 | |
| GlcNS,6SR | O5-C1-C2 | 108.7 | 109.1 |
| O5-C1-O1 | 113.5 | 111.2 | |
| C1-O1-C4IdoA2S(R) | 122.0 | 117.2 | |
| IdoA2SR | O5-C1-C2 | 113.2 | 112.2 |
| O5-C1-O1 | 112.3 | 109.3 | |
| C1-O1-CMe | 114.4 | 112.3 |
| Residue | Torsion Angle | 1 | 2 |
|---|---|---|---|
| GlcNS,6SNR | O5-C1-C2-C3 | 48 | 64 |
| H1-C1-C2-H2 | 46 | 66 | |
| H2-C2-C3-H3 | −160 | 174 | |
| H3-C3-C4-H4 | 161 | 165 | |
| H4-C4-C5-H5 | −170 | −162 | |
| H1-C1-O1-C4IdoA2S(NR) | −67 | −39 | |
| IdoA2SNR | O5-C1-C2-C3 | −36 | 12 |
| H1-C1-C2-H2 | 85 | 133 | |
| H2-C2-C3-H3 | −84 | −144 | |
| H3-C3-C4-H4 | 73 | 115 | |
| H4-C4-C5-H5 | 59 | 47 | |
| H4-C4-O1-C1GlcN,6S(NR) | −44 | −48 | |
| H1-C1-O1-C4GlcN,6S(R) | 99 | 76 | |
| GlcNS,6SR | O5-C1-C2-C3 | 68 | 61 |
| H1-C1-C2-H2 | 67 | 61 | |
| H2-C2-C3-H3 | 168 | 176 | |
| H3-C3-C4-H4 | 176 | 165 | |
| H4-C4-C5-H5 | −161 | −161 | |
| H4-C4-O1-C1IdoAS(NR) | 18 | 16 | |
| H1-C1-O1-C4IdoA2S(R) | −38 | −33 | |
| IdoA2SNR | O5-C1-C2-C3 | −50 | 33 |
| H1-C1-C2-H2 | 72 | 153 | |
| H2-C2-C3-H3 | −75 | −177 | |
| H3-C3-C4-H4 | 70 | 141 | |
| H4-C4-C5-H5 | 56 | 42 | |
| H4-C4-O1-C1GlcN,6S(R) | −24 | −46 |
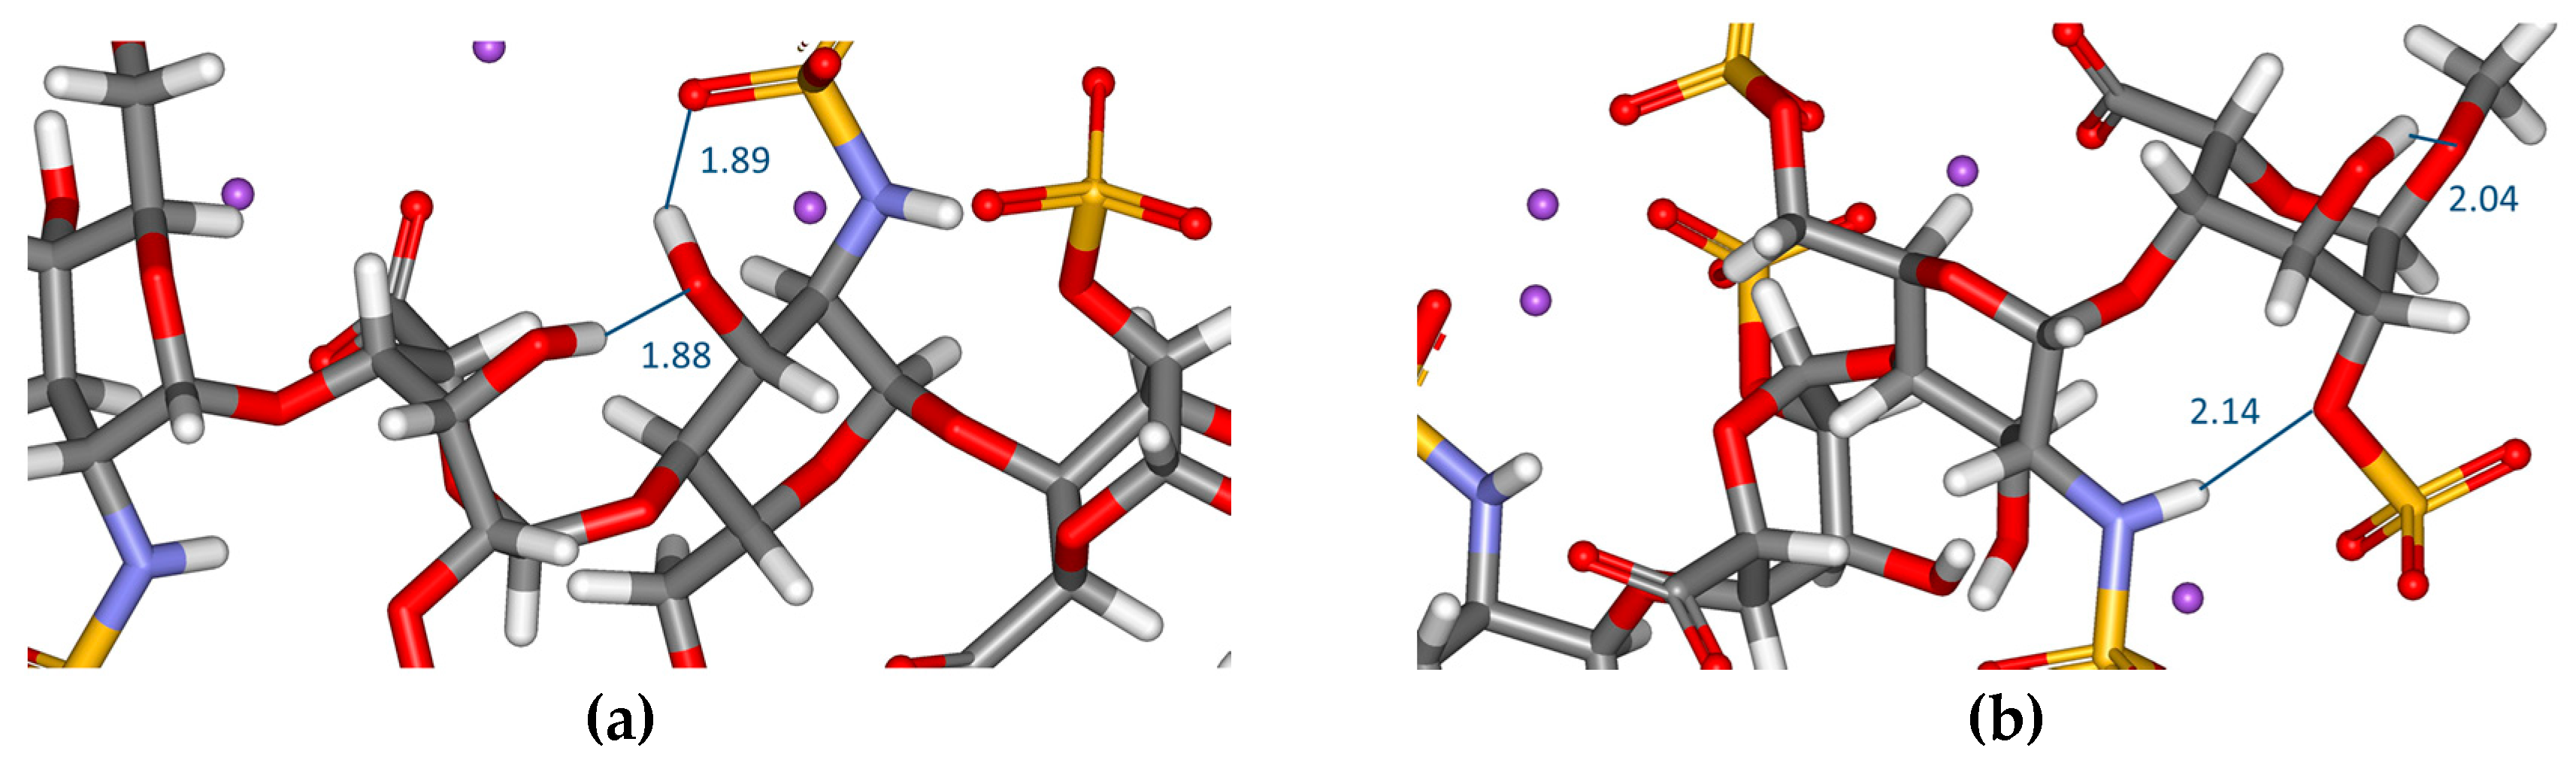
| Residue | Hydrogen Bonds–Intraresidue | 1 | 2 |
|---|---|---|---|
| GlcNS,6SNR | OH (C–3)···SO3 (NSO3-) | 1.9 | 2.1 |
| OH (C–4)···6–O (6-O-SO3-) | 2.1 | 2.2 | |
| NH···1–O (glycosidic) | 2.1 | - | |
| IdoA2SNR | OH (C–3)···SO3 (2-O-SO3-) | - | 1.9 |
| GlcNS,6SR | OH (C–3)···SO3 (NSO3-) | 1.9 | 2.0 |
| IdoA2SR | OH (C–3)···1–O (-O-CH3) | 2.0 | - |
| OH (C–3)···2–O (2-O-SO3-) | - | 2.2 | |
| Hydrogen bonds–Interresidue | |||
| OH (C–3) IdoA2SNR···OH (C–3) GlcNS,6SR | 1.9 | - | |
| NH GlcNS,6SR···2–O (2–O–SO3-) IdoA2SR | 2.1 | - |
| Residue | Array of Atoms | Torsion Angles 1 | Torsion Angles 2 | 3JH-C-C-H 1 | 3JH-C-C-H 2 | <3JH-C-C-H> 67:33 (1:2) | Expt. * |
|---|---|---|---|---|---|---|---|
| GlcNS,6SNR | H1-H2 | 45.6 | 65.5 | 4.45 | 2.89 | 3.9 | 3.5 |
| H2-H3 | −160.0 | 174.0 | 9.17 | 11.52 | 10.0 | 10.3 | |
| H3-H4 | 160.6 | 164.7 | 8.97 | 9.47 | 9.1 | 9.7 | |
| H4-H5 | −169.9 | −161.6 | 10.27 | 9.41 | 9.9 | 9.7 | |
| IdoA2SNR | H1-H2 | 85.2 | 133.2 | 1.19 | 3.95 | 2.1 | 2.9 |
| H2-H3 | −83.7 | −144.0 | 1.77 | 6.17 | 3.2 | 5.4 | |
| H3-H4 | 73.3 | 114.9 | 3.27 | 2.34 | 3.0 | 3.8 | |
| H4-H5 | 59.0 | 47.0 | 2.46 | 3.45 | 2.8 | 2.7 | |
| GlcNS,6SR | H1-H2 | 66.7 | 61.4 | 2.92 | 3.37 | 3.1 | 3.5 |
| H2-H3 | 168.3 | 175.6 | 10.33 | 12.32 | 10.9 | 10.3 | |
| H3-H4 | 175.8 | 164.9 | 10.11 | 9.62 | 9.9 | 9.2 | |
| H4-H5 | −160.5 | −161.1 | 9.54 | 9.31 | 9.5 | 9.2 | |
| IdoA2SR | H1-H2 | 72.4 | 152.8 | 1.50 | 6.00 | 3.0 | 2.9 |
| H2-H3 | −74.7 | −177.4 | 2.64 | 10.62 | 5.3 | 5.3 | |
| H3-H4 | 70.0 | 140.6 | 3.49 | 3.58 | 3.5 | 3.9 | |
| H4-H5 | 55.9 | 42.0 | 2.41 | 4.23 | 3.0 | 2.7 |
| Conf. Residue | Array of Atoms | Torsion Angles | Fermi Contact | Spin–Dipolar | Paramgn. Spin–Orbit | Diamgn. Spin–Orbit | Total 3JH-C-C-H |
|---|---|---|---|---|---|---|---|
| GlcN,6SNR | H1-H2 | 45.6 | 3.66 | 0.13 | −1.12 | 1.78 | 4.45 |
| H2-H3 | −160.0 | 9.54 | 0.04 | 0.66 | −1.07 | 9.17 | |
| H3-H4 | 160.6 | 9.45 | 0.04 | 0.74 | −1.26 | 8.97 | |
| H4-H5 | −169.9 | 10.64 | 0.04 | 0.63 | −1.04 | 10.27 | |
| IdoA2SNR | H1-H2 | 85.2 | 0.32 | 0.04 | −0.93 | 1.76 | 1.19 |
| H2-H3 | −83.7 | 1.30 | 0.03 | −0.71 | 1.15 | 1.77 | |
| H3-H4 | 73.3 | 2.71 | 0.06 | −0.96 | 1.46 | 3.27 | |
| H4-H5 | 59.0 | 1.34 | 0.09 | −1.73 | 2.76 | 2.46 | |
| GlcN,6SR | H1-H2 | 66.7 | 2.34 | 0.06 | −0.92 | 1.44 | 2.92 |
| H2-H3 | 168.3 | 10.54 | 0.04 | 0.44 | −0.69 | 10.33 | |
| H3-H4 | 175.8 | 10.26 | 0.05 | 0.21 | −0.41 | 10.11 | |
| H4-H5 | −160.5 | 9.56 | 0.03 | 0.09 | −0.14 | 9.54 | |
| IdoA2SR | H1-H2 | 72.4 | 0.99 | 0.06 | −0.67 | 1.12 | 1.50 |
| H2-H3 | −74.7 | 2.24 | 0.04 | −0.68 | 1.04 | 2.64 | |
| H3-H4 | 70.0 | 3.07 | 0.07 | −0.75 | 1.10 | 3.49 | |
| H4-H5 | 55.9 | 1.64 | 0.12 | −1.24 | 1.89 | 2.41 |
| Conf. Residue | Array of Atoms | Torsion Angles | Fermi Contact | Spin–Dipolar | Paramgn. Spin–Orbit | Diamgn. Spin–Orbit | Total 3JH-C-C-H |
|---|---|---|---|---|---|---|---|
| GlcN,6SNR | H1-H2 | 65.5 | 2.32 | 0.08 | −0.91 | 1.40 | 2.89 |
| H2-H3 | 174.0 | 11.86 | 0.04 | 0.67 | −1.05 | 11.52 | |
| H3-H4 | 164.7 | 9.86 | 0.04 | 0.71 | −1.14 | 9.47 | |
| H4-H5 | −161.6 | 9.73 | 0.04 | 0.65 | −1.01 | 9.41 | |
| IdoA2SNR | H1-H2 | 133.2 | 3.74 | 0.01 | 0.06 | 0.14 | 3.95 |
| H2-H3 | − 144.0 | 6.19 | 0.03 | 0.21 | −0.26 | 6.17 | |
| H3-H4 | 114.9 | 2.27 | 0.01 | −0.16 | 0.24 | 2.34 | |
| H4-H5 | 47.0 | 2.51 | 0.12 | −1.41 | 2.23 | 3.45 | |
| GlcN,6SR | H1-H2 | 61.4 | 2.75 | 0.09 | −1.00 | 1.53 | 3.37 |
| H2-H3 | 175.6 | 12.61 | 0.05 | 0.55 | −0.89 | 12.32 | |
| H3-H4 | 164.9 | 9.81 | 0.04 | 0.37 | −0.60 | 9.62 | |
| H4-H5 | −161.1 | 9.40 | 0.04 | 0.31 | −0.44 | 9.31 | |
| IdoA2SR | H1-H2 | 152.8 | 6.30 | 0.04 | 0.71 | −1.05 | 6.00 |
| H2-H3 | −177.4 | 10.96 | 0.05 | 0.68 | −1.07 | 10.62 | |
| H3-H4 | 140.6 | 3.86 | 0.02 | 0.45 | −0.75 | 3.58 | |
| H4-H5 | 42.0 | 3.28 | 0.14 | −1.42 | 2.23 | 4.23 |
| Residue | Array | Torsion Angle | FC | SD | PSO | DSO | Total | |
|---|---|---|---|---|---|---|---|---|
| Monosaccharide [21] | IdoA2SOMe | H1-H2 | 72 | 1.32 | 0.05 | −0.45 | 0.74 | 1.67 |
| Disaccharide [25] | IdoA2SR | H1-H2 | 73 | 0.98 | 0.05 | −0.61 | 1.07 | 1.49 |
| Trisaccharide [26] | IdoA2SNR | H1-H2 | 75 | 1.05 | 0.04 | −1.07 | 1.70 | 1.72 |
| Tetrasaccharide * | IdoA2SNR | H1-H2 | 85 | 0.32 | 0.04 | −0.93 | 1.76 | 1.19 |
| Pentasaccharide [27] | IdoA2SNR | H1-H2 | 64 | 1.90 | 0.08 | −1.27 | 2.18 | 2.89 |
© 2018 by the authors. Licensee MDPI, Basel, Switzerland. This article is an open access article distributed under the terms and conditions of the Creative Commons Attribution (CC BY) license (http://creativecommons.org/licenses/by/4.0/).
Share and Cite
Hricovíni, M.; Hricovíni, M. Solution Conformation of Heparin Tetrasaccharide. DFT Analysis of Structure and Spin–Spin Coupling Constants. Molecules 2018, 23, 3042. https://doi.org/10.3390/molecules23113042
Hricovíni M, Hricovíni M. Solution Conformation of Heparin Tetrasaccharide. DFT Analysis of Structure and Spin–Spin Coupling Constants. Molecules. 2018; 23(11):3042. https://doi.org/10.3390/molecules23113042
Chicago/Turabian StyleHricovíni, Miloš, and Michal Hricovíni. 2018. "Solution Conformation of Heparin Tetrasaccharide. DFT Analysis of Structure and Spin–Spin Coupling Constants" Molecules 23, no. 11: 3042. https://doi.org/10.3390/molecules23113042
APA StyleHricovíni, M., & Hricovíni, M. (2018). Solution Conformation of Heparin Tetrasaccharide. DFT Analysis of Structure and Spin–Spin Coupling Constants. Molecules, 23(11), 3042. https://doi.org/10.3390/molecules23113042