
Chiral Separation of the Phenylglycinol Enantiomers by Stripping Crystallization


Abstract
:
1. Introduction
2. SC Model
3. Experimental Section
4. Results and Discussion
5. Conclusions
Funding
Acknowledgments
Conflicts of Interest
Notation
| ΔHm,i | heat of melting for component-i (>0), J/mol |
| ΔHV,i | heat of vaporization for component-i (>0), J/mol |
| Ln | mass of the liquid phase out of stage, n, g |
| N | an integer number (>2), dimensionless |
| P | pressure, Pa |
| RC | calculated recovery ratio, dimensionless |
| Rf | experimental recovery ratio, dimensionless |
| Sn | mass of the solid phase out of stage, n, g |
| T | boiling temperature of component-i, K |
| Tb.i | boiling temperature of component-i, K |
| Tm.i | melting temperature of component-i, K |
| Ttri.i | triple-point temperature of component-i, K |
| Vn | mass of the vapor phase out of stage, n, g |
| Xi | mole fraction of component-i in melt, dimensionless |
| Yi | mole fraction of component-i in vapor phase, dimensionless |
Subscript
| 0 | in the initial feed |
| n | in stage, |
| N | in the last stage |
References
- Jacques, J.; Collet, A.; Wilen, S.H. Enantiomers, Racemates, and Resolutions; John Wiley & Sons: New York, NY, USA, 1981. [Google Scholar]
- Subramanian, G. (Ed.) Chiral Separation Techniques; Wiley-VCH Verlag GmbH: Weinheim, Germany, 2000. [Google Scholar]
- Elsner, M.P.; Ziomek, G.; Seidel-Morgenstern, A. Simultaneous preferential crystallization in a coupled batch operation mode. Part II: Experimental study and model refinement. Chem. Eng. Sci. 2011, 66, 1269–1284. [Google Scholar] [CrossRef]
- Qamar, S.; Galan, K.; Elsner, M.P.; Hussain, I.; Seidel-Morgenstern, A. Theoretical investigation of simultaneous continuous preferential crystallization in a coupled mode. Chem. Eng. Sci. 2013, 98, 25–39. [Google Scholar] [CrossRef]
- Kollges, T.; Vetter, T. Model-based analysis of continuous crystallization/reaction processes separating conglomerate forming enantiomers. Cryst. Growth Des. 2017, 17, 233–247. [Google Scholar] [CrossRef]
- Majumder, A.; Nagy, Z.K. A comparative study of coupled preferential crystallizers for the efficient resolution of conglomerate-forming enantiomers. Pharmaceutics 2017, 9, 55. [Google Scholar] [CrossRef] [PubMed]
- Kupai, J.; Rojik, E.; Huszthy, P.; Szekely, G. Role of chirality and macroring in imprinted polymers with enantiodiscriminative power. ACS Appl. Mater. Interfaces 2015, 7, 9516–9525. [Google Scholar] [CrossRef] [PubMed]
- Tanaka, K.; Muraoka, T.; Oyubo, Y.; Takahashi, H.; Ohnishi, A. HPLC enantioseparation on a homochiral MOF-silica composite as a novel chiral stationary phase. RSC Adv. 2016, 6, 21293–21301. [Google Scholar] [CrossRef]
- Han, X.; Huang, J.; Yuan, C.; Liu, Y.; Cui, Y. Chiral 3D covalent organic frameworks for high performance liquid chromatographic enantioseparation. J. Am. Chem. Soc. 2018, 140, 892–895. [Google Scholar] [CrossRef] [PubMed]
- Bruno, R.; Marino, N.; Bartella, L.; Di Donna, L.; De Munno, G.; Pardo, E.; Armentano, D. Highly efficient temperature-dependent chiral separation with a nucleotide-based coordination polymer. Chem. Commun. 2018, 54, 6356–6359. [Google Scholar] [CrossRef] [PubMed]
- Didaskalou, C.; Kupai, J.; Cseri, L.; Barabas, J.; Vass, E.; Holtzl, T.; Szekely, G. Membrane-grafted asymmetric organocatalyst for an integrated synthesis-separation platform. ACS Catal. 2018, 8, 7430–7438. [Google Scholar] [CrossRef]
- Rukhlenko, I.D.; Tepliakov, N.V.; Baimuratov, A.S.; Andronaki, S.A.; Gun’ko, Y.K.; Baranov, A.V.; Fedorov, S.V. Completely chiral optical force for enantioseparation. Sci. Rep. 2016, 6, 36884. [Google Scholar] [CrossRef] [PubMed]
- Nguyen, T.N.T.; Magueur, G.; Ourevitch, M.; Crousse, B.; Begue, J.-P.; Bonnet-Delpon, D. Analogues of Key Precursors of Aspartyl Protease Inhibitors: Synthesis of Trifluoromethyl Amino Epoxides. J. Org. Chem. 2005, 70, 699–702. [Google Scholar]
- Babic, K.; Driessen, G.H.M.; van der Ham, A.G.J.; de Haan, A.B. Chiral separation of amino-alcohols using extractant impregnated resins. J. Chromatogr. A 2007, 1142, 84–92. [Google Scholar] [CrossRef] [PubMed]
- Steensma, M.; Kuipers, N.J.M.; de Haan, A.B.; Kwant, G. Influence of process parameters on extraction equilibria for the chiral separation of amines and amino-alcohols with a chiral crown ether. J. Chem. Technol. Biotechnol. 2006, 81, 588–597. [Google Scholar] [CrossRef]
- Schuur, B.; Steensma, M.; Winkelman, J.G.M.; De Vries, J.G.; De Haan, A.B.; Heeres, H.J. Continuous enantioseparation by liquid-liquid extraction. Chim. Oggi-Chem. Today 2009, 27, 9–12. [Google Scholar]
- Shiau, L.D.; Wen, C.C.; Lin, B.S. Separation and purification of p-xylene from the mixture of m-xylene and p-xylene by distillative freezing. Ind. Eng. Chem. Res. 2005, 44, 2258–2265. [Google Scholar] [CrossRef]
- Shiau, L.D.; Wen, C.C.; Lin, B.S. Application of distillative freezing in the separation of o-xylene and p-xylene. AIChE J. 2006, 52, 1962–1967. [Google Scholar] [CrossRef]
- Shiau, L.D.; Wen, C.C.; Lin, B.S. Separation of p xylene from the multicomponent xylene system by stripping crystallization. AIChE J. 2008, 54, 337–342. [Google Scholar] [CrossRef]
- Shiau, L.D. Purification of Styrene from a Styrene/Ethylbenzene Mixture by Stripping Crystallization. Ind. Eng. Chem. Res. 2018, 57, 6759–6765. [Google Scholar] [CrossRef]
- Shiau, L.D.; Liu, K.F.; Hsu, Y.C. Chiral purification of S-ibuprofen from ibuprofen enantiomers by stripping crystallization. Chem. Eng. Res. Des. 2017, 117, 301–308. [Google Scholar] [CrossRef]
- Ulrich, J. Melt Crystallization: Fundamentals, Equipment and Applications; Shaker: Aachen, Germany, 2003. [Google Scholar]
- Jiang, X.; Hou, B.; He, G.; Wang, J. Falling film melt crystallization (I): Model development, experimental validation of crystal layer growth and impurity distribution process. Chem. Eng. Sci. 2012, 84, 120–133. [Google Scholar] [CrossRef]
- Beierling, T.; Osiander, J.; Sadowski, G. Melt crystallization of isomeric long-chain aldehydes from hydroformylation. Sep. Purif. Technol. 2013, 118, 13–24. [Google Scholar] [CrossRef]
- Micovic, J.; Beierling, T.; Lutze, P.; Sadowski, G.; Górak, A. Design of hybrid distillation/melt crystallization processes for separation of close boiling mixtures. Chem. Eng. Process. Process Intensif. 2013, 67, 16–24. [Google Scholar] [CrossRef]
- Jiang, X.; Li, M.; He, G.; Wang, J. Research process and model development of crystal layer growth and impurity distribution in layer melt crystallization: A review. Ind. Eng. Chem. Res. 2014, 53, 13211–13227. [Google Scholar] [CrossRef]
- Fukui, K.; Fujikawa, T.; Satone, H.; Yamamoto, T.; Maeda, K. Application of solute distribution theory to melt crystallization of fatty acids. Chem. Eng. Sci. 2016, 143, 114–121. [Google Scholar] [CrossRef]
- Smith, J.M.; Van Ness, H.C.; Abbott, M.M. Introduction to Chemical Engineering Thermodynamics; McGraw-Hill Book Co.: Singapore, 2001. [Google Scholar]
- Sandler, S.I. Chemical, Biochemical, and Engineering Thermodynamics; John Wiley & Sons: Hoboken, NJ, USA, 2006. [Google Scholar]
- ONeil, M.J. The Merck Index: An Encyclopedia of Chemicals, Drugs, and Biologicals; Merck & Co., Inc.: Whitehouse Station, NJ, USA, 2006. [Google Scholar]
- Myerson, A.S.; Kirwan, D.J. Impurity trapping during dendritic crystal growth. 2. Experimental results and correlation. Ind. Eng. Chem. Fundam. 1977, 16, 420–425. [Google Scholar] [CrossRef]
- Myerson, A.S.; Kirwan, D.J. Impurity trapping during dendritic crystal growth. 1. Computer simulation. Ind. Eng. Chem. Fundam. 1977, 16, 414–420. [Google Scholar] [CrossRef]
Sample Availability: Samples of the compounds are not available from the authors |


| Property | Phenylglycinol |
|---|---|
| molecular structure |  |
| molecular weight | 137.2 |
| melting point a, °C | 77 |
| boiling point a, °C | 261 |
| triple-point pressure b, Pa (N/m2) | 198 |
| heat of melting c, J/mol | 2.57 × 10⁴ |
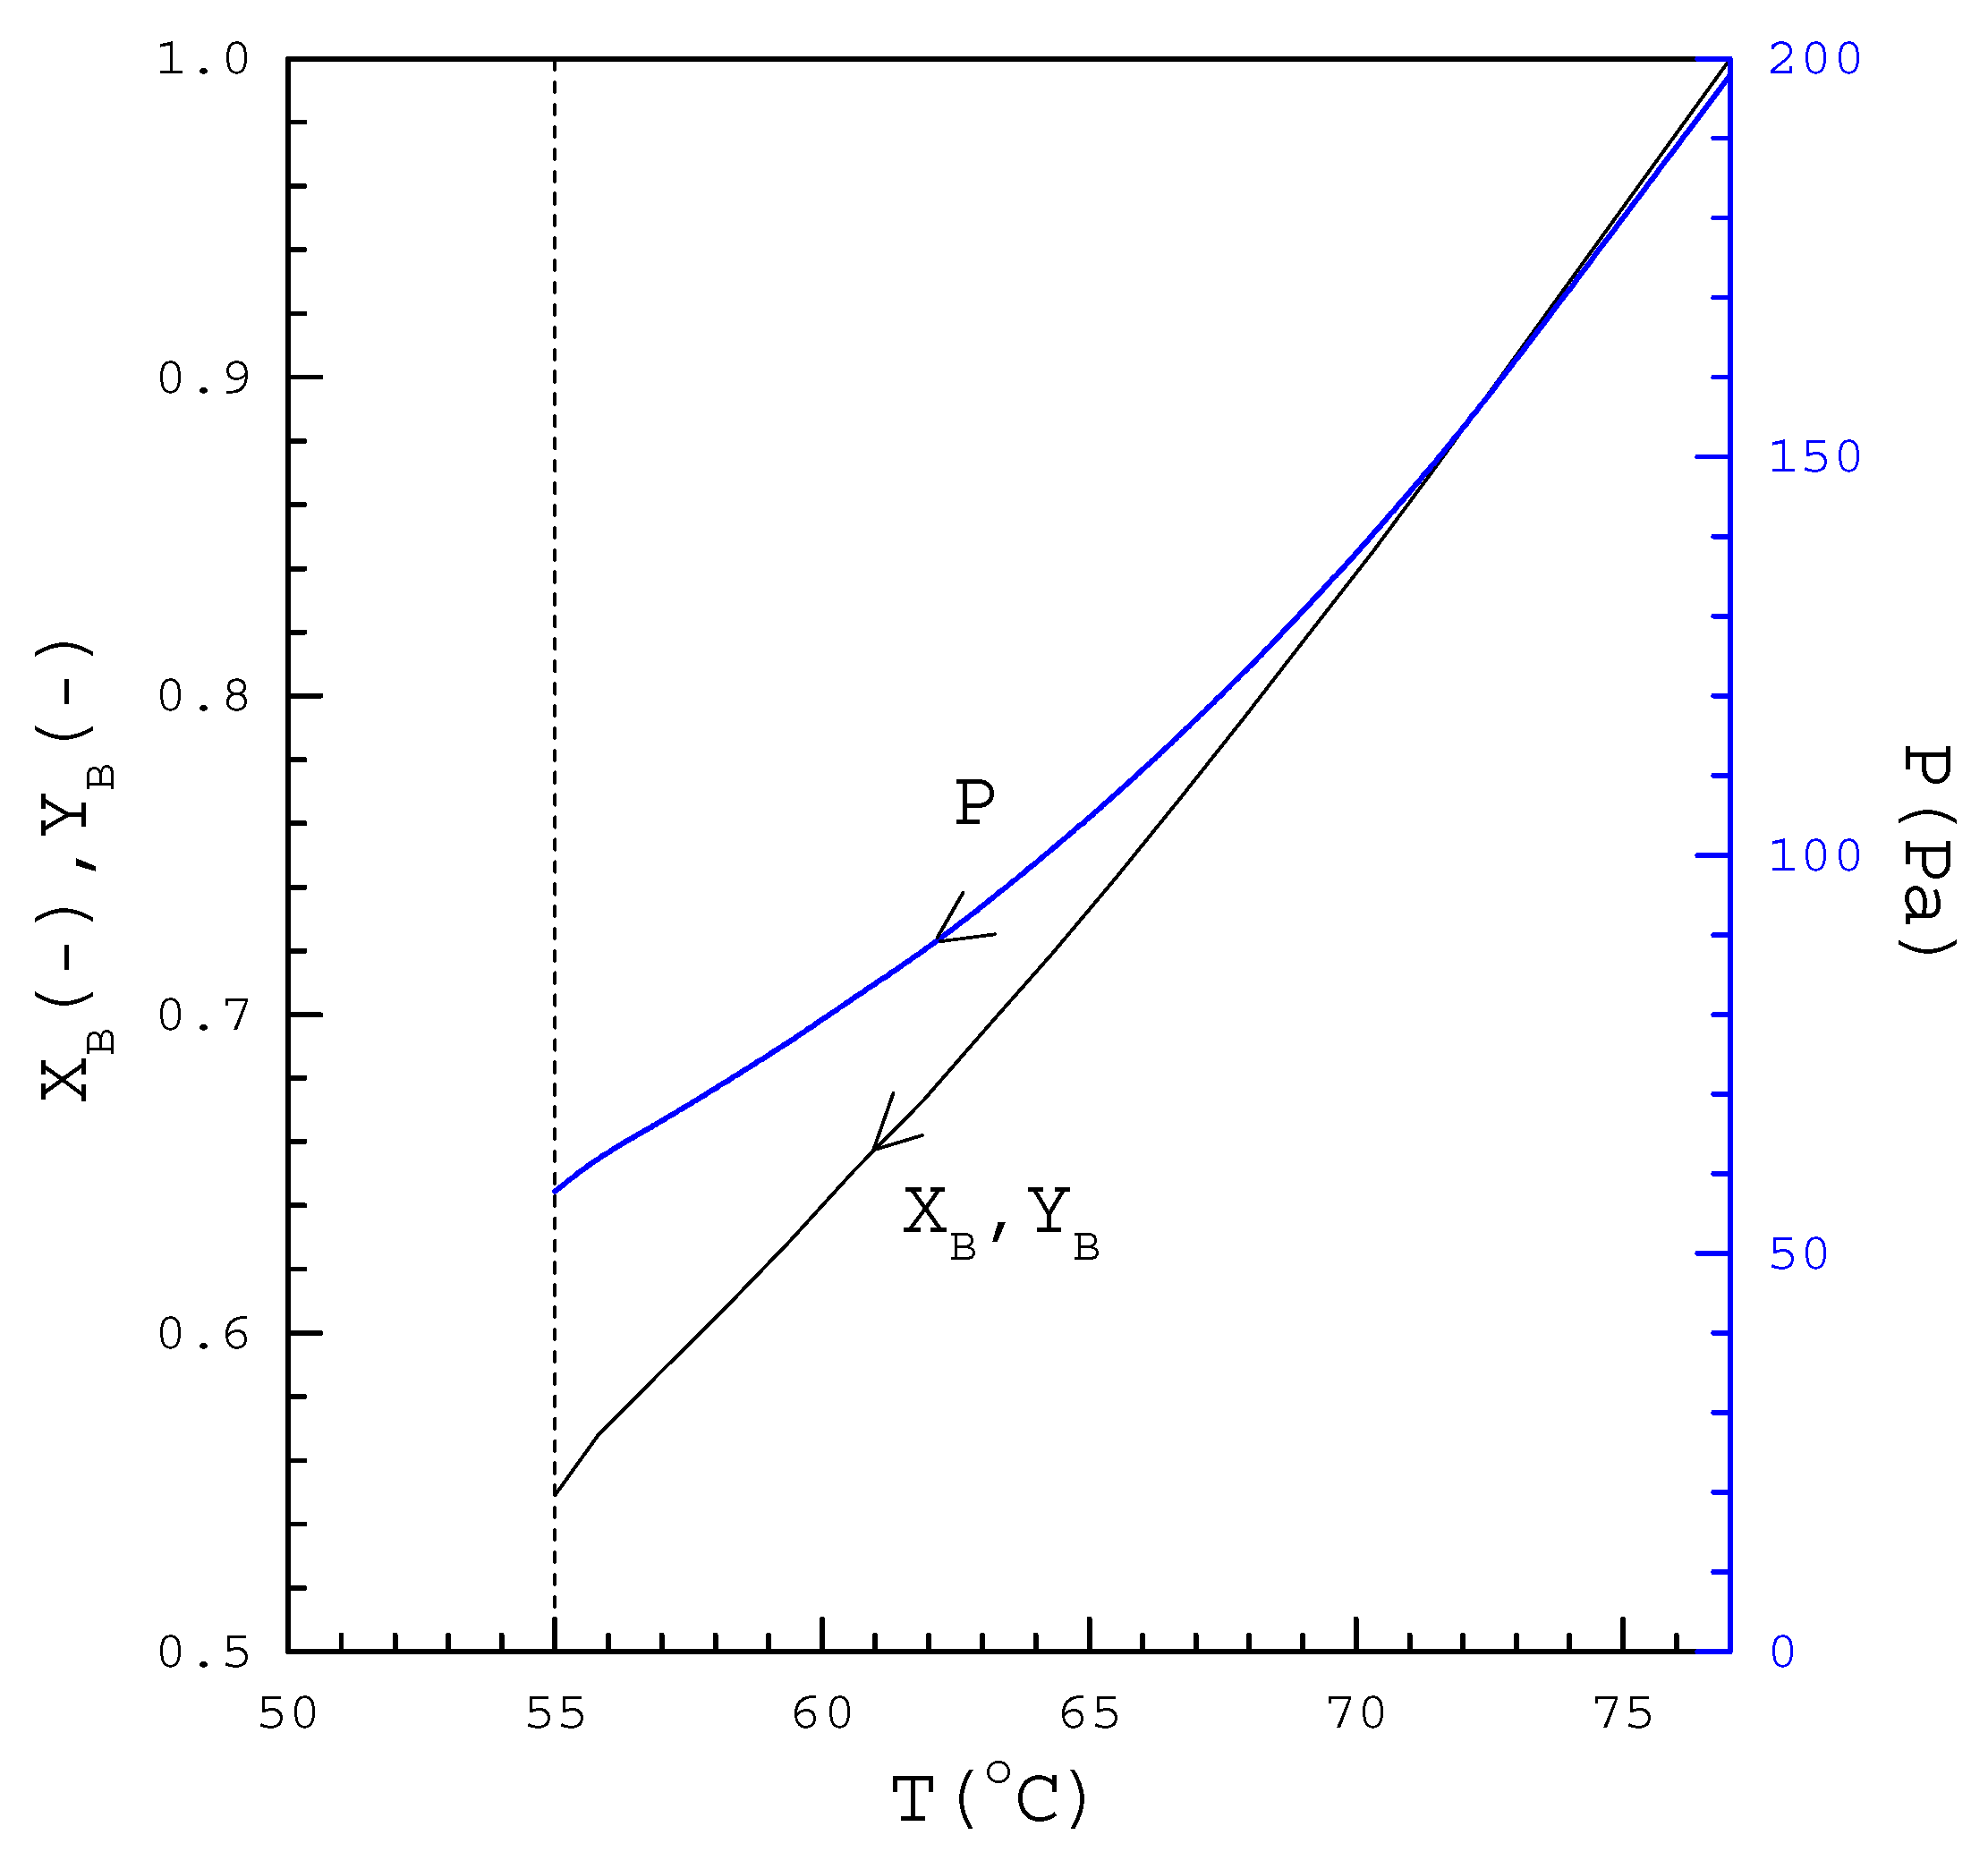
| n | T (°C) | P (Pa) | L (g) | S (g) | V (g) | XB |
|---|---|---|---|---|---|---|
| 0 | 72.7 | 159.4 | 1 | 0 | 0 | 0.90 |
| 1 | 71.5 | 149.5 | 0.672 | 0.219 | 0.109 | 0.872 |
| 2 | 70.3 | 140.1 | 0.496 | 0.336 | 0.059 | 0.845 |
| 3 | 69.1 | 131.3 | 0.389 | 0.407 | 0.036 | 0.819 |
| 4 | 67.9 | 122.9 | 0.316 | 0.456 | 0.024 | 0.793 |
| 5 | 66.7 | 115.1 | 0.265 | 0.490 | 0.017 | 0.768 |
| 6 | 65.5 | 107.6 | 0.226 | 0.516 | 0.013 | 0.743 |
| 7 | 64.3 | 100.7 | 0.197 | 0.535 | 0.010 | 0.719 |
| 8 | 63.1 | 94.1 | 0.175 | 0.550 | 0.007 | 0.696 |
| 9 | 61.9 | 87.9 | 0.156 | 0.562 | 0.006 | 0.673 |
| 10 | 60.6 | 82.1 | 0.142 | 0.572 | 0.005 | 0.651 |
| 11 | 59.4 | 76.6 | 0.129 | 0.581 | 0.004 | 0.629 |
| 12 | 58.2 | 71.5 | 0.119 | 0.588 | 0.003 | 0.608 |
| 13 | 57.0 | 66.6 | 0.110 | 0.593 | 0.003 | 0.588 |
| 14 | 55.8 | 62.1 | 0.102 | 0.598 | 0.003 | 0.568 |
| 15 | 54.6 | 57.8 | 0.096 | 0.603 | 0.002 | 0.549 |
© 2018 by the author. Licensee MDPI, Basel, Switzerland. This article is an open access article distributed under the terms and conditions of the Creative Commons Attribution (CC BY) license (http://creativecommons.org/licenses/by/4.0/).
Share and Cite
Shiau, L.-D. Chiral Separation of the Phenylglycinol Enantiomers by Stripping Crystallization. Molecules 2018, 23, 2901. https://doi.org/10.3390/molecules23112901
Shiau L-D. Chiral Separation of the Phenylglycinol Enantiomers by Stripping Crystallization. Molecules. 2018; 23(11):2901. https://doi.org/10.3390/molecules23112901
Chicago/Turabian StyleShiau, Lie-Ding. 2018. "Chiral Separation of the Phenylglycinol Enantiomers by Stripping Crystallization" Molecules 23, no. 11: 2901. https://doi.org/10.3390/molecules23112901
APA StyleShiau, L.-D. (2018). Chiral Separation of the Phenylglycinol Enantiomers by Stripping Crystallization. Molecules, 23(11), 2901. https://doi.org/10.3390/molecules23112901