Novel Arsenic Markers for Discriminating Wild and Cultivated Cordyceps


Abstract
1. Introduction
2. Results
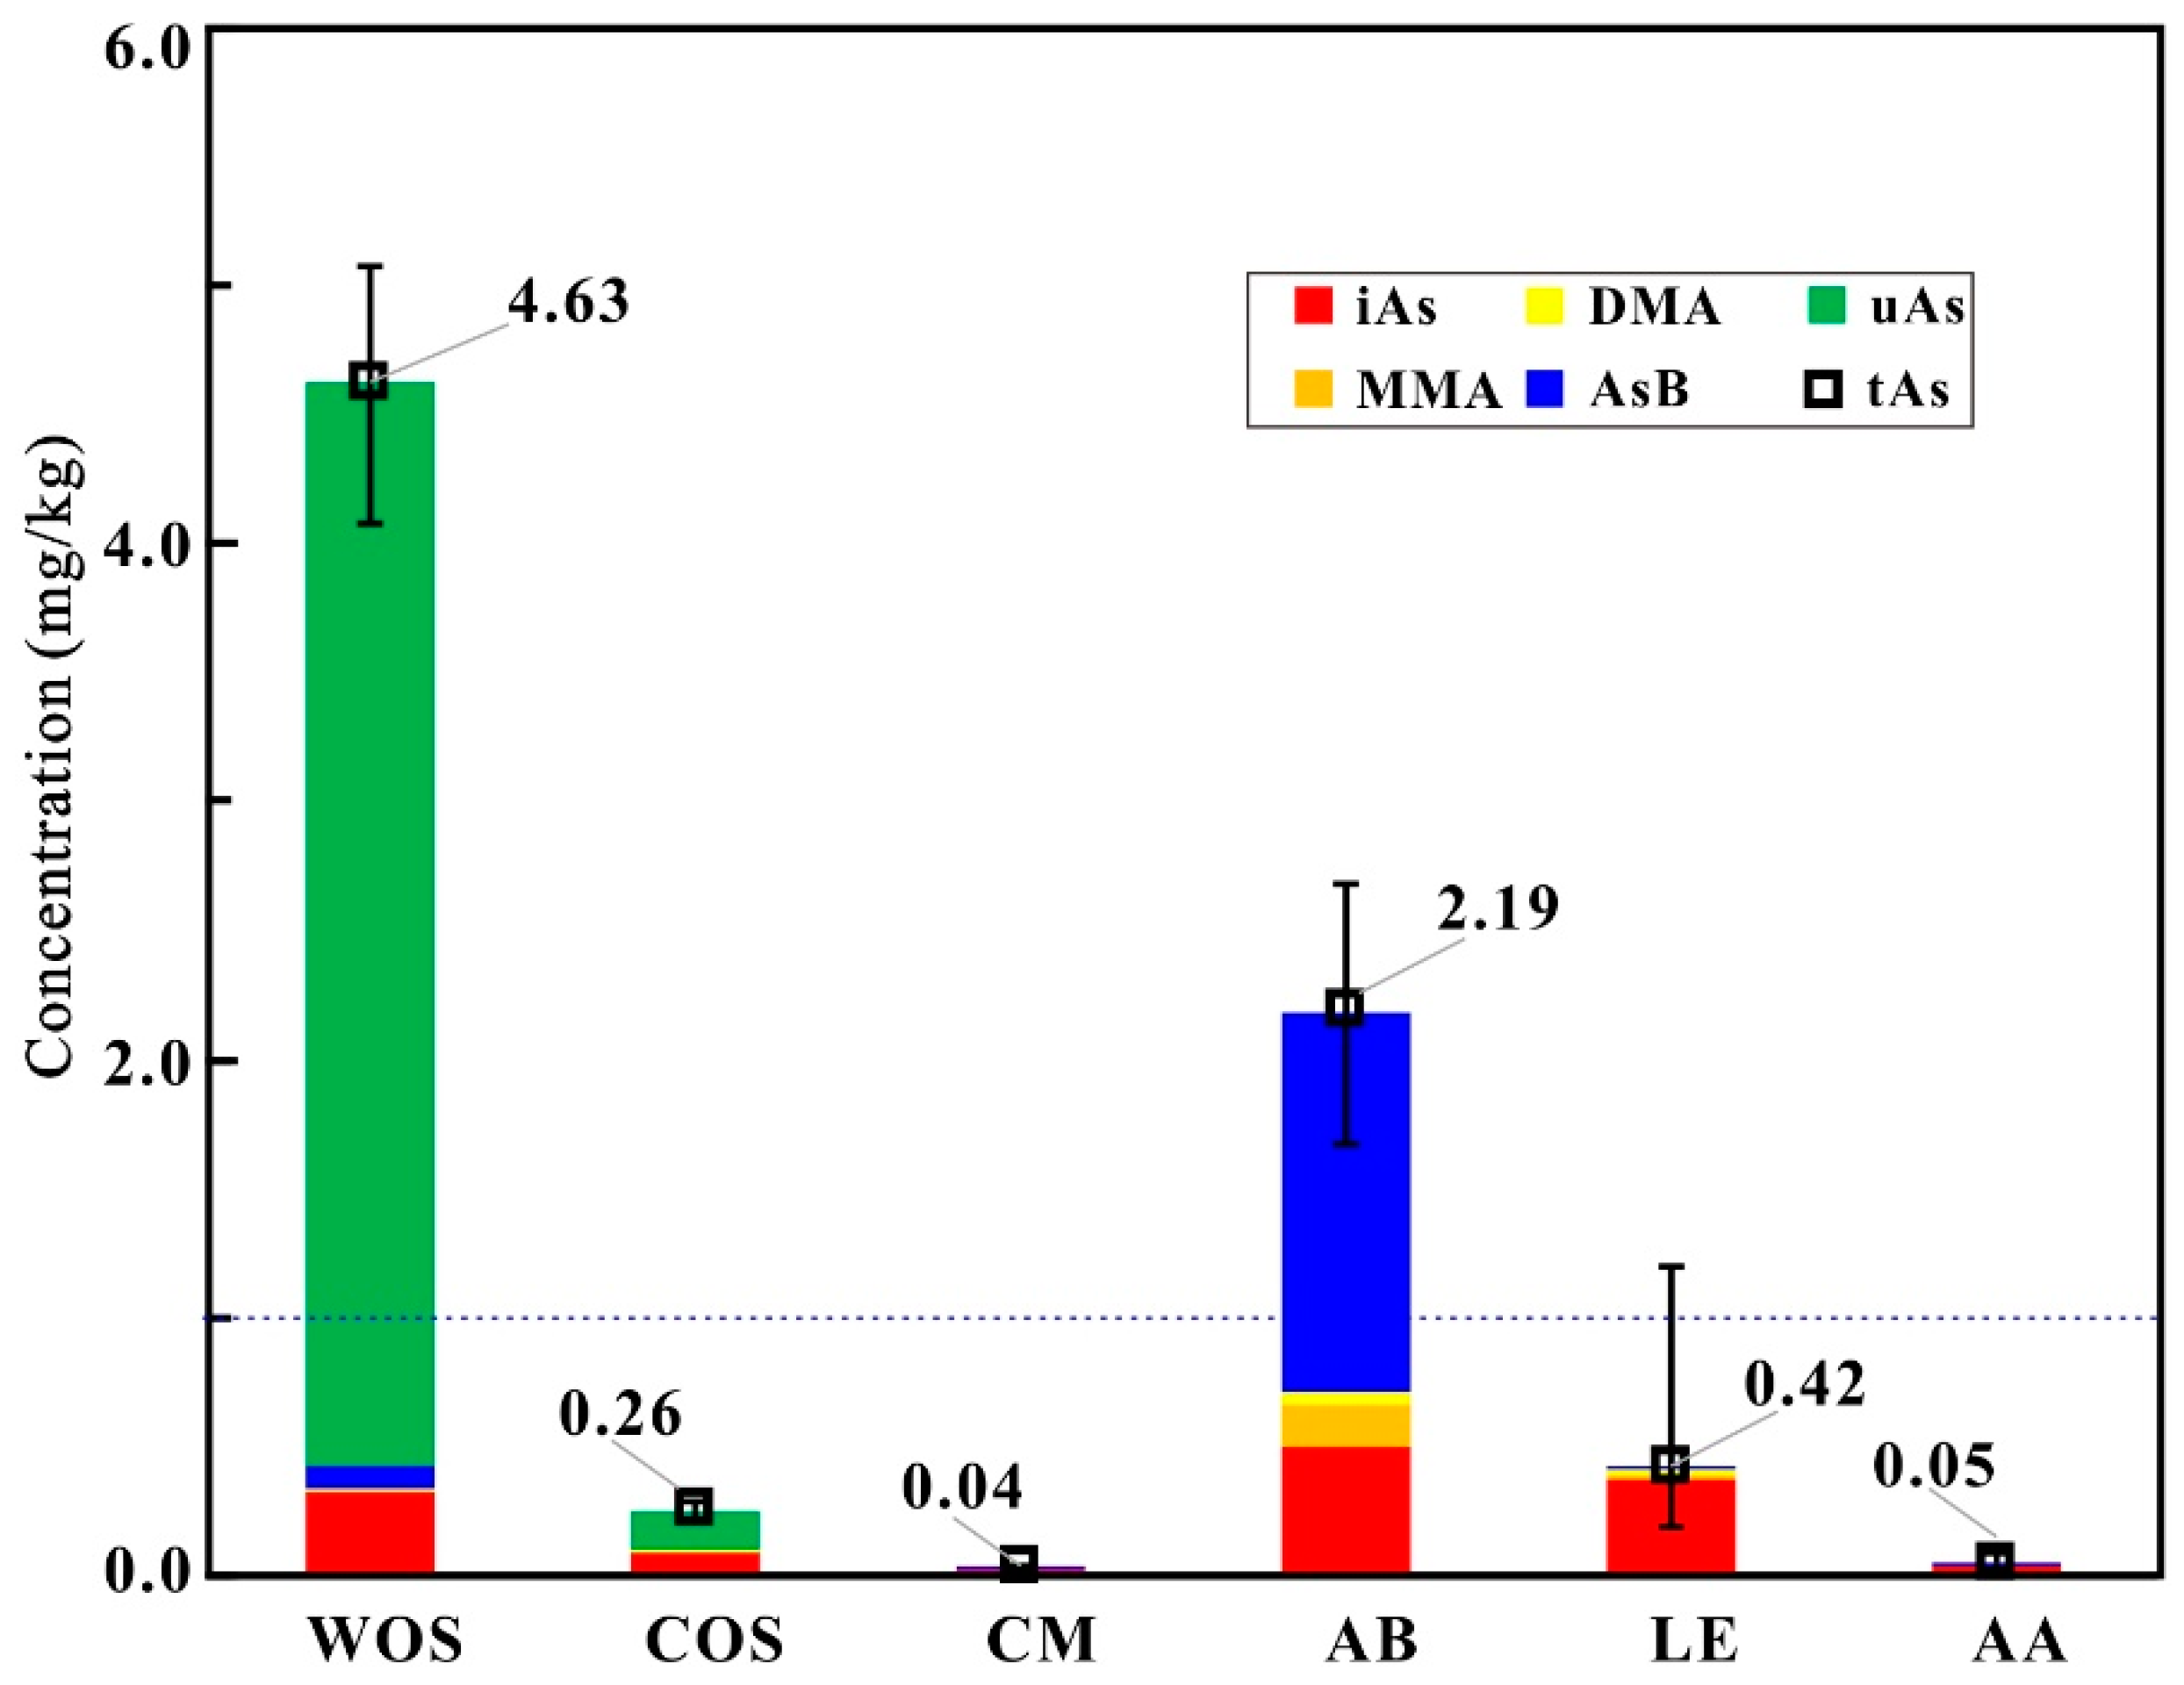
2.1. Total Arsenic
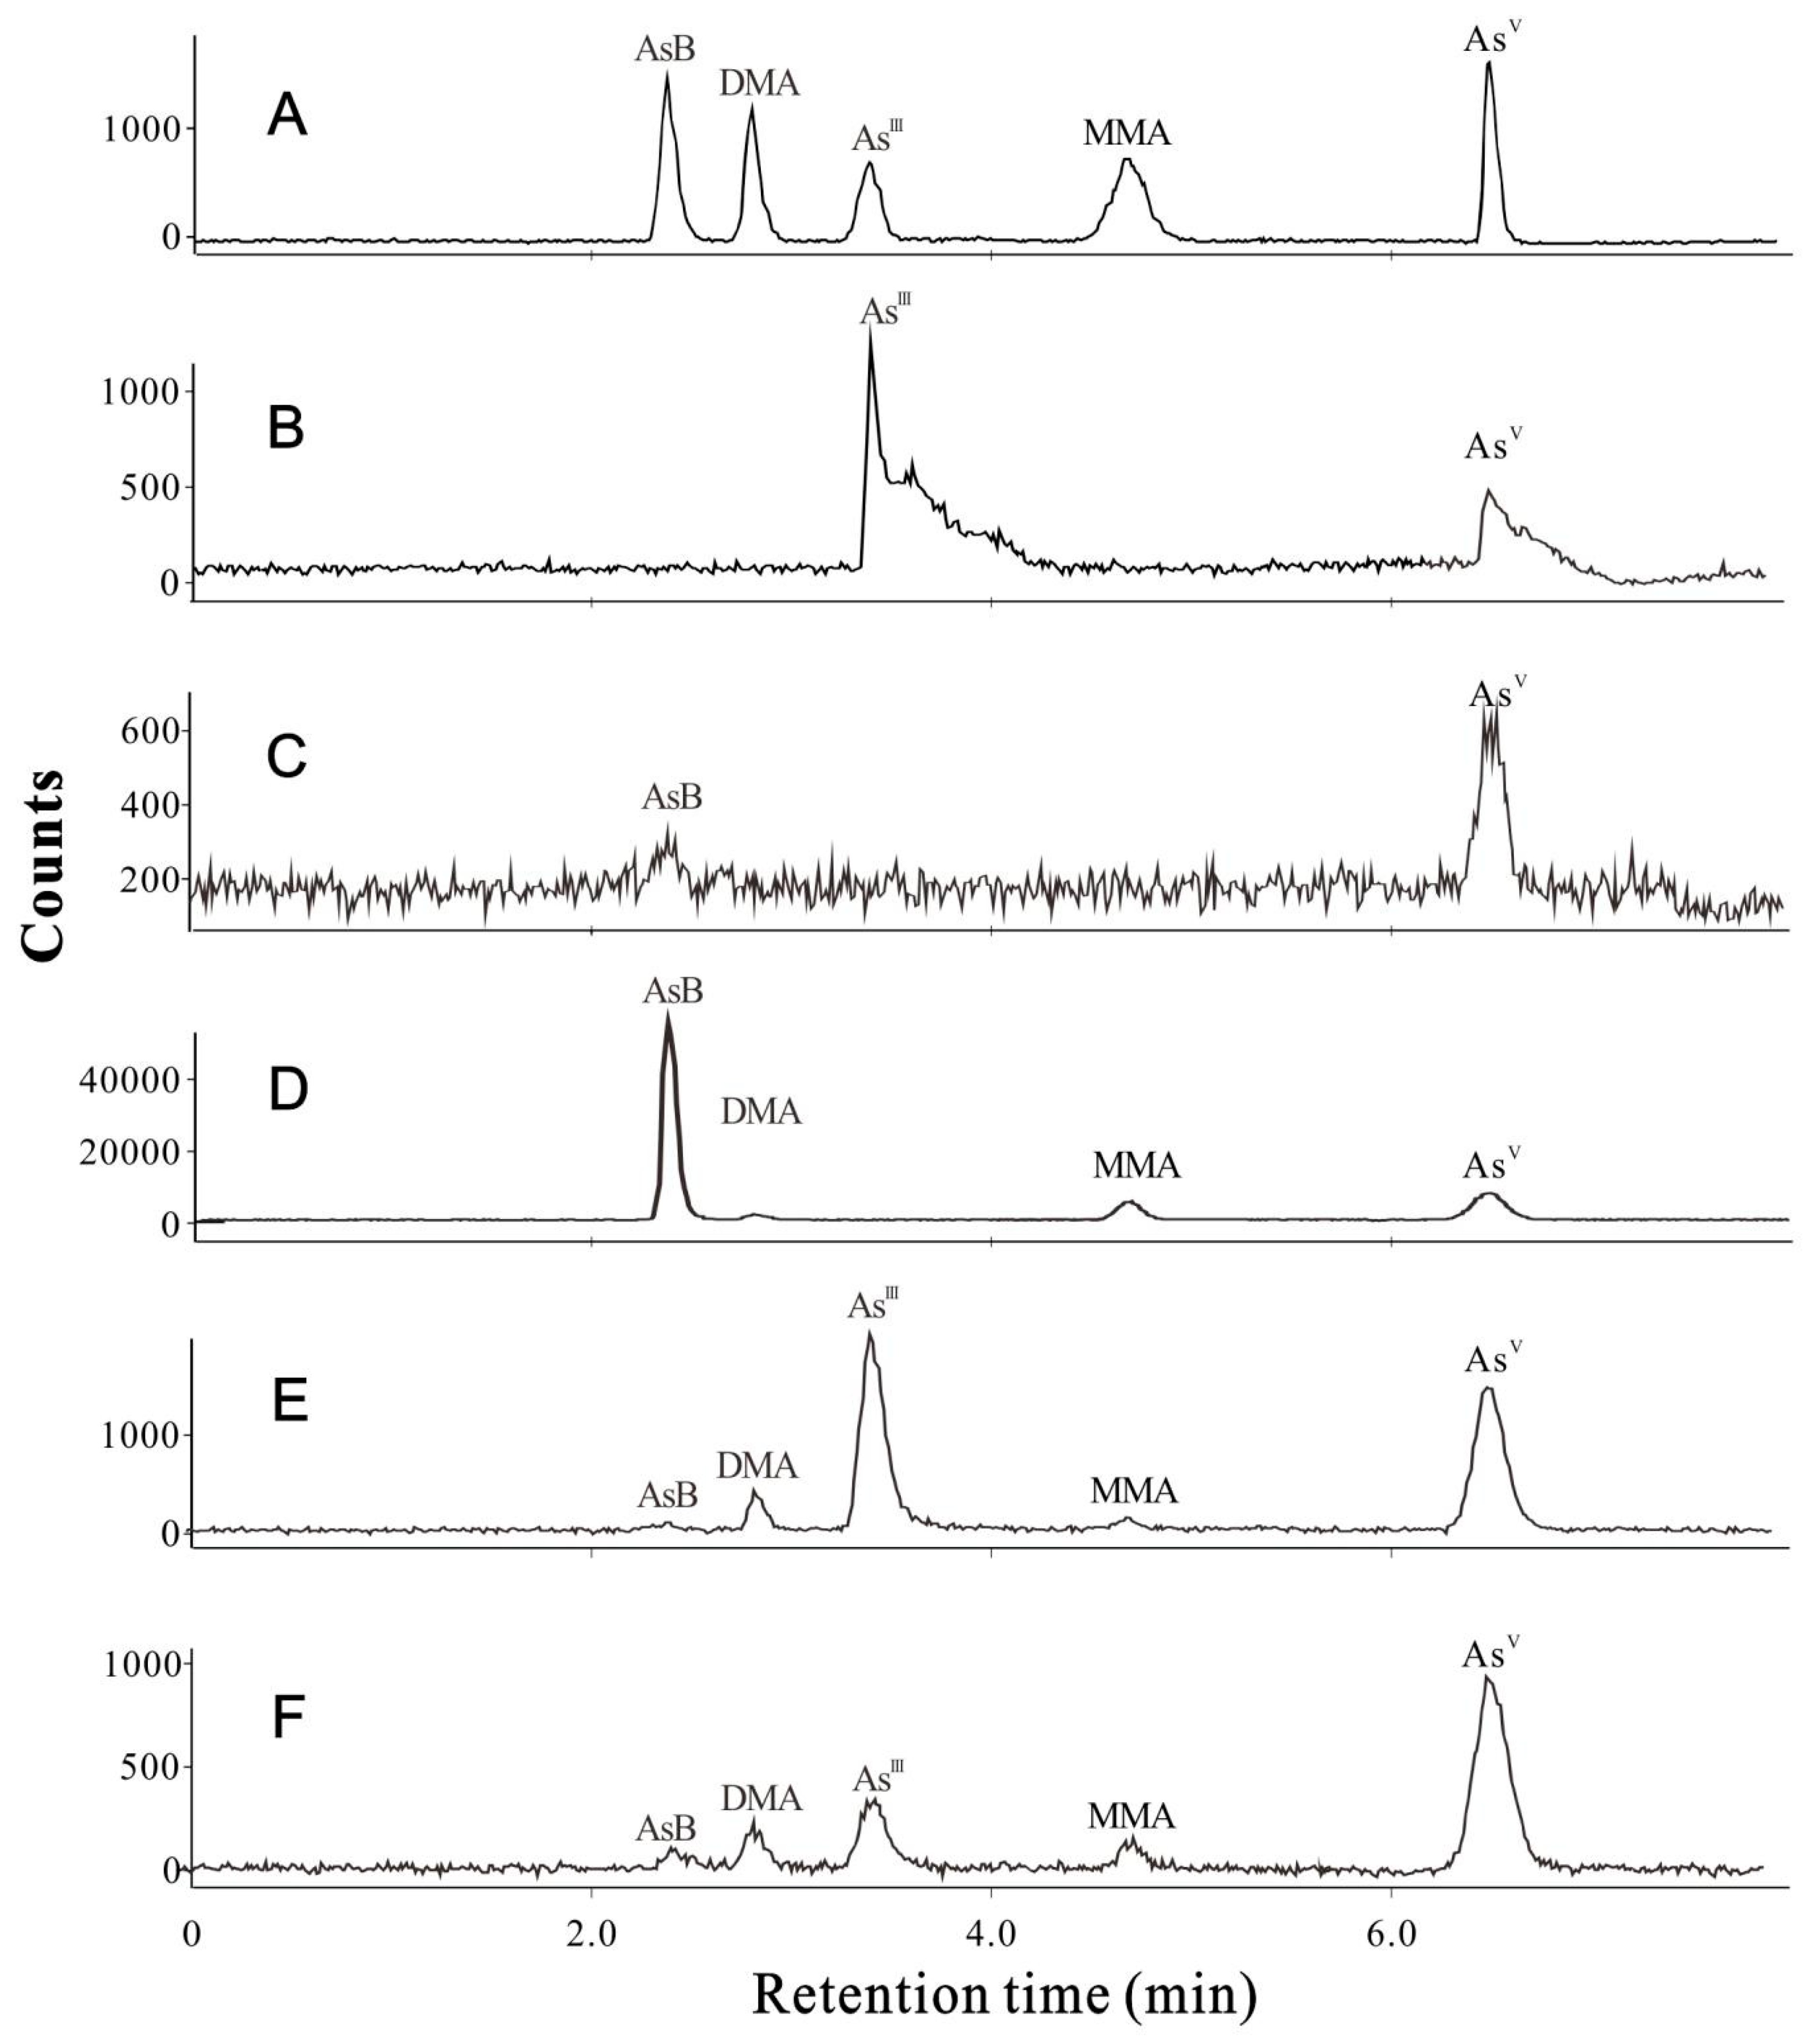
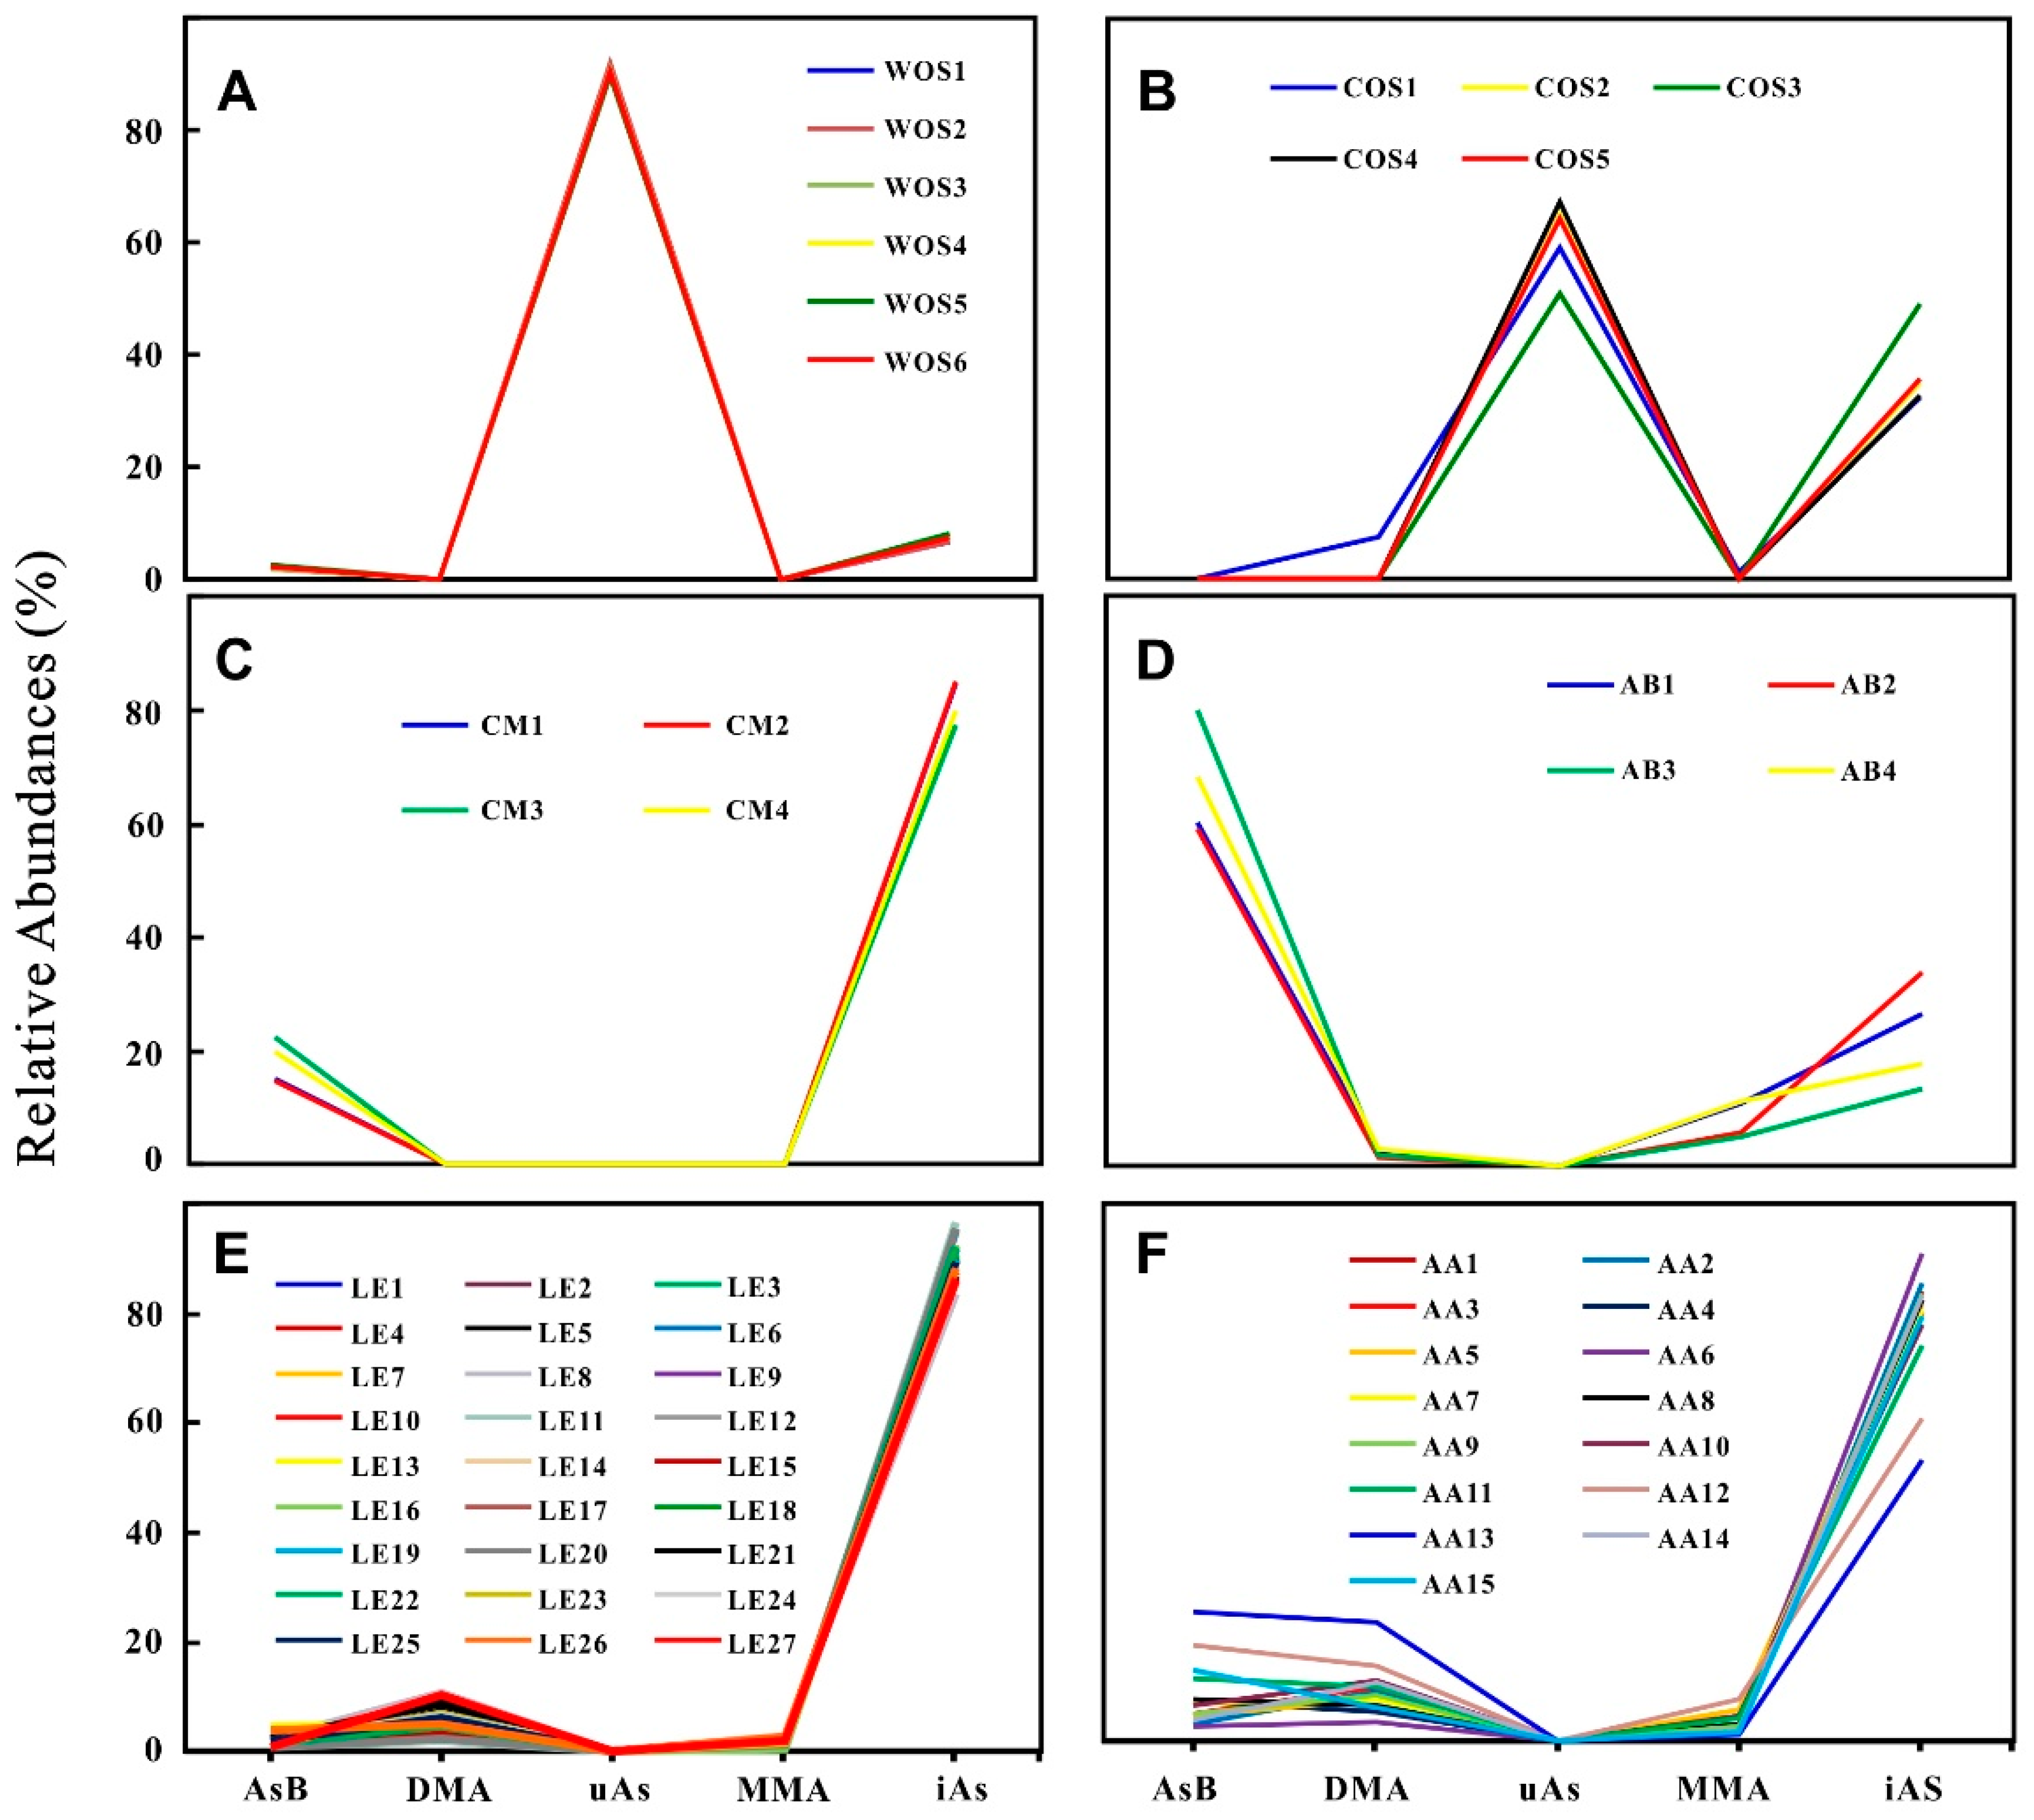
2.2. Arsenic Species
3. Discussion
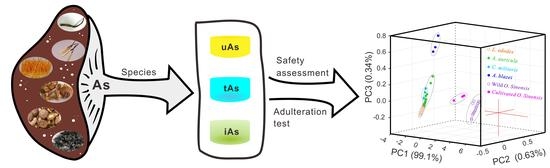
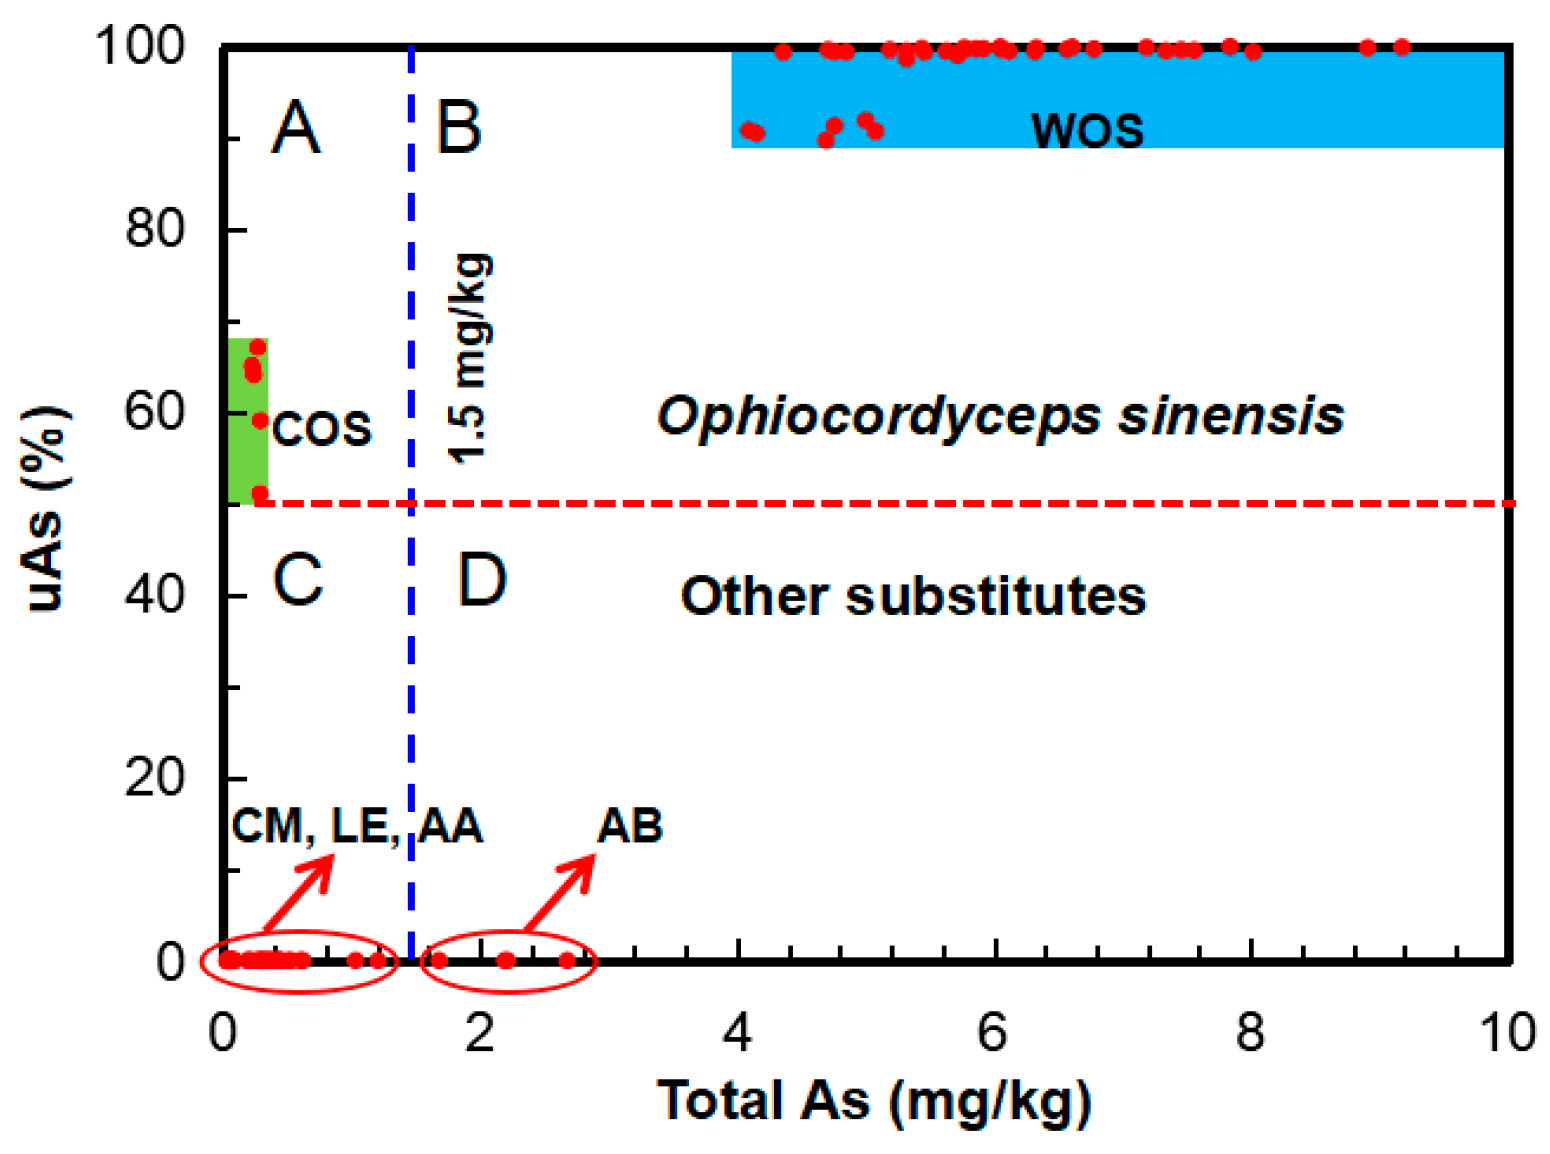
3.1. Arsenic Fingerprint for Adulteration Test
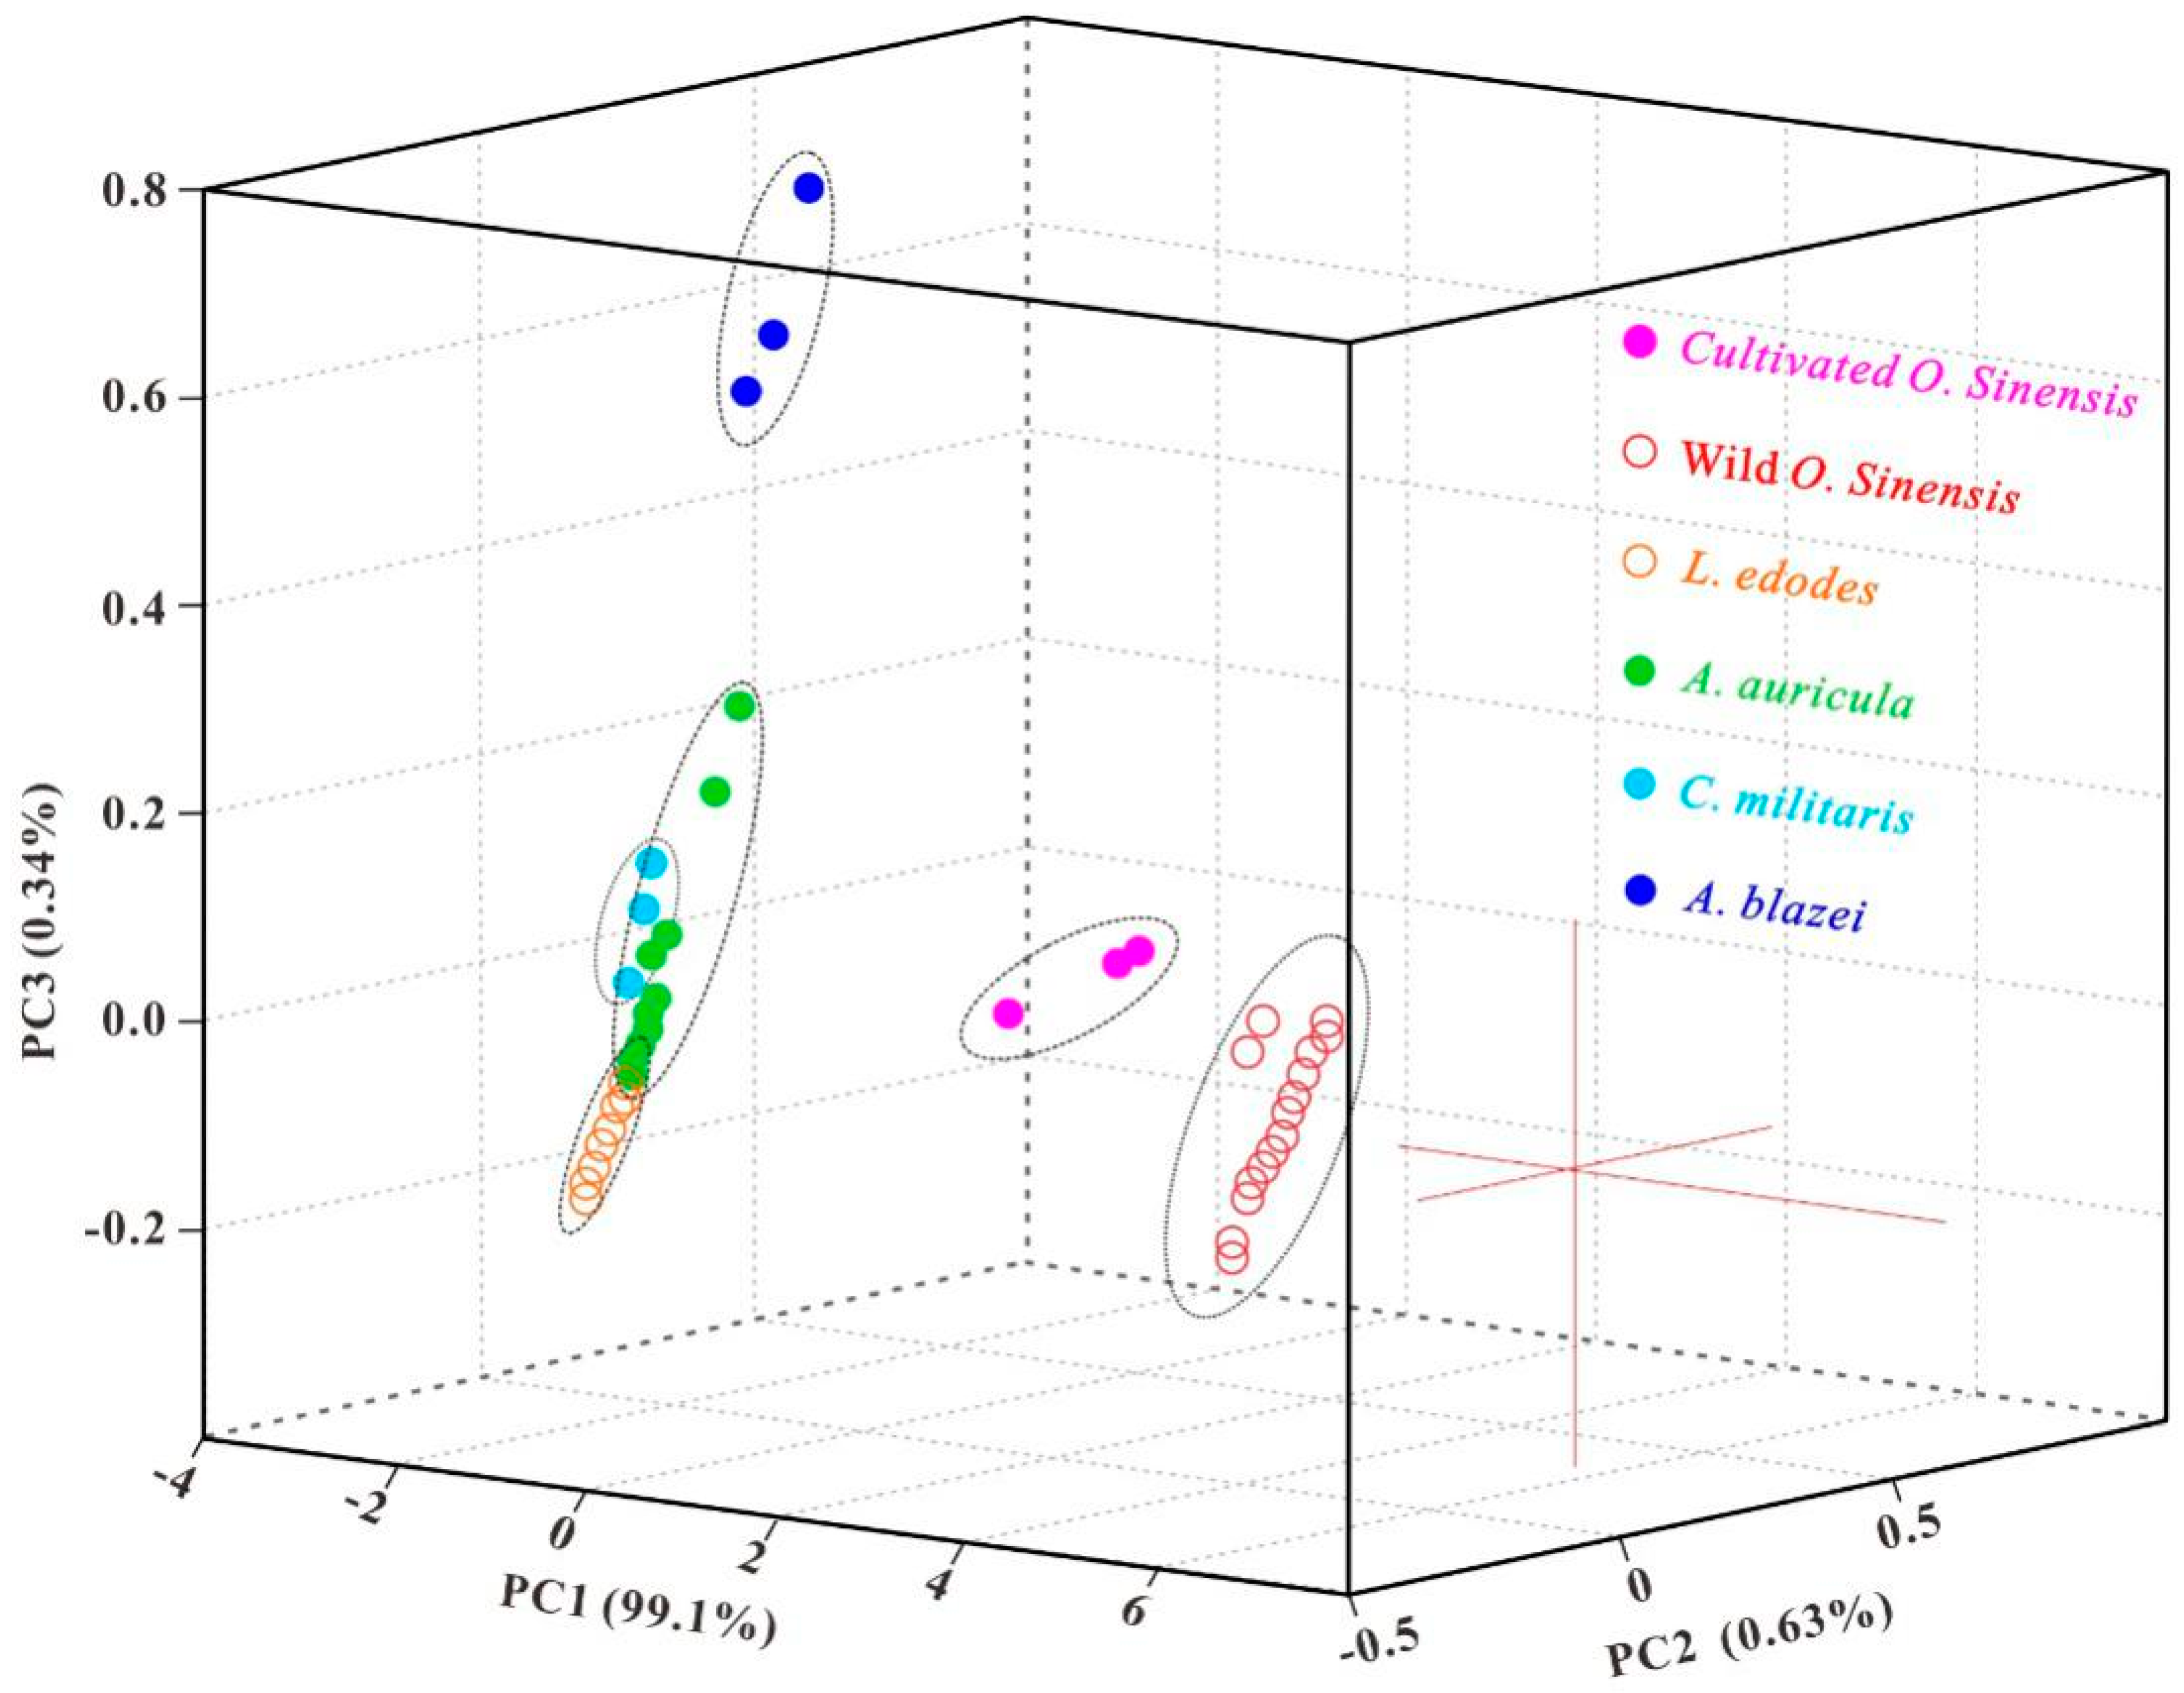
3.2. Novel Arsenic Markers for Discriminating Wild and Cultivated Cordyceps
4. Materials and Methods
4.1. Reagents and Standards
4.2. Samples
4.3. Total Arsenic Analysis
4.4. Arsenic Speciation Analysis
4.5. Statistical Analysis and Data Processing
5. Conclusions
6. Patents
Supplementary Materials
Author Contributions
Funding
Acknowledgments
Conflicts of Interest
Abbreviations
| CFDA | China Food and Drug Administration |
| As | arsenic |
| iAs | inorganic arsenic |
| oAs | organic arsenic |
| AsIII | arsenite |
| AsV | arsenate |
| uAs | unknown organic As |
| AsB | arsenobetaine |
| AsC | arsenocholine |
| MMA | monomethylarsonic acid |
| DMA | dimethylarsinic acid |
| ICP-MS | inductively coupled plasma mass spectroscopy |
| HPLC | high-performance liquid chromatography |
| WOS | wild Ophiocordyceps sinensis |
| COS | cultivated Ophiocordyceps sinensis |
| CM | Cordyceps militaris |
| AB | Agaricus blazei |
| LE | Lentinus edodes |
| AA | Auricularia auricular |
| PCA | principle component analysis |
| CRMs | certified reference materials |
References
- Dong, C.H.; Li, W.J.; Li, Z.Z.; Yan, W.J.; Li, T.H.; Liu, X.Z. Cordyceps industry in China: Current status, challenges and perspectives: Jinhu declaration for Cordyceps industry development. Mycosystema 2016, 35, 1–15. [Google Scholar] [CrossRef]
- Zhang, Y.; Li, E.; Wang, C.; Li, Y.; Liu, X. Ophiocordyceps sinensis, the flagship fungus of China: Terminology, life strategy and ecology. Mycology 2012, 3, 2–10. [Google Scholar] [CrossRef]
- Chen, D.; Yuan, J.P.; Xu, S.P.; Zhou, X.G.; Zhang, Y.; Xu, X.M.; Zou, Z.W.; Zhang, G.R.; Wang, J.H. Stable carbon isotope evidence for tracing the diet of the host Hepialus larva of Cordyceps sinensis in the Tibetan Plateau. Sci. China Ser. D-Earth Sci. 2009, 52, 655–659. [Google Scholar] [CrossRef]
- Zou, Z.W.; Xin, L.; Zhang, G.R. Revision of taxonomic system of the genus Hepialus (Lepidoptera, Hepialidae) currently adopted in China. Hunan Univ. Sci. Technol. 2010, 25, 114–120. [Google Scholar]
- Guo, L.X.; Hong, Y.H.; Zhou, Q.Z.; Zhu, Q.; Xu, X.M.; Wang, J.H. Fungus-larva relation in the formation of Cordyceps sinensis as revealed by stable carbon isotope analysis. Sci. Rep. 2017, 7, 789. [Google Scholar] [CrossRef] [PubMed]
- Stone, R. Mycology: Last stand for the body snatcher of the Himalayas? Science 2008, 322, 1182. [Google Scholar] [CrossRef] [PubMed]
- Qi, W.; Lei, W.; Yan, Y.; Zhang, Y.; Liu, S.; Cao, P.; Fan, Y. Pharmacological study progress of the Cordyceps sinensis. Glob. Tradit. Chinese Med. 2014, 7, 227–232. [Google Scholar] [CrossRef]
- Liu, Y.; Wang, J.H.; Wang, W.; Zhang, H.Y.; Zhang, X.L.; Han, C.C. The chemical constituents and pharmacological actions of Cordyceps sinensis. Evid.-Based Complem. Altern. Med. 2015, 2015, 575063. [Google Scholar] [CrossRef]
- Li, W.J.; Dong, C.H.; Liu, X.Z.; Li, Q.P.; Xia, J.M.; Liang, L. Research advances in artificial cultivation of Chinese Cordyceps. Mycosystema 2016, 35, 375–387. [Google Scholar] [CrossRef]
- Wei, J.C.; Wei, X.L.; Zheng, W.F.; Guo, W.; Liu, R.D. Species identification and component detection of Ophiocordyceps sinensis cultivated by modern industry. Mycosystema 2016, 35, 404–410. [Google Scholar] [CrossRef]
- Qiu, X.H.; Cao, L.; Han, R.C. The progress, issues and perspectives in the research of Ophiocordyceps sinensis. Environ. Entomol. 2016, 38, 1–23. [Google Scholar] [CrossRef]
- Pan, X.Y. Identification of Cordyceps sinensis by experience. China Pharm. 2006, 9, 380–381. [Google Scholar]
- Lo, H.C.; Hsieh, C.; Lin, F.Y.; Hsu, T.H. A systematic review of the mysterious caterpillar fungus Ophiocordyceps sinensis in DongChongXiaCao (dōng chóng xià căo) and related bioactive ingredients. J. Tradit. Complement. Med. 2013, 3, 16–32. [Google Scholar] [CrossRef]
- Qian, Z.M.; Liao, N.; Li, W.Q.; Ai, Z.; Tian, Y.; Li, W.J. Application of modern instrumental analytical techniques in quality evaluation of Cordyceps sinensis. Mod. Chin. Med. 2016, 18, 682–688. [Google Scholar] [CrossRef]
- Zhang, P.; Li, S.; Li, J.; Wei, F.; Cheng, X.; Zhang, G.; Ma, S.; Liu, C. Identification of Ophiocordyceps sinensis and its artificially cultured Ophiocordyceps mycelia by ultra-performance liquid chromatography/Orbitrap fusion mass spectrometry and chemometrics. Molecules 2018, 23, 1013. [Google Scholar] [CrossRef] [PubMed]
- Kuo, H.C.; Su, Y.L.; Yang, H.L.; Chen, T.Y. Identification of Chinese medicinal fungus Cordyceps sinensis by PCR-single-stranded conformation polymorphism and phylogenetic relationship. J. Agric. Food. Chem. 2005, 53, 3963–3968. [Google Scholar] [CrossRef] [PubMed]
- Guo, L.X.; Xu, X.M.; Hong, Y.H.; Li, Y.; Wang, J.H. Stable carbon isotope composition of the lipids in natural Ophiocordyceps sinensis from major habitats in China and its substitutes. Molecules 2017, 22, 1567. [Google Scholar] [CrossRef] [PubMed]
- China Food and Drug Administration (CFDA). Consumption tips on Ophiocordyceps sinensis products. Available online: http://samr.cfda.gov.cn/WS01/CL1986/144020.html (accessed on 4 February 2016).
- The Common Standards of Functional Food; GB16740-2014; The National Health and Family Planning Commission of the People’s Republic of China: Beijing, China, 2014.
- China Food and Drug Administration (CFDA). Notice on the Suspension of All the Pilot Work on Ophiocordyceps sinensis for Health Food. Available online: http://samr.cfda.gov.cn/WS01/CL0847/146100.html (accessed on 4 March 2016).
- Guo, L.X.; Zhang, G.W.; Wang, J.T.; Zhong, Y.P.; Huang, Z.G. Determination of arsenic species in Ophiocordyceps sinensis from major habitats in China by HPLC-ICP-MS and the edible hazard assessment. Molecules 2018, 23, 1012. [Google Scholar] [CrossRef] [PubMed]
- Chiu, C.P.; Liu, S.C.; Tang, C.H.; Chan, Y.; Elshazly, M.; Lee, C.L.; Du, Y.C.; Wu, T.Y.; Chang, F.R.; Wu, Y.C. Anti-inflammatory cerebrosides from cultivated Cordyceps militaris. J. Agric. Food Chem. 2016, 64, 1540–1548. [Google Scholar] [CrossRef] [PubMed]
- Niegel, C.; Matysik, F.M. Analytical methods for the determination of arsenosugars—A review of recent trends and developments. Anal. Chim. Acta 2010, 657, 83–99. [Google Scholar] [CrossRef] [PubMed]
- Nearing, M.M.; Koch, I.; Reimer, K.J. Arsenic speciation in edible mushrooms. Environ. Sci. Technol. 2014, 48, 14203–14210. [Google Scholar] [CrossRef] [PubMed]
- Yendrek, C.R.; Koester, R.P.; Ainsworth, E.A. A comparative analysis of transcriptomic, biochemical, and physiological responses to elevated ozone identifies species-specific mechanisms of resilience in legume crops. J. Exp. Bot. 2015, 66, 7101–7112. [Google Scholar] [CrossRef] [PubMed]
- Strauss, A.S.; Sven, P.; Wilhelm, B.; Antje, B. ABC transporter functions as a pacemaker for sequestration of plant glucosides in leaf beetles. eLife 2013, 2, e01096. [Google Scholar] [CrossRef] [PubMed]
- Taylor, V.; Goodale, B.; Raab, A.; Schwerdtle, T.; Reimer, K.; Conklin, S.; Karagas, M.R.; Francesconi, K.A. Human exposure to organic arsenic species from seafood. Sci. Total Environ. 2017, 580, 266–282. [Google Scholar] [CrossRef] [PubMed]
- Hsieh, Y.J.; Jiang, S.J. Application of HPLC-ICP-MS and HPLC-ESI-MS procedures for arsenic speciation in seaweeds. J. Agric. Food Chem. 2012, 60, 2083–2089. [Google Scholar] [CrossRef] [PubMed]
- Eisler, R. Arsenic hazards to fish, wildlife, and invertebrates: a synoptic review. U.S. Fish Wildlife Serv. Biol. Rep. 1988, 85, 1–65. [Google Scholar]
- Hettick, B.E.; Cañas-Carrell, J.E.; French, A.D.; Klein, D.M. Arsenic: A review of the element’s toxicity, plant interactions, and potential methods of remediation. J. Agric. Food Chem. 2015, 63, 7097–7107. [Google Scholar] [CrossRef] [PubMed]
- Andreae, M.O. Distribution and speciation of arsenic in natural waters and some marine algae. Deep-Sea Res. 1978, 25, 391–402. [Google Scholar] [CrossRef]
- Falandysz, J.; Rizal, L.M. Arsenic and its compounds in mushrooms: A review. J. Environ. Sci. Health C Environ. Carcinog. Ecotoxicol. Rev. 2016, 34, 217–232. [Google Scholar] [CrossRef] [PubMed]
- Chen, S.J.; Yan, X.J.; Chen, Z. Arsenic in Tissues, Organs, and Cells. In Encyclopedia of Metalloproteins; Kretsinger, R.H., Uversky, V.N., Permyakov, E.A., Eds.; Springer: New York, NY, USA, 2013; pp. 135–138. [Google Scholar]
- Chen, S.; Guo, Q.; Liu, L. Determination of arsenic species in edible mushrooms by high-performance liquid chromatography coupled to inductively coupled plasma mass spectrometry. Food Anal. Method. 2017, 10, 740–748. [Google Scholar] [CrossRef]
- Gonzálvez, A.; Llorens, A.; Cervera, M.; Armenta, S.; De la Guardia, M. Non-chromatographic speciation of inorganic arsenic in mushrooms by hydride generation atomic fluorescence spectrometry. Food Chem. 2009, 115, 360–364. [Google Scholar] [CrossRef]
- Larsen, E.H.; Hansen, M.; Gössler, W. Speciation and health risk considerations of arsenic in the edible mushroom Laccaria amethystina collected from contaminated and uncontaminated locations. Appl. Organomet. Chem. 1998, 12, 285–291. [Google Scholar] [CrossRef]
- Kuehnelt, D.; Goessler, W.; Irgolic, K. Arsenic compounds in terrestrial organisms I: Collybia maculata, Collybia butyracea and Amanita muscaria from arsenic smelter sites in Austria. Appl. Organomet. Chem. 2010, 11, 289–296. [Google Scholar] [CrossRef]
- Soeroes, C.; Kienzl, N.; Ipolyi, I.; Dernovics, M.; Fodor, P.; Kuehnelt, D. Arsenic uptake and arsenic compounds in cultivated Agaricus bisporus. Food Control. 2005, 16, 459–464. [Google Scholar] [CrossRef]
- Braeuer, S.; Goessler, W.; Kameník, J.; Konvalinková, T.; Žigová, A.; Borovička, J. Arsenic hyperaccumulation and speciation in the edible ink stain bolete (Cyanoboletus pulverulentus). Food Chem. 2018, 242, 225–231. [Google Scholar] [CrossRef] [PubMed]
- Sÿlejkovec, Z.; Byrne, A.R.; Stijve, T.; Goessler, W.; Irgolic, K.J. Arsenic compounds in higher fungi. Appl. Organomet. Chem. 1997, 11, 673–682. [Google Scholar] [CrossRef]
- Zhang, X.P.; Deng, W.; Yang, X.M. The background concentrations of 13 soil trace elements and their relationships to parent materials and vegetation in Xizang (Tibet), China. J. Asian Earth Sci. 2002, 21, 167–174. [Google Scholar] [CrossRef]
- Zhao, Z.H. The distribution and abundances of elements. In Advanced Geochemistry, 1st ed.; The Institute of Geochemistry, Chinese Academy of Sciences, Eds.; Science Press: Beijing, China, 1988; p. 38. [Google Scholar]
- Li, W.J.; Li, Q.P.; Wei, Z.H.; Jiang, C.J.; Zhang, Z.Y.; Zhang, Y.F. Effects of soil and host plants on the artificial feeding of Hepialus sp. larvae, the host of Ophiocordyceps sinensis. Mycosystema 2016, 35, 467–475. [Google Scholar] [CrossRef]
- Nearing, M.M.; Koch, I.; Reimer, K.J. Uptake and transformation of arsenic during the reproductive life stage of Agaricus bisporus and Agaricus campestris. J. Environ. Sci. 2016, 49, 140–149. [Google Scholar] [CrossRef] [PubMed]
- Won, S.Y.; Park, E.H. Anti-inflammatory and related pharmacological activities of cultured mycelia and fruiting bodies of Cordyceps militaris. J. Ethnopharm. 2005, 96, 555–561. [Google Scholar] [CrossRef] [PubMed]
- Whaley-Martin, K.J.; Koch, I.; Moriarty, M.; Reimer, K.J. As speciation in blue mussels (Mytilus edulis) along a highly contaminated As gradient. Environ. Sci. Technol. 2012, 46, 3110–3118. [Google Scholar] [CrossRef] [PubMed]
- Haldimann, M.; Bajo, C.; Haller, T.; Venner, T.; Zimmerli, B. Occurrence of arsenic, lead, cadmium, mercury and selenium in cultivated mushrooms. Mitt. Geb. Lebensmittelunters Hyg. 1995, 86, 463–484. [Google Scholar]
Sample Availability: Samples of the compounds AsB, DMA, MMA, AsIII, AsV and uAs are available from the authors. |


| Samples | AsB mg/kg (%) | DMAV mg/kg (%) | MMAV mg/kg (%) | iAs mg/kg (%) | uAs mg/kg (%) | Total As mg/kg |
|---|---|---|---|---|---|---|
| COS1 | BDL | 0.022 (7) | 0.003 (1) | 0.093 (32) | 0.171 (59) | 0.289 |
| COS2 | BDL | BDL | BDL | 0.078 (35) | 0.145 (65) | 0.223 |
| COS3 | BDL | BDL | BDL | 0.140 (49) | 0.145 (51) | 0.285 |
| COS4 | BDL | BDL | BDL | 0.087 (33) | 0.180 (67) | 0.267 |
| COS5 | BDL | BDL | BDL | 0.084 (36) | 0.152 (64) | 0.236 |
| MeanCOS | BDL | 0.004 (1) | BDL | 0.096 (37) | 0.158 (51) | 0.260 |
| LE1 | 0.006 (2) | 0.017 (5) | 0.008 (2) | 0.343 (92) | BDL | 0.375 |
| LE2 | 0.004 (1) | 0.018 (7) | 0.006 (2) | 0.255 (90) | BDL | 0.284 |
| LE3 | 0.007 (2) | 0.019 (6) | 0.005 (2) | 0.262 (90) | BDL | 0.292 |
| LE4 | 0.007 (2) | 0.032 (8) | 0.010 (2) | 0.339 (88) | BDL | 0.387 |
| LE5 | 0.004 (1) | 0.031 (8) | 0.006 (1) | 0.377 (90) | BDL | 0.419 |
| LE6 | 0.004 (1) | 0.009 (3) | 0.005 (1) | 0.327 (95) | BDL | 0.344 |
| LE7 | 0.018 (1) | 0.063 (5) | 0.015 (1) | 1.107 (92) | BDL | 1.203 |
| LE8 | 0.008 (3) | 0.032 (11) | 0.009 (3) | 0.248 (84) | BDL | 0.296 |
| LE9 | 0.005 (2) | 0.018 (6) | 0.006 (2) | 0.251 (90) | BDL | 0.280 |
| LE10 | 0.007 (2) | 0.035 (10) | 0.009 (2) | 0.304 (86) | BDL | 0.354 |
| LE12 | 0.005 (1) | 0.012 (2) | 0.004 (1) | 0.597 (97) | BDL | 0.618 |
| LE13 | 0.006 (1) | 0.019 (4) | 0.009 (2) | 0.406 (92) | BDL | 0.440 |
| LE14 | 0.028 (5) | 0.031 (5) | 0.012 (2) | 0.529 (88) | BDL | 0.600 |
| LE15 | 0.007 (2) | 0.026 (9) | 0.006 (2) | 0.262 (87) | BDL | 0.301 |
| LE16 | 0.007 (2) | 0.018 (4) | 0.008 (2) | 0.413 (92) | BDL | 0.447 |
| LE17 | 0.021 (2) | 0.050 (5) | 0.007 (1) | 0.952 (92) | BDL | 1.029 |
| LE18 | 0.006 (2) | 0.016 (5) | 0.007 (2) | 0.285 (91) | BDL | 0.315 |
| LE19 | 0.009 (2) | 0.027 (6) | 0.010 (2) | 0.387 (90) | BDL | 0.432 |
| LE20 | 0.004 (1) | 0.013 (3) | 0.006 (1) | 0.487 (96) | BDL | 0.510 |
| LE21 | 0.007 (2) | 0.027 (9) | 0.007 (2) | 0.273 (87) | BDL | 0.314 |
| LE22 | 0.009 (2) | 0.025 (5) | 0.008 (2) | 0.483 (92) | BDL | 0.525 |
| LE23 | 0.004 (2) | 0.014 (7) | 0.003 (2) | 0.177 (89) | BDL | 0.198 |
| LE24 | 0.007 (2) | 0.024 (7) | 0.007 (2) | 0.317 (89) | BDL | 0.355 |
| LE25 | 0.003 (2) | 0.012 (6) | 0.004 (2) | 0.168 (89) | BDL | 0.188 |
| LE26 | 0.008 (4) | 0.011 (5) | 0.006 (3) | 0.190 (88) | BDL | 0.215 |
| LE27 | 0.003 (1) | 0.027 (10) | 0.005 (2) | 0.222 (86) | BDL | 0.257 |
| MeanLE | 0.008 (2) | 0.024 (6) | 0.007 (2) | 0.383 (90) | BDL | 0.423 |
| AA1 | 0.004 (5) | 0.006 (9) | 0.002 (3) | 0.064 (84) | BDL | 0.076 |
| AA2 | 0.002 (3) | 0.007 (10) | 0.001 (2) | 0.060 (85) | BDL | 0.071 |
| AA3 | 0.002 (5) | 0.004 (10) | 0.002 (5) | 0.031 (80) | BDL | 0.038 |
| AA4 | 0.002 (7) | 0.002 (5) | 0.001 (5) | 0.023 (82) | BDL | 0.028 |
| AA5 | 0.003 (5) | 0.005 (8) | 0.004 (6) | 0.055 (82) | BDL | 0.068 |
| AA6 | 0.001 (3) | 0.002 (3) | 0.001 (3) | 0.046 (91) | BDL | 0.050 |
| AA7 | 0.002 (7) | 0.003 (8) | 0.002 (5) | 0.027 (81) | BDL | 0.034 |
| AA8 | 0.004 (8) | 0.003 (7) | 0.002 (3) | 0.039 (82) | BDL | 0.047 |
| AA9 | 0.003 (5) | 0.005 (9) | 0.002 (3) | 0.047 (83) | BDL | 0.057 |
| AA10 | 0.003 (7) | 0.005 (11) | 0.002 (5) | 0.033 (78) | BDL | 0.042 |
| AA11 | 0.006 (12) | 0.005 (10) | 0.002 (4) | 0.037 (74) | BDL | 0.050 |
| AA12 | 0.006 (18) | 0.005 (14) | 0.003 (8) | 0.021 (60) | BDL | 0.034 |
| AA13 | 0.021 (24) | 0.019 (22) | 0.001 (1) | 0.046 (53) | BDL | 0.087 |
| AA14 | 0.001 (4) | 0.003 (11) | 0.001 (2) | 0.027 (83) | BDL | 0.032 |
| AA15 | 0.004 (13) | 0.002(6) | 0.001 (2) | 0.023 (79) | BDL | 0.029 |
| MeanAA | 0.004 (8) | 0.005 (9) | 0.002 (4) | 0.039 (78) | BDL | 0.050 |
| CM1 | 0.006 (15) | BDL | BDL | 0.034 (85) | BDL | 0.040 |
| CM2 | 0.005 (15) | BDL | BDL | 0.030 (85) | BDL | 0.036 |
| CM3 | 0.009 (23) | BDL | BDL | 0.032 (77) | BDL | 0.041 |
| CM4 | 0.009 (20) | BDL | BDL | 0.037 (80) | BDL | 0.047 |
| MeanCM | 0.007 (18) | BDL | BDL | 0.033 (82) | BDL | 0.041 |
| AB1 | 1.316 (60) | 0.052 (2) | 0.238 (11) | 0.585 (27) | BDL | 2.192 |
| AB2 | 1.305 (59) | 0.032 (1) | 0.126 (6) | 0.750 (34) | BDL | 2.212 |
| AB3 | 2.140 (80) | 0.046 (2) | 0.132 (5) | 0.360 (13) | BDL | 2.677 |
| AB4 | 1.144 (68) | 0.050 (3) | 0.187 (11) | 0.299 (18) | BDL | 1.680 |
| MeanAB | 1.476 (67) | 0.045 (2) | 0.171 (8) | 0.499 (23) | BDL | 2.190 |
| Samples | PC1 | PC2 | PC3 |
|---|---|---|---|
| WOS | 1.40; 6.55 | −0.60; 0.45 | −0.10; 0.05 |
| COS | −2.40; −2.30 | 0.45; 0.80 | −0.10; 0.05 |
| LE | −2.70; −1.50 | −0.40; −0.05 | −0.20; 0.00 |
| AA | −2.80; −2.55 | −0.15; 0.15 | −0.15; 0.35 |
| CM | −2.80; −2.60 | −0.10; 0.00 | 0.00; 0.20 |
| AB | −1.10; −0.05 | −0.30; 0.00 | 0.55; 0.95 |
© 2018 by the authors. Licensee MDPI, Basel, Switzerland. This article is an open access article distributed under the terms and conditions of the Creative Commons Attribution (CC BY) license (http://creativecommons.org/licenses/by/4.0/).
Share and Cite
Guo, L.-X.; Zhang, G.-W.; Li, Q.-Q.; Xu, X.-M.; Wang, J.-H. Novel Arsenic Markers for Discriminating Wild and Cultivated Cordyceps. Molecules 2018, 23, 2804. https://doi.org/10.3390/molecules23112804
Guo L-X, Zhang G-W, Li Q-Q, Xu X-M, Wang J-H. Novel Arsenic Markers for Discriminating Wild and Cultivated Cordyceps. Molecules. 2018; 23(11):2804. https://doi.org/10.3390/molecules23112804
Chicago/Turabian StyleGuo, Lian-Xian, Gui-Wei Zhang, Qing-Qing Li, Xiao-Ming Xu, and Jiang-Hai Wang. 2018. "Novel Arsenic Markers for Discriminating Wild and Cultivated Cordyceps" Molecules 23, no. 11: 2804. https://doi.org/10.3390/molecules23112804
APA StyleGuo, L.-X., Zhang, G.-W., Li, Q.-Q., Xu, X.-M., & Wang, J.-H. (2018). Novel Arsenic Markers for Discriminating Wild and Cultivated Cordyceps. Molecules, 23(11), 2804. https://doi.org/10.3390/molecules23112804