Relationship between Molarity and Color in the Crystal (‘Dramada’) Produced by Scytalidium cuboideum, in Two Solvents

 , , ,
, , , 
Abstract
1. Introduction
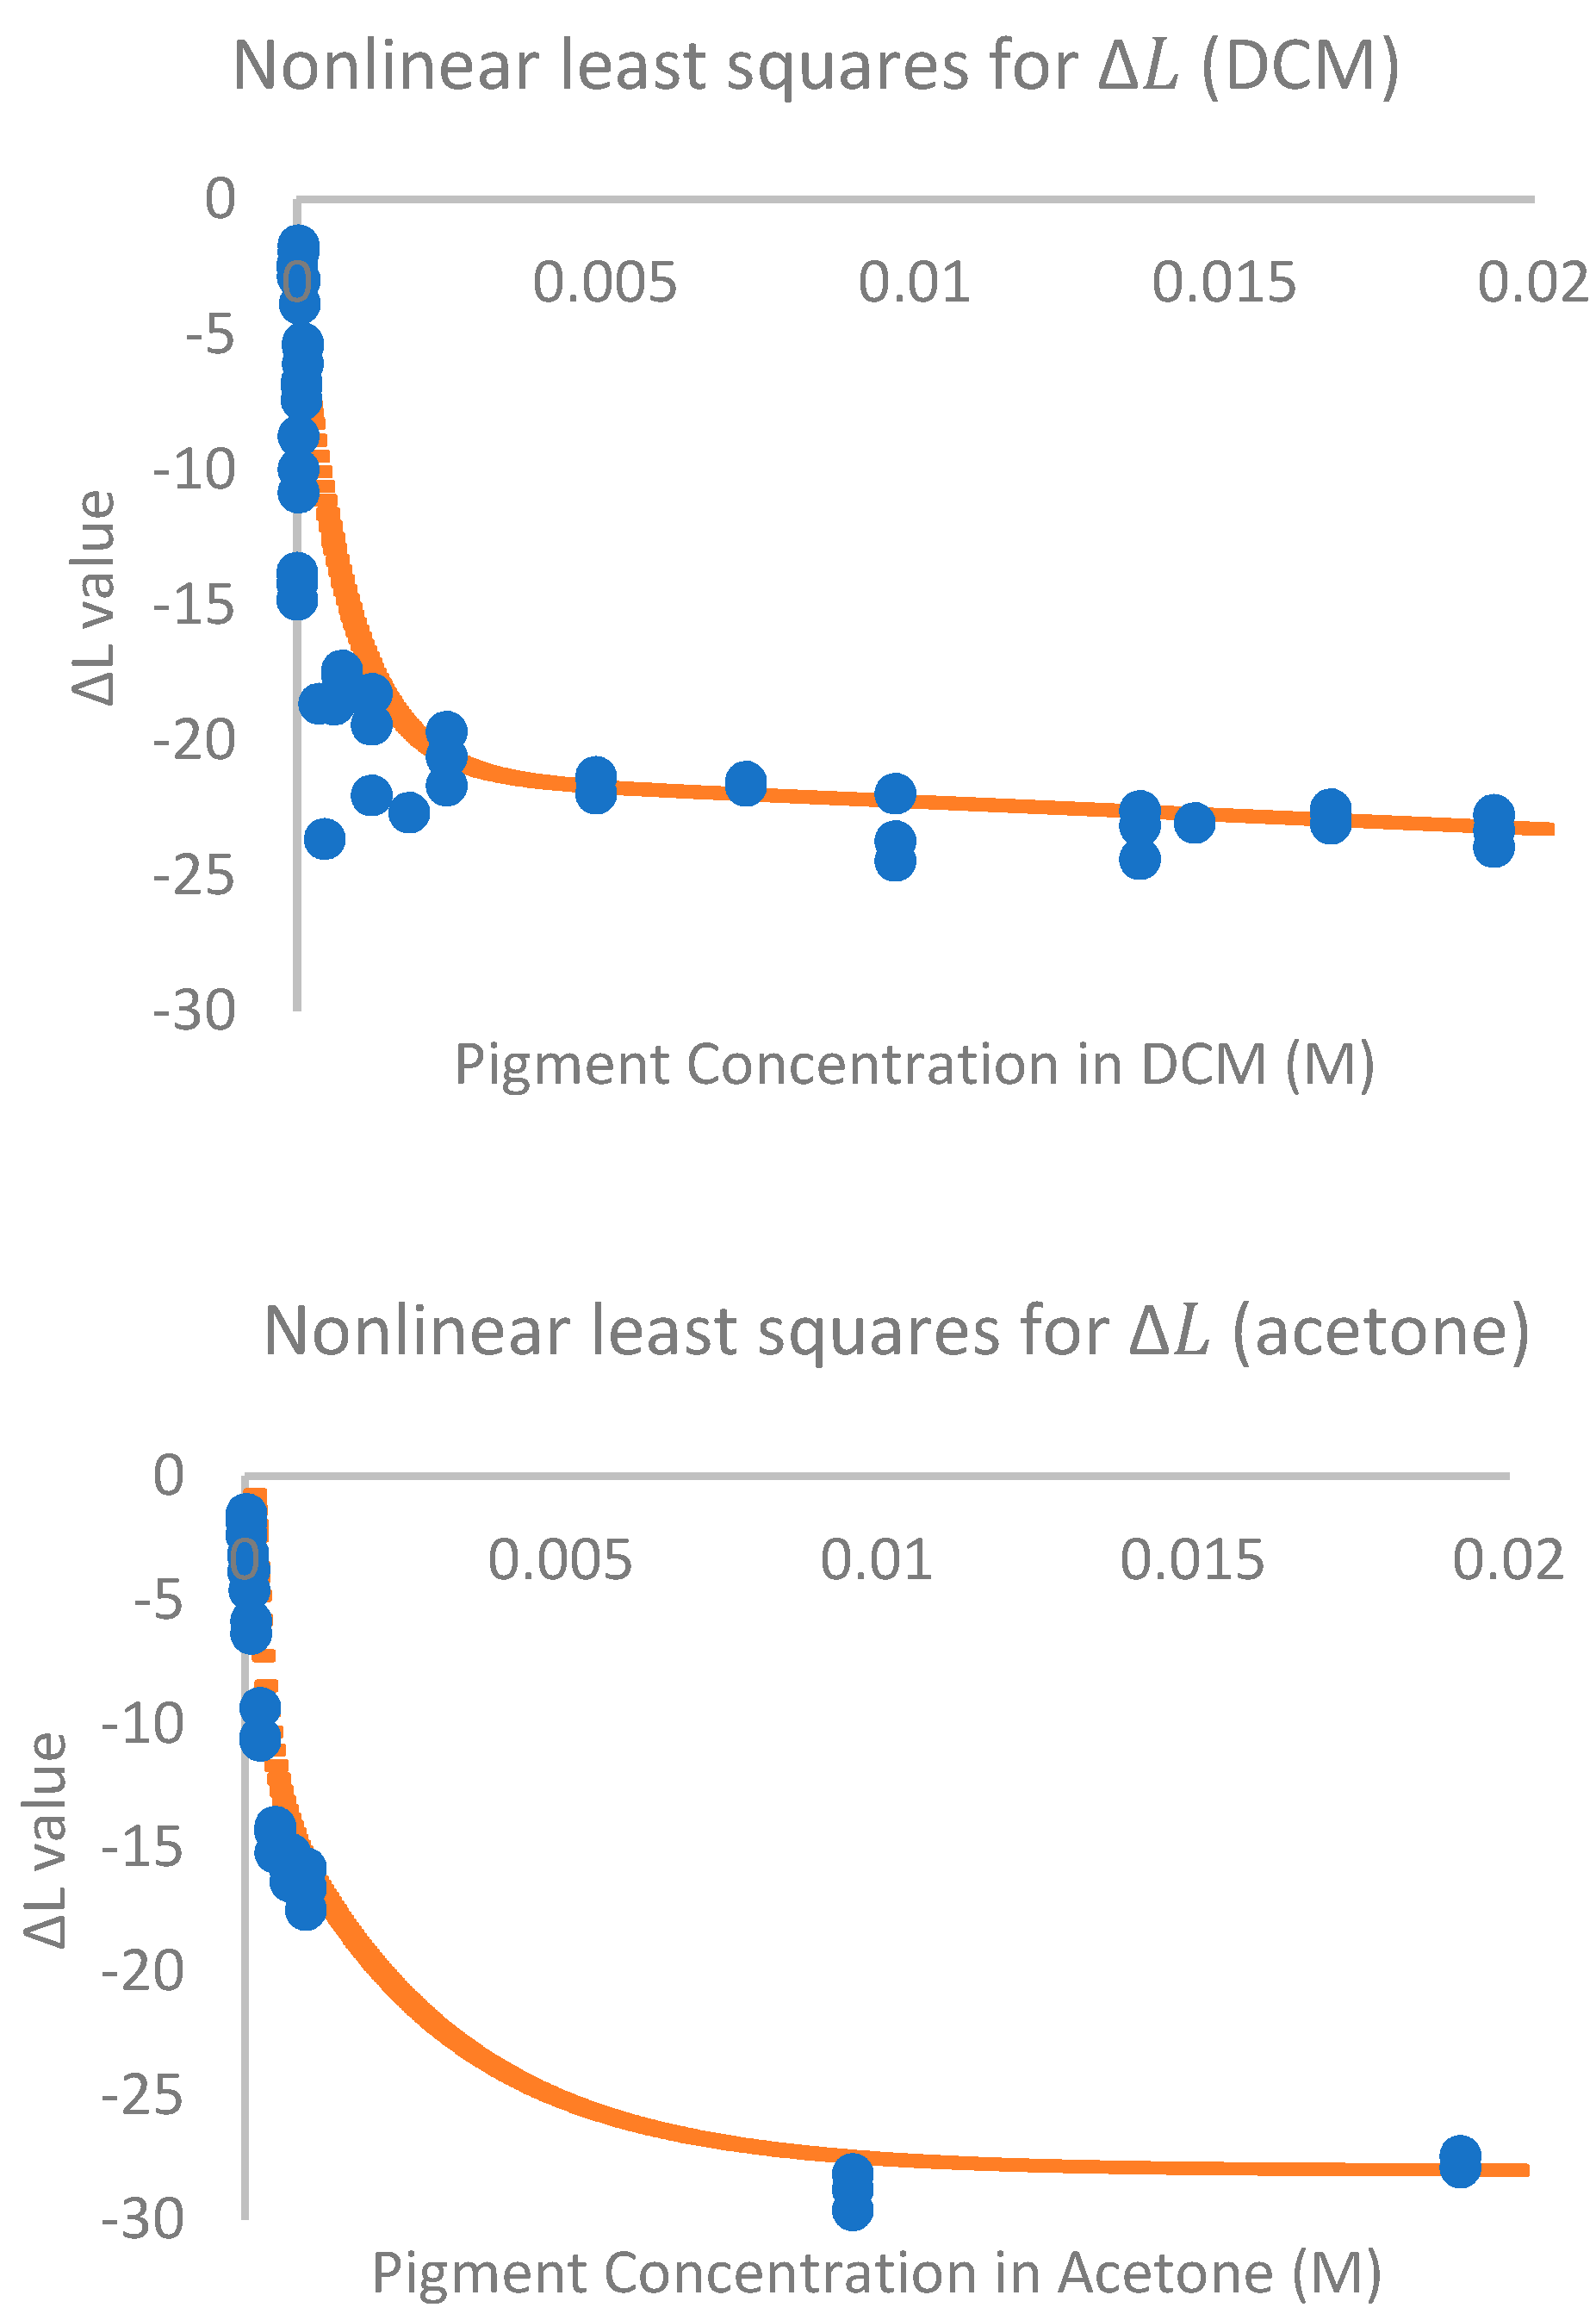
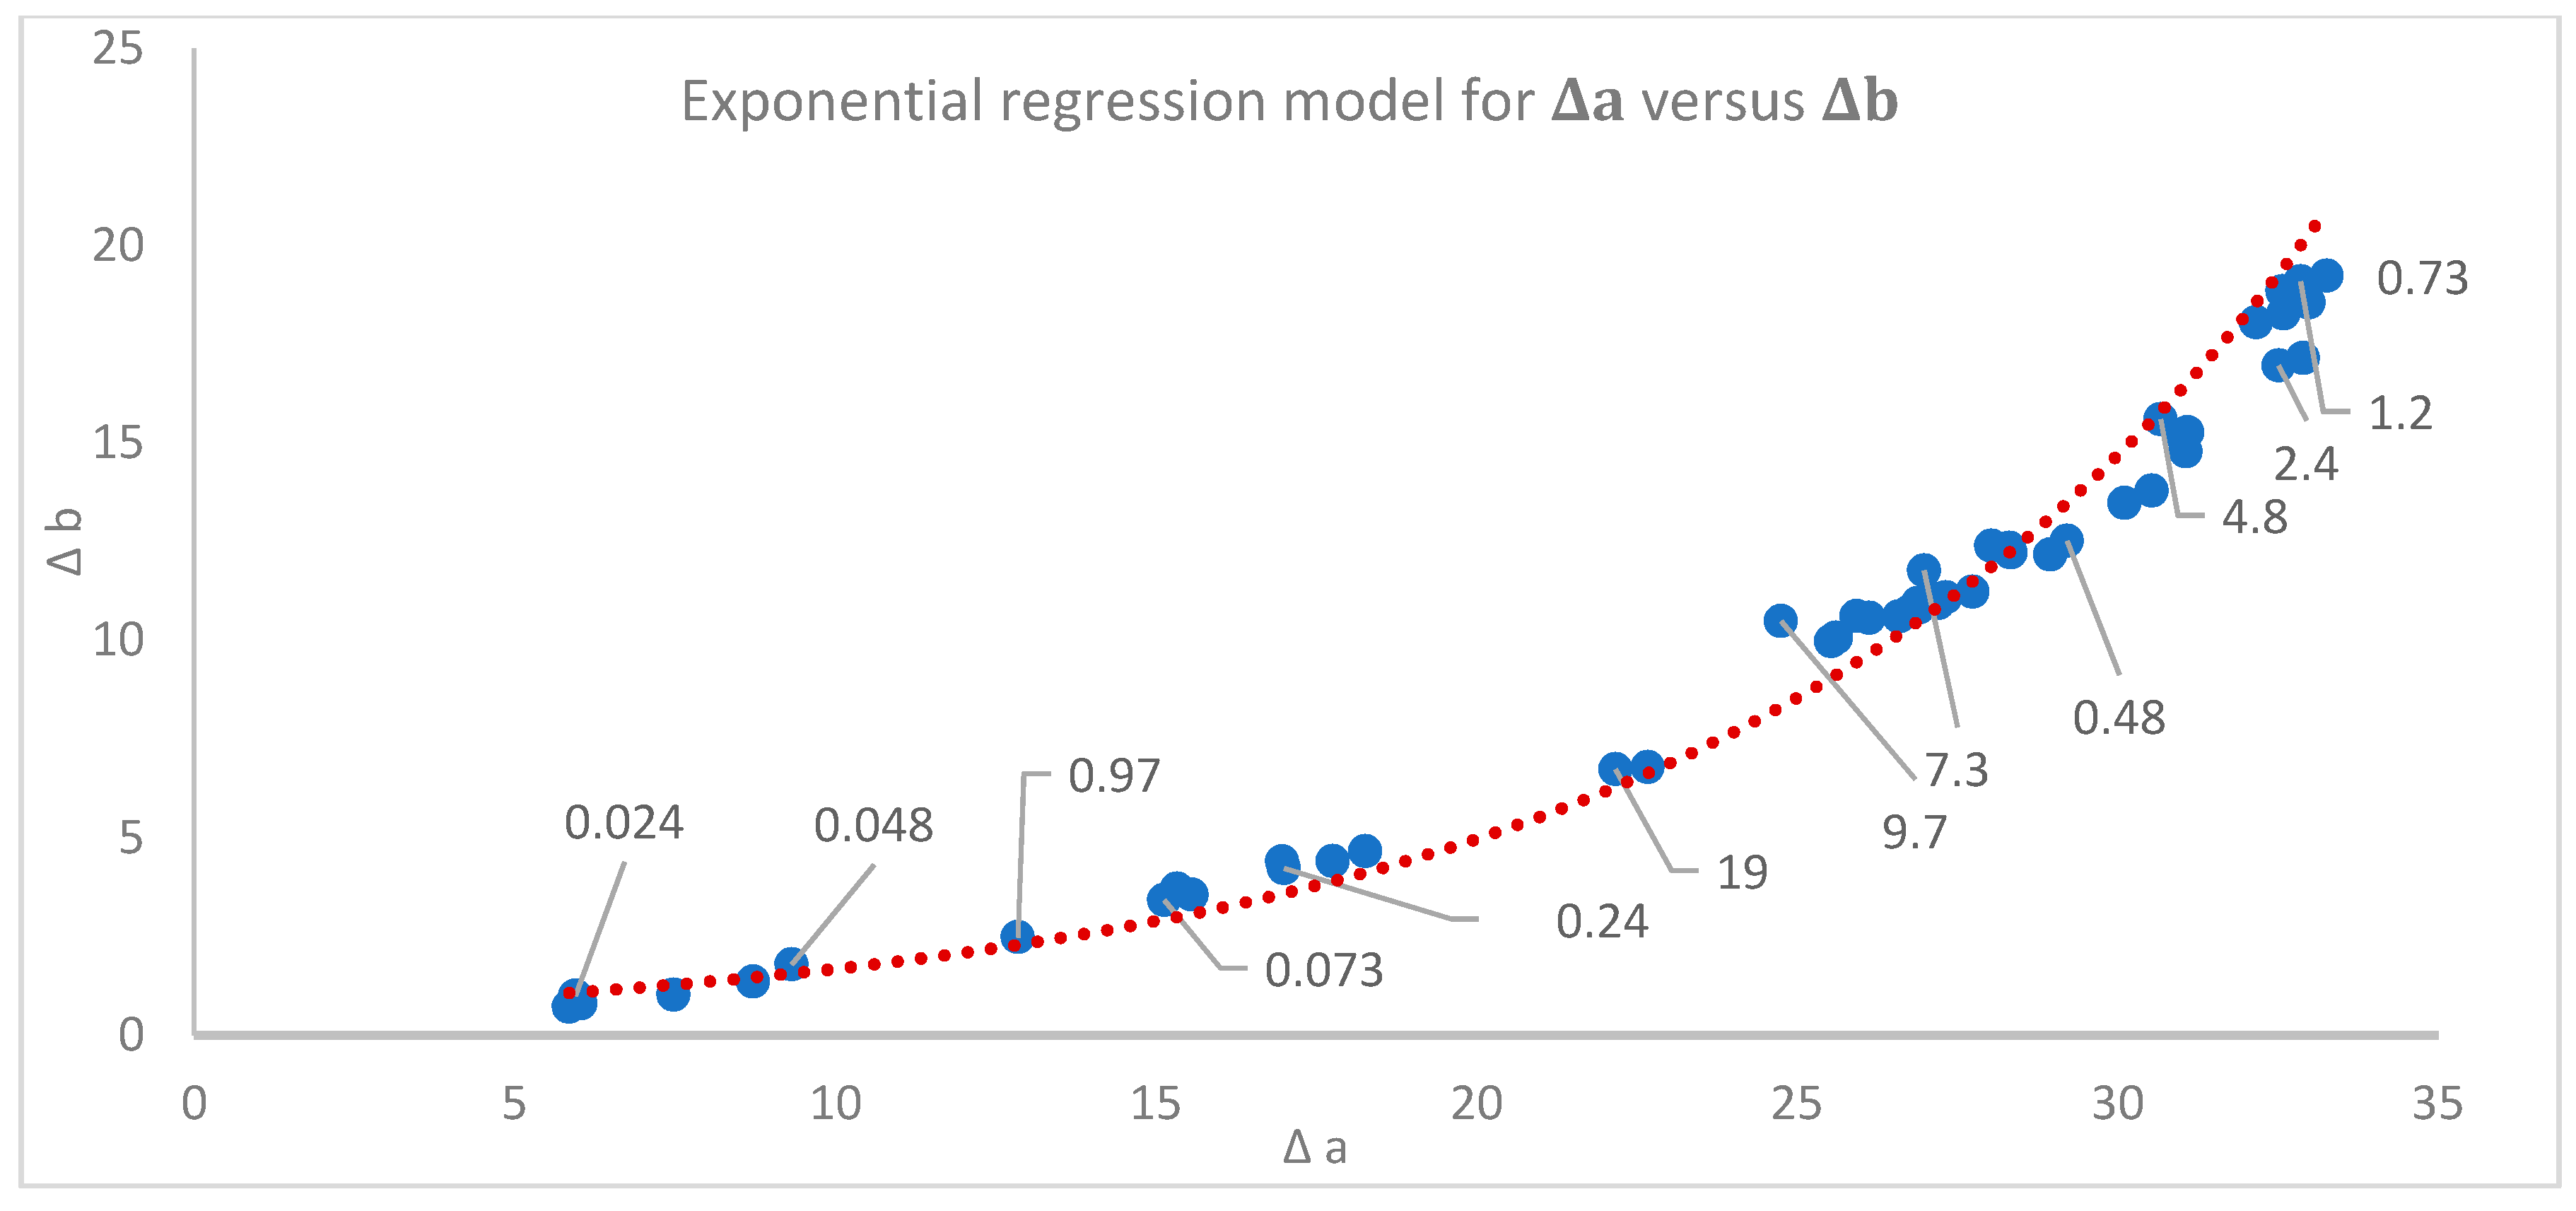
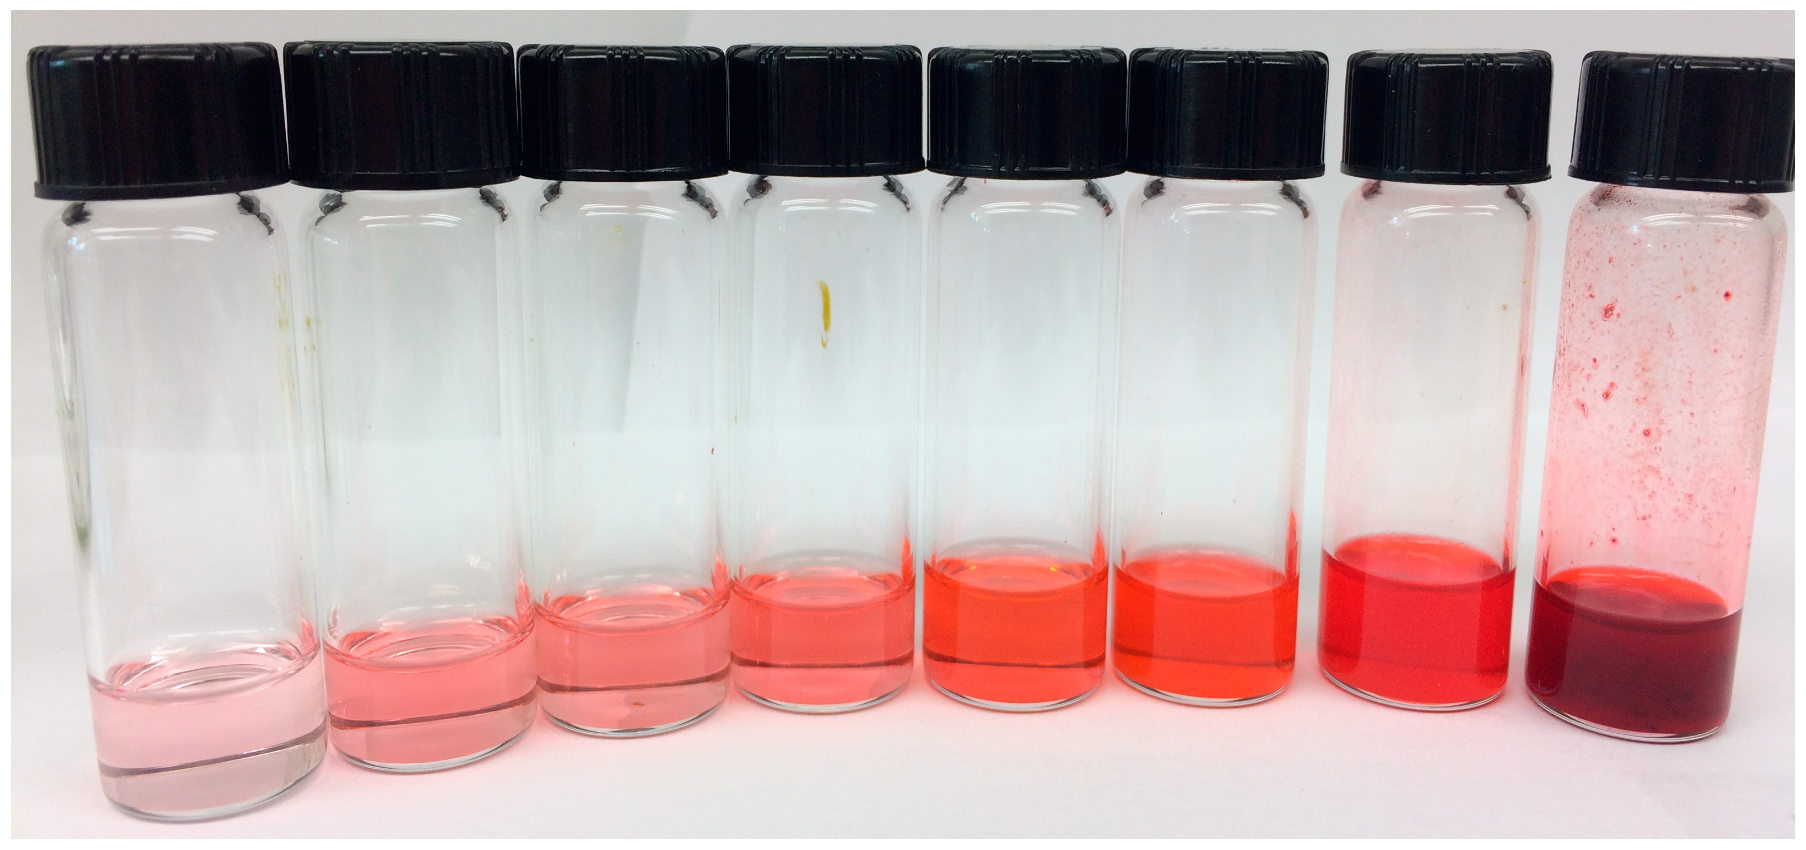
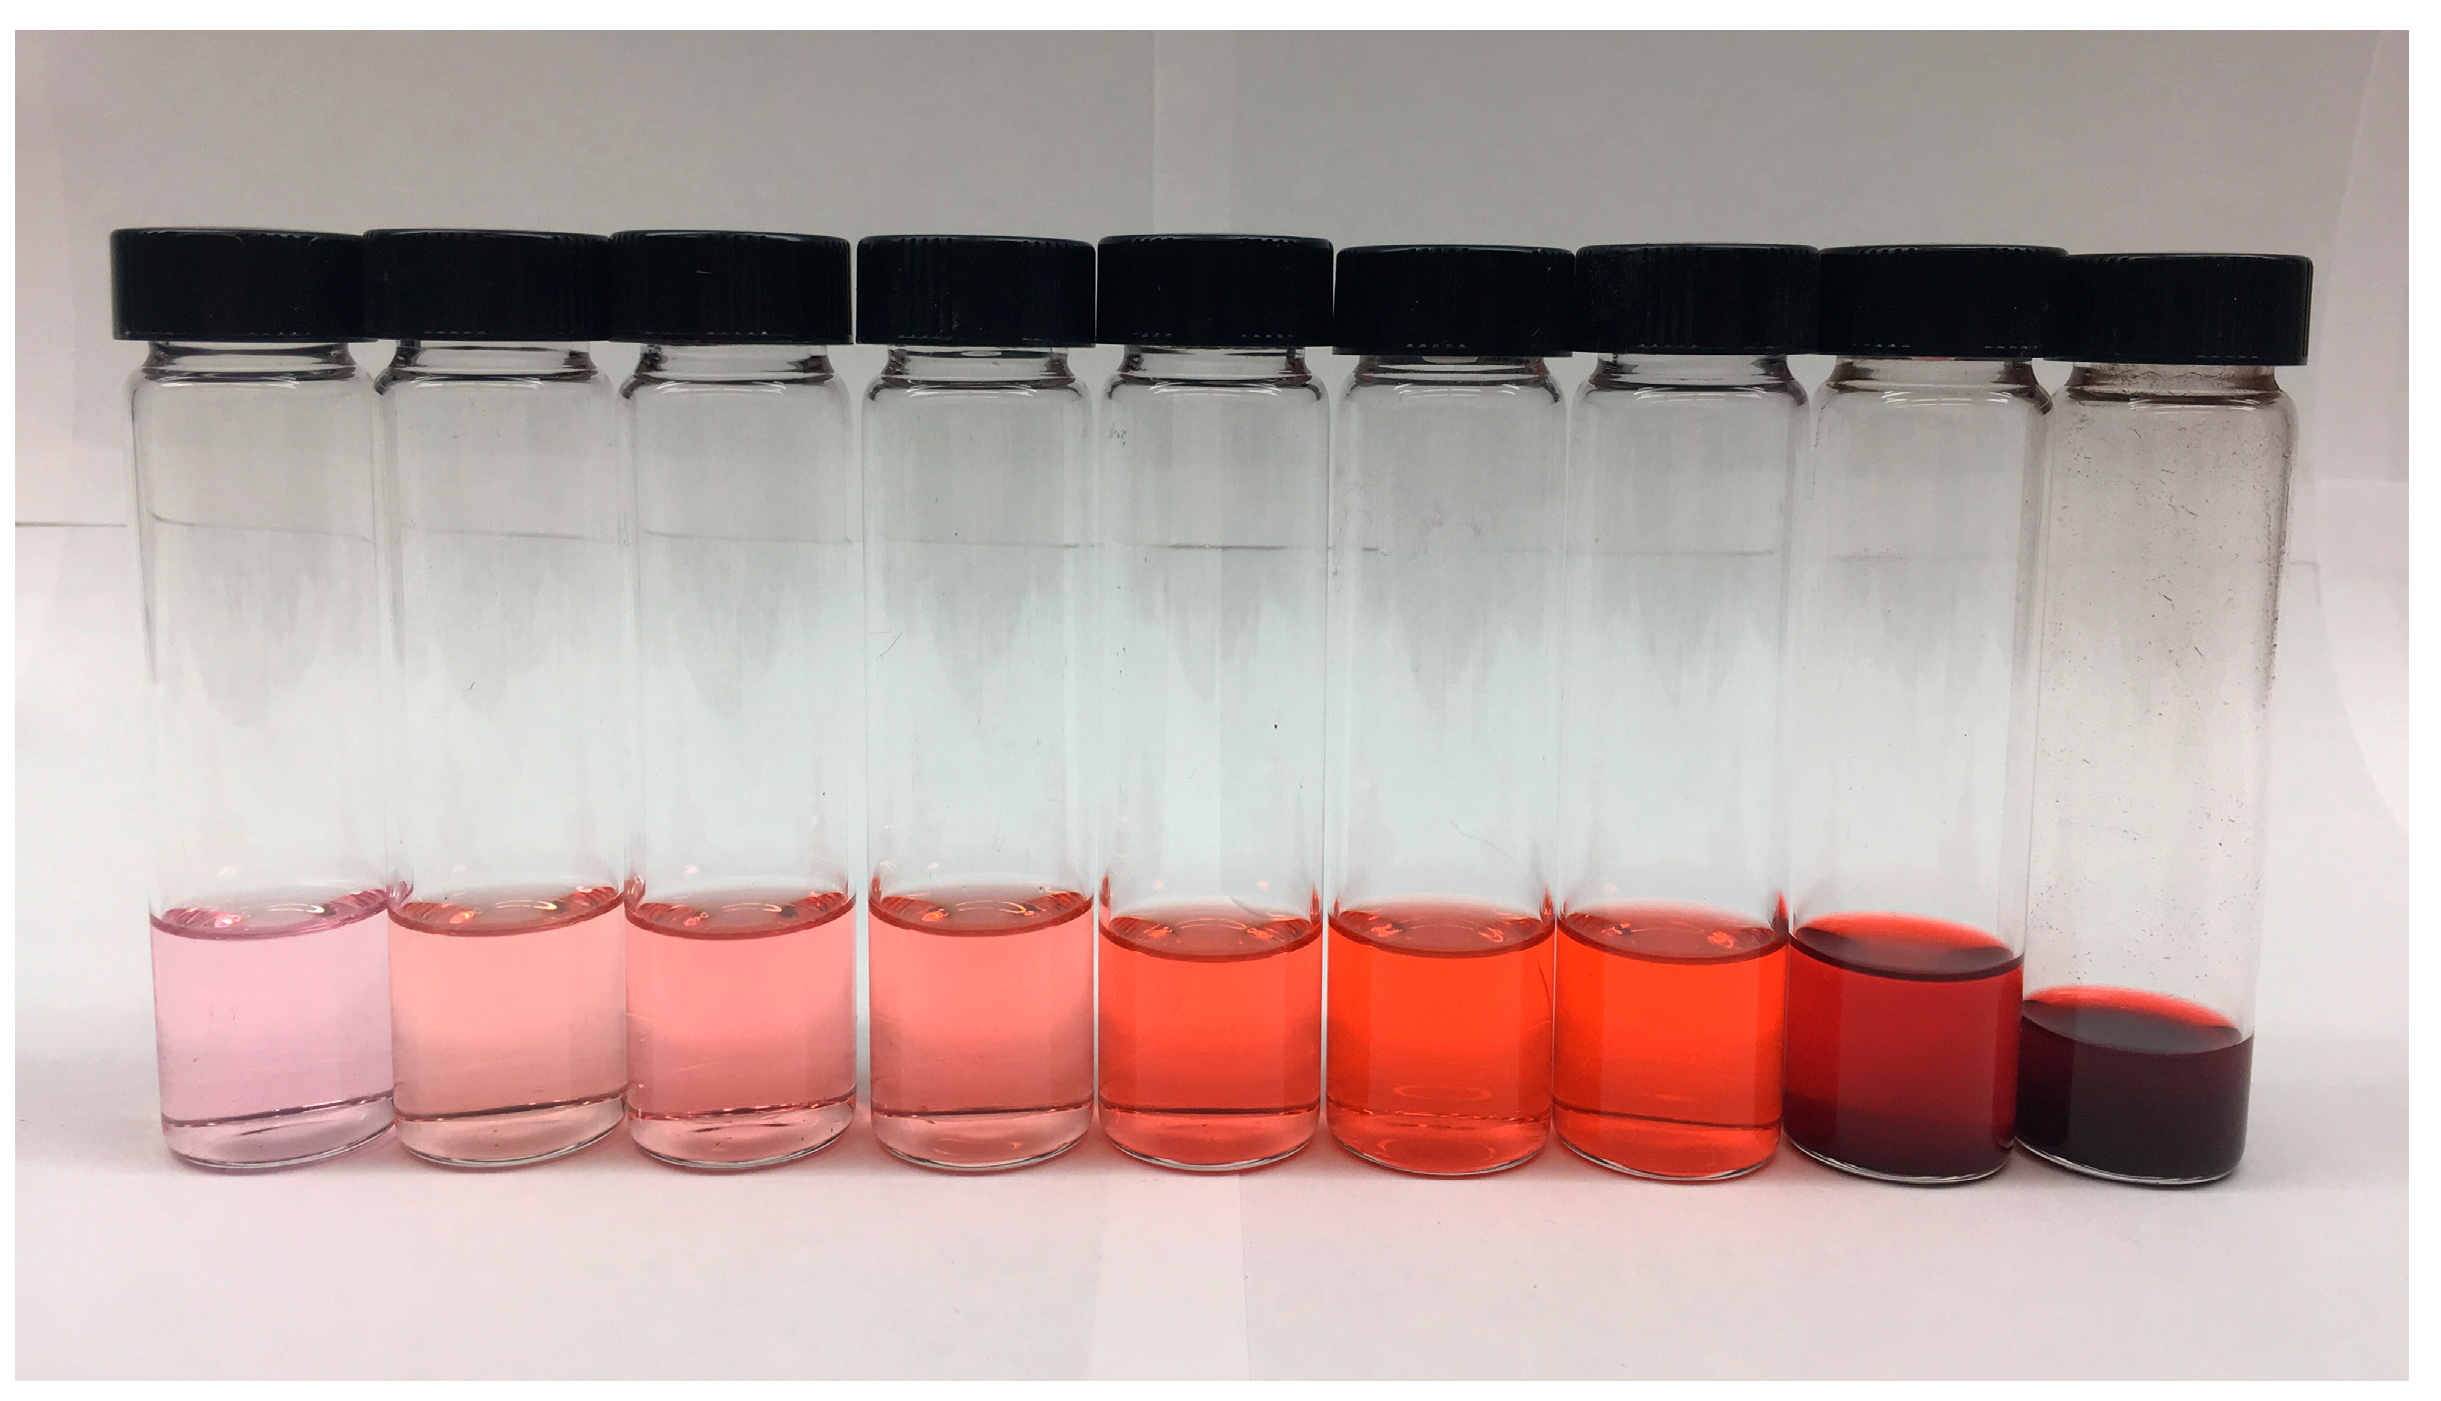
2. Results
3. Discussion
4. Materials and Methods
4.1. Pigment Production
4.2. Crystallization
4.3. Molarity Calculation and Resolubilization
4.4. Color Difference
4.5. Data Analysis
5. Conclusions
Supplementary Materials
Author Contributions
Funding
Acknowledgments
Conflicts of Interest
References
- Tidke, G.; Rai, M.K. Biotechnological potential of mushrooms: Drugs and dye production. Int. J. Med. Mushrooms 2006, 8. [Google Scholar] [CrossRef]
- Saxena, S.; Raja, A.S.M. Natural dyes: Sources, chemistry, application and sustainability issues. In Roadmap to Sustainable Textiles and Clothing; Springer: Hong Kong, China, 2014; pp. 37–80. [Google Scholar]
- Bechtold, T. Natural colorants—Quinoid, naphthoquinoid and anthraquinoid dyes. In Handbook of Natural Colorants; John Wiley & Sons, Ltd.: Chichester, UK, 2009; pp. 151–182. [Google Scholar]
- Mussak, R.A.M.; Bechtold, T. Natural colorants in textile dyeing. In Handbook of Natural Colorants; John Wiley & Sons, Ltd.: Chichester, UK, 2009; pp. 315–337. [Google Scholar]
- Bechtold, T.; Mussak, R. Handbook of Natural Colorants; Wiley: Chichester, UK, 2009. [Google Scholar]
- Fabre, C.; Santerre, A.; Loret, M.; Baberian, R.; Pareilleux, A.; Goma, G.; Blanc, P. Production and food applications of the red pigments of Monascus ruber. J. Food Sci. 1993, 58, 1099–1102. [Google Scholar] [CrossRef]
- Hedgcock, G.G. Studies upon some chromogenic fungi which discolor wood. Missouri Bot. Garden Annu. Rep. 1906, 1906, 59–114. [Google Scholar] [CrossRef]
- Phillips, L.W. The Nature of Spalted Wood: Analysis of Zone Line Formation between Six White Rot Fungi. Master’s Thesis, Brigham Young University, Provo, UT, USA, 1987. [Google Scholar]
- Robinson, S.C.; Richter, D.L.; Laks, P.E. Colonization of sugar maple by spalting fungi. For. Prod. J. 2007, 57, 24–32. [Google Scholar]
- Otjen, L.; Blanchette, R.A. Selective delignification of aspen wood blocks in vitro by three white rot Basidiomycetes. Am. Soc. Microbiol. 1985, 50, 568–572. [Google Scholar]
- Usta, I. Theory of Aesthetics-Charm in Furniture. Aesthetic Evaluation of Bleaching of the Natural Color of Wood through the Application of Experimental Bleaching Process. International Research Group on Wood Protection/IRG 38: Jackson, WY, USA, 2007. [Google Scholar]
- Lopez-Real, J.M.; Swift, M.J. The formation of pseudosclerotia (‘zone lines’) in wood decayed by Armillaria mellea and Stereum hirsutum. II. Formation in relation to the moisture content of the wood. Transact. Br. Mycol. Soc. 1975, 64, 473–481. [Google Scholar] [CrossRef]
- Lopez-Real, J.M. Formation of pseudosclerotia (‘zone lines’) in wood decayed by Armillaria mellea and Stereum hirsutum. I. Morphological aspects. Transact. Bri. Mycol. Soc. 1975, 64, 465–471. [Google Scholar] [CrossRef]
- Rayner, A.D.M.; Todd, N.K. Intraspecific antagonism in natural populations of wood-decaying Basidiomycetes. J. Gen. Microbiol. 1977, 103, 85–90. [Google Scholar] [CrossRef]
- Rayner, A.D.M. Interactions between fungi colonising hardwood stumps and their possible role in determining patterns of colinisation and succession. Ann. Appl. Biol. 1978, 89, 131–134. [Google Scholar] [CrossRef]
- Qin, L.; Guo, M.; Qiu, J.; Liu, C. Study on the formation of wood zone line pattern induced by the fungi. Adv. Mat. Res. 2011, 197–198, 190–193. [Google Scholar] [CrossRef]
- Coates, D. The Biological Consequences of Somatic Incompatibility in Wood Decaying Basidiomycetes and Other Fungi. Ph.D. Thesis, University of Bath, Claverton Down, UK, 1984. [Google Scholar]
- Durrell, L.W. The composition and structure of walls of dark fungus spores. Mycopathol. Myocol. Appl. 1964, 23, 339–345. [Google Scholar] [CrossRef]
- Kuo, M.J.; Alexander, M. Inhibition of the lysis of fungi by melanins. J. Bacteriol. 1967, 94, 624–629. [Google Scholar] [PubMed]
- Ellis, D.H.; Griffiths, D.A. Melanin deposition in the hyphae of a species of phomopsis. Can. J. Microbiol. 1975, 21, 442–449. [Google Scholar] [CrossRef] [PubMed]
- Owens, E.M.; Grethlein, C.A. Outcome of interspecific interactions among brown-rot and white-rot wood decay fungi. FEMS Microbiol. Ecol. 1994, 14, 19–24. [Google Scholar] [CrossRef]
- Campbell, A.H. Zone lines in plant tissues.1. The black lines formed by Xylaria polymorpha (pers.) grev. In hardwoods. Ann. Appl. Biol. 1933, 20, 123–145. [Google Scholar] [CrossRef]
- Duncan, C.G. Soft-rot in wood and toxicity studies on casual fungi. AWPA 1960, 27–35. [Google Scholar]
- Robinson, S.C. Developing fungal pigments for “painting” vascular plants. Appl. Microbiol. Biotechnol. 2012, 93, 1389–1394. [Google Scholar] [CrossRef] [PubMed]
- Robinson, S.C.; Tudor, D.; Zhang, W.R.; Ng, S.; Cooper, P.A. Ability of three yellow pigment producing fungi to colour wood under controlled conditions. Int. Wood Prod. J. 2014, 5, 103–107. [Google Scholar] [CrossRef]
- Kang, H.; Sigler, L.; Lee, J.; Gibas, C.; Yun, S.; Lee, Y. Xylogone ganodermophthora sp. Nov., an Ascomycetous pathogen causing yellow rot on cultivated mushroom Ganoderma lucidum in Korea. Mycologia 2010, 102, 1167–1184. [Google Scholar] [PubMed]
- Maeda, M.; Yamauchi, T.; Oshima, K.; Shimomura, M.; Miyauchi, S.; Mukae, K.; Sakaki, T.; Shibata, M.; Wakamatsu, K. Extraction of xylindein from Chlorociboria aeruginosa complex and its biological characteristics. Bull. Nagaoka Univ. Technol. 2003, 25, 105–111. [Google Scholar]
- Blanchette, R.A.; Wilmering, A.M.; Baumeister, M. The use of green-stained wood caused by the fungus Chlorociboria in intarsia masterpieces from the 15th century. Holzforschung 1992, 46, 225–232. [Google Scholar] [CrossRef]
- Robinson, S.C.; Tudor, D.; Snider, H.; Cooper, P.A. Stimulating growth and xylindein production of Chlorociboria aeruginascens in agar-based systems. AMB Exp. 2012, 2, 1–7. [Google Scholar] [CrossRef] [PubMed]
- Robinson, S.C.; Tudor, D.; Cooper, P.A. Feasibility of using red pigment producing fungi to stain wood for decorative applications. Can. J. For. Res. 2011, 41, 1722–1728. [Google Scholar] [CrossRef]
- Golinski, P.; Krick, T.P.; Blanchette, R.A.; Mirocha, C.J. Chemical characterization of a red pigment (5,8-dihydroxy-2, 7-dimethoxy-1, 4-naphthalenedione) produced by Arthrographis cuboidea in pink stained wood. Holzforschung-Int. J. Biol. Chem. Phys. Technol. Wood 1995, 49, 407–410. [Google Scholar]
- Medentsev, A.; Arinbasarova, A.Y.; Akimenko, V. Biosynthesis of naphthoquinone pigments by fungi of the genus Fusarium. Appl. Biochem. Microbiol. 2005, 41, 503–507. [Google Scholar] [CrossRef]
- Gümbel, W. Über xylindein. Ber. Dtsch. Chem. Ges. 1858, 41, 113–115. [Google Scholar]
- Lieberman, C. Über xylindein. Ber. Dtsch. Chem. Ges. 1874, 7, 1102–1103. [Google Scholar]
- Edwards, R.L.; Kale, N. The structure of xylindein. Tetrahedron 1965, 21, 2095–2107. [Google Scholar] [CrossRef]
- Blackburn, G.M.; Ekong, D.E.; Nielson, A.H.; Todd, L. Xylindein. Chimia 1965, 19, 208–212. [Google Scholar]
- Saikawa, Y.; Watanabe, T.; Hashimoto, K.; Nakata, A. Absolute configuration and tautomeric structure of xylindein, a blue-green pigment of Chlorociboria species. Phytochemistry 2000, 55, 237–240. [Google Scholar] [CrossRef]
- Rath, J.J. Organic Semiconductors: Incorporating Xylindein into (Opto) Electronic Devices. Bachelor’s Thesis, Oregon State University, Corvallis, OR, USA, 2016. [Google Scholar]
- Robinson, S.C.; Hinsch, E.; Weber, G.; Leipus, K.; Cerney, D. Wood colorization through pressure treating: The potential of extracted colorants from spalting fungi as a replacement for woodworkers’ aniline dyes. Materials 2014, 7, 5427–5437. [Google Scholar] [CrossRef] [PubMed]
- Robinson, S.C.; Weber, G.; Hinsch, E.; Vega Gutierrez, S.M.; Pittis, L.; Freitas, S. Utilizing extracted fungal pigments for wood spalting: A comparison of induced fungal pigmentation to fungal dyeing. J. Coat. 2014, 2014, 1–8. [Google Scholar] [CrossRef]
- Weber, G.; Chen, H.-L.; Hinsch, E.; Freitas, S.; Robinson, S. Pigments extracted from the wood-staining fungi Chlorociboria aeruginosa, Scytalidium cuboideum, and S. ganodermophthorum show potential for use as textile dyes. Colorat. Technol. 2014, 130, 445–452. [Google Scholar] [CrossRef]
- Hinsch, E.M.; Weber, G.; Chen, H.-L.; Robinson, S.C. Colorfastness of extracted wood-staining fungal pigments on fabrics: A new potential for textile dyes. J. Text. Appar. Technol. Manag. 2015, 9, 1–11. [Google Scholar]
- Vega Gutierrez, S.M.; Hazell, K.K.; Simonsen, J.; Robinson, S.C. Description of a naphthoquinonic crystal produced by the fungus Scytalidium cuboideum. Molecules 2018, 23, 1905. [Google Scholar] [CrossRef] [PubMed]
- Robinson, S.C.; Vega Gutierrez, S.M.; Cespedes Garcia, R.A.; Iroume, N.; Vorland, N.R.; Andersen, C.; de Oliveira Xaxa, I.D.; Kramer, O.E.; Huber, M.E. Potential for fungal dyes as colorants in oil and acrylic paints. J. Coat. Technol. Res. 2018, 15, 845–849. [Google Scholar] [CrossRef]
- Robinson, S.C.; Vega Gutierrez, S.M.; Cespedes Garcia, R.A.; Iroume, N.; Vorland, N.R.; McClelland, A.; Huber, M.; Stanton, S. Potential for carrying dyes derived from spalting fungi in natural oils. J. Coat. Technol. Res. 2017, 14, 1107–1113. [Google Scholar] [CrossRef]
- Hinsch, E.M.; Robinson, S.C. Mechanical color reading of wood-staining fungal pigment textile dyes: An alternative method for determining colorfastness. Coatings 2016, 6, 25. [Google Scholar] [CrossRef]
- Robinson, S.C.; Hinsch, E.; Weber, G.; Freitas, S. Method of extraction and resolubilisation of pigments from Chlorociboria aeruginosa and Scytalidium cuboideum, two prolific spalting fungi. Colorat. Technol. 2014, 130, 221–225. [Google Scholar] [CrossRef]
- Hinsch, E.M. A Comparative Analysis of Extracted Fungal Pigments and Commercially Available Dyes for Colorizing Textiles. Master’s Thesis, Oregon State University, Corvallis, OR, USA, 2015. [Google Scholar]
- Vega Gutierrez, S.; Vega Gutierrez, P.; Godinez, A.; Pittis, L.; Huber, M.; Stanton, S.; Robinson, S. Feasibility of coloring bamboo with the application of natural and extracted fungal pigments. Coatings 2016, 6, 37. [Google Scholar] [CrossRef]
- Young, J.A. Dichloromethane. J. Chem. Educ. 2004, 81, 1415. [Google Scholar] [CrossRef]
- Palomino Agurto, M.E.; Vega Gutierrez, S.M.; Chen, H.-L.; Robinson, S.C. Wood-rotting fungal pigments as colorant coatings on oil-based textile dyes. Coatings 2017, 7, 152. [Google Scholar] [CrossRef]
- Weiss, K.D. Paint and coatings: A mature industry in transition. Prog. Polym. Sci. 1997, 22, 203–245. [Google Scholar] [CrossRef]
- Driggers, T.L.; Holemans, P.; Smith, W.N. Sprayable Composition Using Acetone Solvent. U.S. Ptent Number 5,041,287, 20 August 1991. [Google Scholar]
- Garcia-Viguera, C.; Zafrilla, P.; Tomás-Barberán, F.A. The use of acetone as an extraction solvent for anthocyanins from strawberry fruit. Phytochem. Anal. Int. J. Plant Chem. Biochem. Tech. 1998, 9, 274–277. [Google Scholar] [CrossRef]
- Vega Gutierrez, S.M. Spalting Fungi: Genetic Identification, Material Interactions and Microscopical Characteristics of Extracted Pigments. Ph.D. Thesis, Oregon State University, Oregon, OR, USA, 2017. [Google Scholar]
- Almurshidi, B.H. Toxicity of Fungal Pigments from Chlorociboria spp. and Scytalidium spp. Master’s Thesis, Oregon State University, Corvallis, OR, USA, 2016. [Google Scholar]
- Wijffelaars, M.; Vliegen, R.; Van Wijk, J.J.; Van Der Linden, E.J. Generating Color Palettes Using Intuitive Parameters; Wiley Online Library: Hoboken, NJ, USA, 2008; pp. 743–750. [Google Scholar]
- Sharma, G. Color fundamentals for digital imaging. In Digital Color Imaging Handbook; CRC Press: Boca Raton, FL, USA, 2003. [Google Scholar]
- Matsubara, T.; Wataoka, I.; Urakawa, H.; Yasunaga, H. Effect of reaction conditions on production of catechinone hair dyestuff in water/alcohol mixed solution. Adv. Chem. Eng. Sci. 2014, 4, 292. [Google Scholar] [CrossRef]
- Mainya, N.O.; Tum, P.; Muthoka, T.M. Photodegradation and adsorption of methyl orange and methylene blue dyes on TiO2. Int. J. Sci. Res. 2013, 4, 3185–3189. [Google Scholar]
- Hernandez, V.A.; Galleguillos, F.; Robinson, S. Fungal pigments from spalting fungi attenuating blue stain in Pinus spp. Int. Biodeteriora. Biodegrad. 2016, 107, 154–157. [Google Scholar] [CrossRef]
Sample Availability: Samples of the compounds ‘Dramada’ are available from the authors. |


| Solvent | Molarity (mM) | Standard Deviation | |
|---|---|---|---|
| DCM | 0.024 | 6.26 (G) | 0.06 |
| 0.048 | 9.13 (G) | 0.97 | |
| 0.073 | 19.03 (F) | 0.54 | |
| 0.097 | 16.01 (F) | 1.27 | |
| 0.24 | 23.92 (E) | 2.82 | |
| 0.48 | 34.34 (D) | 0.56 | |
| 0.73 | 41.87 (A) | 0.56 | |
| 1.2 | 41.72 (A) | 0.70 | |
| 2.4 | 40.97 (A) | 1.71 | |
| 4.8 | 40.72 (AB) | 0.30 | |
| 7.3 | 38.91 (ABC) | 1.20 | |
| 9.7 | 37.14 (BCD) | 2.29 | |
| 14 | 36.93 (DC) | 1.07 | |
| 15 | 37.19 (BCD) | 0.41 | |
| 17 | 36.21 (DC) | 1.29 | |
| 19 | 36.81 (DC) | 0.70 |
| Molarity (mM) | L* | a* | b* |
|---|---|---|---|
| 0.73 | 82.14 | 32.72 | 18.99 |
| 1.2 | 81.13 | 32.40 | 18.23 |
| 2.4 | 80.26 | 31.85 | 16.51 |
| Solvent | Molarity (mM) | Standard Deviation | |
|---|---|---|---|
| Acetone | 0.024 | 4.39 (H) | 0.18 |
| 0.048 | 8.26 (G) | 0.14 | |
| 0.073 | 11.35 (F) | 0.79 | |
| 0.097 | 14.93 (E) | 0.08 | |
| 0.24 | 26.21 (D) | 1.78 | |
| 0.48 | 35.88 (B) | 0.25 | |
| 0.73 | 38.20 (AB) | 0.49 | |
| 0.97 | 39.36 (A) | 1.38 | |
| 9.7 | 29.64 (C) | 0.72 | |
| 19 | 28.32 (DC) | 1.50 |
| Solution Concentration (mM) |
|---|
| 19 |
| 9.7 |
| 0.73 |
| 0.48 |
| 0.24 |
| 0.097 |
| 0.073 |
| 0.048 |
| 0.024 |
© 2018 by the authors. Licensee MDPI, Basel, Switzerland. This article is an open access article distributed under the terms and conditions of the Creative Commons Attribution (CC BY) license (http://creativecommons.org/licenses/by/4.0/).
Share and Cite
Vega Gutierrez, S.M.; Van Court, R.C.; Stone, D.W.; Konkler, M.J.; Groth, E.N.; Robinson, S.C. Relationship between Molarity and Color in the Crystal (‘Dramada’) Produced by Scytalidium cuboideum, in Two Solvents. Molecules 2018, 23, 2581. https://doi.org/10.3390/molecules23102581
Vega Gutierrez SM, Van Court RC, Stone DW, Konkler MJ, Groth EN, Robinson SC. Relationship between Molarity and Color in the Crystal (‘Dramada’) Produced by Scytalidium cuboideum, in Two Solvents. Molecules. 2018; 23(10):2581. https://doi.org/10.3390/molecules23102581
Chicago/Turabian StyleVega Gutierrez, Sarath M., R. C. Van Court, Derek W. Stone, Matthew J. Konkler, Emily N. Groth, and Seri C. Robinson. 2018. "Relationship between Molarity and Color in the Crystal (‘Dramada’) Produced by Scytalidium cuboideum, in Two Solvents" Molecules 23, no. 10: 2581. https://doi.org/10.3390/molecules23102581
APA StyleVega Gutierrez, S. M., Van Court, R. C., Stone, D. W., Konkler, M. J., Groth, E. N., & Robinson, S. C. (2018). Relationship between Molarity and Color in the Crystal (‘Dramada’) Produced by Scytalidium cuboideum, in Two Solvents. Molecules, 23(10), 2581. https://doi.org/10.3390/molecules23102581