Biochemical and Comparative Transcriptomic Analyses Identify Candidate Genes Related to Variegation Formation in Paeonia rockii

 ,
,
Abstract
:1. Introduction
2 Results
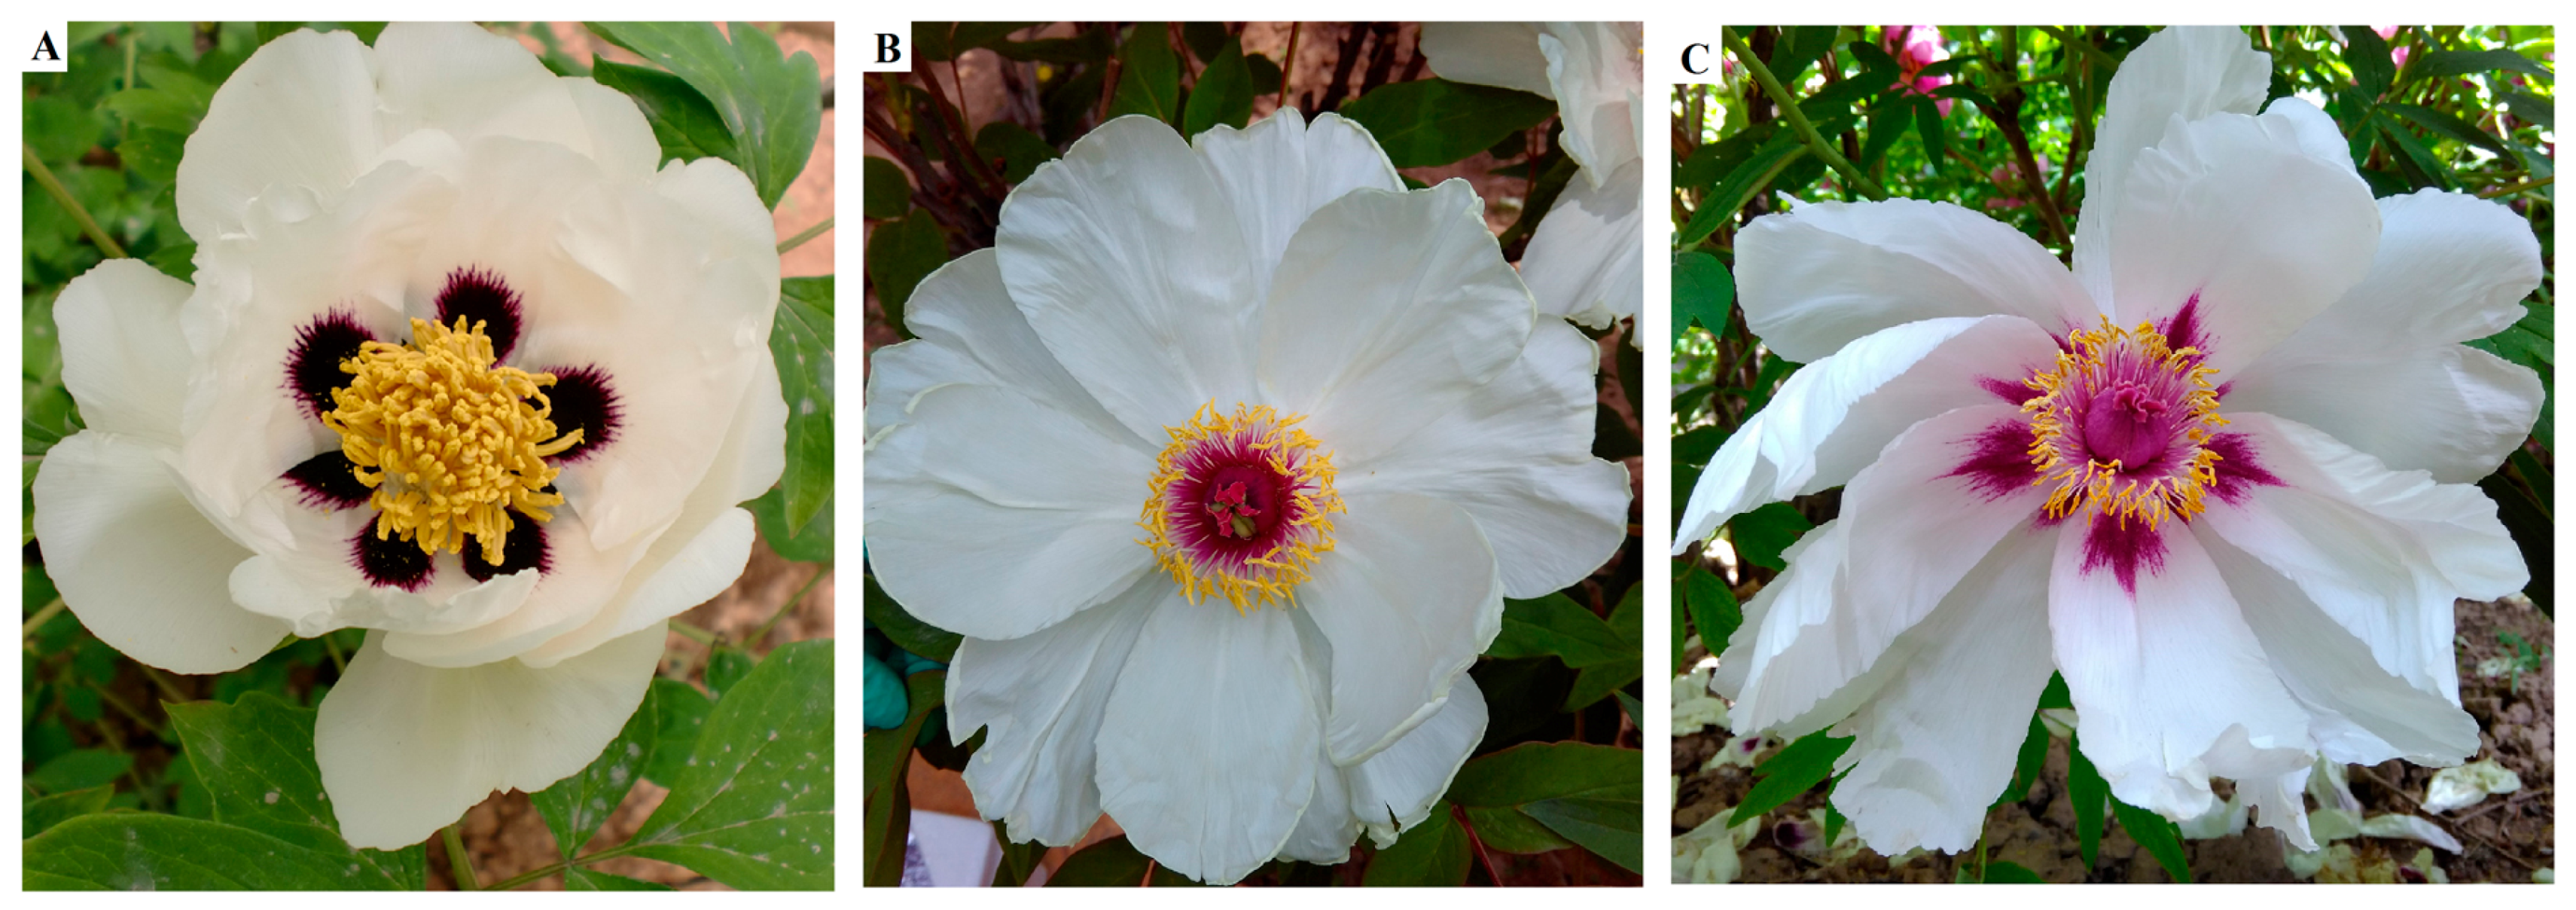
2.1. F1 Progeny
2.2. Color Indices
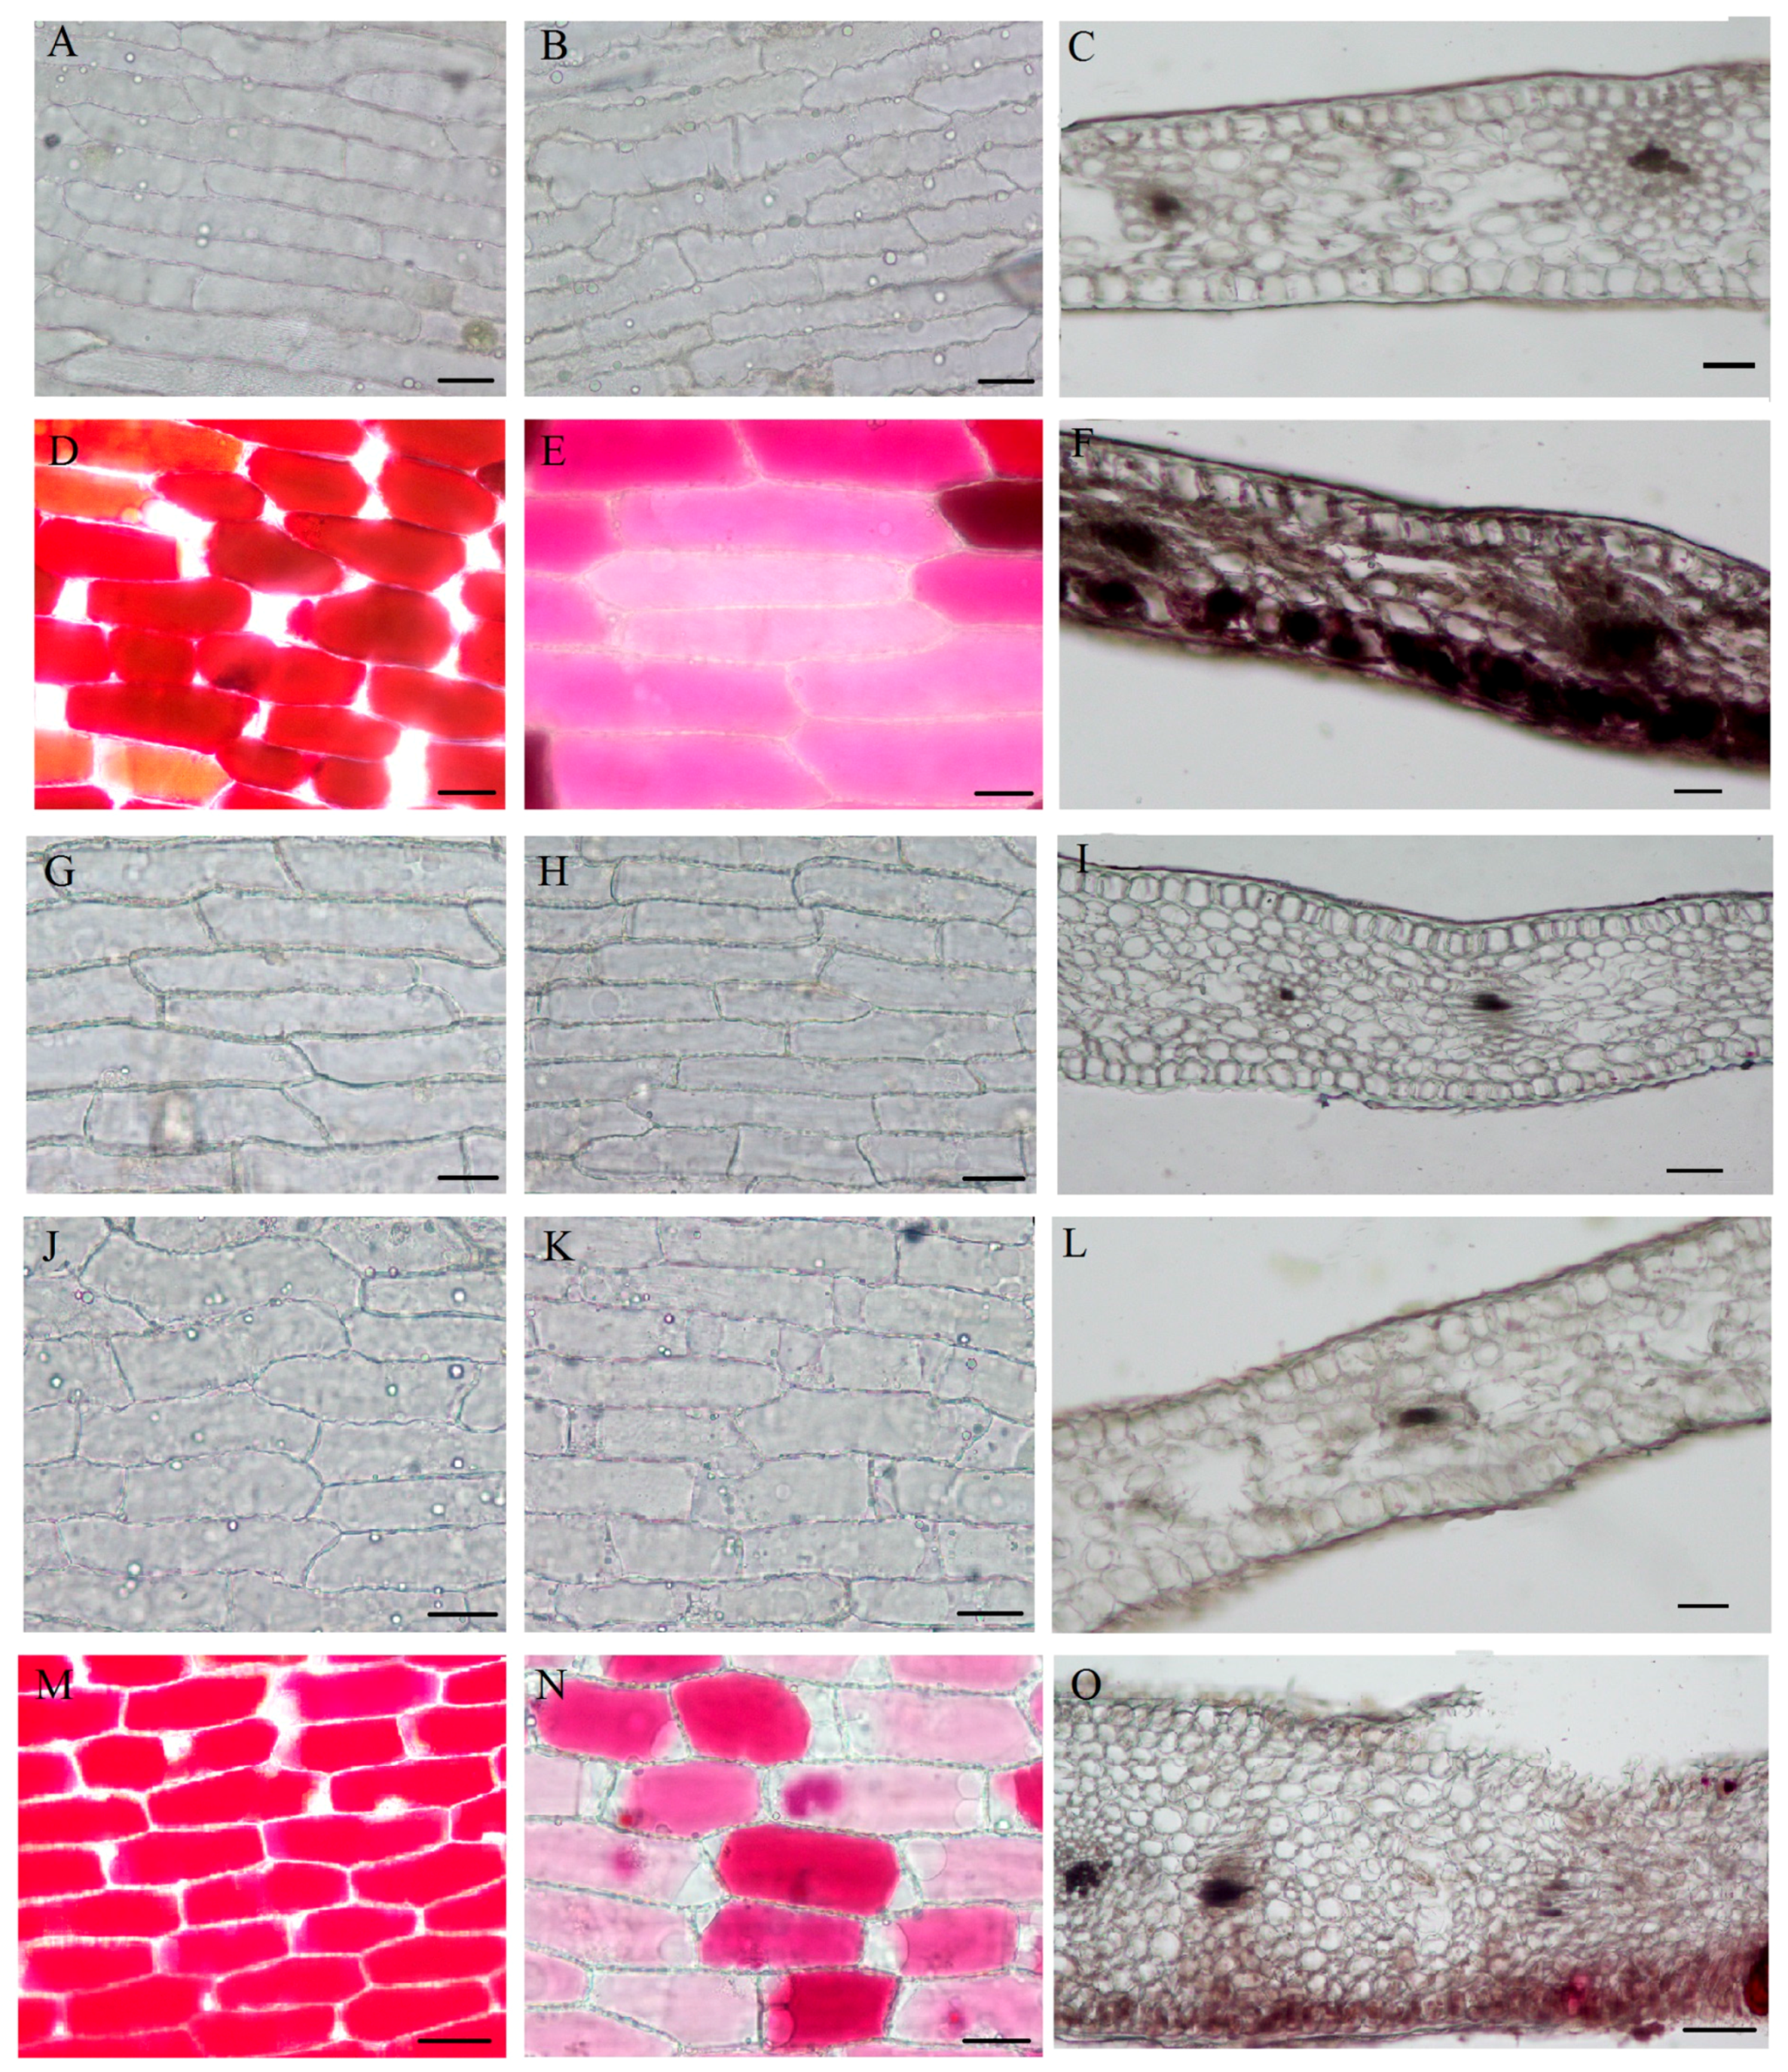
2.3. Spatial Location of the Pigments
2.4. Qualitative and Quantitative Analysis of Pigments
2.5. Transcriptome Sequencing and Annotation
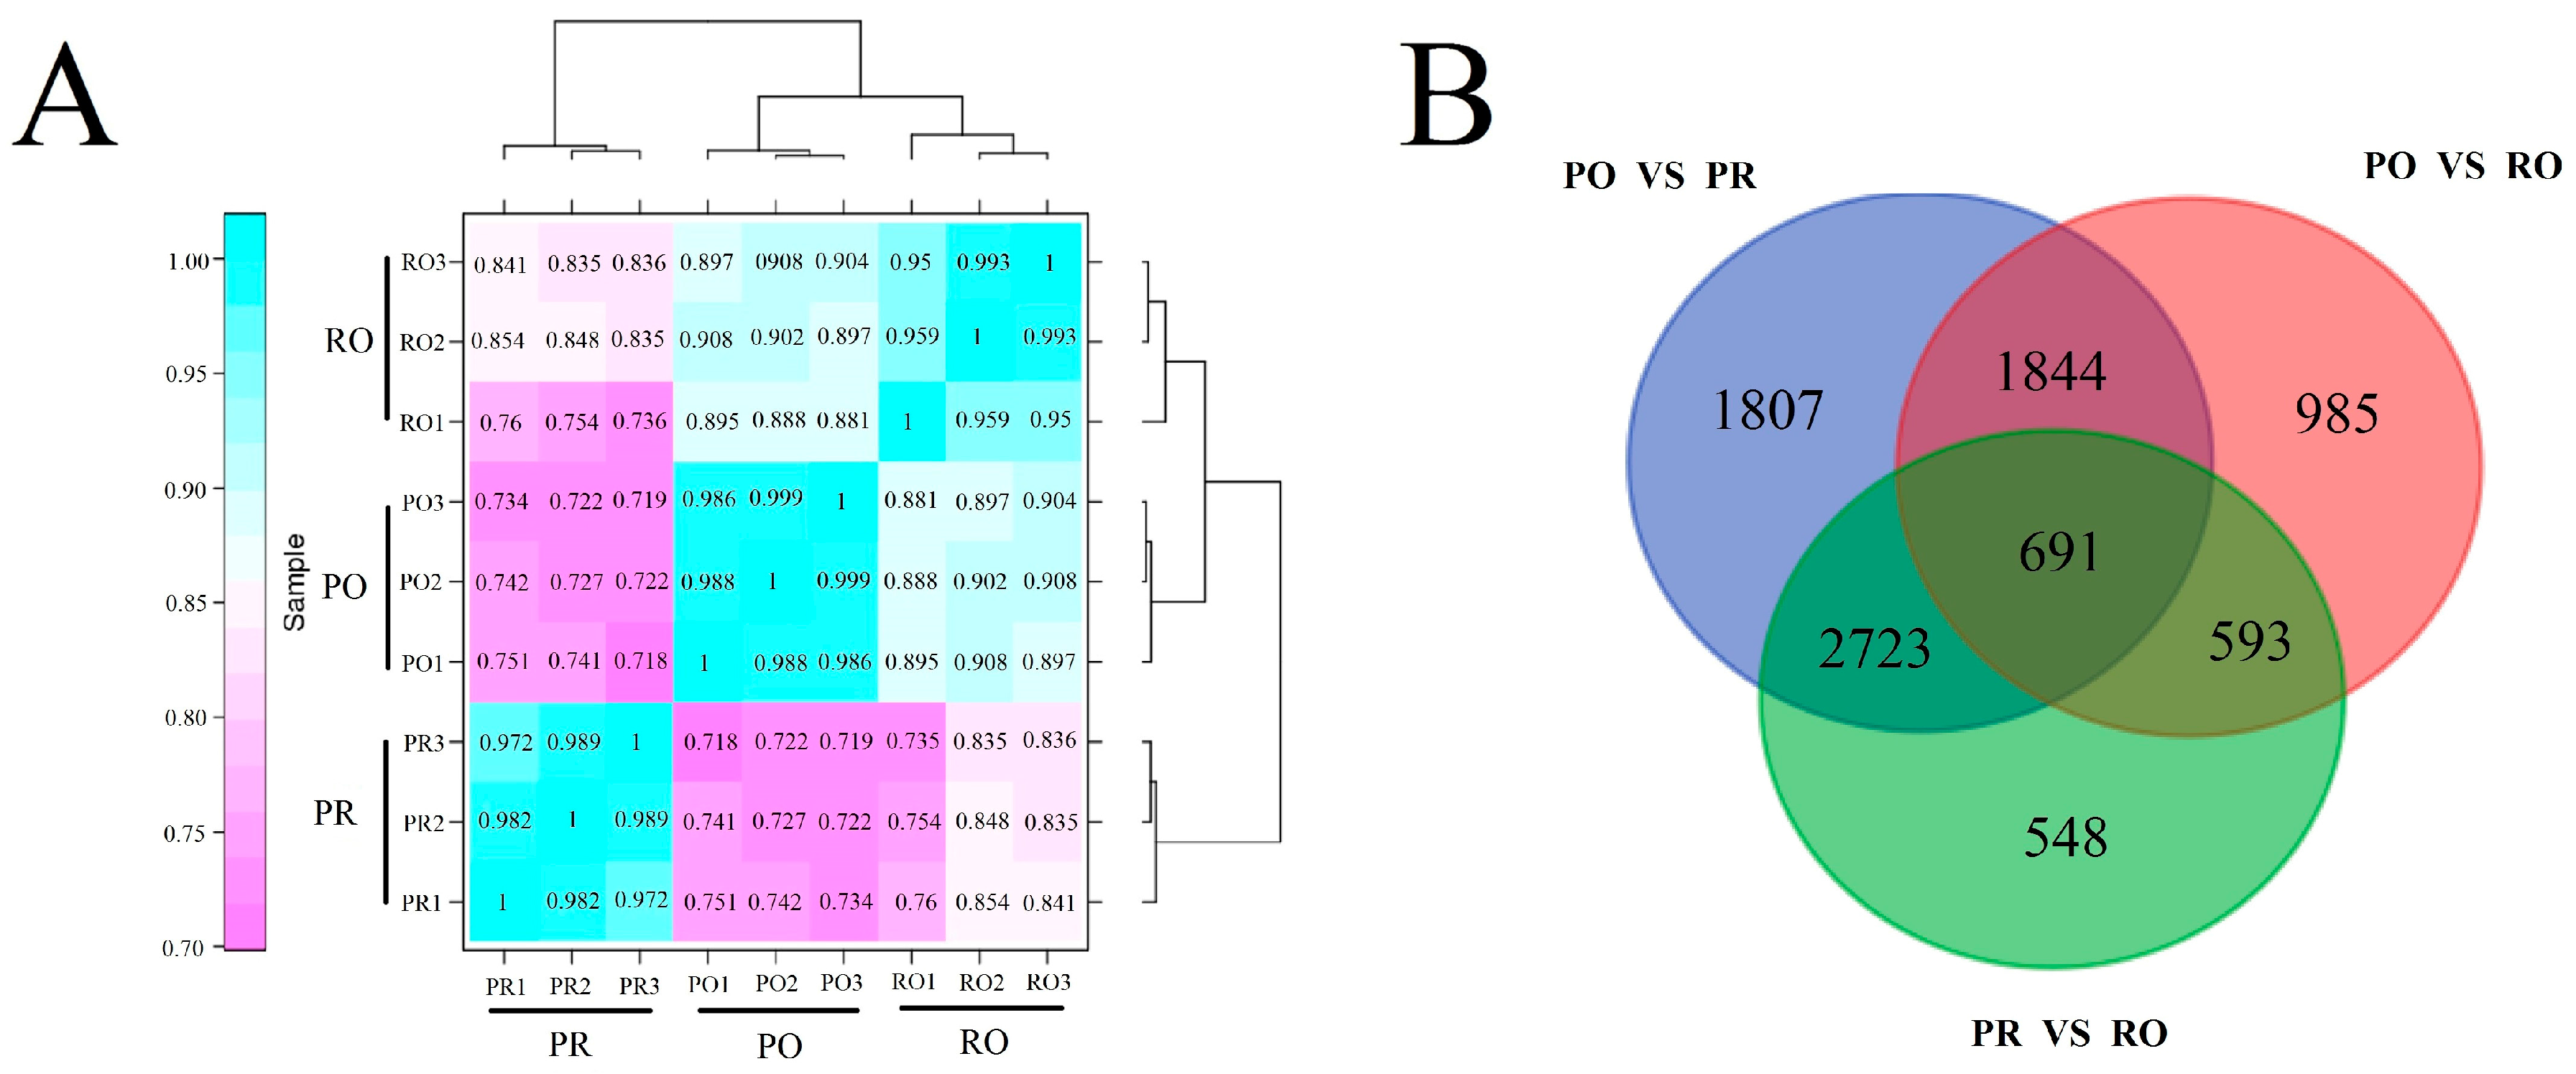
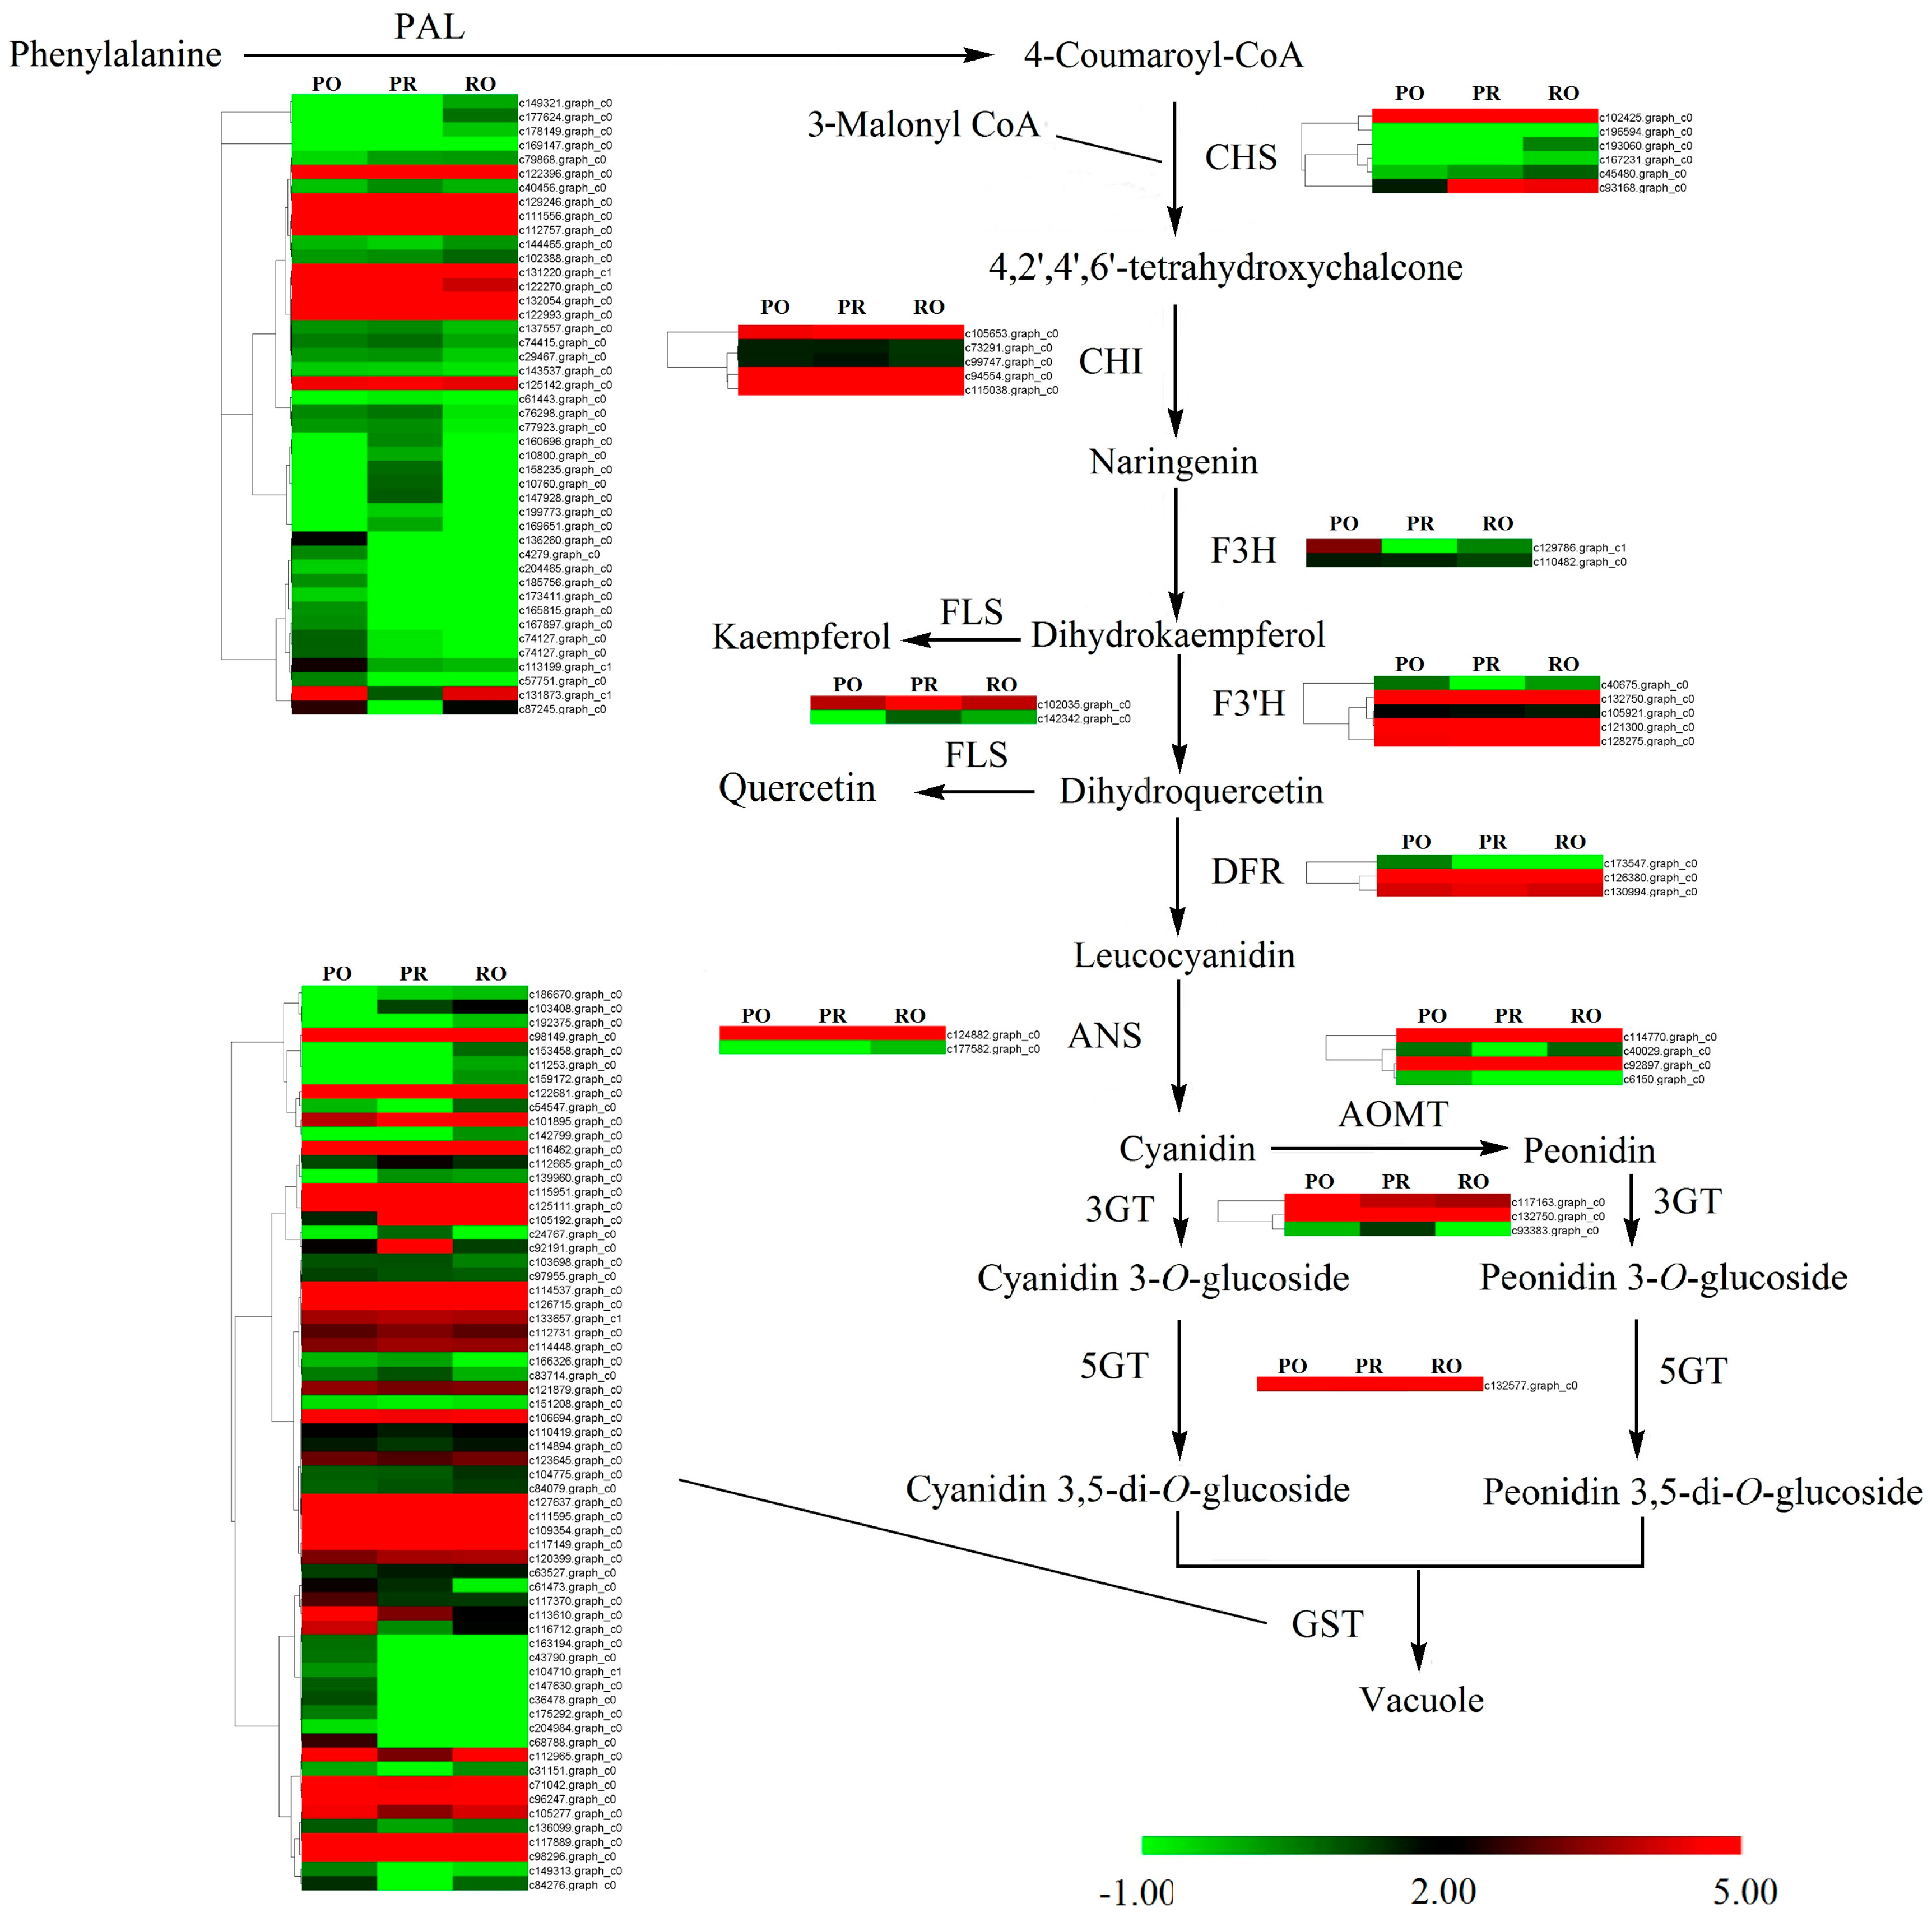
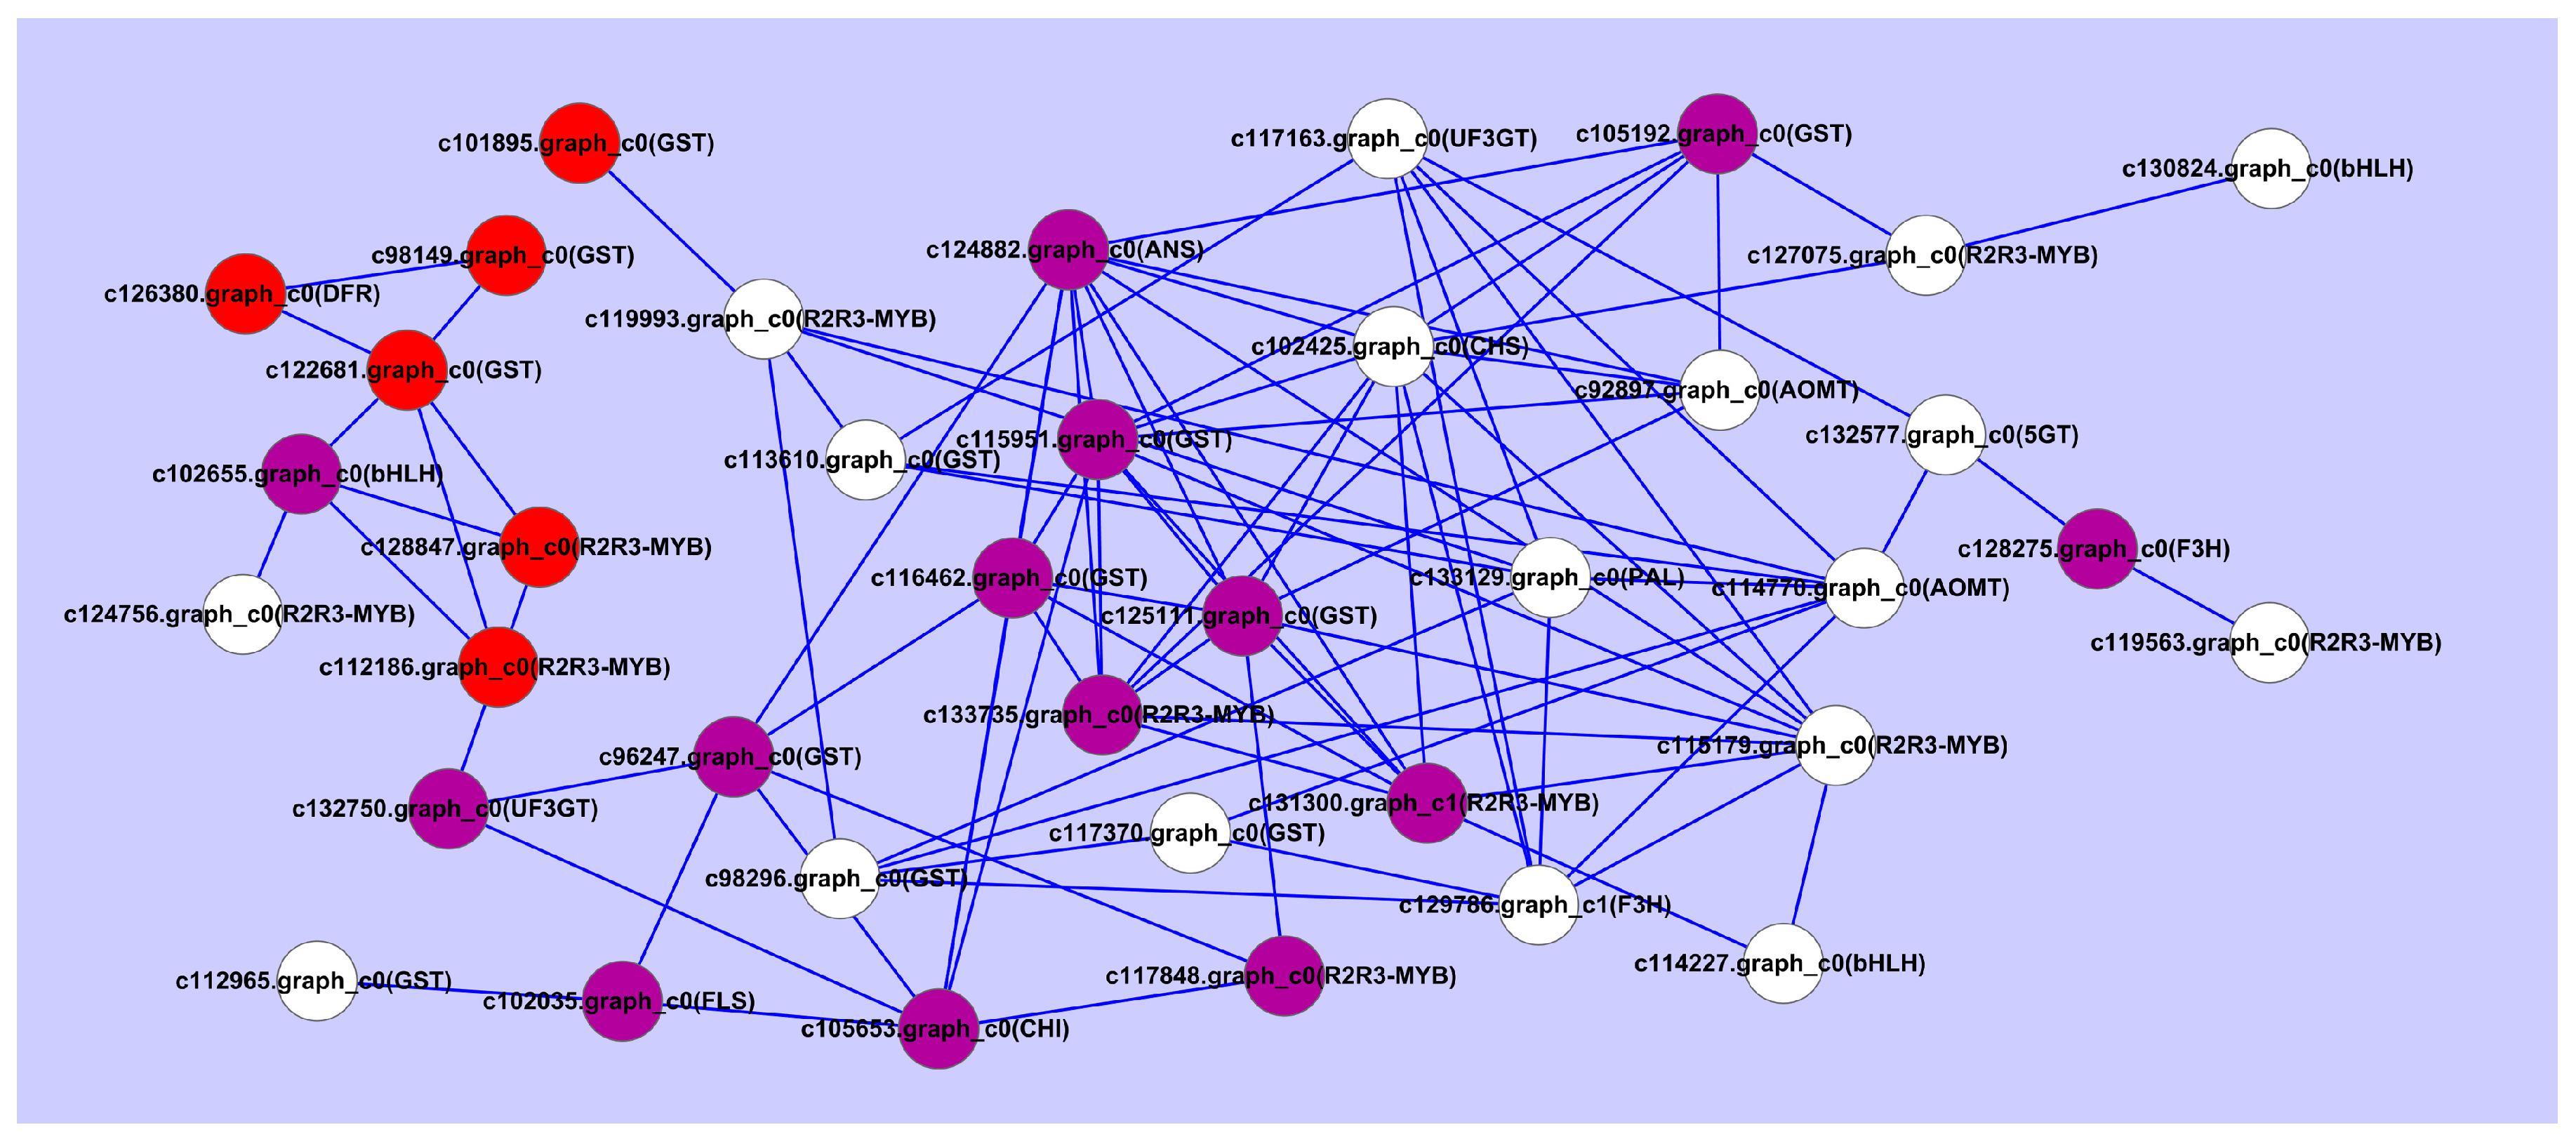
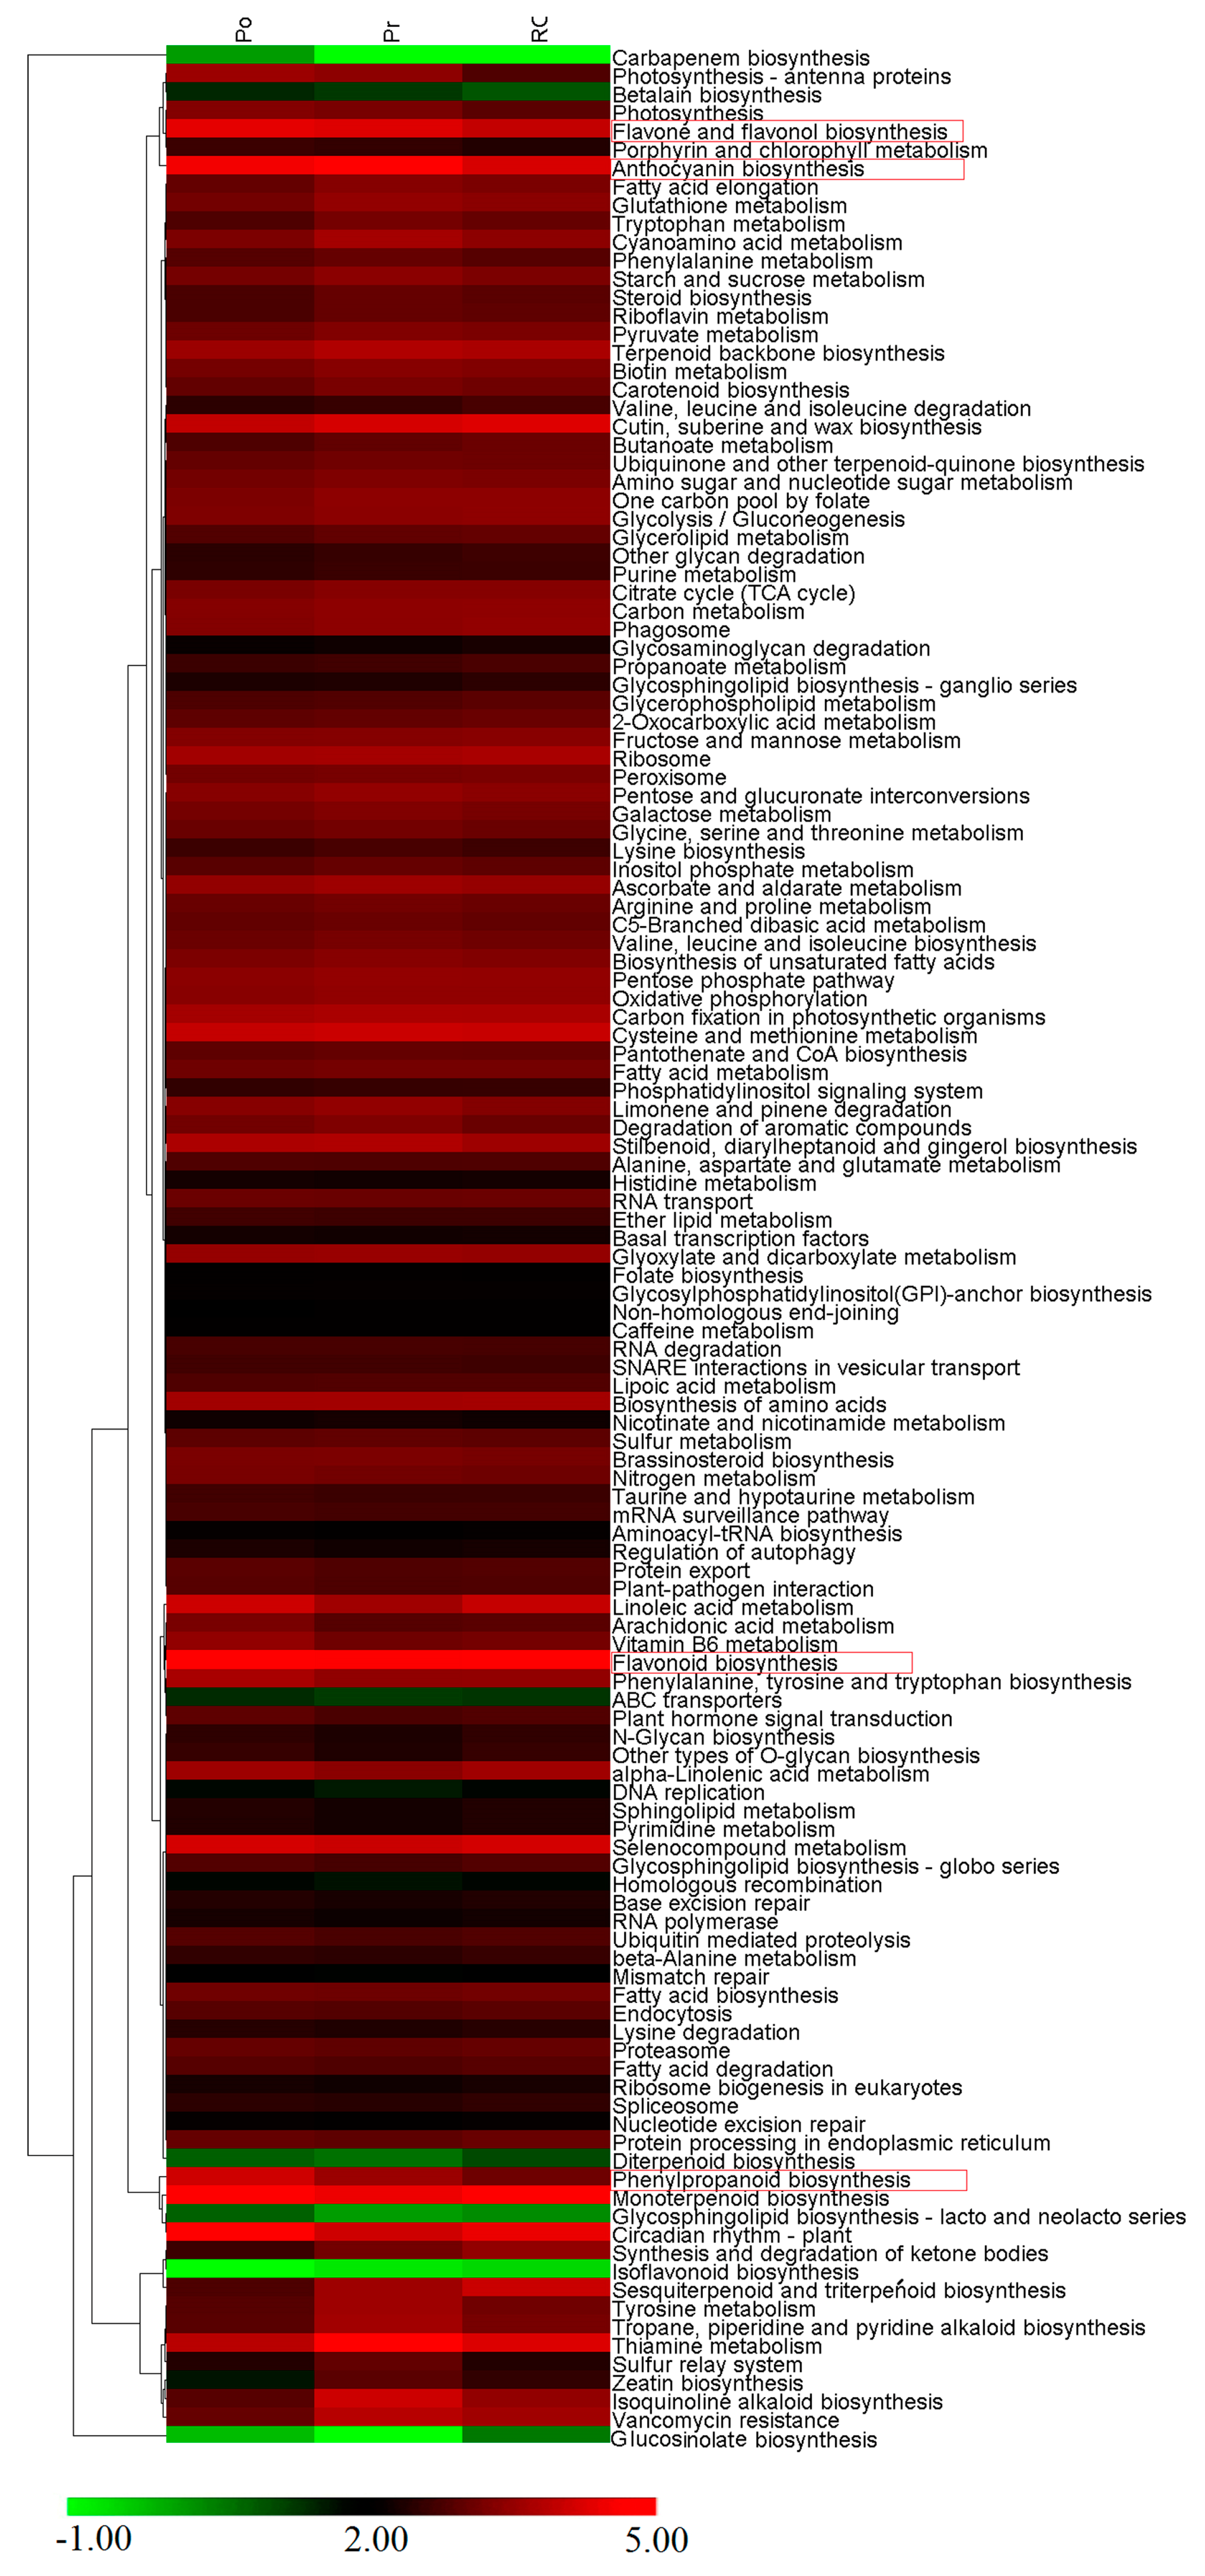
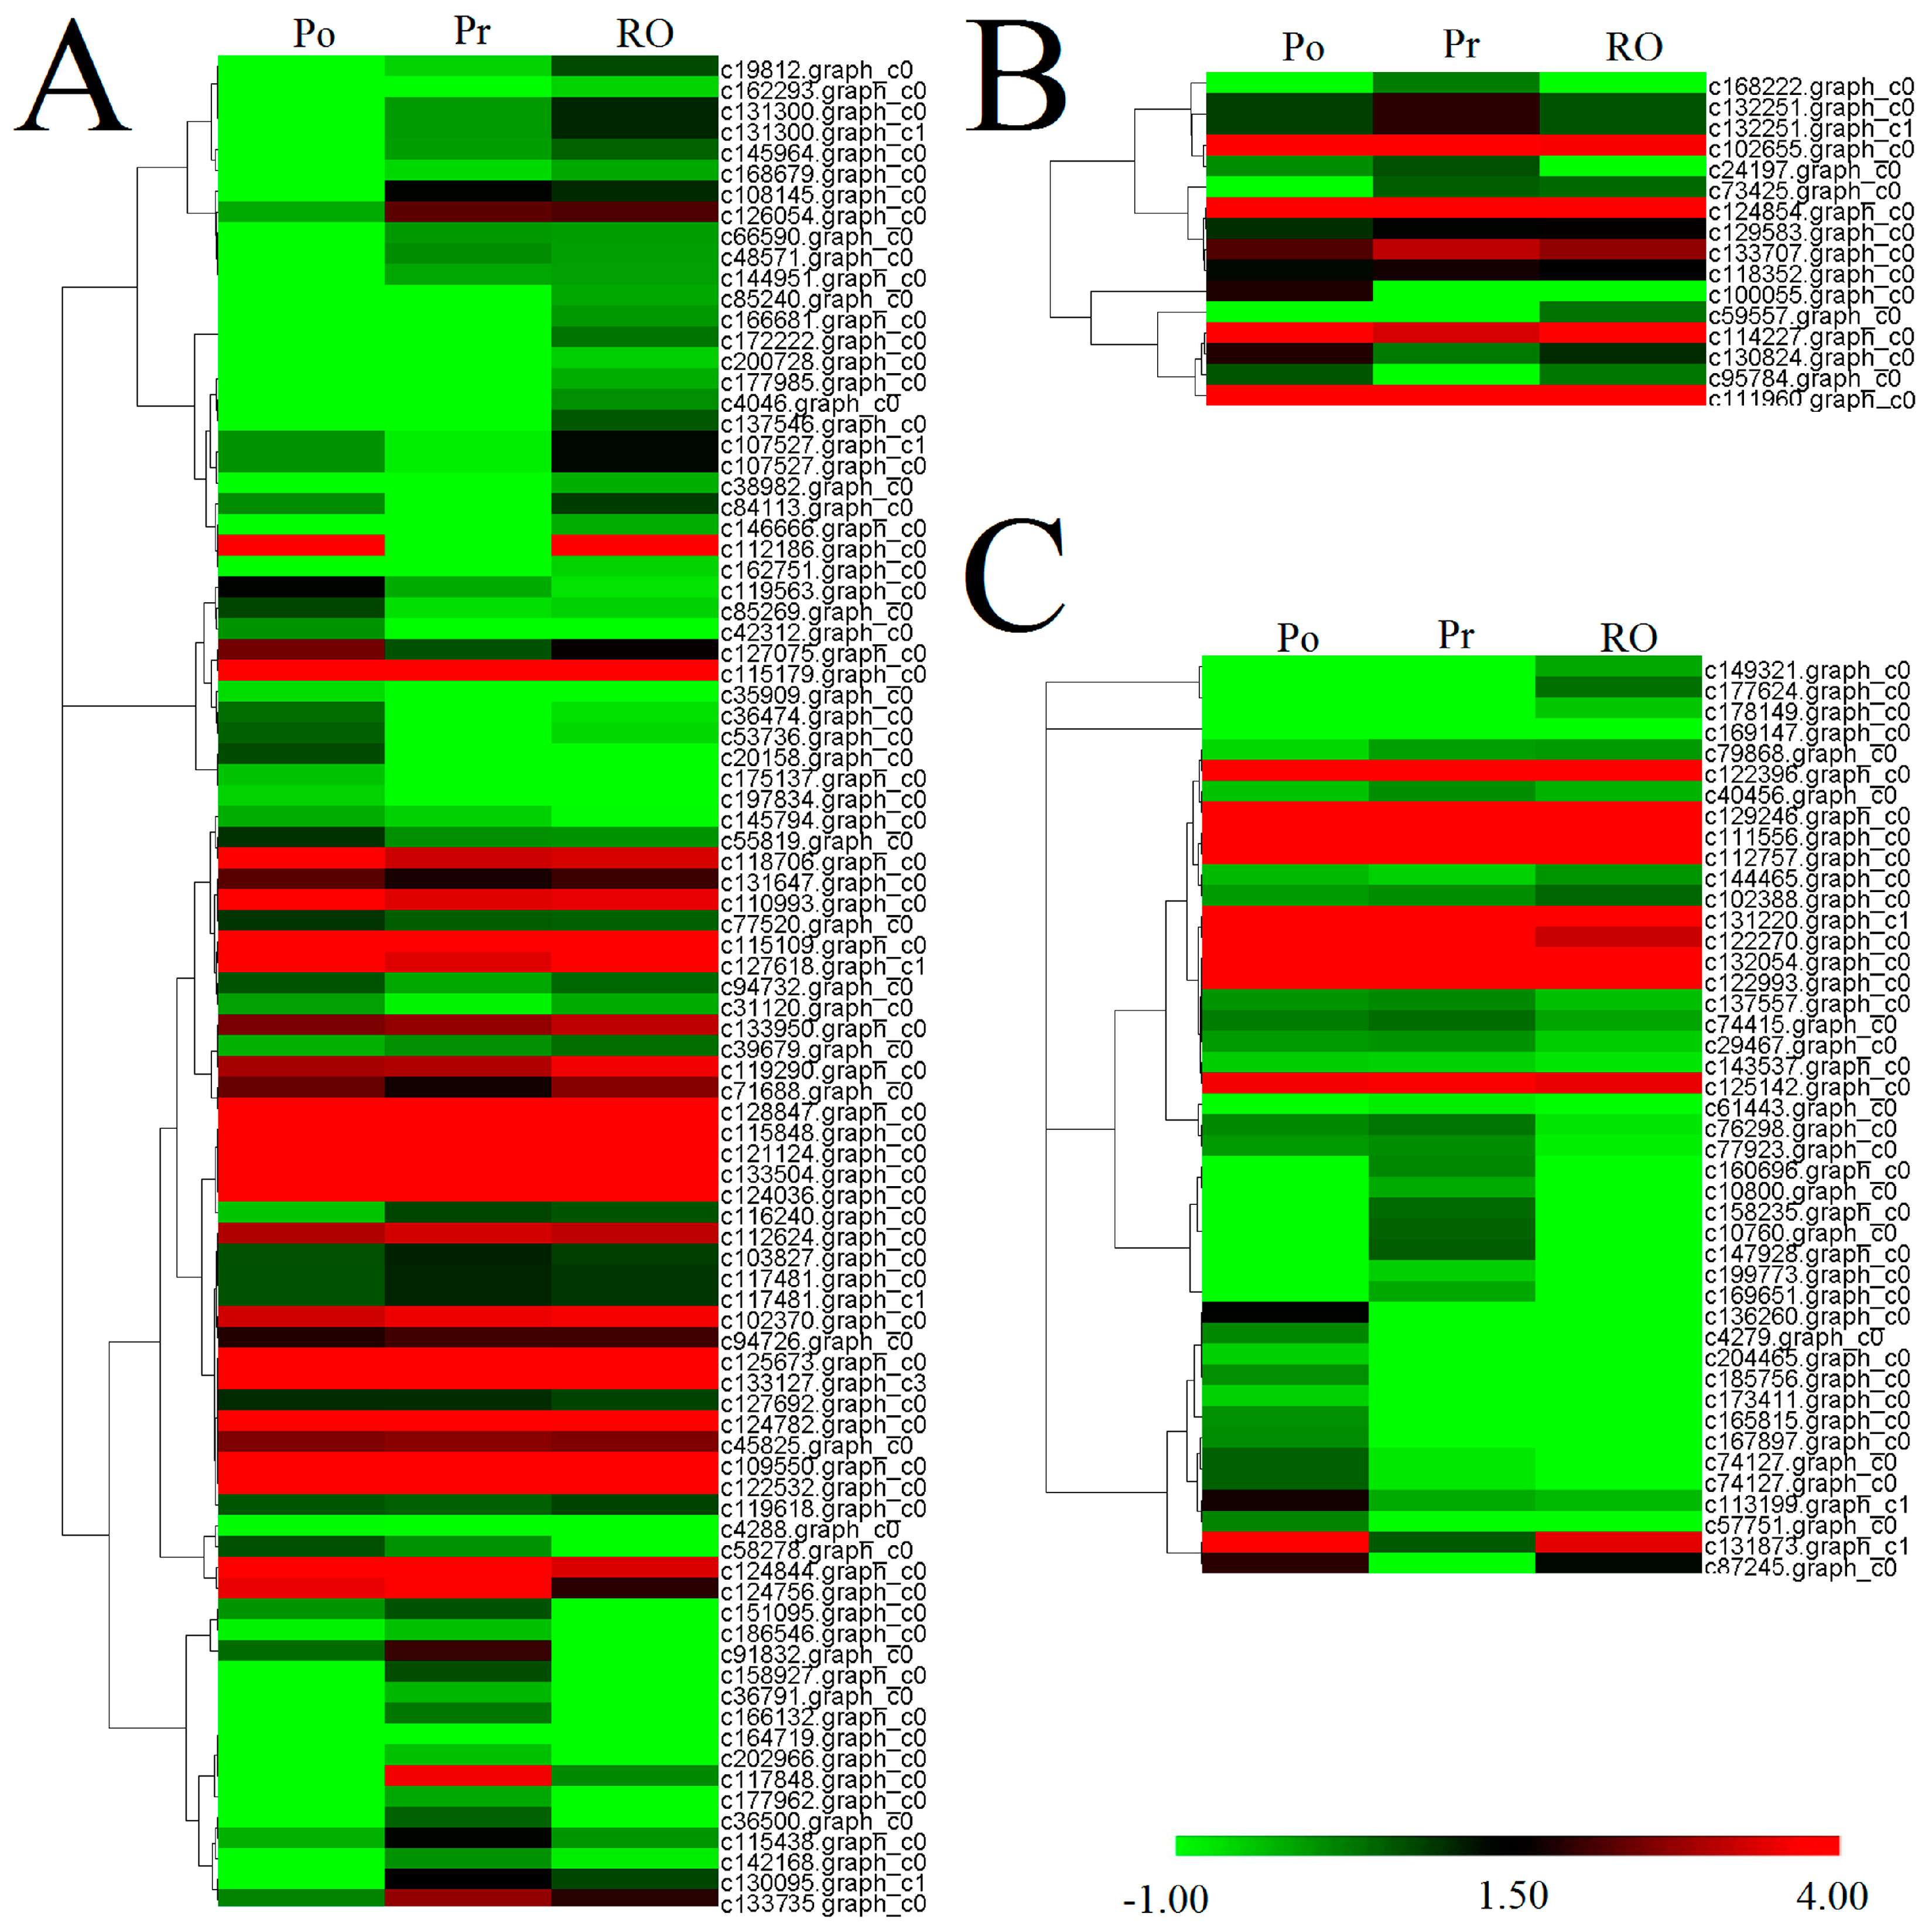
2.6. Comparative Analysis of the P. rockii, P. ostii and F1 Progeny Transcriptomes
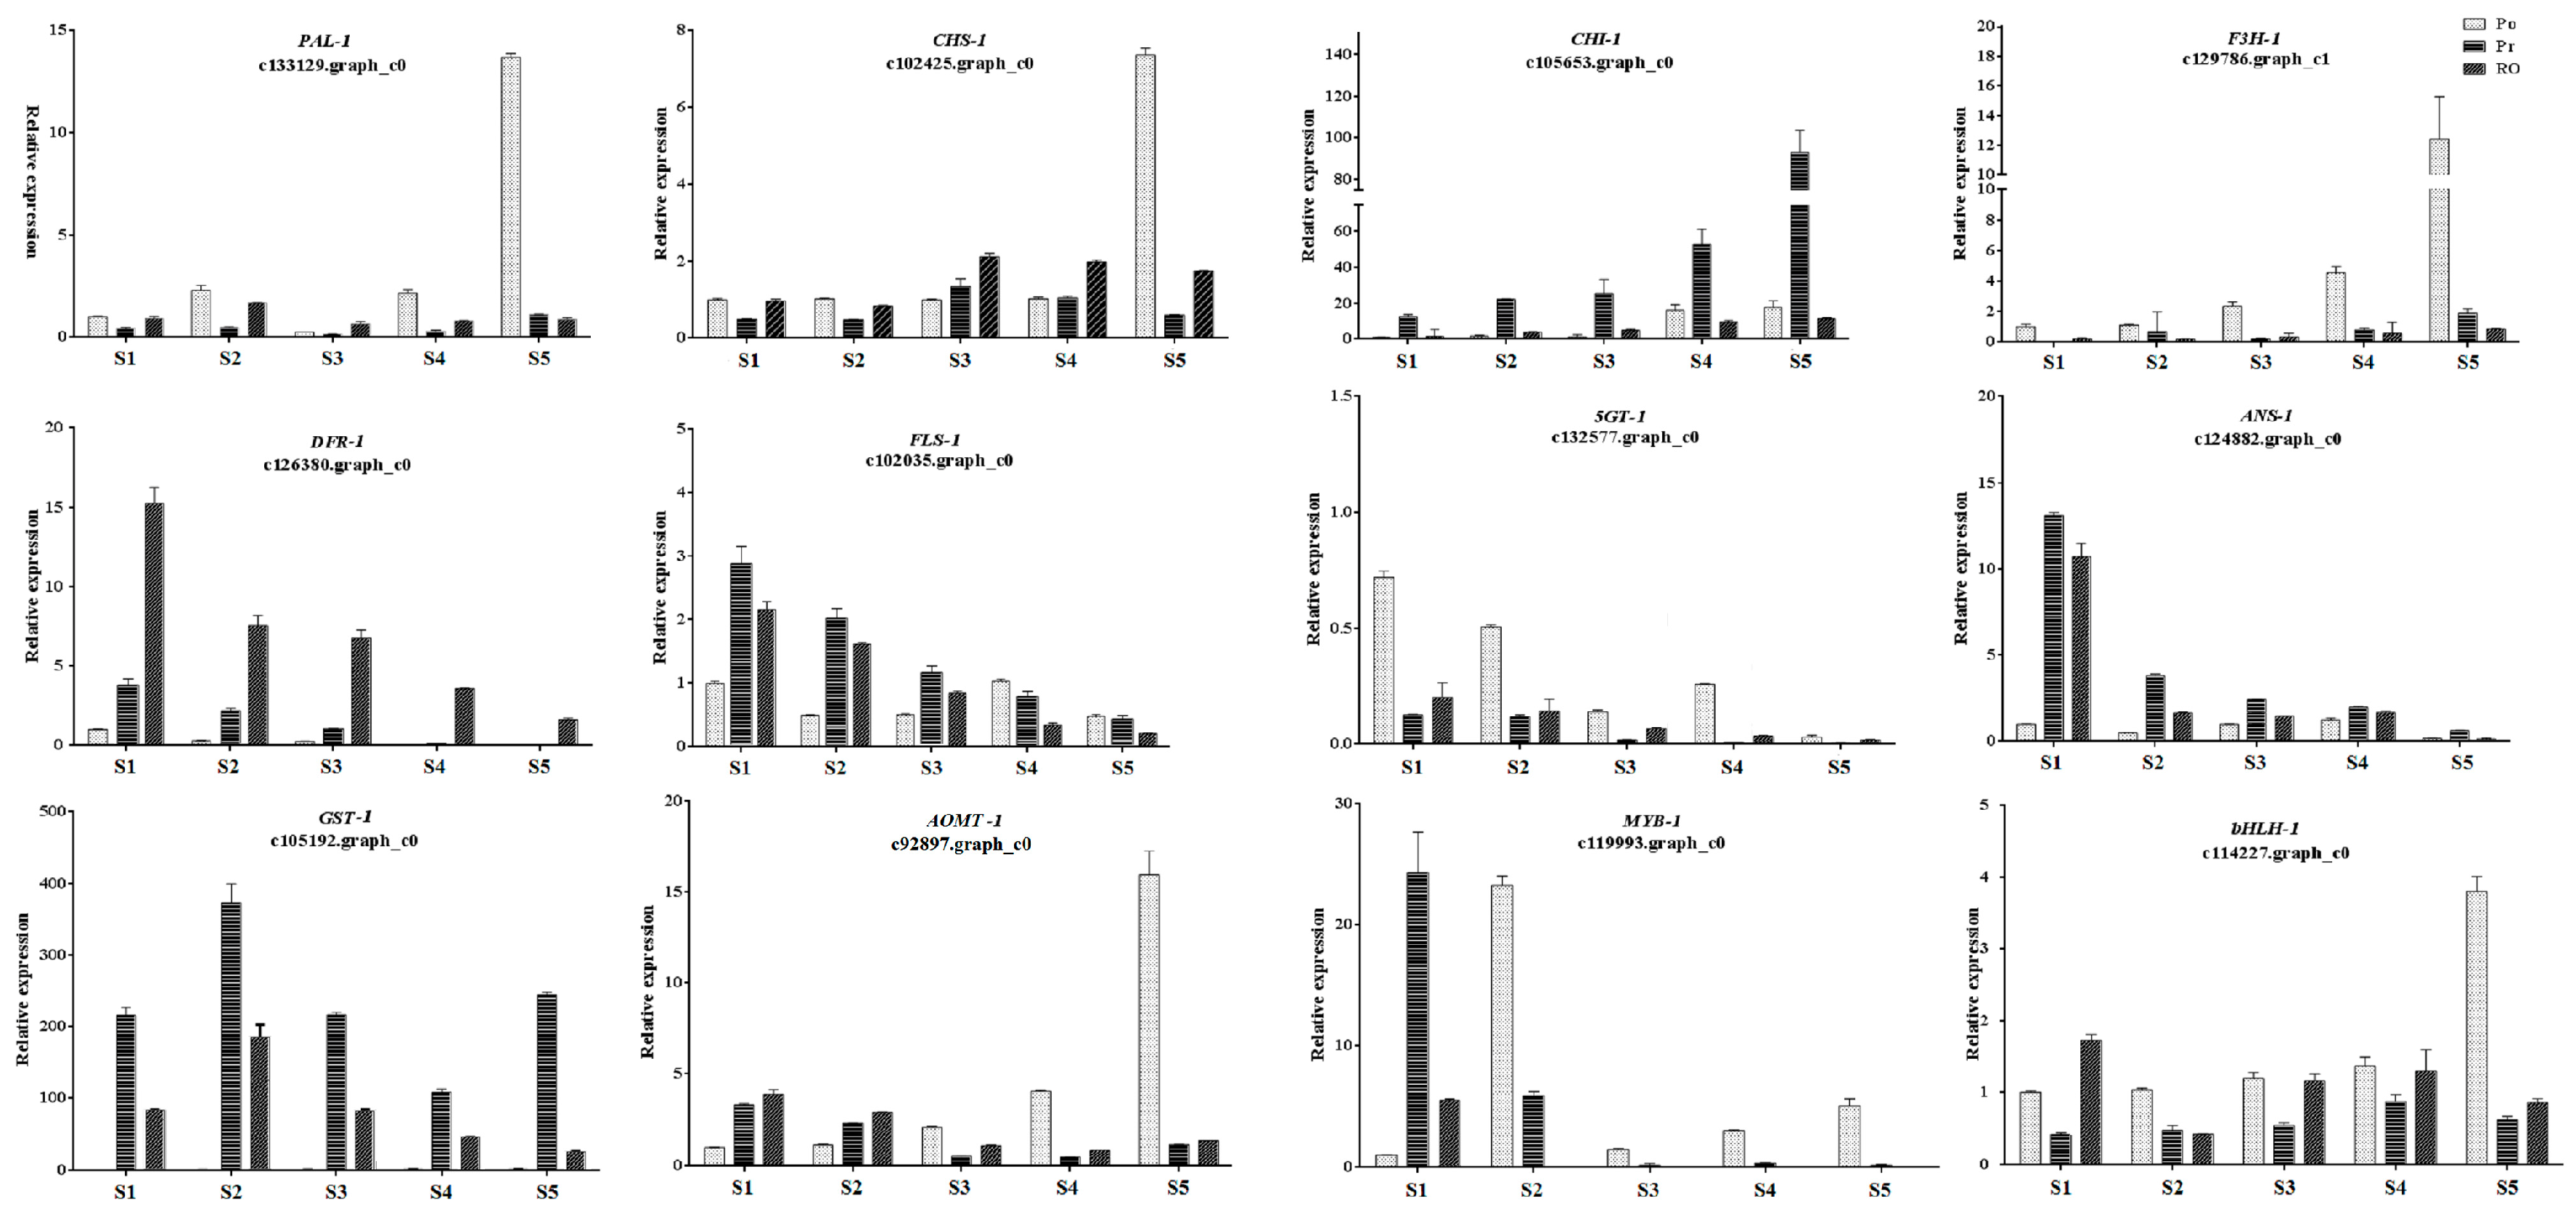
2.7. Validation of the Expression Levels of Differentially Expressed Genes at Different Stages
3. Discussion
4. Materials and Methods
4.1. Plant Material
4.2. Petal Color Variable Measurements
4.3. Microscopic Observation of the Epidermal Cells and Transverse Sections
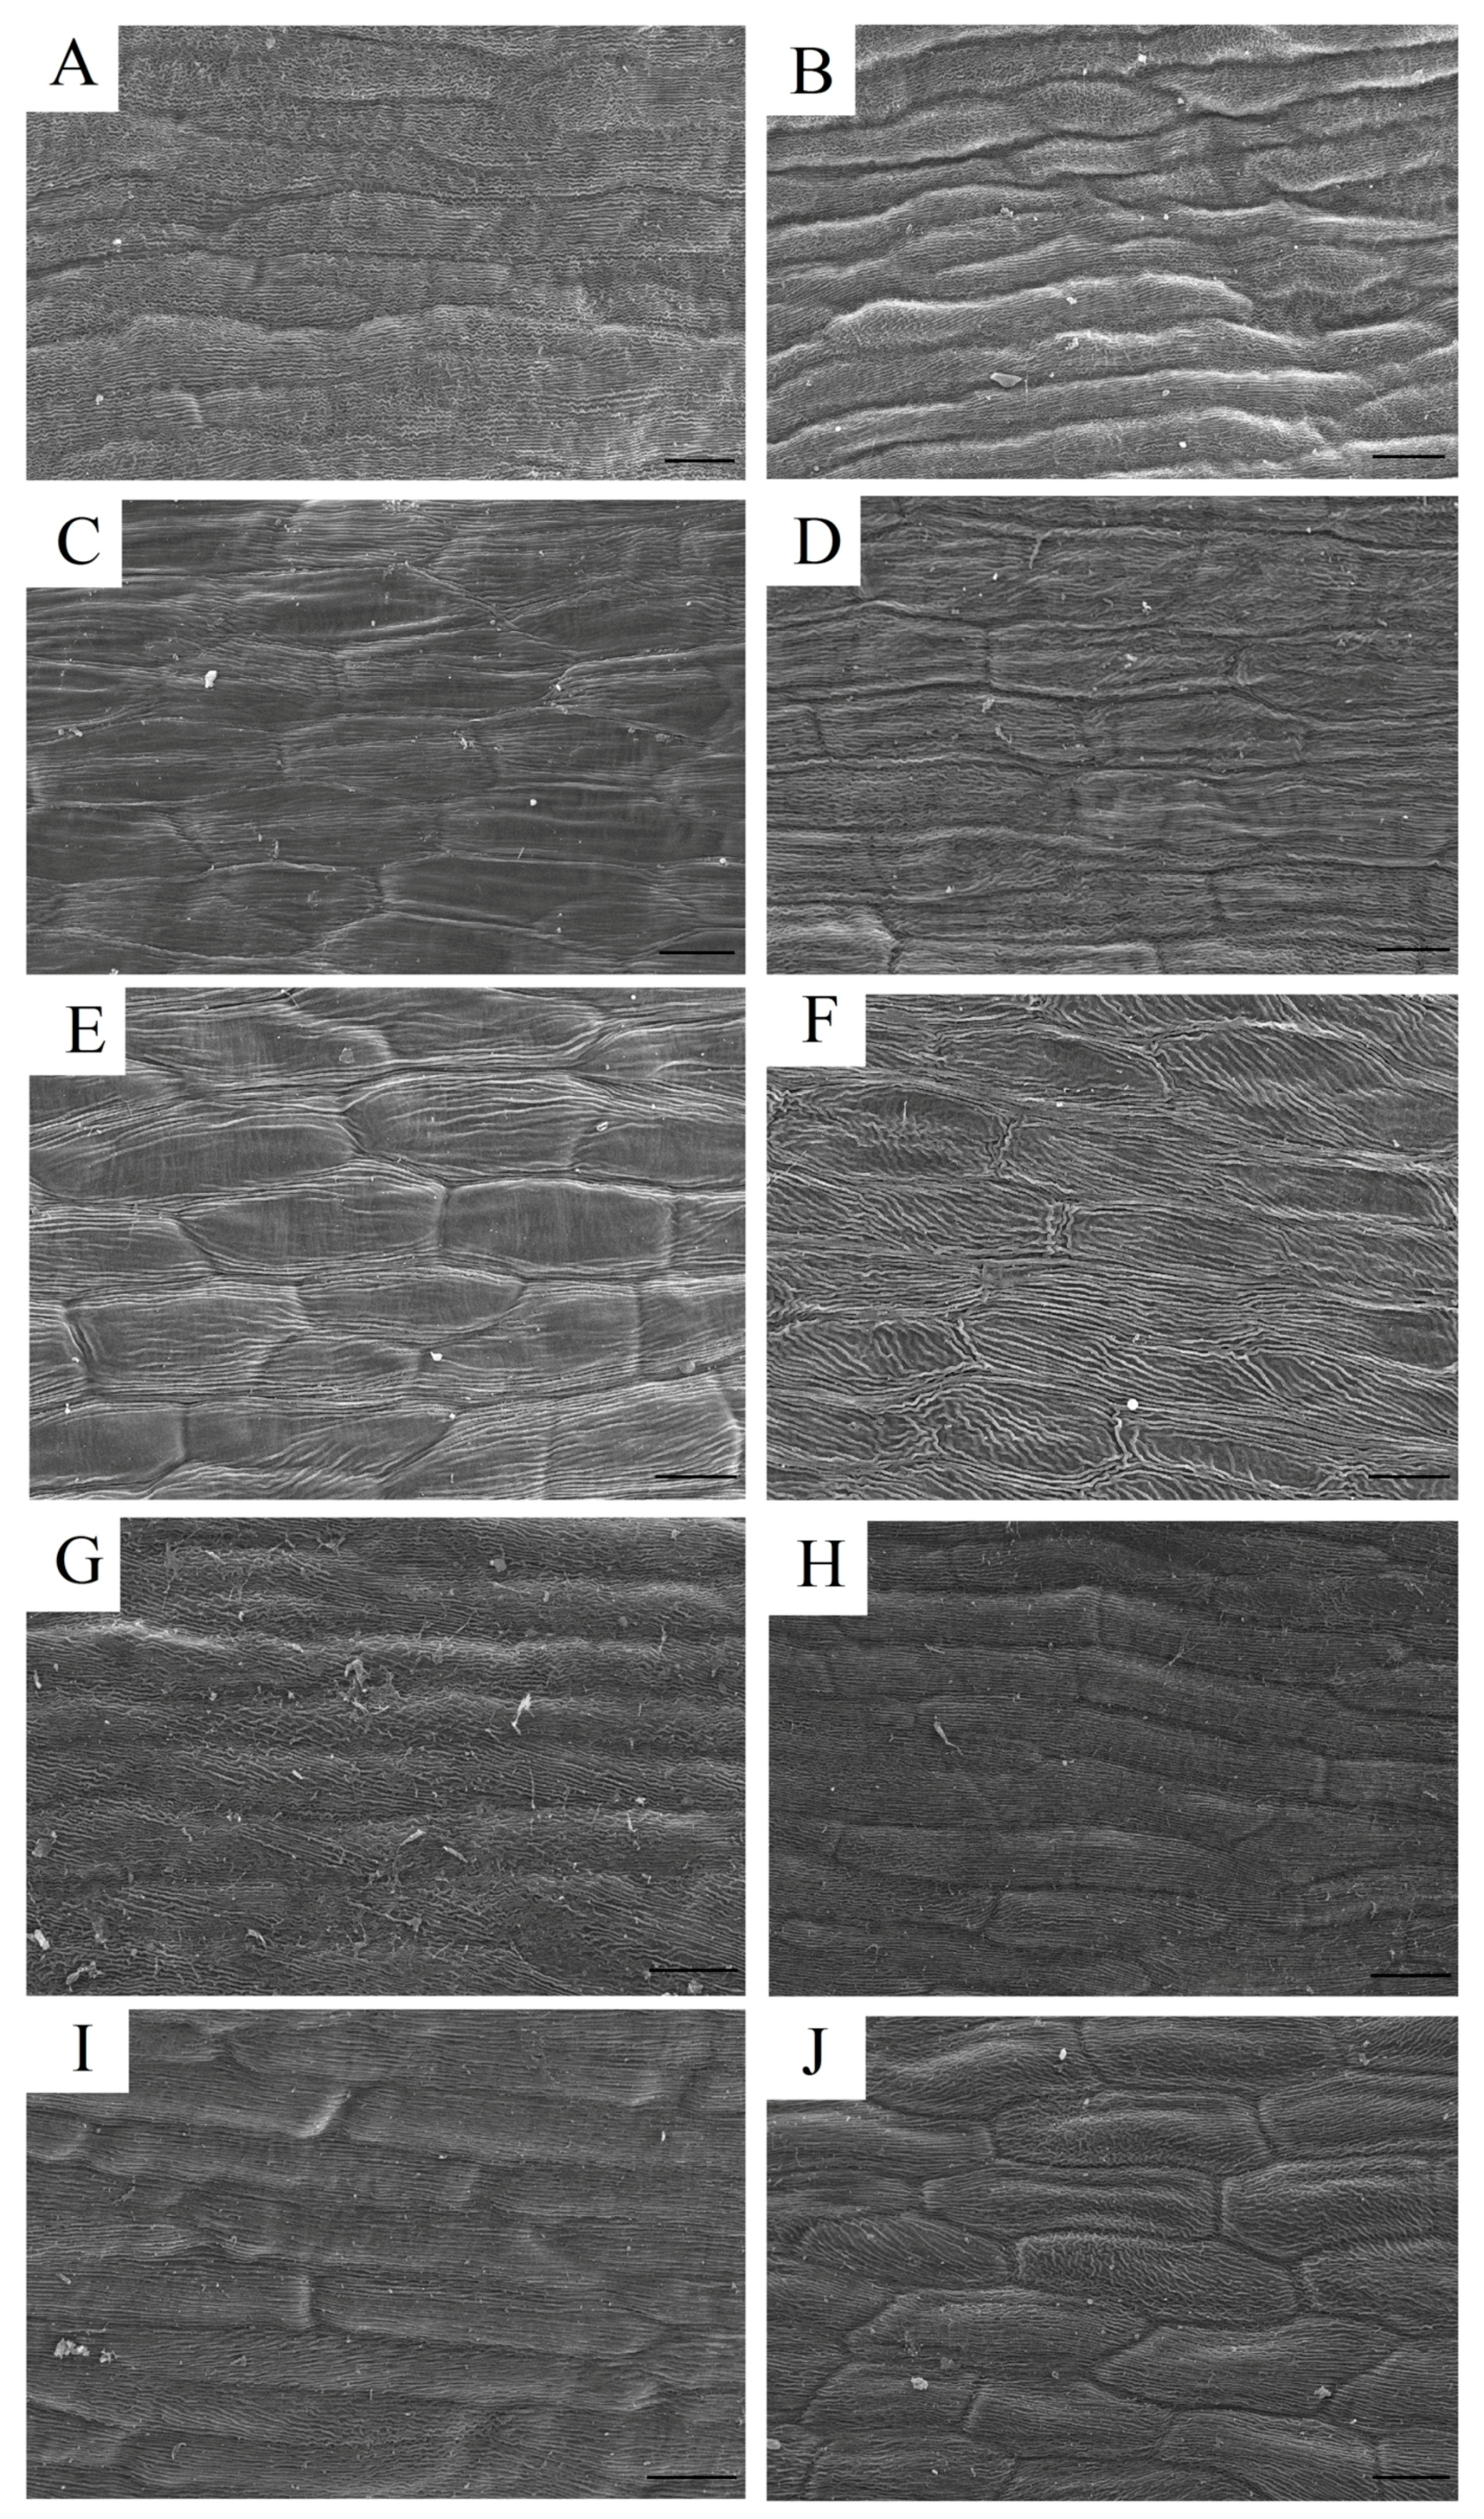
4.4. Scanning Electron Microscopy (SEM)
4.5. Pigment Measurement
4.6. RNA Extraction, Library Construction, and RNA-seq
4.7. De Novo Assembly and Annotation
4.8. Differential Gene Expression Analysis
4.9. qRT-PCR Analysis
Supplementary Materials
Acknowledgments
Author Contributions
Conflicts of Interest
Abbreviations
| 3GT | anthocyanin 3-O-glucosyltransferase |
| 5GT | anthocyanin 5-O-glucosyltransferase |
| a*, b* | chromatic components |
| ANS | anthocyanin synthase |
| AOMT | anthocyanin O-methyltransferase |
| Ap | apigenin |
| bHLH | basic helix-loop-helix |
| C* | chroma (brightness) |
| CHI | chalcone isomerase |
| CHS | chalcone synthase |
| CI | Co-pigment index |
| COG | Cluster of orthologous groups of proteins database |
| Cy3G | cyanidin 3-O-glucoside |
| Cy3G5G | cyaniding 3,5-di-O-glucoside |
| DEGs | differentially expressed genes |
| DFR | dihydroflavonol 4-reductase |
| F3’H | flavonoid 3’-hydroxylase |
| F3H | flavanone 3-hydroxylase |
| FDR | false discovery rates |
| FLS | flavonol synthase |
| FPKM | fragments per kilobase per million mapped reads |
| GO | gene ontology |
| GST | glutathione S-transferase |
| HPLC | hogh-performance liquid chromatography |
| Is | isorhamnetin |
| KEGG | Kyoto encyclopedia of genes and genomes database |
| Km | kaempferol |
| KOG | euKaryotic orthologous groups |
| L* | lightness |
| Lu | luteolin |
| Nr | Non-resundant protein database |
| PAL | phenylalanine ammonia-lyase |
| Pfam | protein family |
| Pn3G | peonidin 3-O-glucoside |
| Pn3G5G | peonidin 3,5-di-O-glucoside |
| qRT-PCR | quantitative reverse transcription PCR |
| Qu | quercetin |
| R | pearson’s correlation coefficient |
| RHSCC | Royal horticultural society colour chart |
| SwissProt | SwissProt protein database |
| TA | total anthocyanin |
| TF | total flavone and flavonol in mg/100 mg dry petals. |
References
- Li, J.J. Tree Peony and Herbaceous Peony; China Forestry Publishing House: Beijing, China, 1996. [Google Scholar]
- Wang, L.; Hashimoto, F.; Shiraishi, A.; Shimizu, K.; Aoki, N.; Sakata, Y. Petal coloration and pigmentation of tree peony cultivars of Xibei (the Northwest of China). J. Jpn. Soc. Hortic. Sci. 2000, 69, 233. [Google Scholar]
- Tanaka, Y.; Ohmiya, A. Seeing is believing: Engineering anthocyanin and carotenoid biosynthetic pathways. Curr. Opin. Biotechnol. 2008, 19, 190–197. [Google Scholar] [CrossRef] [PubMed]
- Suzuki, K.; Suzuki, T.; Nakatsuka, T.; Dohra, H.; Yamagishi, M.; Matsuyama, K.; Matsuura, H. RNA-seq-based evaluation of bicolor tepal pigmentation in Asiatic hybrid lilies (Lilium spp.). BMC Genom. 2016, 17, 611. [Google Scholar] [CrossRef] [PubMed]
- Schaart, J.G.; Dubos, C.; Romero, D.L.; Fuente, I.; Houwelingen, A.M.; Vos, R.C.; Jonker, H.H. Identification and characterization of MYB-bHLH-WD40 regulatory complexes controlling proanthocyanidin biosynthesis in strawberry (Fragaria × ananassa) fruits. New Phytol. 2013, 197, 454–467. [Google Scholar] [CrossRef] [PubMed]
- Zhang, J.; Wang, L.; Shu, Q.; Liu, Z.; Li, C.; Zhang, J.; Wei, X.; Tian, D. Comparison of anthocyanins in non-blotches and blotches of the petals of Xibei tree peony. Sci. Hortic. 2007, 114, 104–111. [Google Scholar] [CrossRef]
- Zhang, Y.; Cheng, Y.; Ya, H.; Xu, S.; Han, J. Transcriptome sequencing of purple spot region in tree peony reveals differentially expressed anthocyanin structural genes. Front. Plant Sci. 2015, 6, 964–972. [Google Scholar] [CrossRef] [PubMed]
- Martins, T.; Berg, J.; Blinka, S.; Rausher, M.; Baum, D. Precise spatial-temporal regulation of the anthocyanin biosynthetic pathway leads to petal spot formation in Clarkia gracilis (Onagraceae). New Phytol. 2013, 197, 958–969. [Google Scholar] [CrossRef] [PubMed]
- Schwinn, K.; Venail, J.; Shang, Y.; Mackay, S.; Alm, V.; Butelli, E.; Oyama, R.; Bailey, P.; Davies, K.; Martin, C. A small family of MYB-regulatory genes controls floral pigmentation intensity and patterning in the genus Antirrhinum. Plant Cell 2006, 18, 831–851. [Google Scholar] [CrossRef] [PubMed]
- Shang, Y.; Venail, J.; Mackay, S.; Bailey, P.; Schwinn, K.; Jameson, P.; Martin, C.; Davies, K. The molecular basis for venation patterning of pigmentation and its effect on pollinator attraction in flowers of Antirrhinum. New Phytol. 2011, 189, 602–615. [Google Scholar] [CrossRef] [PubMed]
- Martins, T.; Jiang, P.; Rausher, M. How petals change their spots: Cis-regulatory re-wiring in Clarkia (Onagraceae). New Phytol. 2016. [Google Scholar] [CrossRef] [PubMed]
- Hsu, C.; Chen, Y.; Tsai, W.; Chen, W.; Chen, H. Three R2R3-MYB transcription factors regulate distinct floral pigmentation patterning in Phalaenopsis spp. Plant Physiol. 2015, 168, 175–191. [Google Scholar] [CrossRef] [PubMed]
- Bennett, M.D.; Leitch, I.J. Nuclear DNA amounts in angiosperms: Targets, trends and tomorrow. Ann. Bot. 2011, 107, 467–590. [Google Scholar] [CrossRef] [PubMed]
- Shi, Q.; Zhou, L.; Li, K.; Wang, Y. Isolation and expression of PlbHLH3 transcription factor genes in Paeonia lutea. J. For. Res. 2015, 28, 488–496. [Google Scholar]
- Shi, Q.; Zhou, L.; Wang, Y.; Li, K.; Zheng, B.Q.; Miao, K. Transcriptomic analysis of Paeonia delavayi wild population flowers to identify differently expressed genes involved in purple-red and yellow petal pigmentation. PLoS ONE 2015, 10, e0135038. [Google Scholar]
- Shi, Q.; Zhou, L.; Wang, Y.; Zhai, L.J.; Li, L. Isolation and expression of PlWDR3 and PlWDR18 transcription factor genes in Paeonia lutea. J. Northwest For. Univ. 2017, 32, 1–5. [Google Scholar]
- Shi, Q.; Zhou, L.; Wang, Y. Isolation and expression analysis of GST gene encoding glutathione S-transferase of Paeonia delavayi Var.lutea whild population in Yunnan. Sci. Silvae Sin. 2014, 12, 63–71. [Google Scholar]
- Zhao, D.; Tang, W.; Hao, Z.; Tao, J. Identification offlavonoids and expression offlavonoid biosynthetic genes in two coloured tree peony flowers. Biochem. Biophys. Res. Commun. 2015, 459, 450–456. [Google Scholar] [CrossRef] [PubMed]
- Zhou, L.; Wang, Y.; Peng, Z. Molecular characterization and expression analysis of chalcone synthase gene during flower development in tree peony (Paeonia suffruticosa). Afr. J. Biotechnol. 2011, 10, 1275–1284. [Google Scholar]
- Zhou, L.; Wang, Y.; Ren, L.; Shi, Q.Q.; Zheng, B.Q.; Miao, K. Overexpression of Ps-CHI1, a homologue of the chalcone isomerase gene from tree peony (Paeonia suffruticosa), reduces the intensity of flower pigmentation in transgenic tobacco. Plant Cell Tissue Organ Cult. 2014, 16, 285–295. [Google Scholar] [CrossRef]
- Xu, W.; Dubos, C.; Lepiniec, L. Transcriptional control of flavonoid biosynthesis by MYB-bHLH-WDR complexes. Trends Plant Sci. 2015, 20, 176–185. [Google Scholar] [CrossRef] [PubMed]
- Qi, Y.; Lou, Q.; Li, H.; Yue, J.; Liu, Y.; Wang, Y. Anatomical and biochemical studies of bicolor flower development in Muscari latifolium. Protoplasma 2013, 250, 1273–1281. [Google Scholar] [CrossRef] [PubMed]
- Shoji, K.; Miki, N.; Nakajima, N.; Momonoi, K.; Kato, C.; Yoshida, K. Perianth bottom-specific blue color development in Tulip cv. murasak-izuisho requires ferricions. Plant Cell Physiol. 2007, 48, 243–251. [Google Scholar] [CrossRef] [PubMed]
- Yoshida, K.; Kitahara, S.; Ito, D.; Kondo, T. Ferricions involved in the flower color development of the himalayan blue poppy Meconopsis grandis. Phytochemistry 2006, 67, 992–998. [Google Scholar] [CrossRef] [PubMed]
- Yoshida, K.; Miki, N.; Momonoi, K.; Kawachi, M.; Katou, K.; Okazaki, Y.; Uozumi, N.; Maershima, M.; Kondo, T. Synchrony between flower opening and petal-color change from red to blue in morning glory Ipomoea tricolor cv. Heavenly blue. Proc. Jpn. Acad. Ser. B Phys. Biol. Sci. 2009, 85, 187–197. [Google Scholar] [CrossRef] [PubMed]
- Yoshida, K.; Kondo, T.; Okazaki, Y.; Katou, K. Cause of blue petal colour. Nature 1995, 373, 291. [Google Scholar] [CrossRef]
- Vignolini, S.; Moyroud, E.; Hingant, T.; Banks, H.; Rudall, P.J.; Steiner, U. The flower of Hibiscus trionum is both visibly and measurably iridescent. New Phytol. 2015, 05, 97–101. [Google Scholar] [CrossRef] [PubMed]
- Noda, K.; Glover, B.J.; Linstead, P.; Martin, C. Flower colour intensitydepends on specialized cell shape controlled by a Myb-related transcription factor. Nature 1994, 369, 661–664. [Google Scholar] [CrossRef] [PubMed]
- Mueller, L.A.; Goodman, C.D.; Silady, R.A.; Walbot, V. AN9, a petunia glutathione S-transferase required for anthocyanin sequestration, is a flavonoid-binding protein. Plant Physiol. 2000, 123, 1561–1570. [Google Scholar] [CrossRef] [PubMed]
- Alexandra, C.; Nik, K.; Brian, B.; Samantha, S.; Andres, B.R.; Takashi, U.; Kevin, W.E.; Rrich, G.; Marisa, S.O. Anthocyanin vacuolar inclusions form by a microautophagy mechanism. Plant Cell 2015, 27, 2545–2559. [Google Scholar]
- Yamagishi, M.; Toda, S.; Tasaki, K. The novel allele of the LhMYB12 gene is involved in splatter-type spot formation on the flower tepals of Asiatic hybrid lilies (Lilium spp.). New Phytol. 2014, 201, 1009–1020. [Google Scholar] [CrossRef] [PubMed]
- Paz-Ares, J.; Ghosal, D.; Wienand, U.; Peterson, P.A.; Saedler, H. The regulatory c1 locus of Zea mays encodes a protein with homology to myb proto-oncogene products and with structural similarities to transcriptional activators. EMBO J. 1987, 6, 3553–3558. [Google Scholar] [PubMed]
- Lepiniec, L.; Debeaujon, I.; Routaboul, J.M.; Baudry, A.; Pourcel, L.; Nesi, N.; Caboche, M. Genetics and biochemistry of seed flavonoids. Annu. Rev. Plant. Biol. 2006, 57, 405–430. [Google Scholar] [CrossRef] [PubMed]
- Hu, S.Y. The tour of a botanist in China. Arnoldia 1976, 35, 264–295. [Google Scholar]
- Hashimoto, F.; Tanaka, M.; Maeda, H.; Shimizu, K.; Sakata, Y. Characterization of cyanic flower color of Delphinium cultivars. J. Jpn. Soc. Hort. Sci. 2000, 69, 428–434. [Google Scholar] [CrossRef]
- Grabherr, M.G.; Haas, B.J.; Yassour, M.; Levin, J.Z.; Thompson, D.A.; Amit, I. Full-length transcriptome assembly from RNA-Seq data without a reference genome. Nat. Biotechnol. 2011, 29, 644–652. [Google Scholar] [CrossRef] [PubMed]
- Trapnell, C.; Williams, B.A.; Pertea, G.; Mortazavi, A.; Kwan, G.; Van, B.M.J. Transcript assembly and quantification by RNA-Seq reveals unannotated transcripts and isoform switching during cell differentiation. Nat. Biotechnol. 2010, 28, 511–515. [Google Scholar] [CrossRef] [PubMed]
- Langfelder, P.; Horvath, S. WGCNA: An R package for weighted correlation network analysis. BMC Bioinform. 2008, 9, 559. [Google Scholar] [CrossRef] [PubMed]
- Miller, J.A.; Horvath, S.; Geschwind, D.H. Divergence of human and mouse brain transcriptome highlights Alzheimer disease pathways. Proc. Natl. Acad. Sci. USA 2010, 107, 12698–12703. [Google Scholar] [CrossRef] [PubMed]
- Zheng, Z.L.; Zhao, Y.H. Transcriptome comparison and gene coexpression network analysis provide a systems view of citrus response to ‘Candidatus Liberibacter asiaticus’ infection. BMC Genom. 2013, 14, 27. [Google Scholar] [CrossRef] [PubMed]
- Shannon, P.; Markiel, A.; Ozier, O.; Baliga, N.S.; Wang, J.T.; Ramage, D.; Amin, N.; Schwikowski, B.; Ideker, T. Cytoscape: A Software Environment for Integrated Models of Biomolecular Interaction Networks. Genome Res. 2013, 13, 2498–2504. [Google Scholar] [CrossRef] [PubMed]


| Materials | Parts | Color Scheme | CIE L* a* b* Color Coordinates | TA b | TF b | CI b | |||
|---|---|---|---|---|---|---|---|---|---|
| L* a | a* a | b* a | C* a | ||||||
| PO c | B d | White | 77.51 ± 0.988 | −8.18 ± 0.933 | 6.45 ± 1.001 | 10.25 ± 0.114 | 0 | 44.41 ± 1.002 | ∞ |
| PR c | V d | Dark purple | 19.37 ± 0.546 | −1.35 ± 0.221 | 0.96 ± 0.116 | 1.65 ± 0.065 | 43.9 ± 0.532 | 16.36 ± 0.423 | 0.37 |
| B | White | 81.2 ± 0.541 | −9 ± 0.311 | 7.8 ± 0.135 | 11.91 ± 0.214 | 0 | 31.66 ± 0.358 | ∞ | |
| RO c | V | Purple-red | 33.53 ± 0.621 | 35.03 ± 0.081 | −7.1 ± 0.952 | 35.75 ± 1.021 | 8.36 ± 0.975 | 12.83 ± 0.896 | 1.53 |
| B | White | 82.84 ± 0.465 | −9.68 ± 0.389 | 8.76 ± 0.552 | 13.17 ± 0.485 | 0 | 28.86 ± 0.493 | ∞ | |
| Materials | Cy3G5G a (mg/g) | Cy3G a (mg/g) | Pn3G5G a (mg/g) | Pn3G a (mg/g) |
|---|---|---|---|---|
| Variegation of PR | 6.51 ± 0.050 | 28.36 ± 0.063 | 5.21 ± 0.115 | 3.82 ± 0.125 |
| Variegation of RO | 2.51 ± 0.011 | 0.72 ± 0.024 | 4.27 ± 0.046 | 0.87 ± 0.098 |
| Compound (mg/g) | B b of PO | V b of PR | B of PR | V of RO | B of RO |
|---|---|---|---|---|---|
| Qu a 3,7-di-O-glucoside | - | 0.95 ± 0.021 | - | 1.16 ± 0.035 | 2.39 ± 0.039 |
| Km a 3,7-di-O-glucoside | 8.51 ± 0.110 | 2.25 ± 0.034 | 5.52 ± 0.10 | 1.38 ± 0.031 | 4.33 ± 0.097 |
| Is a 3,7-di-O-glucoside | 12.11 ± 0.089 | 1.69 ± 0.037 | 0.0 ± 0.012 | 3.41 ± 0.055 | 4.54 ± 0.072 |
| Qu a 3-O-glucoside | - | 2.16 ± 0.036 | - | 2.1 ± 0.026 | 0.31 ± 0.011 |
| Lu a 7-O-glucoside | 0.05 ± 0.008 | 3.08 ± 0.010 | 0.24 ± 0.009 | 2.42 ± 0.085 | 6.01 ± 0.154 |
| Ap a 7-O-glucoside | 9.34 ± 0.132 | 3.64 ± 0.062 | 15.01 ± 0.135 | 0.35 ± 0.065 | 4.18 ± 0.426 |
| Is a 3-O-glucoside | 3.45 ± 0.054 | 1.01 ± 0.055 | - | 1.26 ± 0.058 | 0.14 ± 0.035 |
| Ap a 7-O-neohesperidoside | 10.95 ± 0.113 | 1.58 ± 0.053 | 10.82 ± 0.110 | 0.75 ± 0.031 | 6.96 ± 0.082 |
© 2017 by the authors. Licensee MDPI, Basel, Switzerland. This article is an open access article distributed under the terms and conditions of the Creative Commons Attribution (CC BY) license (http://creativecommons.org/licenses/by/4.0/).
Share and Cite
Shi, Q.; Li, L.; Zhang, X.; Luo, J.; Li, X.; Zhai, L.; He, L.; Zhang, Y. Biochemical and Comparative Transcriptomic Analyses Identify Candidate Genes Related to Variegation Formation in Paeonia rockii. Molecules 2017, 22, 1364. https://doi.org/10.3390/molecules22081364
Shi Q, Li L, Zhang X, Luo J, Li X, Zhai L, He L, Zhang Y. Biochemical and Comparative Transcriptomic Analyses Identify Candidate Genes Related to Variegation Formation in Paeonia rockii. Molecules. 2017; 22(8):1364. https://doi.org/10.3390/molecules22081364
Chicago/Turabian StyleShi, Qianqian, Long Li, Xiaoxiao Zhang, Jianrang Luo, Xiang Li, Lijuan Zhai, Lixia He, and Yanlong Zhang. 2017. "Biochemical and Comparative Transcriptomic Analyses Identify Candidate Genes Related to Variegation Formation in Paeonia rockii" Molecules 22, no. 8: 1364. https://doi.org/10.3390/molecules22081364
APA StyleShi, Q., Li, L., Zhang, X., Luo, J., Li, X., Zhai, L., He, L., & Zhang, Y. (2017). Biochemical and Comparative Transcriptomic Analyses Identify Candidate Genes Related to Variegation Formation in Paeonia rockii. Molecules, 22(8), 1364. https://doi.org/10.3390/molecules22081364