Anticarcinogenic Effect of Spices Due to Phenolic and Flavonoid Compounds—In Vitro Evaluation on Prostate Cells

 ,
, 

Abstract
:
1. Introduction
2. Results and Discussion
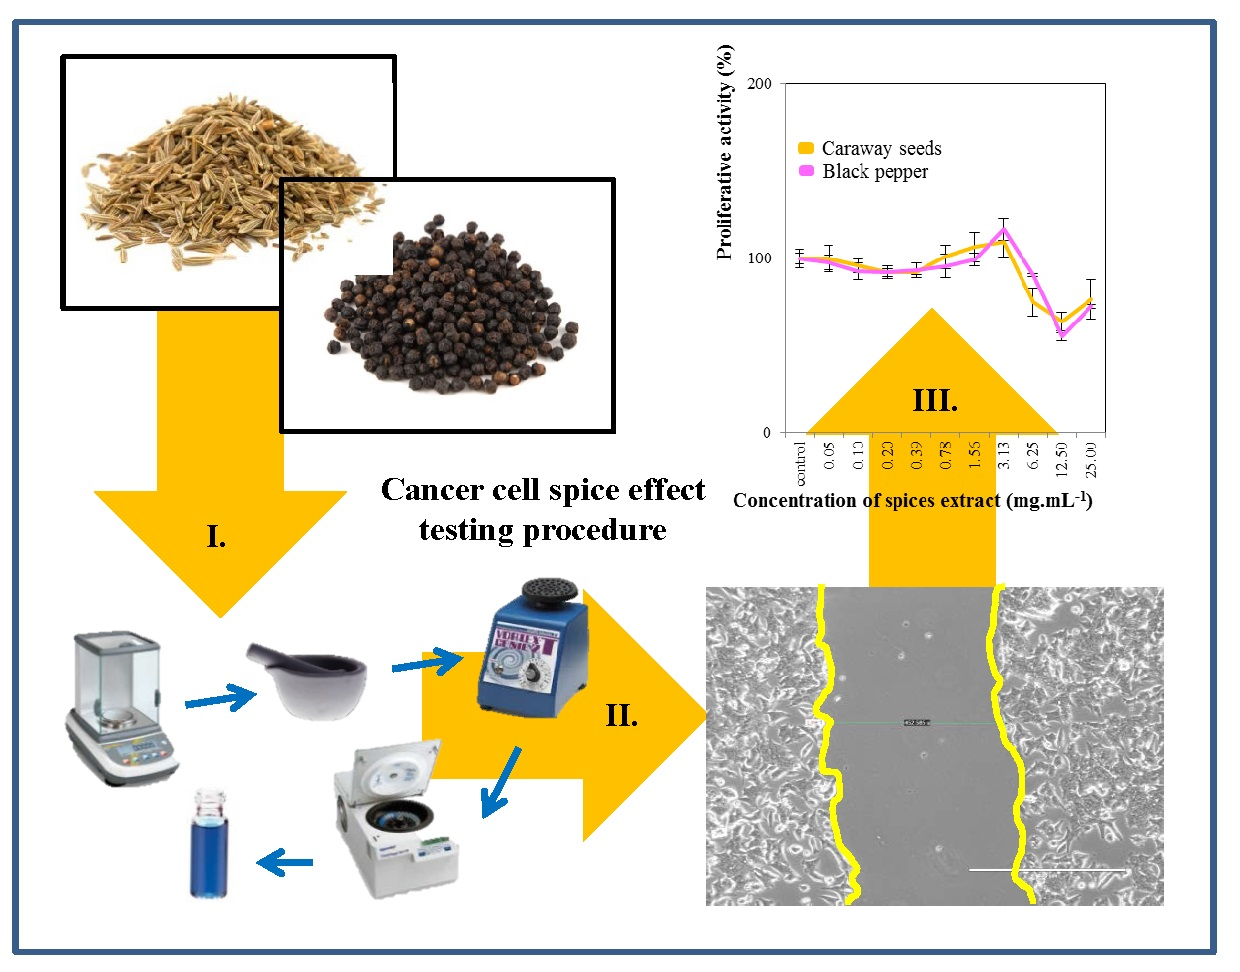
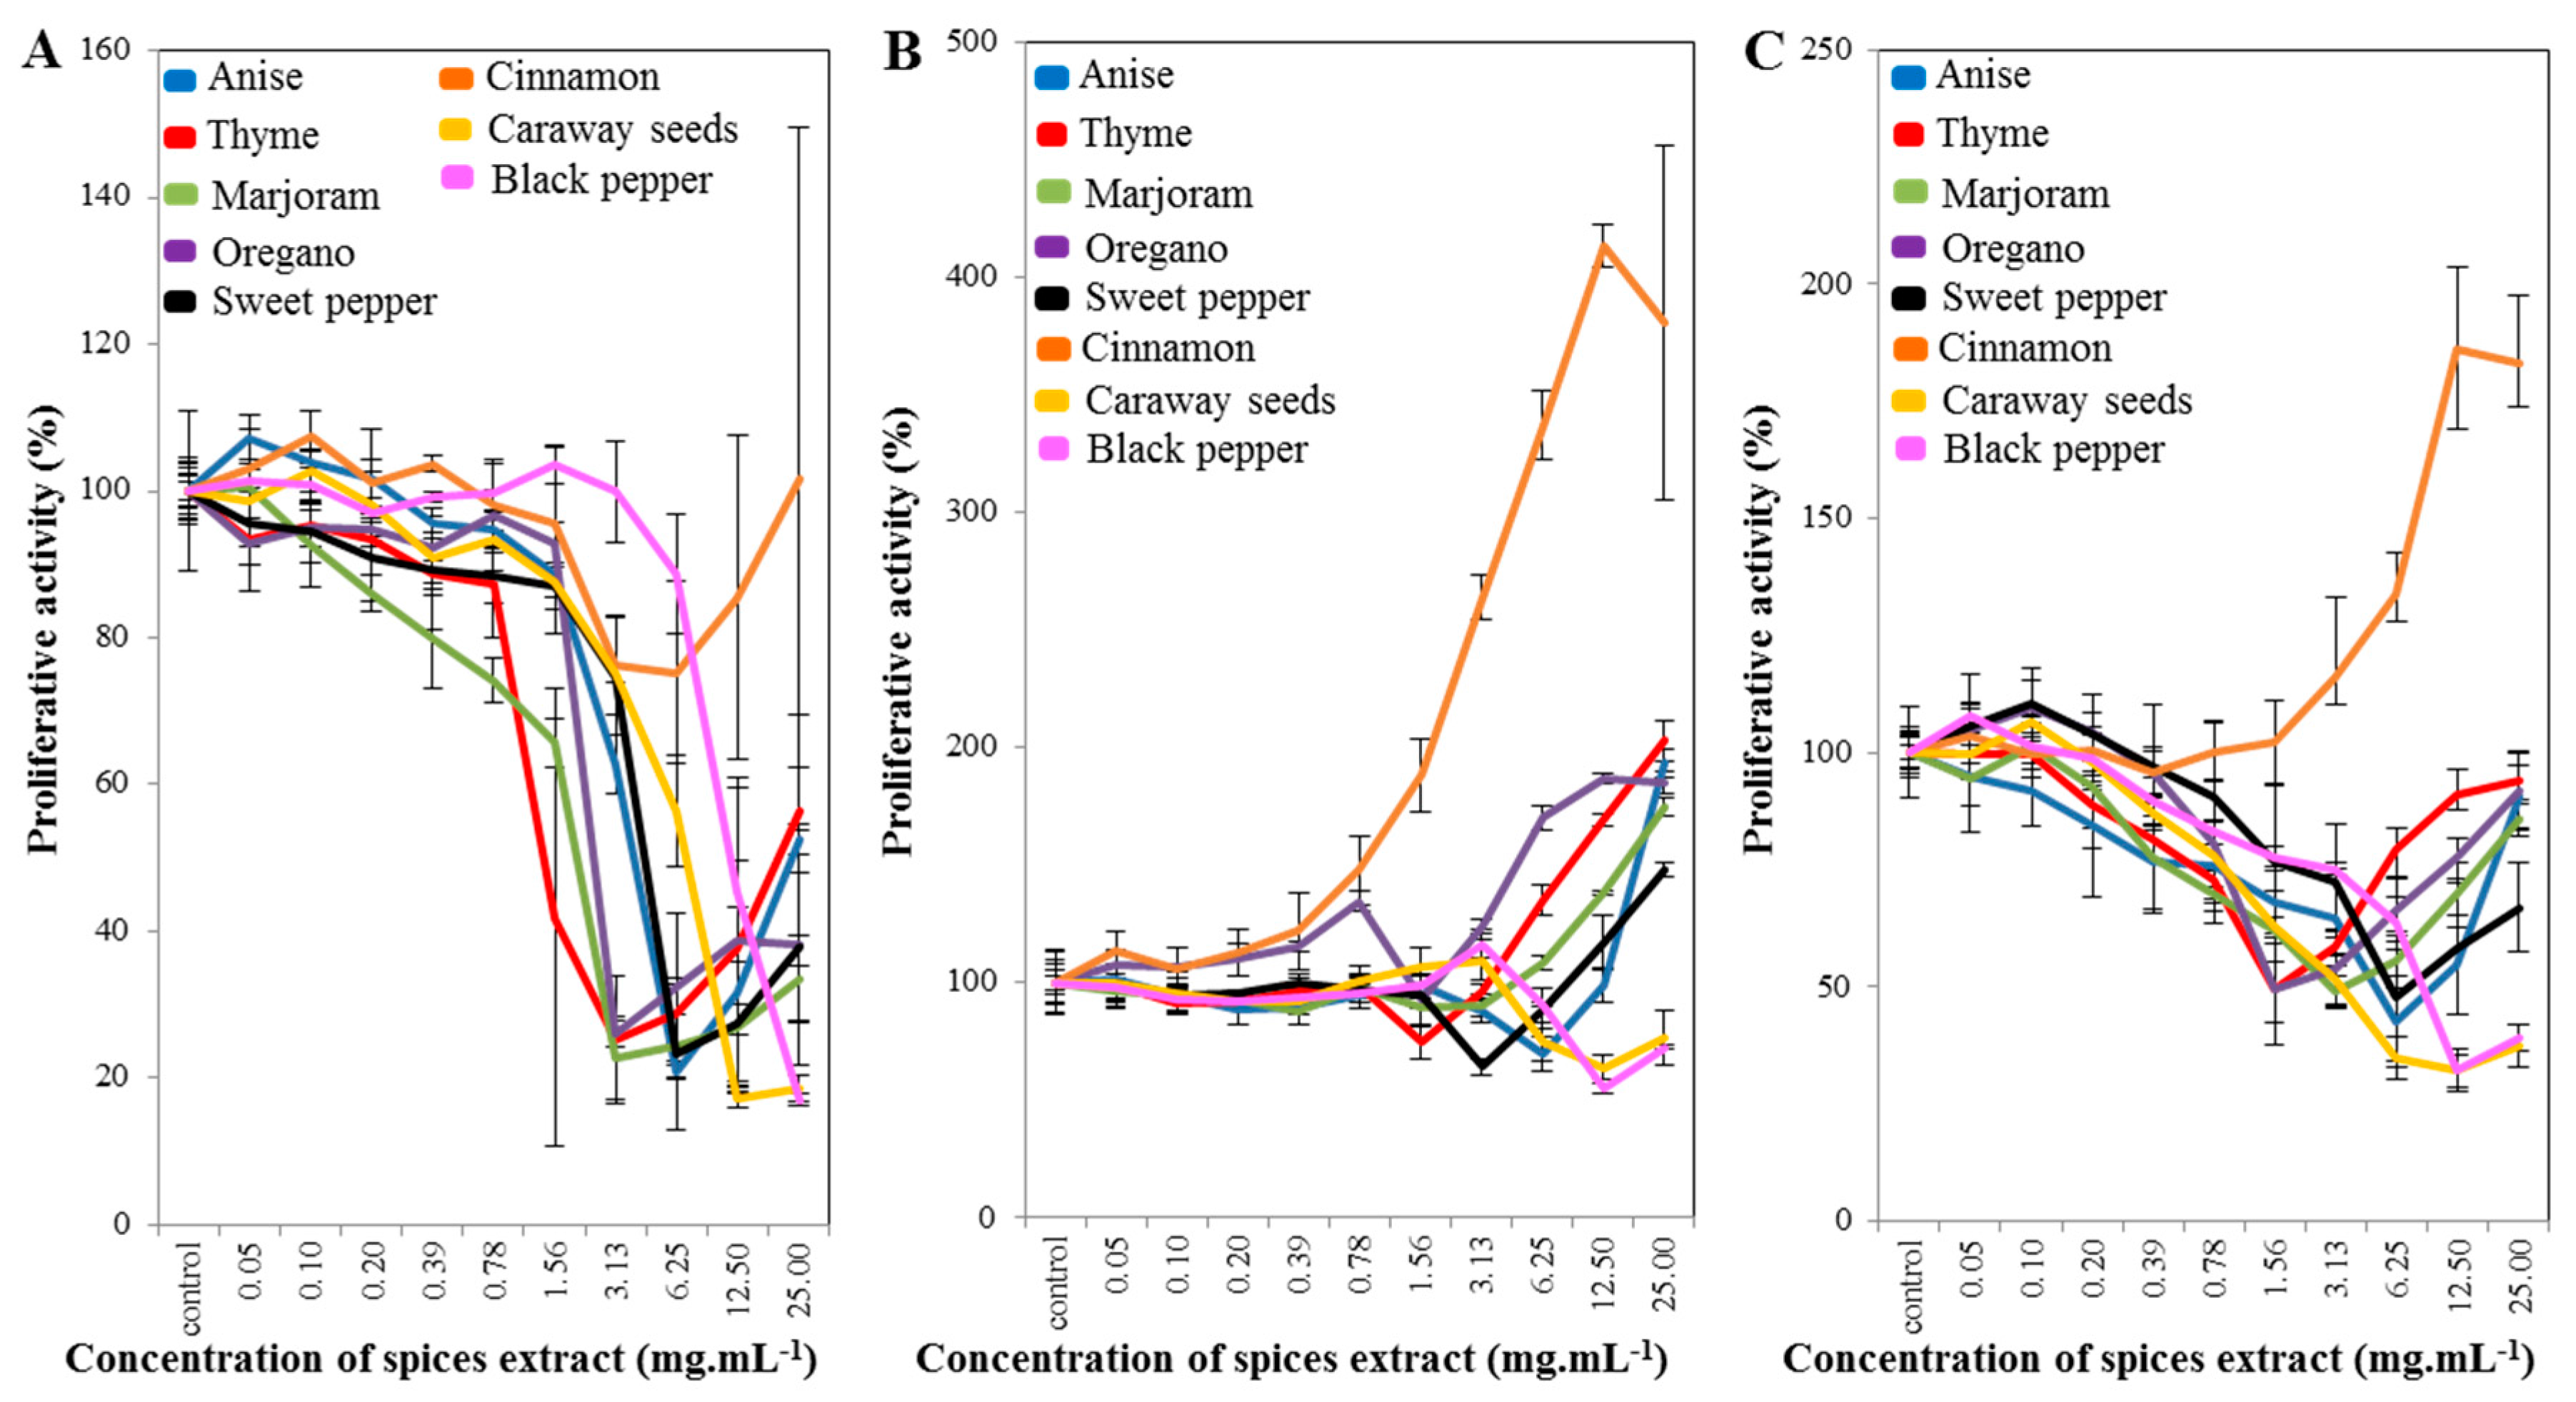
2.1. Cell-Line Proliferative Activity Testing (MTT Assay) for Extract from Eight Spices
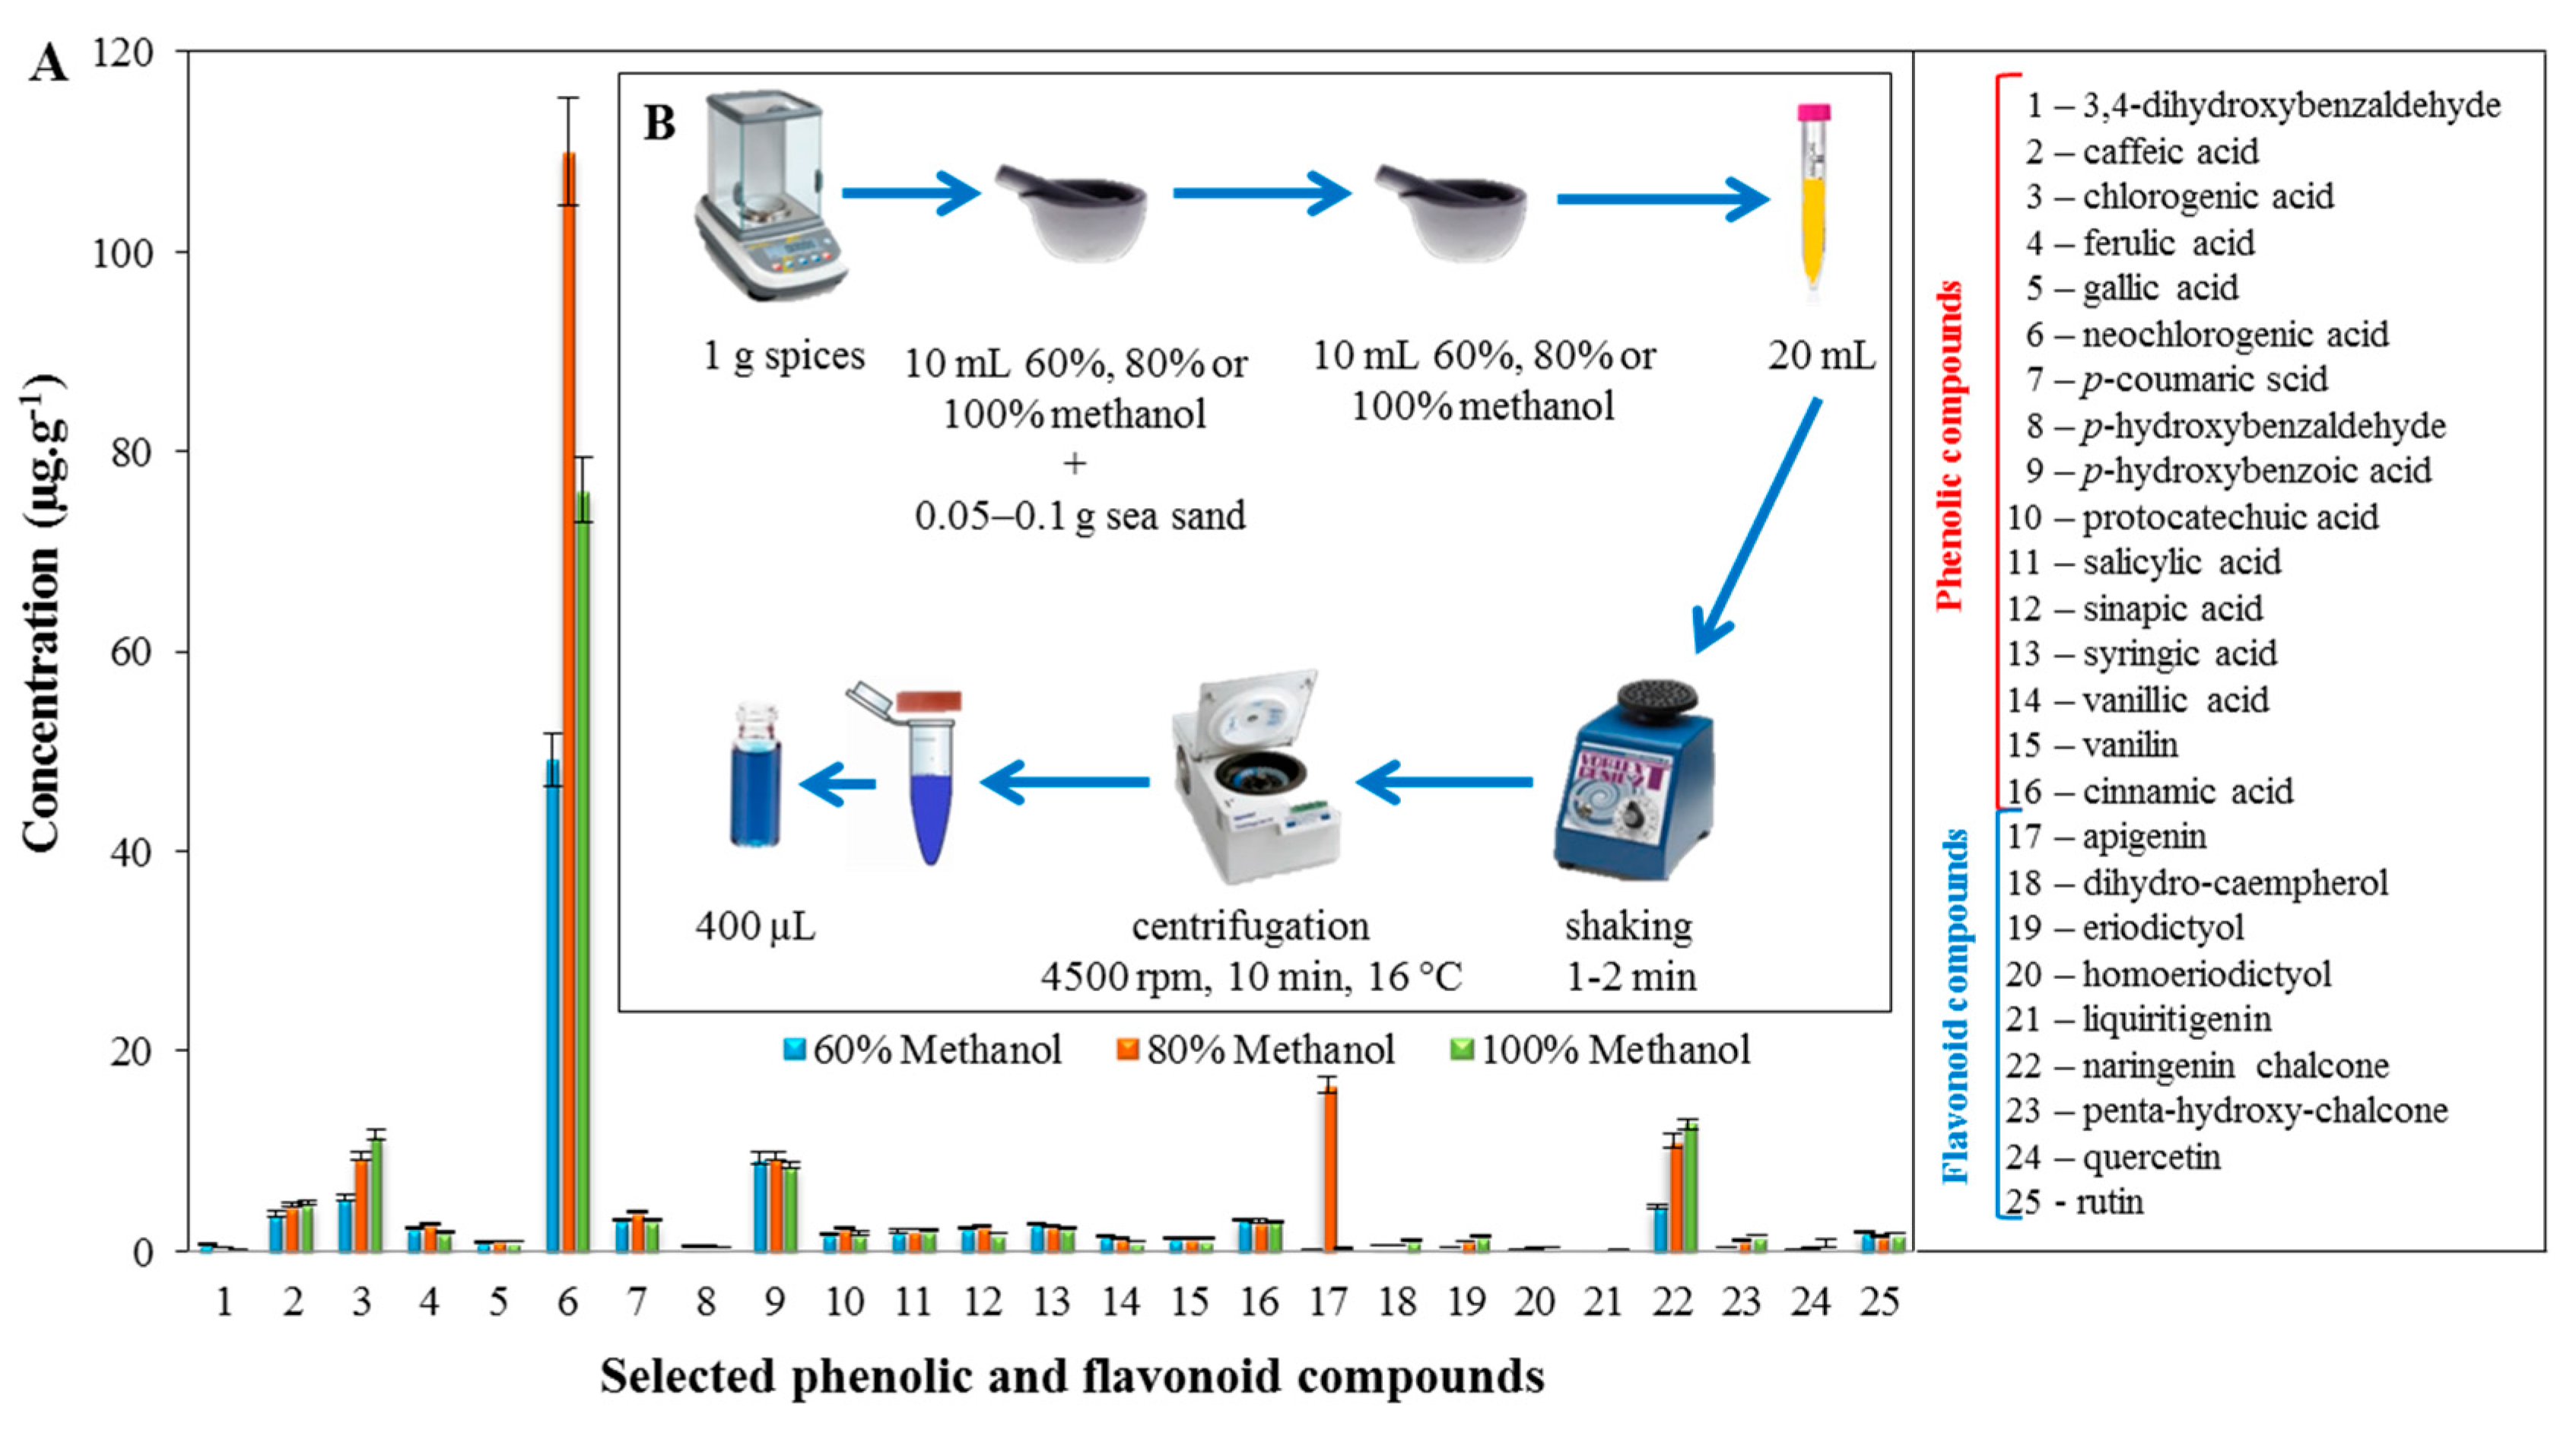
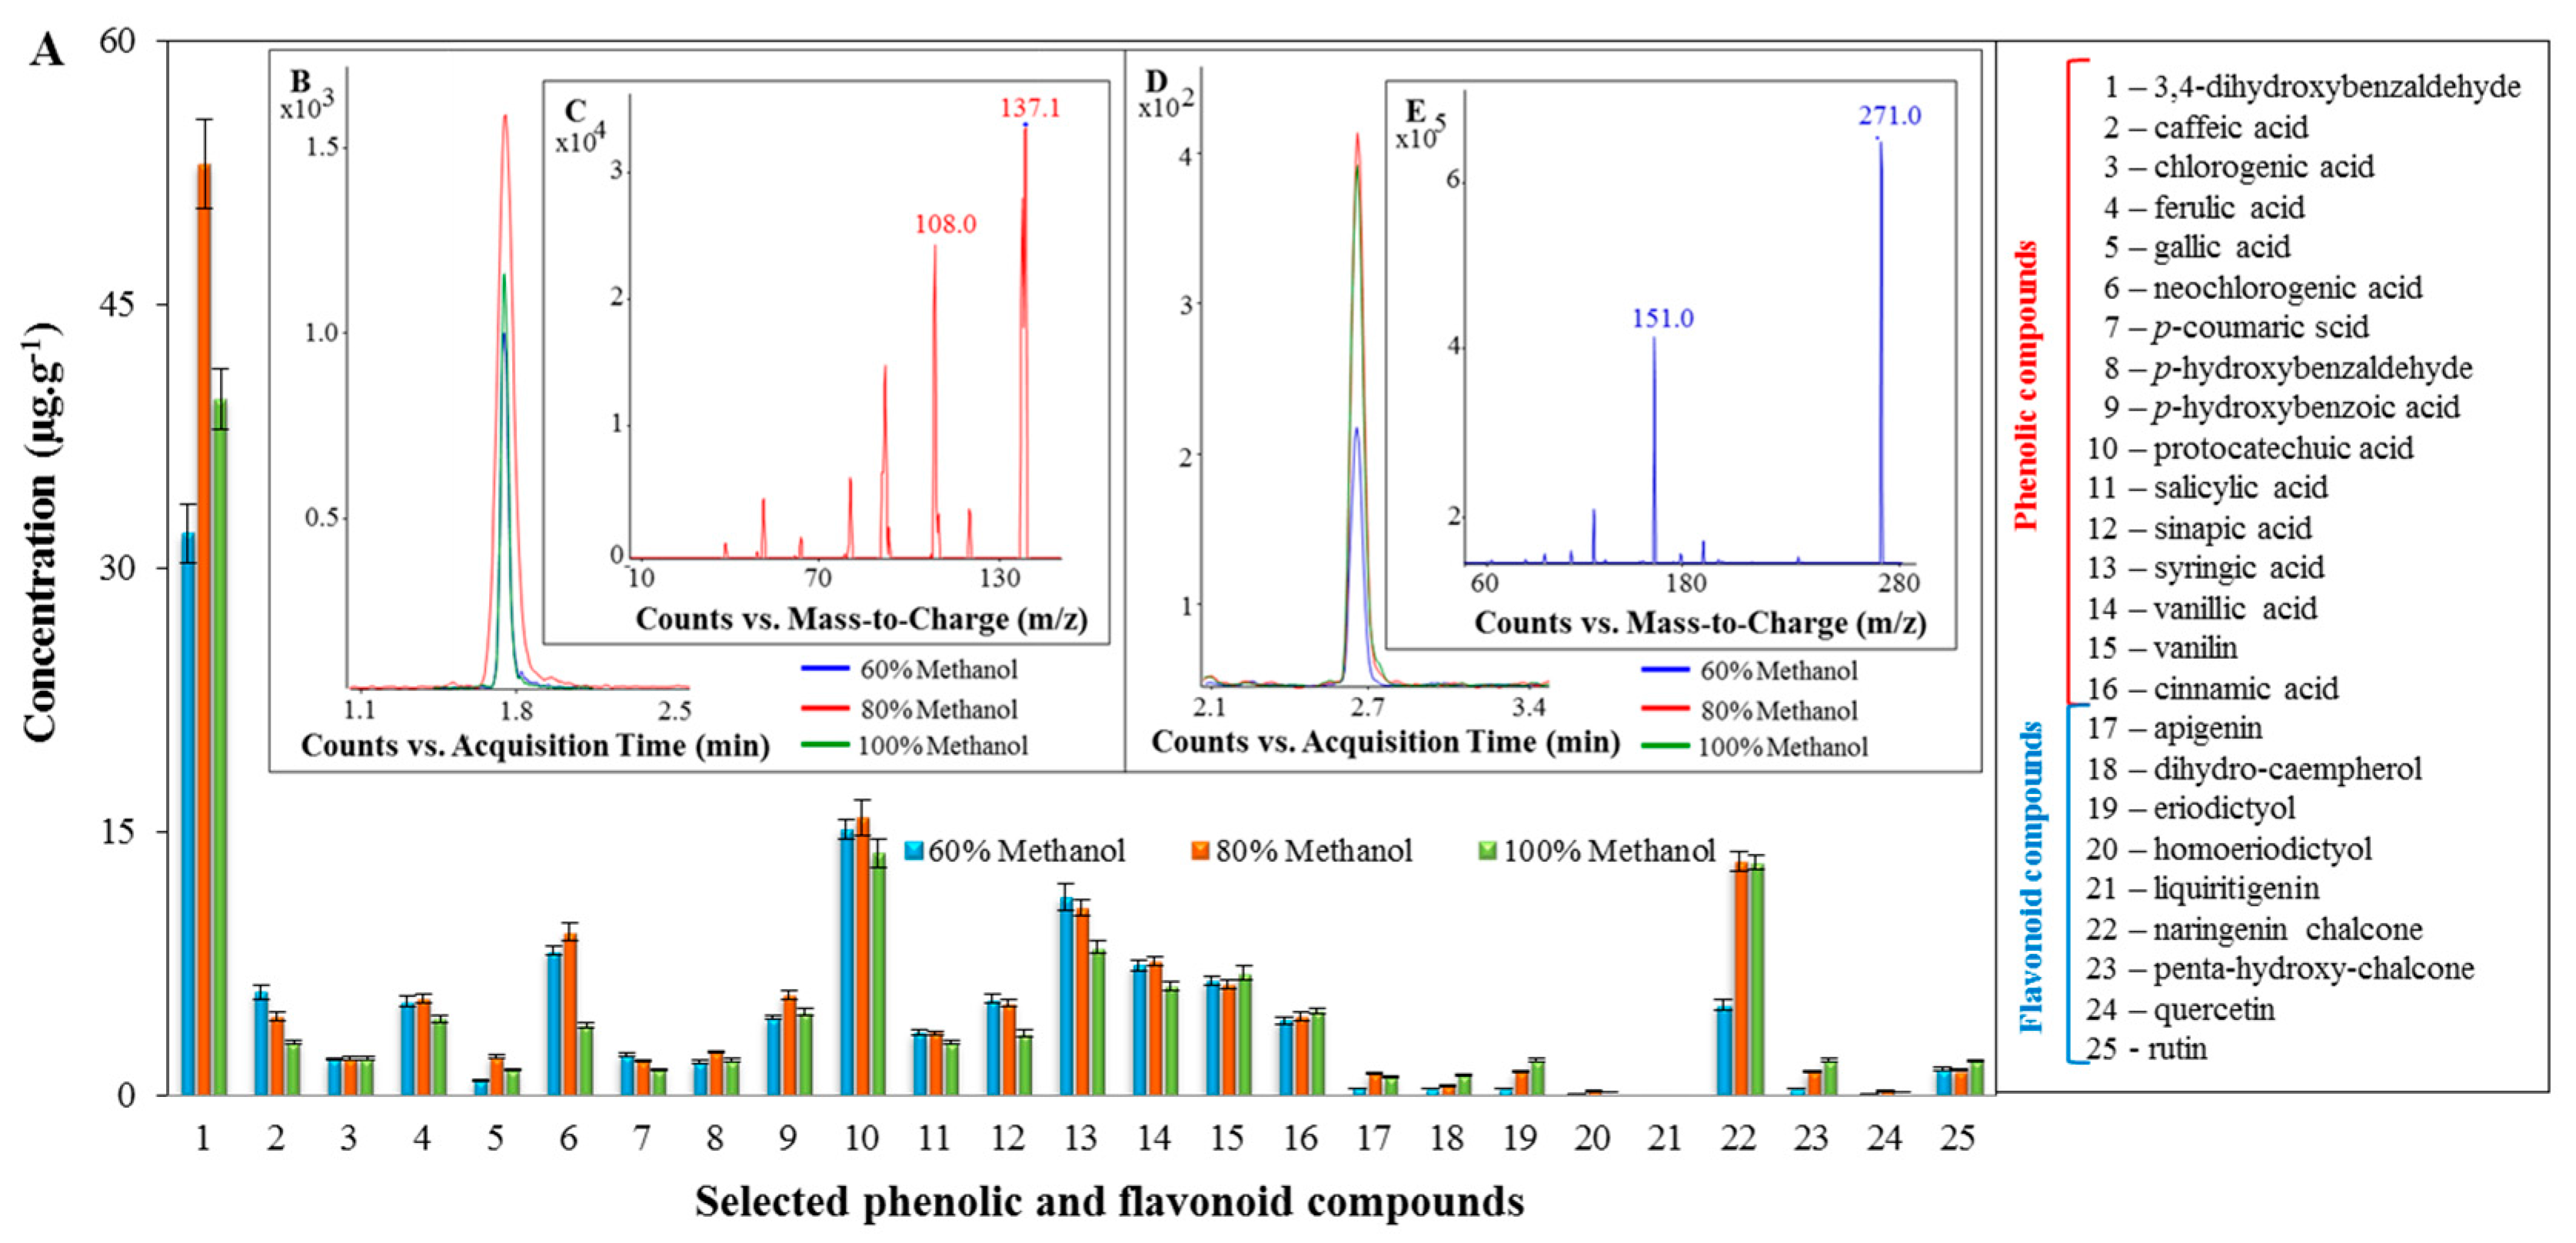
2.2. Profiling of the Extracts of the Tested Spices Using LC/MS
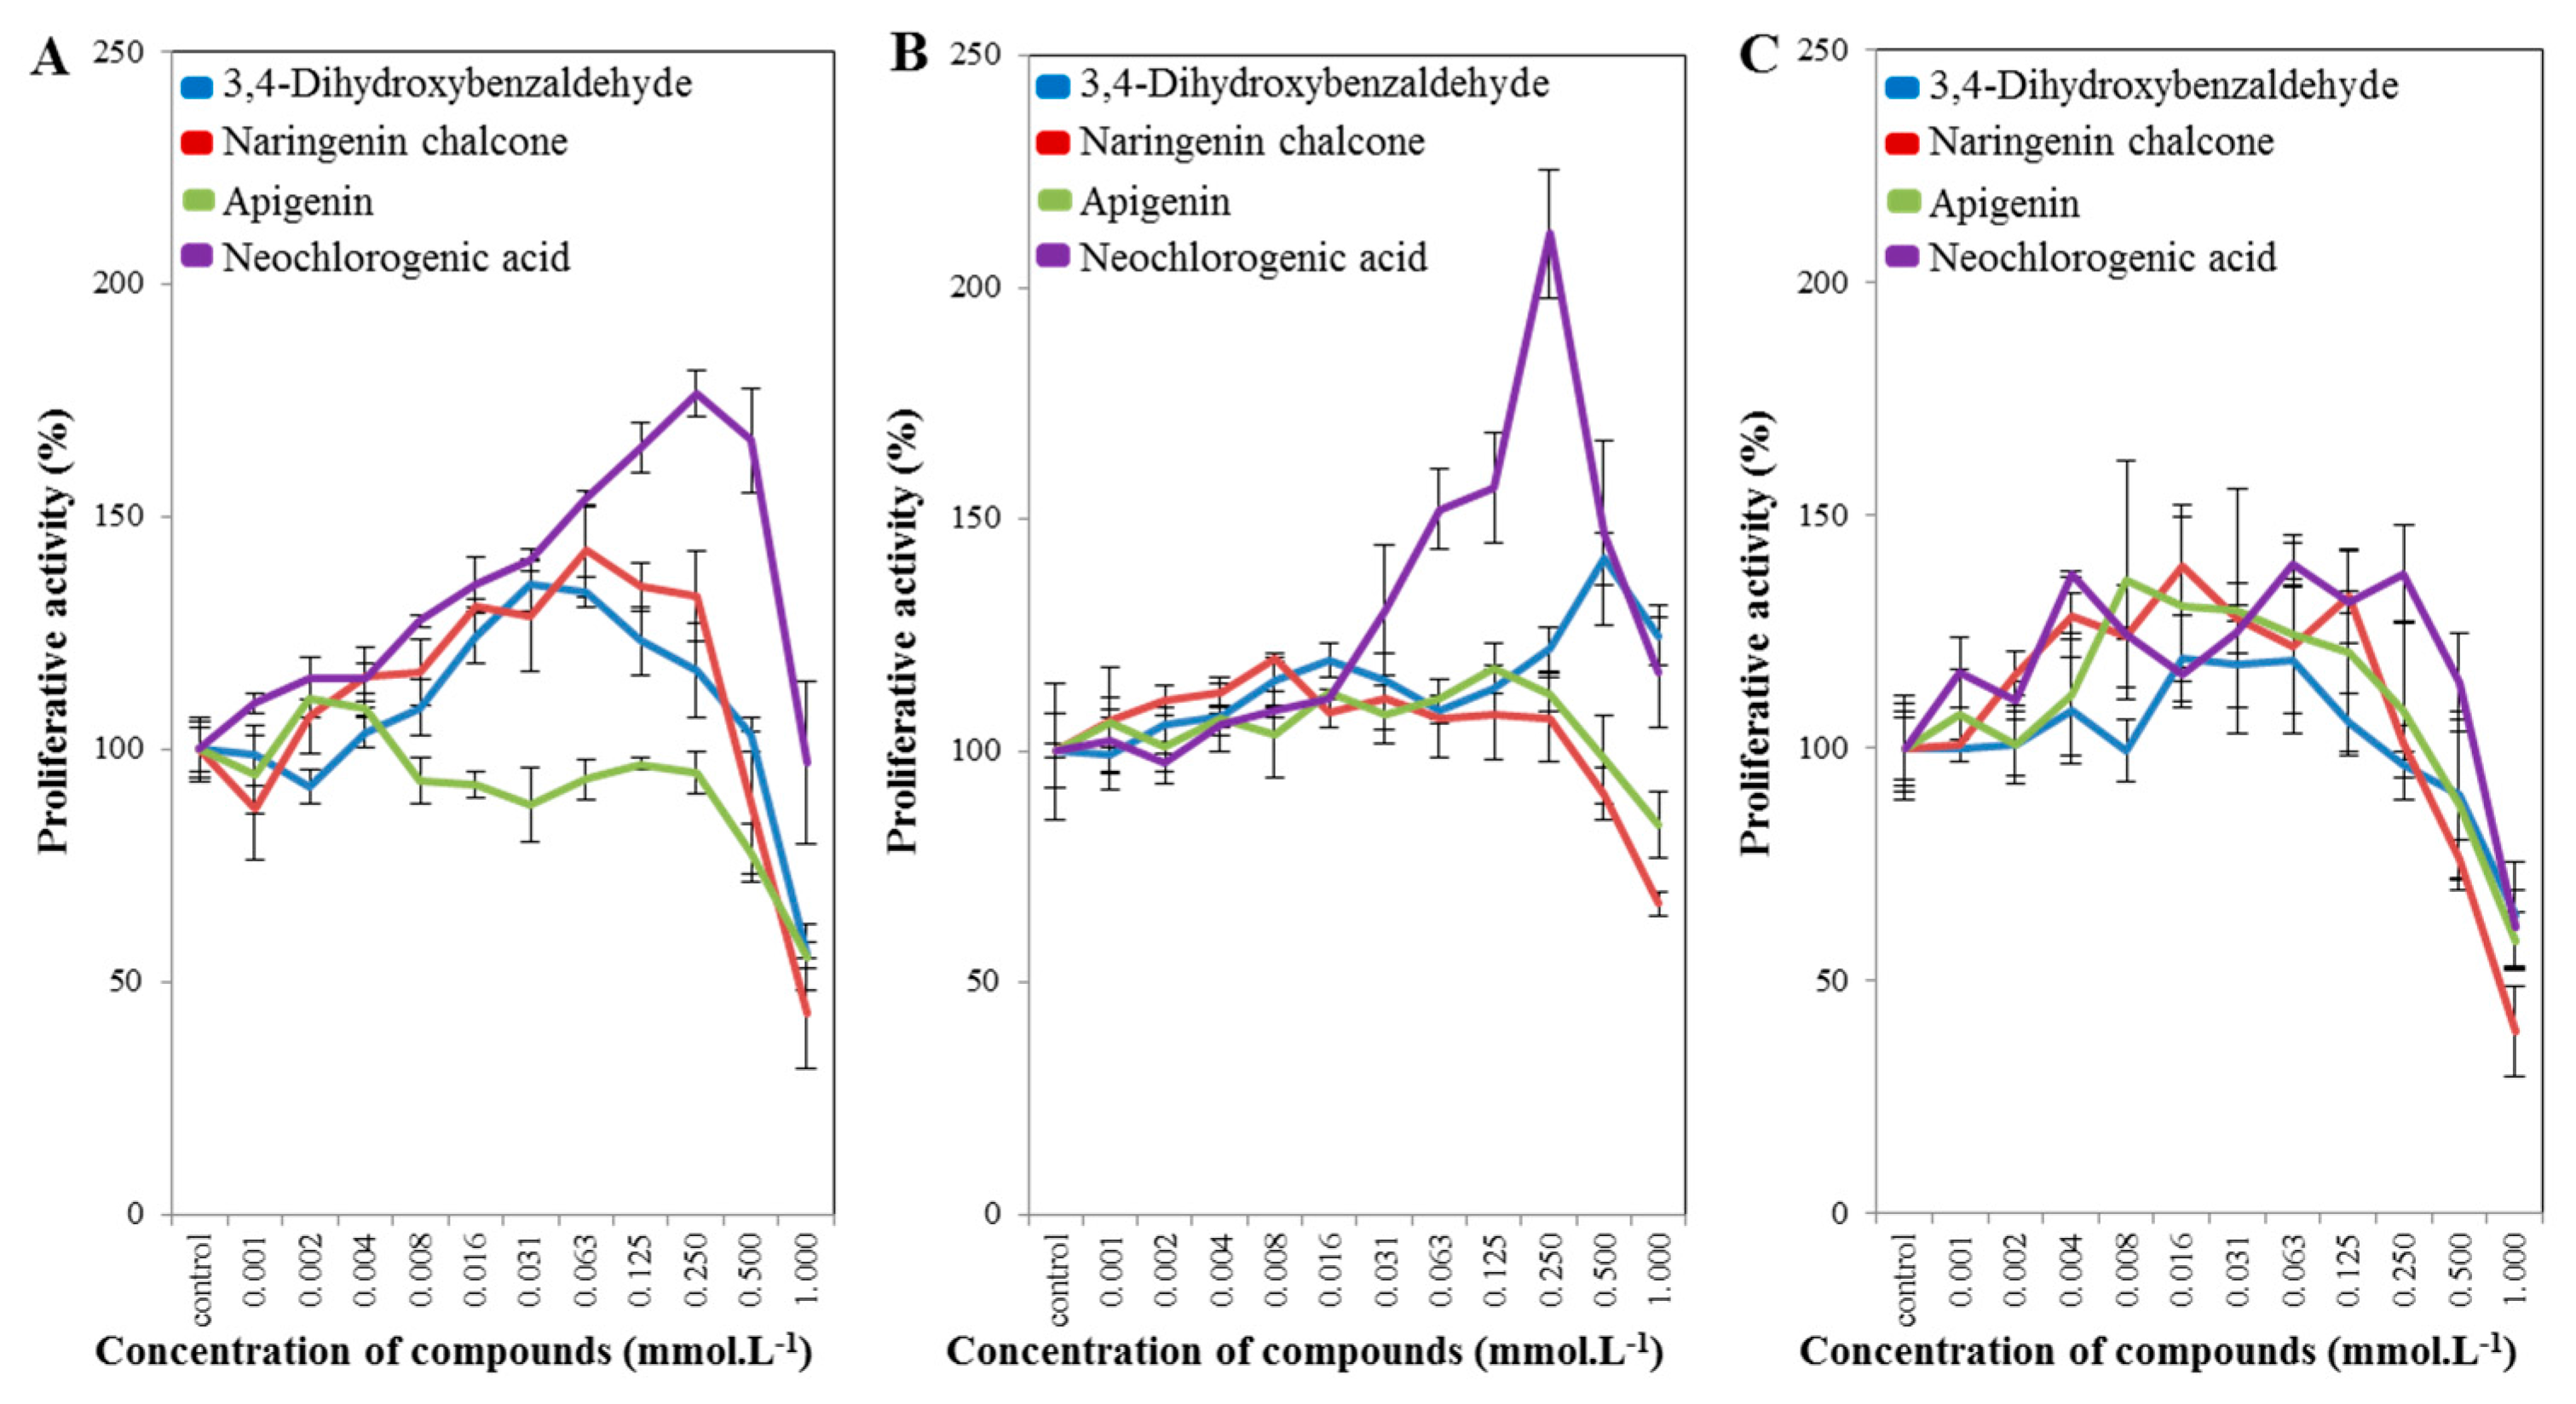
2.3. Cell-Line Proliferative Activity Testing (MTT Assay) for Phenolic and Flavonoid Compounds from Spices
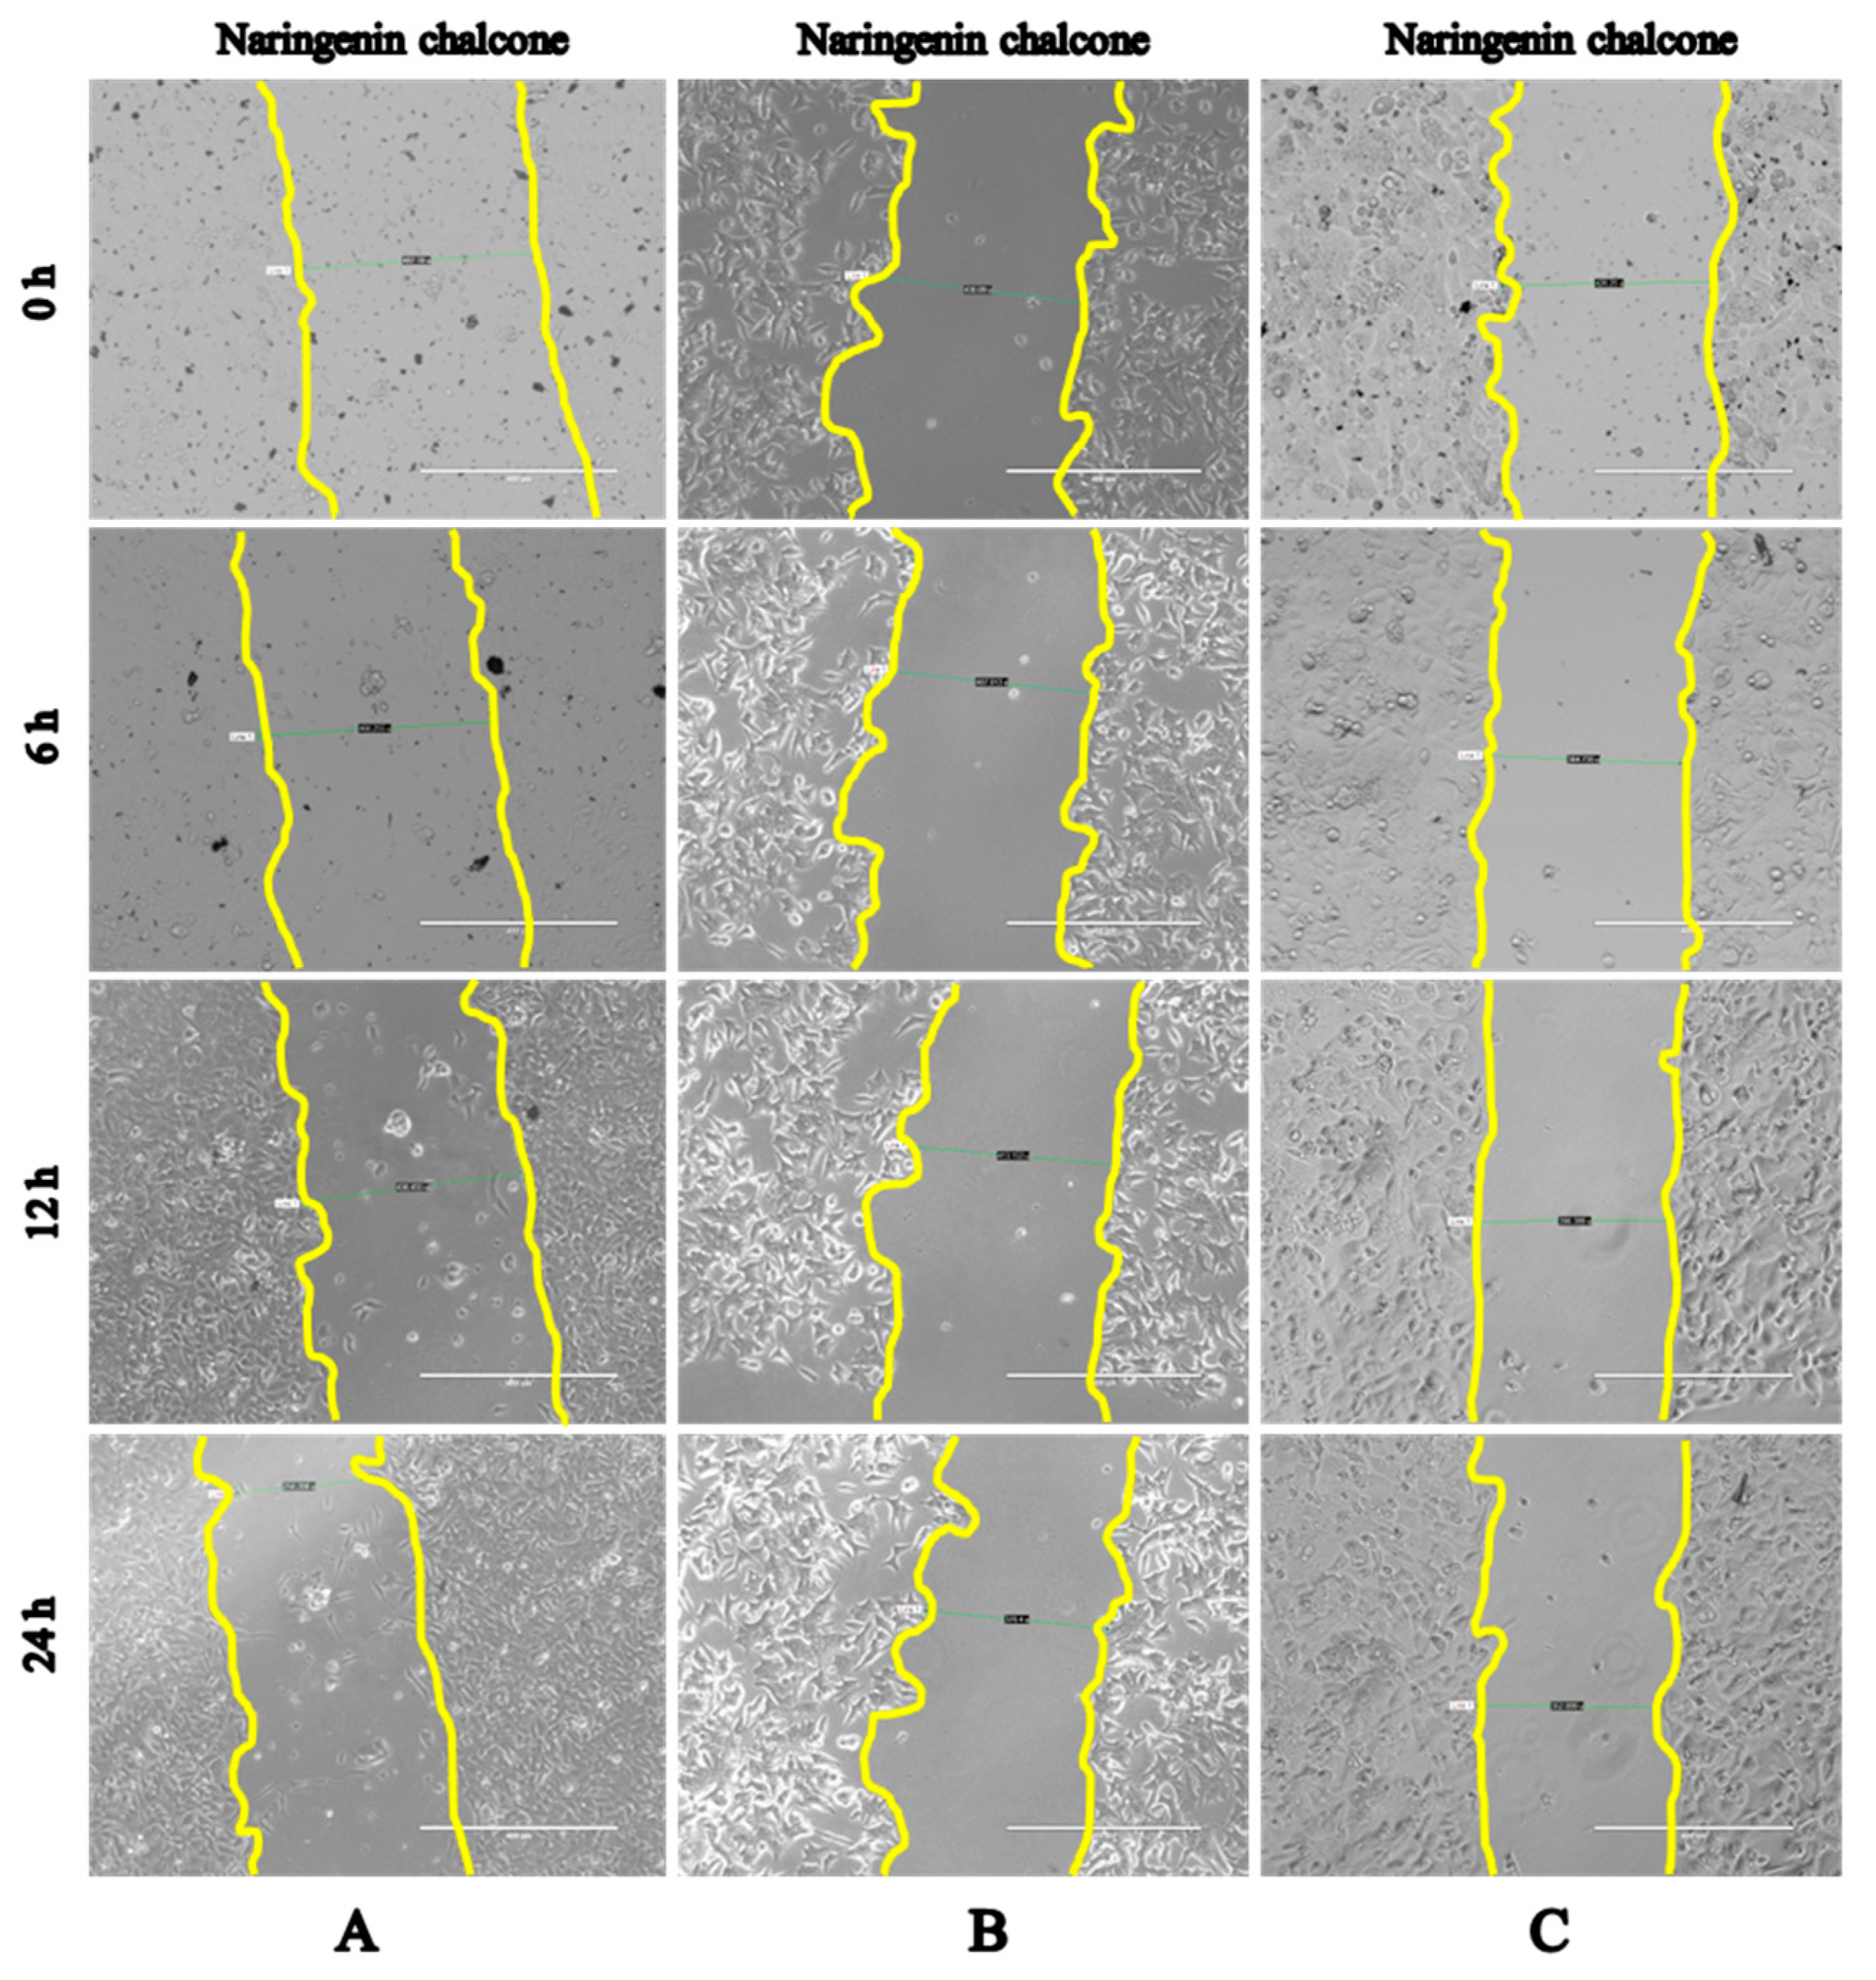
2.4. Wound-Healing Assay (Scratch Test)
3. Materials and Methods
3.1. Chemicals
3.2. Cells
3.3. Preparation of the Spice Samples for Cell-Line Proliferative Activity Testing (MTT Assay)
3.4. Cell-Line Proliferative Activity Testing (MTT Assay)
3.5. Preparation of the Samples of Spices and the Analysis of Spice Extracts Using LC/MS
3.6. Wound-Healing Assay (Scratch Test)
3.7. Clonogenic Assay
4. Conclusions
Supplementary Materials
Acknowledgments
Author Contributions
Conflicts of Interest
References
- Cencic, A.; Chingwaru, W. The role of functional foods, nutraceuticals, and food supplements in intestinal health. Nutrients 2010, 2, 611–625. [Google Scholar] [CrossRef] [PubMed]
- Pandey, K.B.; Rizvi, S.I. Plant polyphenols as dietary antioxidants in human health and disease. Oxidative Med. Cell. Longev. 2009, 2, 270–278. [Google Scholar] [CrossRef] [PubMed]
- Slavin, J.L.; Lloyd, B. Health benefits of fruits and vegetables. Adv. Nutr. 2012, 3, 506–516. [Google Scholar] [CrossRef] [PubMed]
- El Ksibi, I.; Ben Slama, R.; Faidi, K.; Ben Ticha, M.; M’Henni, M.F. Mixture approach for optimizing the recovery of colored phenolics from red pepper (Capsicum annum L.) by-products as potential source of natural dye and assessment of its antimicrobial activity. Ind. Crop. Prod. 2015, 70, 34–40. [Google Scholar] [CrossRef]
- Hertwig, C.; Reineke, K.; Ehlbeck, J.; Knorr, D.; Schluter, O. Decontamination of whole black pepper using different cold atmospheric pressure plasma applications. Food Control 2015, 55, 221–229. [Google Scholar] [CrossRef]
- Mnif, S.; Aifa, S. Cumin (Cuminum cyminum L.) from traditional uses to potential biomedical applications. Chem. Biodivers. 2015, 12, 733–742. [Google Scholar] [CrossRef] [PubMed]
- Shahwar, D.; Ullah, S.; Khan, M.A.; Ahmad, N.; Saeed, A. Anticancer activity of cinnamon tamala leaf constituents towards human ovarian cancer cells. Pak. J. Pharm. Sci. 2015, 28, 969–972. [Google Scholar] [PubMed]
- Ramadan, G.; El-Beih, N.M.; Arafa, N.M.S.; Zahra, M.M. Preventive effects of egyptian sweet marjoram (Origanum majorana L.) leaves on haematological changes and cardiotoxicity in isoproterenol-treated albino rats. Cardiovasc. Toxicol. 2013, 13, 100–109. [Google Scholar] [CrossRef] [PubMed]
- Martucci, J.F.; Gende, L.B.; Neira, L.M.; Ruseckaite, R.A. Oregano and lavender essential oils as antioxidant and antimicrobial additives of biogenic gelatin films. Ind. Crop. Prod. 2015, 71, 205–213. [Google Scholar] [CrossRef]
- Ben-Jabeur, M.; Ghabri, E.; Myriam, M.; Hamada, W. Thyme essential oil as a defense inducer of tomato against gray mold and fusarium wilt. Plant Physiol. Biochem. 2015, 94, 35–40. [Google Scholar] [CrossRef] [PubMed]
- Garcia-Perez, E.; Noratto, G.D.; Garcia-Lara, S.; Gutierrez-Uribe, J.A.; Mertens-Talcott, S.U. Micropropagation effect on the anti-carcinogenic activitiy of polyphenolics from mexican oregano (Poliomintha glabrescens gray) in human colon cancer cells ht-29. Plant Food Hum. Nutr. 2013, 68, 155–162. [Google Scholar] [CrossRef] [PubMed]
- Flora, S.J.S. Structural, chemical and biological aspects of antioxidants for strategies against metal and metalloid exposure. Oxidative Med. Cell. Longev. 2009, 2, 191–206. [Google Scholar] [CrossRef] [PubMed]
- Samykutty, A.; Shetty, A.V.; Dakshinamoorthy, G.; Bartik, M.M.; Johnson, G.L.; Webb, B.; Zheng, G.; Chen, A.X.; Kalyanasundaram, R.S.; Munirathinam, G. Piperine, a bioactive component of pepper spice exerts therapeutic effects on androgen dependent and androgen independent prostate cancer cells. PLoS ONE 2013, 8. [Google Scholar] [CrossRef] [PubMed]
- Surh, Y.J.; Kundu, J.K. Molecular mechanisms of chemoprevention with capsaicinoids from chili peppers. In Vegetables, Whole Grains, and Their Derivatives in Cancer Prevention; Mutanen, M., Pajari, A.M., Eds.; Springer: Dordrecht, The Netherlands, 2011; Volume 2, pp. 123–142. [Google Scholar]
- Wei, X.C.; Du, Z.Y.; Cui, X.X.; Verano, M.; Mo, R.Q.; Tang, Z.K.; Conney, A.H.; Zheng, X.; Zhang, K. Effects of cyclohexanone analogues of curcumin on growth, apoptosis and NF-kappa B activity in PC-3 human prostate cancer cells. Oncol. Lett. 2012, 4, 279–284. [Google Scholar] [PubMed]
- Chendil, D.; Ranga, R.S.; Meigooni, D.; Sathishkumar, S.; Ahmed, M.M. Curcumin confers radiosensitizing effect in prostate cancer cell line PC-3. Oncogene 2004, 23, 1599–1607. [Google Scholar] [CrossRef] [PubMed]
- Nakamura, K.; Yasunaga, Y.; Segawa, T.; Ko, D.J.; Moul, J.W.; Srivastava, S.; Rhim, J.S. Curcumin down-regulates ar gene expression and activation in prostate cancer cell lines. Int. J. Oncol. 2002, 21, 825–830. [Google Scholar] [CrossRef] [PubMed]
- Ouyang, D.Y.; Zeng, L.H.; Pan, H.; Xu, L.H.; Wang, Y.; Liu, K.P.; He, X.H. Piperine inhibits the proliferation of human prostate cancer cells via induction of cell cycle arrest and autophagy. Food Chem. Toxicol. 2013, 60, 424–430. [Google Scholar] [CrossRef] [PubMed]
- Al Dhaheri, Y.; Eid, A.; AbuQamar, S.; Attoub, S.; Khasawneh, M.; Aiche, G.; Hisaindee, S.; Iratni, R. Mitotic arrest and apoptosis in breast cancer cells induced by origanum majorana extract: Upregulation of TNF-α and downregulation of survivin and mutant p53. PLoS ONE 2013, 8, 1–14. [Google Scholar] [CrossRef] [PubMed]
- Abdel-Massih, R.M.; Fares, R.; Bazzi, S.; El-Chami, N.; Baydoun, E. The apoptotic and anti-proliferative activity of origanum majorana extracts on human leukemic cell line. Leuk. Res. 2010, 34, 1052–1056. [Google Scholar] [CrossRef] [PubMed]
- Ahmad, R.A.; Abdullah, S.; Serati-Nouri, H.; Majid, F.A.A.; Sarmidi, M.R.; Aziz, R.A. Antiproliferative activity of coumarin and cinnamon water extracts on human ovarian cancer cells. Lat. Am. J. Pharm. 2014, 33, 960–965. [Google Scholar]
- Chuang, L.Y.; Guh, J.Y.; Chao, L.K.; Lu, Y.C.; Hwang, J.Y.; Yang, Y.L.; Cheng, T.H.; Yang, W.Y.; Chien, Y.J.; Huang, J.S. Anti-proliferative effects of cinnamaldehyde on human hepatoma cell lines. Food Chem. 2012, 133, 1603–1610. [Google Scholar] [CrossRef]
- Koppikar, S.J.; Choudhari, A.S.; Suryavanshi, S.A.; Kumari, S.; Chattopadhyay, S.; Kaul-Ghanekar, R. Aqueous cinnamon extract (ACE-c) from the bark of cinnamomum cassia causes apoptosis in human cervical cancer cell line (SiHa) through loss of mitochondrial membrane potential. BMC Cancer 2010, 10, 1–12. [Google Scholar] [CrossRef] [PubMed]
- Kim, J.E.; Son, J.E.; Jeong, H.; Kim, D.J.; Seo, S.G.; Lee, E.; Lim, T.G.; Kim, J.R.; Kimbung, Y.R.; Chen, H.Y.; et al. A novel cinnamon-related natural product with Pim-1 inhibitory activity inhibits leukemia and skin cancer. Cancer Res. 2015, 75, 2716–2728. [Google Scholar] [CrossRef] [PubMed]
- Mahajan, U.B.; Chandrayan, G.; Patil, C.R.; Arya, D.S.; Suchal, K.; Agrawal, Y.O.; Ojha, S.; Goyal, S.N. The protective effect of apigenin on myocardial injury in diabetic rats mediating activation of the PPAR- gamma pathway. Int. J. Mol. Sci. 2017, 18, 756. [Google Scholar] [CrossRef] [PubMed]
- Cardenas, H.; Arango, D.; Nicholas, C.; Duarte, S.; Nuovo, G.J.; He, W.; Voss, O.H.; Gonzalez-Mejia, M.E.; Guttridge, D.C.; Grotewold, E.; et al. Dietary apigenin exerts immune-regulatory activity in vivo by reducing nf-kappa b activity, halting leukocyte infiltration and restoring normal metabolic function. Int. J. Mol. Sci. 2016, 17, 323. [Google Scholar] [CrossRef] [PubMed]
- He, J.; Xu, Q.; Wang, M.; Li, C.Y.; Qian, X.; Shi, Z.M.; Liu, L.Z.; Jiang, B.H. Oral administration of apigenin inhibits metastasis through AKT/P70S6K1/MMP-9 pathway in orthotopic ovarian tumor model. Int. J. Mol. Sci. 2012, 13, 7271–7282. [Google Scholar] [CrossRef] [PubMed]
- Franzen, C.A.; Amargo, E.; Todorovic, V.; Desai, B.V.; Huda, S.; Mirzoeva, S.; Chiu, K.; Grzybowski, B.A.; Chew, T.L.; Green, K.J.; et al. The chemopreventive bioflavonoid apigenin inhibits prostate cancer cell motility through the focal adhesion kinase/src signaling mechanism. Cancer Prev. Res. 2009, 2, 830–841. [Google Scholar] [CrossRef] [PubMed]
- Zhang, S.; Jiang, Z.F.; Pan, Q.; Song, C.Y.; Zhang, W.H. Anti-cancer effect of naringenin chalcone is mediated via the induction of autophagy, apoptosis and activation of PI3K/AKT signalling pathway. Bangladesh J. Pharmacol. 2016, 11, 684–690. [Google Scholar] [CrossRef]
- Banerjee, N.; Kim, H.; Talcott, S.T.; Turner, N.D.; Byrne, D.H.; Mertens-Talcott, S.U. Plum polyphenols inhibit colorectal aberrant crypt foci formation in rats: Potential role of the miR-143/protein kinase b/mammalian target of rapamycin axis. Nutr. Res. 2016, 36, 1105–1113. [Google Scholar] [CrossRef] [PubMed]
- Noratto, G.; Porter, W.; Byrne, D.; Cisneros-Zevallos, L. Identifying peach and plum polyphenols with chemopreventive potential against estrogen-independent breast cancer cells. J. Agric. Food Chem. 2009, 57, 5219–5226. [Google Scholar] [CrossRef] [PubMed]
- Jeong, J.B.; Lee, S.H. Protocatechualdehyde possesses anti-cancer activity through downregulating cyclin D1 and HDAC2 in human colorectal cancer cells. Biochem. Biophys. Res. Commun. 2013, 430, 381–386. [Google Scholar] [CrossRef] [PubMed]
- Hong, S.H.; Ismail, I.A.; Kang, S.M.; Han, D.C.; Kwon, B.M. Cinnamaldehydes in cancer chemotherapy. Phytother. Res. 2016, 30, 754–767. [Google Scholar] [CrossRef] [PubMed]
- Kang, H.S.; Ock, J.; Lee, H.J.; Lee, Y.J.; Kwon, B.M.; Hong, S.H. Early growth response protein 1 upregulation and nuclear translocation by 2’-benzoyloxycinnamaldehyde induces prostate cancer cell death. Cancer Lett. 2013, 329, 217–227. [Google Scholar] [CrossRef] [PubMed]
- Qi, G.Y.; Chen, J.; Shi, C.R.; Wang, Y.K.; Mi, S.S.; Shao, W.H.; Yu, X.Y.; Ma, Y.L.; Ling, J.P.; Huang, J. Cinnamic acid (cinn) induces apoptosis and proliferation in human nasopharyngeal carcinoma cells. Cell. Physiol. Biochem. 2016, 40, 589–596. [Google Scholar] [CrossRef] [PubMed]
- Munirathinam, G.; Gray, K. Cinnamaldehye, a dietary flavoring agent derived from cinnamon targets prostate cancer cells. Endocr. Rev. 2014, 35, 1–2. [Google Scholar]
- Park, K.R.; Nam, D.; Yun, H.M.; Lee, S.G.; Jang, H.J.; Sethi, G.; Cho, S.K.; Ahn, K.S. Beta-caryophyllene oxide inhibits growth and induces apoptosis through the suppression of PI3K/AKT/MTOR/S6K1 pathways and ros-mediated mapks activation. Cancer Lett. 2011, 312, 178–188. [Google Scholar] [CrossRef] [PubMed]
- Zu, Y.G.; Yu, H.M.; Liang, L.; Fu, Y.J.; Efferth, T.; Liu, X.; Wu, N. Activities of ten essential oils towards propionibacterium acnes and PC-3, A-549 and MCF-7 cancer cells. Molecules 2010, 15, 3200–3210. [Google Scholar] [CrossRef] [PubMed]
- Chandra, P.; Pandey, R.; Srivastva, M.; Rameshkumar, K.B.; Kumar, B. Quantitative determination of chemical constituents of piper spp. Using uplc-esi-ms/ms. Ind. Crop. Prod. 2015, 76, 967–976. [Google Scholar] [CrossRef]
- Morris, M.E.; Zhang, S.Z. Flavonoid-drug interactions: Effects of flavonoids on abc transporters. Life Sci. 2006, 78, 2116–2130. [Google Scholar] [CrossRef] [PubMed]
- Stevenson, D.E.; Scheepens, A.; Hurst, R.D. Bioavailability and Metabolism of Dietary Flavonoids—Much Known—Much More to Discover; Nova Science Publishers, Inc.: Hauppauge, NY, USA, 2009; pp. 1–52. [Google Scholar]
- Miron, A.; Aprotosoaie, A.C.; Trifan, A.; Xiao, J.B. Flavonoids as modulators of metabolic enzymes and drug transporters. Ann. N. Y. Acad. Sci. 2017, 1398, 152–167. [Google Scholar] [CrossRef] [PubMed]
- Moon, Y.J.; Wang, X.D.; Morris, M.E. Dietary flavonoids: Effects on xenobiotic and carcinogen metabolism. Toxicol. In Vitro 2006, 20, 187–210. [Google Scholar] [CrossRef] [PubMed]
- Venturelli, S.; Burkard, M.; Biendl, M.; Lauer, U.M.; Frank, J.; Busch, C. Prenylated chalcones and flavonoids for the prevention and treatment of cancer. Nutrition 2016, 32, 1171–1178. [Google Scholar] [CrossRef] [PubMed]
- Orjala, J.; Wright, A.D.; Behrends, H.; Folkers, G.; Sticher, O.; Ruegger, H.; Rali, T. Cytotoxic and antibacterial dihydrochalcones from piper aduncum. J. Nat. Prod. 1994, 57, 18–26. [Google Scholar] [CrossRef] [PubMed]
- Tamogami, S.; Kodama, O. Coronatine elicits phytoalexin production in rice leaves (Oryza sativa L.) in the same manner as jasmonic acid. Phytochemistry 2000, 54, 689–694. [Google Scholar] [CrossRef]
- Koirala, N.; Thuan, N.H.; Ghimire, G.P.; Thang, D.V.; Sohng, J.K. Methylation of flavonoids: Chemical structures, bioactivities, progress and perspectives for biotechnological production. Enzyme Microb. Technol. 2016, 86, 103–116. [Google Scholar] [CrossRef] [PubMed]
- Wu, J.C.; Lai, C.S.; Tsai, M.L.; Ho, C.T.; Wang, Y.J.; Pan, M.H. Chemopreventive effect of natural dietary compounds on xenobiotic-induced toxicity. J. Food Drug Anal. 2017, 25, 176–186. [Google Scholar] [CrossRef] [PubMed]
- Kumar, S.; Pandey, A.K. Chemistry and biological activities of flavonoids: An overview. Sci. World J. 2013. [Google Scholar] [CrossRef] [PubMed]
- Gao, K.; Henning, S.M.; Niu, Y.T.; Youssefian, A.A.; Seeram, N.P.; Xu, A.L.; Heber, D. The citrus flavonoid naringenin stimulates DNA repair in prostate cancer cells. J. Nutr. Biochem. 2006, 17, 89–95. [Google Scholar] [CrossRef] [PubMed]
- Yang, C.S.; Landau, J.M.; Huang, M.T.; Newmark, H.L. Inhibition of carcinogenesis by dietary polyphenolic compounds. Annu. Rev. Nutr. 2001, 21, 381–406. [Google Scholar] [CrossRef] [PubMed]
- Afaq, F.; Saleem, M.; Krueger, C.G.; Reed, J.D.; Mukhtar, H. Anthocyanin- and hydrolyzable tannin-rich pomegranate fruit extract modulates MAPK and NF-kappa b pathways and inhibits skin tumorigenesis in CD-1 mice. Int. J. Cancer 2005, 113, 423–433. [Google Scholar] [CrossRef] [PubMed]
- Williams, R.J.; Spencer, J.P.E.; Rice-Evans, C. Flavonoids: Antioxidants or signalling molecules? Free Radic. Biol. Med. 2004, 36, 838–849. [Google Scholar] [CrossRef] [PubMed]
- Morel, I.; Abalea, V.; Cillard, P.; Cillard, J. Repair of oxidized DNA by the flavonoid myricetin. Methods Enzymol. 2001, 335, 308–316. [Google Scholar] [PubMed]
- Lewinska, A.; Siwak, J.; Rzeszutek, I.; Wnuk, M. Diosmin induces genotoxicity and apoptosis in DU145 prostate cancer cell line. Toxicol. In Vitro 2015, 29, 417–425. [Google Scholar] [CrossRef] [PubMed]
- Siwak, J.; Lewinska, A.; Wnuk, M.; Bartosz, G. Protection of flavonoids against hypochlorite-induced protein modifications. Food Chem. 2013, 141, 1227–1241. [Google Scholar] [CrossRef] [PubMed]
Sample Availability: Samples of the compounds are available from the authors. |


| Compounds | 0 h | 6 h | 12 h | 24 h | ||||
|---|---|---|---|---|---|---|---|---|
| Measured Value * | % | Measured Value * | % | Measured Value * | % | Measured Value * | % | |
| Control | 518.12 ± 6.58 | 100 | 443.24 ± 6.52 | 86 | 377.50 ± 2.13 | 73 | 80.39 ± 20.27 | 16 |
| 3,4-Dihydroxybenzaldehyde | 505.10 ± 5.10 | 100 | 441.11 ± 6.82 | 97 | 398.04 ± 7.94 | 79 | 147.72 ± 2.92 | 29 |
| Naringenin chalcone | 492.72 ± 5.38 | 100 | 446.06 ± 8.28 | 91 | 431.77 ± 7.32 | 88 | 269.33 ± 3.78 | 55 |
| Apigenin | 490.69 ± 3.78 | 100 | 397.23 ± 6.59 | 81 | 360.21 ± 6.22 | 73 | 176.18 ± 9.94 | 36 |
| Neochlorogenic acid | 519.38 ± 7.00 | 100 | 436.78 ± 7.17 | 84 | 303.23 ± 6.49 | 58 | 71.92 ± 2.37 | 14 |
| Compounds | 0 h | 6 h | 12 h | 24 h | ||||
|---|---|---|---|---|---|---|---|---|
| Measured Value * | % | Measured Value * | % | Measured Value * | % | Measured Value * | % | |
| Control | 474.72 ± 7.77 | 100 | 420.75 ± 9.88 | 89 | 371.84 ± 11.27 | 78 | 140.11 ± 10.24 | 30 |
| 3,4-Dihydroxybenzaldehyde | 406.92 ± 12.63 | 100 | 349.11 ± 13.20 | 86 | 304.66 ± 8.34 | 75 | 152.38 ± 11.25 | 37 |
| Naringenin chalcone | 461.85 ± 9.27 | 100 | 436.98 ± 10.68 | 95 | 411.39 ± 8.32 | 89 | 398.17 ± 11.82 | 86 |
| Apigenin | 480.67 ± 5.35 | 100 | 415.30 ± 6.16 | 86 | 368.72 ± 8.68 | 77 | 300.77 ± 8.78 | 63 |
| Neochlorogenic acid | 365.15 ± 4.35 | 100 | 318.30 ± 7.54 | 87 | 300.08 ± 6.22 | 82 | 139.02 ± 15.20 | 38 |
| 0 h | 6 h | 12 h | 24 h | |||||
|---|---|---|---|---|---|---|---|---|
| Compounds | Measured Value * | % | Measured Value * | % | Measured Value * | % | Measured Value * | % |
| Control | 494.87 ± 7.25 | 100 | 436.01 ± 2.03 | 88 | 369.92 ± 7.54 | 75 | 136.69 ± 22.52 | 28 |
| 3,4-Dihydroxybenzaldehyde | 477.30 ± 3.73 | 100 | 408.49 ± 2.33 | 86 | 373.09 ± 3.78 | 78 | 102.62 ± 8.73 | 22 |
| Naringenin chalcone | 444.85 ± 7.66 | 100 | 410.23 ± 7.47 | 92 | 398.44 ± 3.23 | 90 | 360.25 ± 6.42 | 81 |
| Apigenin | 398.55 ± 8.46 | 100 | 370.29 ± 6.75 | 93 | 341.14 ± 8.87 | 86 | 270.30 ± 9.43 | 68 |
| Neochlorogenic acid | 448.47 ± 6.80 | 100 | 393.60 ± 8.87 | 88 | 356.98 ± 8.52 | 80 | 136.54 ± 10.86 | 30 |
© 2017 by the authors. Licensee MDPI, Basel, Switzerland. This article is an open access article distributed under the terms and conditions of the Creative Commons Attribution (CC BY) license (http://creativecommons.org/licenses/by/4.0/).
Share and Cite
Lackova, Z.; Buchtelova, H.; Buchtova, Z.; Klejdus, B.; Heger, Z.; Brtnicky, M.; Kynicky, J.; Zitka, O.; Adam, V. Anticarcinogenic Effect of Spices Due to Phenolic and Flavonoid Compounds—In Vitro Evaluation on Prostate Cells. Molecules 2017, 22, 1626. https://doi.org/10.3390/molecules22101626
Lackova Z, Buchtelova H, Buchtova Z, Klejdus B, Heger Z, Brtnicky M, Kynicky J, Zitka O, Adam V. Anticarcinogenic Effect of Spices Due to Phenolic and Flavonoid Compounds—In Vitro Evaluation on Prostate Cells. Molecules. 2017; 22(10):1626. https://doi.org/10.3390/molecules22101626
Chicago/Turabian StyleLackova, Zuzana, Hana Buchtelova, Zaneta Buchtova, Borivoj Klejdus, Zbynek Heger, Martin Brtnicky, Jindrich Kynicky, Ondrej Zitka, and Vojtech Adam. 2017. "Anticarcinogenic Effect of Spices Due to Phenolic and Flavonoid Compounds—In Vitro Evaluation on Prostate Cells" Molecules 22, no. 10: 1626. https://doi.org/10.3390/molecules22101626
APA StyleLackova, Z., Buchtelova, H., Buchtova, Z., Klejdus, B., Heger, Z., Brtnicky, M., Kynicky, J., Zitka, O., & Adam, V. (2017). Anticarcinogenic Effect of Spices Due to Phenolic and Flavonoid Compounds—In Vitro Evaluation on Prostate Cells. Molecules, 22(10), 1626. https://doi.org/10.3390/molecules22101626