
Comparison of Protein N-Homocysteinylation in Rat Plasma under Elevated Homocysteine Using a Specific Chemical Labeling Method

 ,
,
Abstract
:
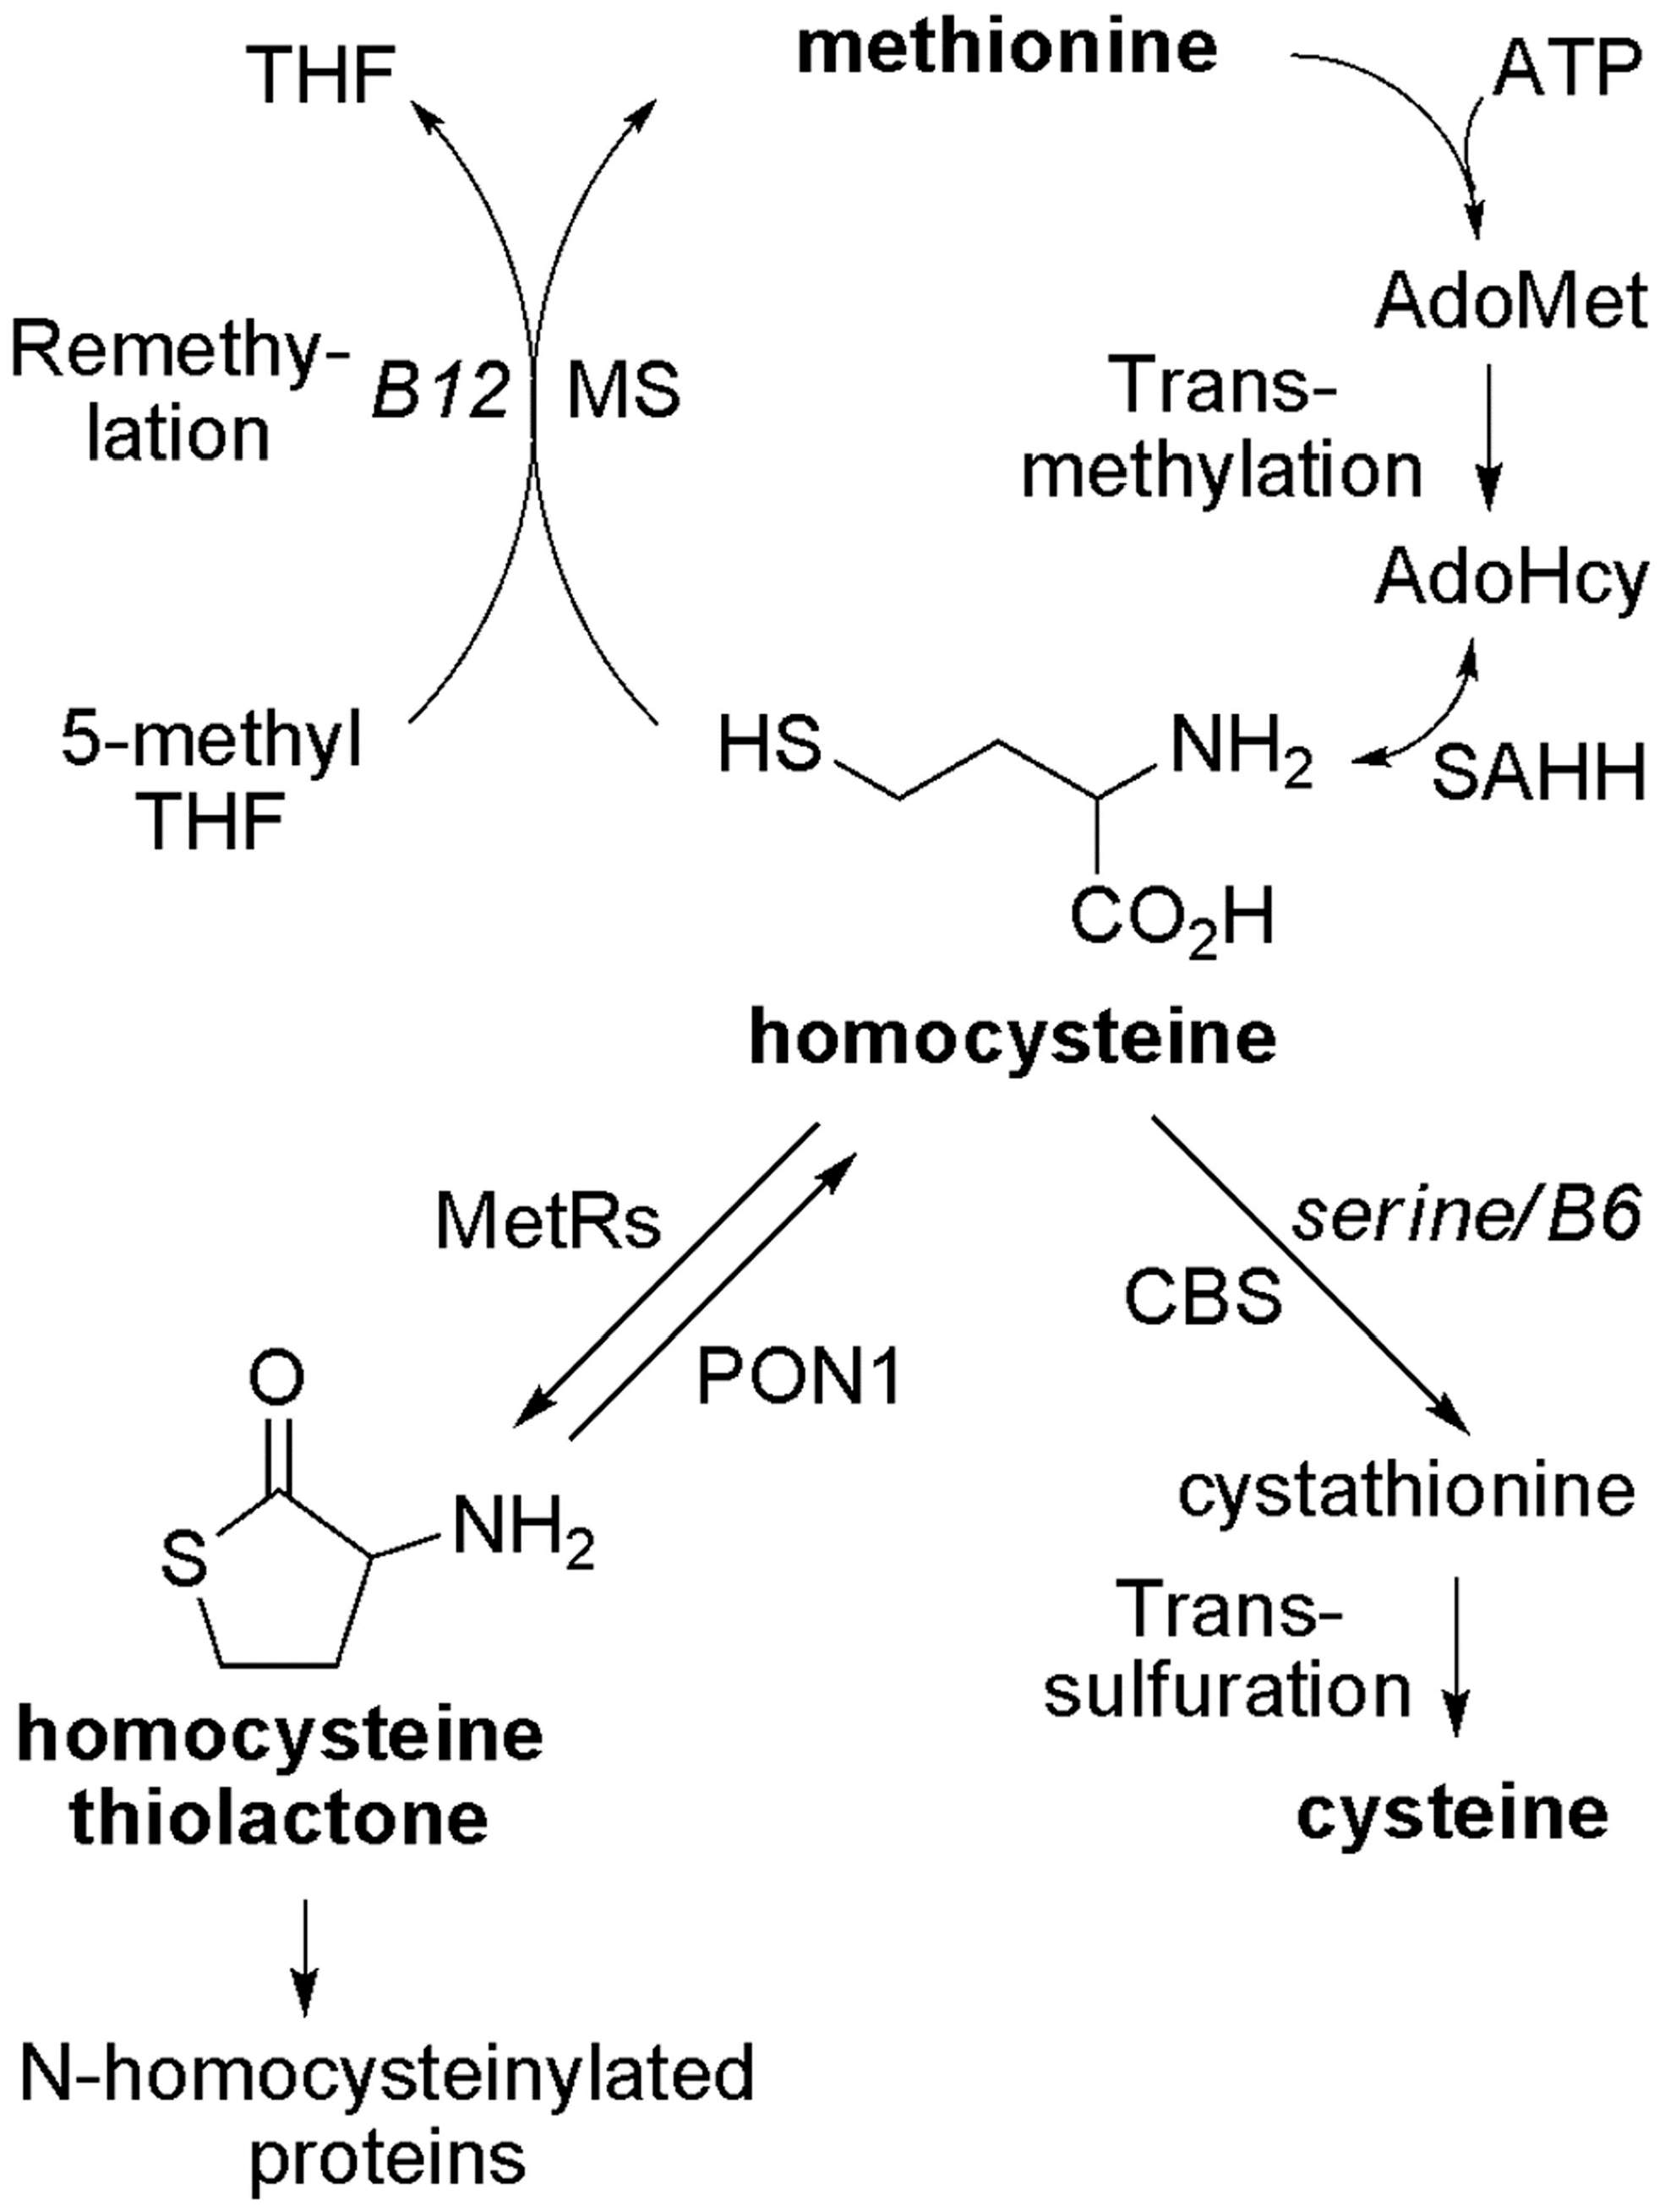
1. Introduction
2. Results and Discussions
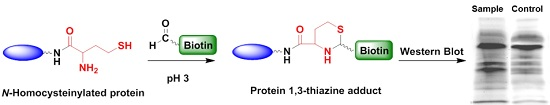
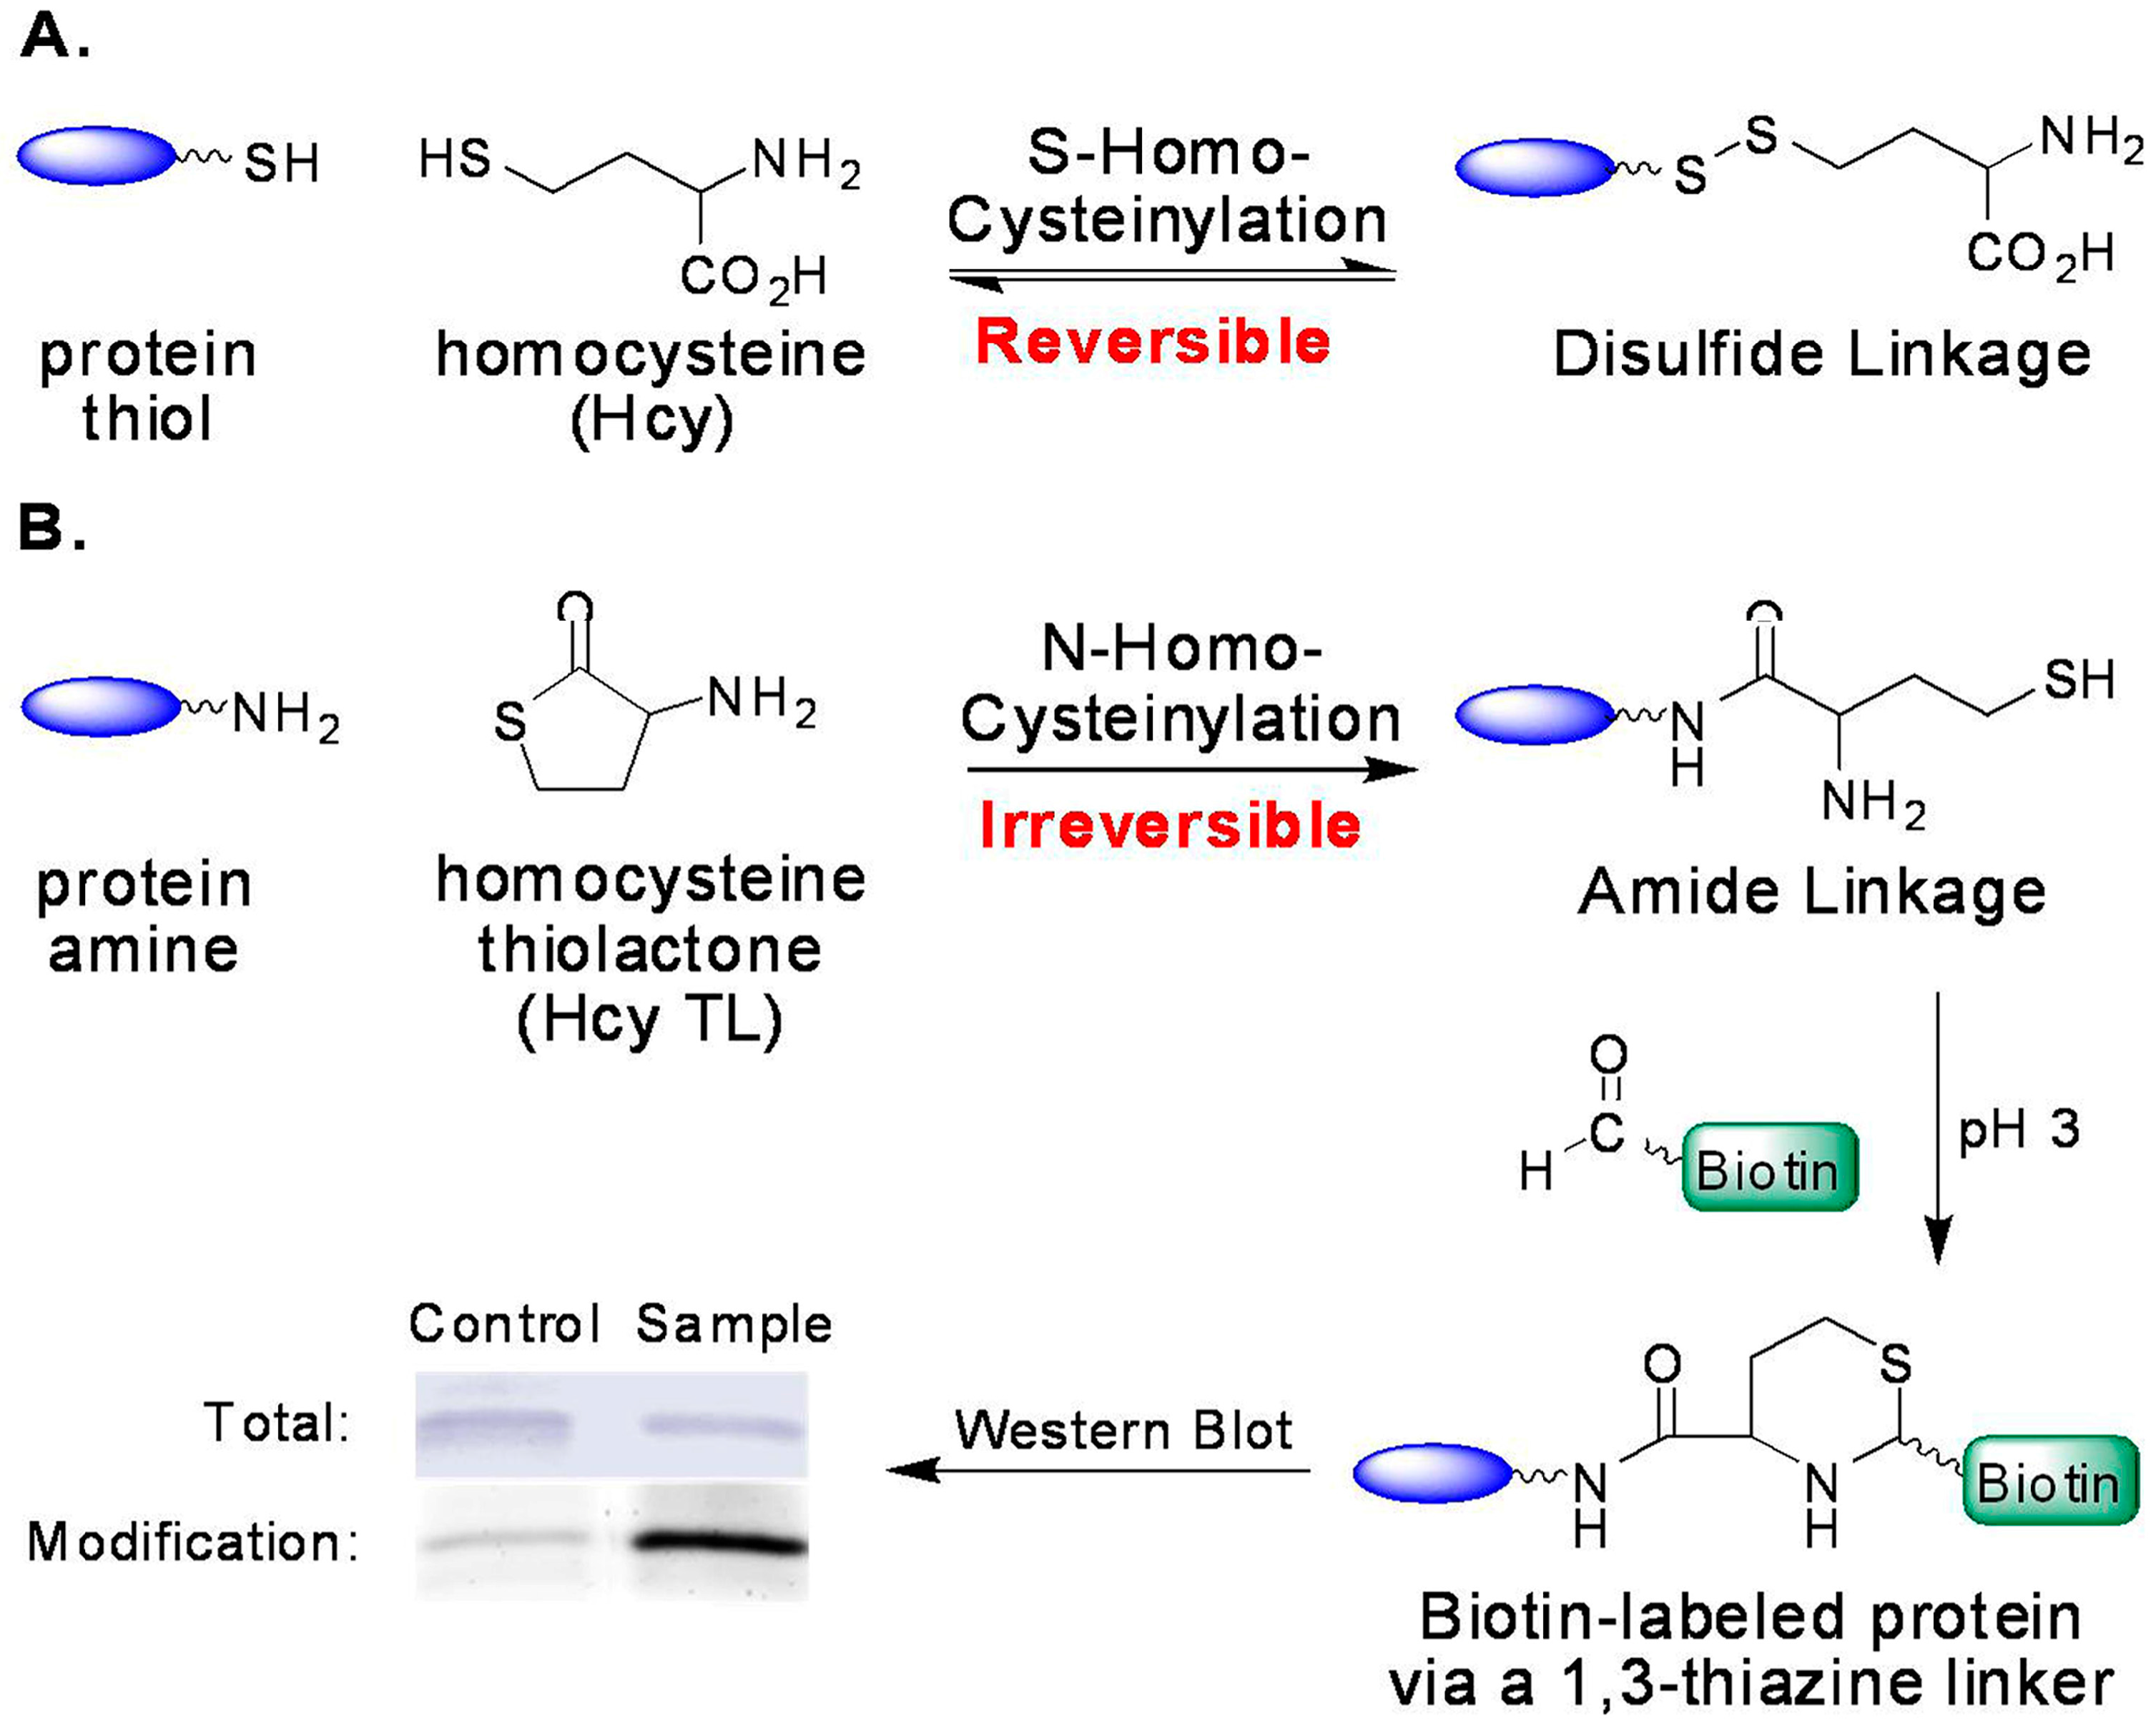
2.1. Optimized Conditions for Aldehyde Tag Labeling
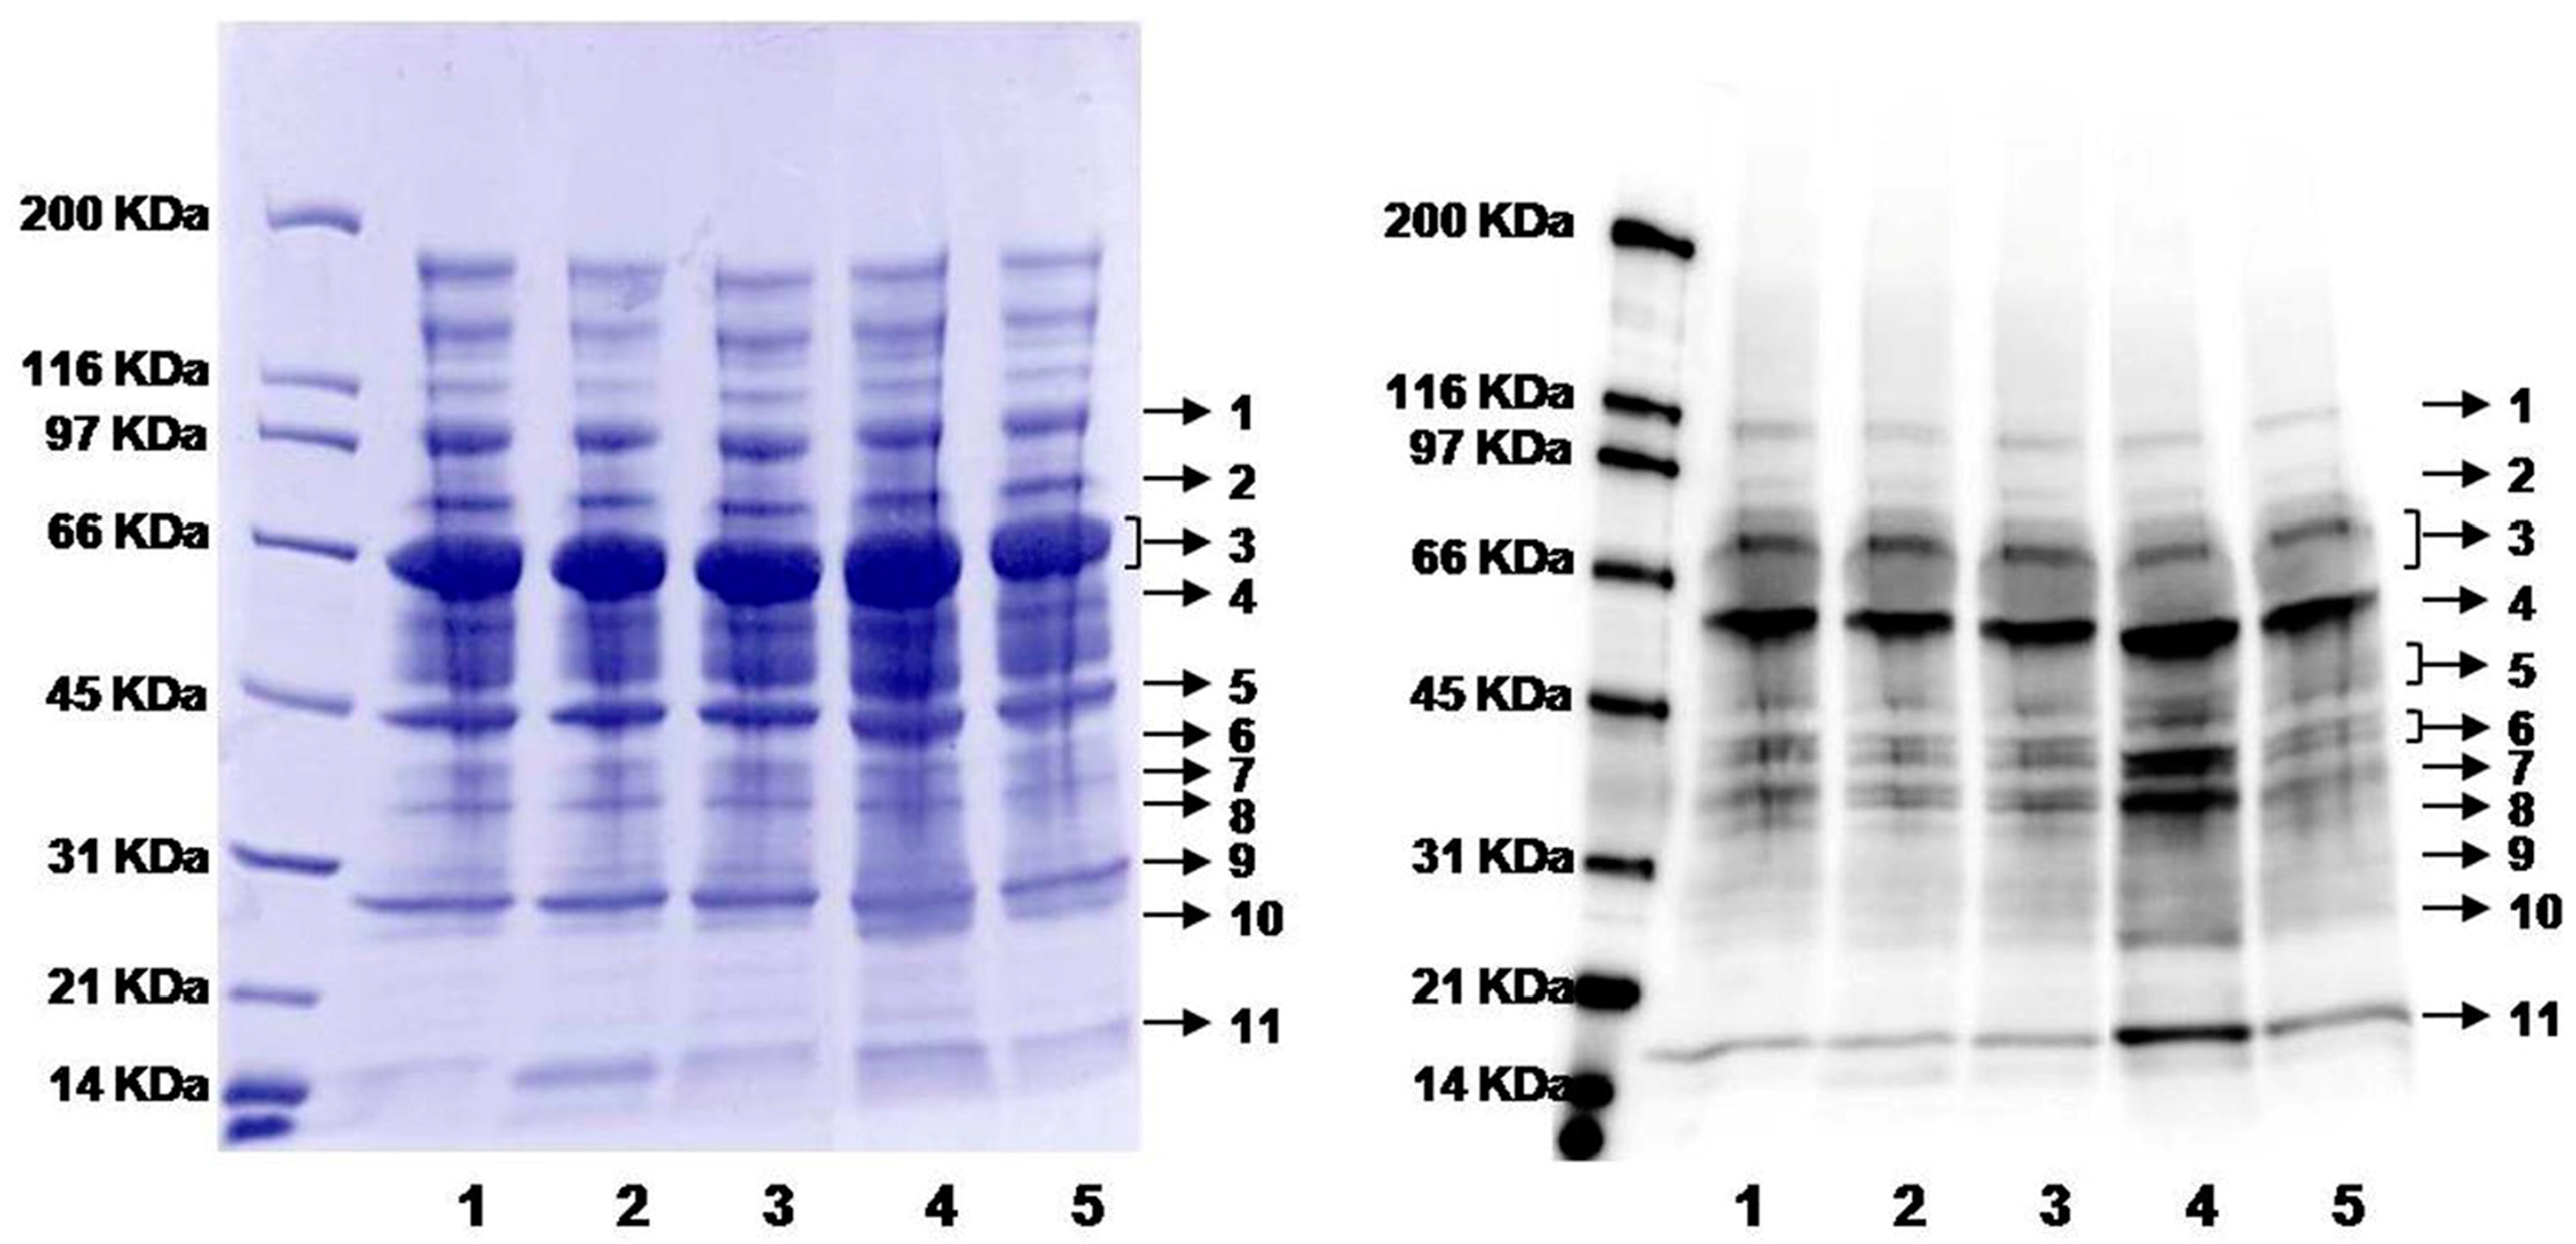
2.2. Increased Level of Protein N-Homocysteinylation in Plasma from Rats on B12 Deficient Diet
2.3. Possible Contributing Factors to N-Homocysteinylation
3. Materials and Methods
3.1. Plasma
3.2. Chemicals and Reagents
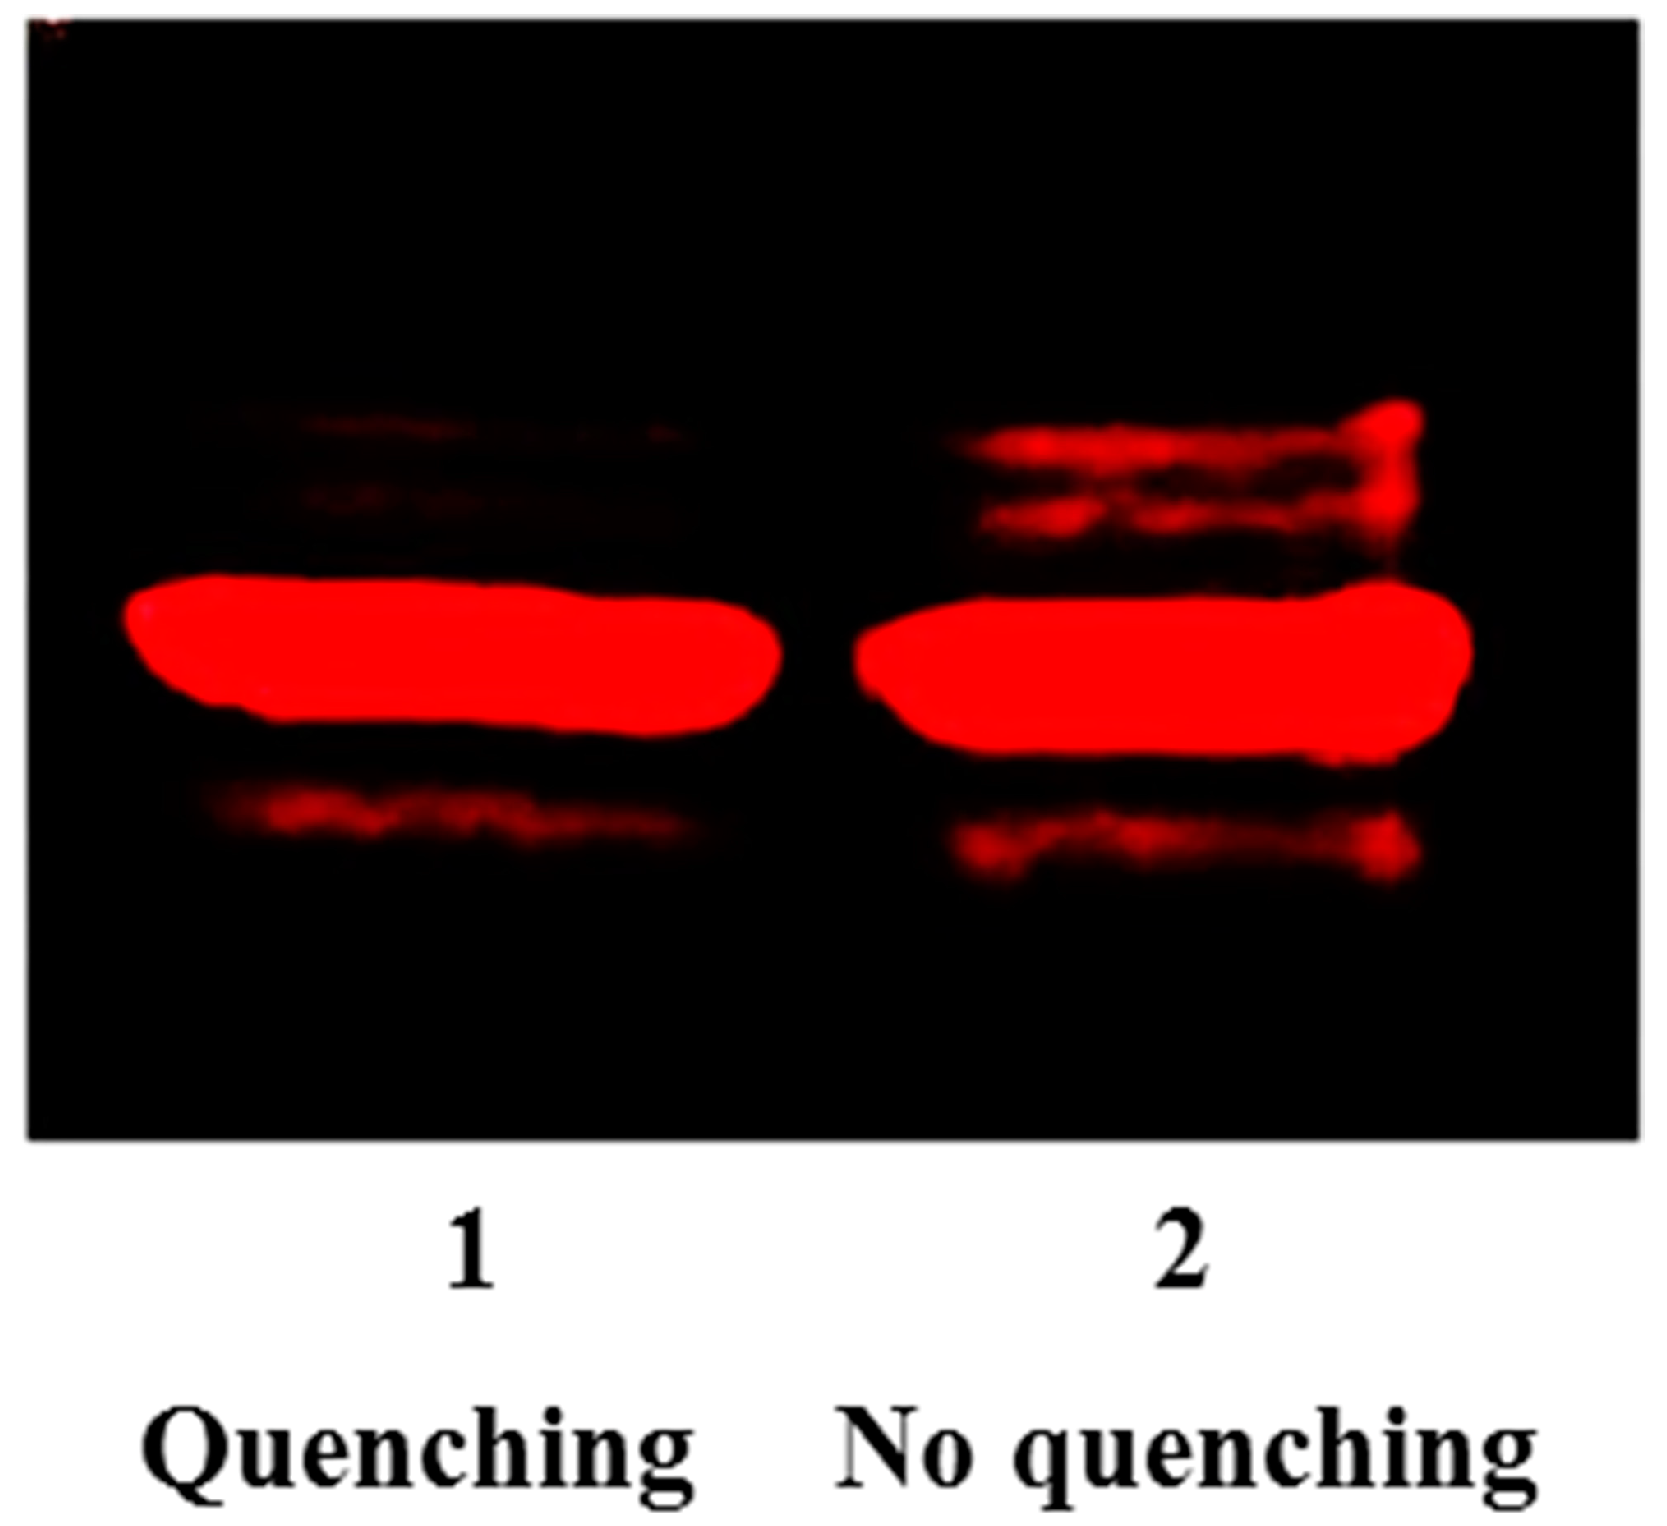
3.3. Optimization of Labeling with Cysteamine Quenching
3.4. Labeling Proteins with Biotin-Aldehyde
3.5. Western Blotting of Biotin-Labeled Proteins
3.6. Data Analysis for the Degree of Modification
4. Conclusions
Supplementary Materials
Acknowledgments
Author Contributions
Conflicts of Interest
References
- Brattstrom, L.; Wilcken, D.E. Homocysteine and cardiovascular disease: Cause or effect? Am. J. Clin. Nutr. 2000, 72, 315–323. [Google Scholar] [PubMed]
- Cacciapuoti, F. Hyper-homocysteinemia: A novel risk factor or a powerful marker for cardiovascular diseases? Pathogenetic and therapeutical uncertainties. J. Thromb. Thrombolysis 2011, 32, 82–88. [Google Scholar] [CrossRef] [PubMed]
- Carmel, R.J.; Jacobsen, D.W. Homocysteine in Health and Disease; Cambridge University Press: Cambridge, UK; New York, NY, USA, 2001; p. 526. [Google Scholar]
- Maron, B.A.; Loscalzo, J. The treatment of hyperhomocysteinemia. Annu. Rev. Med. 2009, 60, 39–54. [Google Scholar] [CrossRef] [PubMed]
- Seshadri, S.; Beiser, A.; Selhub, J.; Jacques, P.F.; Rosenberg, I.H.; D’Agostino, R.B.; Wilson, P.W.; Wolf, P.A. Plasma homocysteine as a risk factor for dementia and Alzheimer’s disease. N. Engl. J. Med. 2002, 346, 476–483. [Google Scholar] [CrossRef] [PubMed]
- Diaz-Arrastia, R. Homocysteine and neurologic disease. Arch. Neurol. 2000, 57, 1422–1427. [Google Scholar] [CrossRef] [PubMed]
- Selhub, J. Homocysteine metabolism. Annu. Rev. Nutr. 1999, 19, 217–246. [Google Scholar] [CrossRef] [PubMed]
- Finkelstein, J.D. Pathways and regulation of homocysteine metabolism in mammals. Semin. Thromb. Hemost. 2000, 26, 219–225. [Google Scholar] [CrossRef] [PubMed]
- Matthews, R.G.; Smith, A.E.; Zhou, Z.S.; Taurog, R.E.; Bandarian, V.; Evans, J.C.; Ludwig, M. Cobalamin-dependent and cobalamin-independent methionine synthases: Are there two solutions to the same chemical problem? Helv. Chim. Acta 2003, 86, 3939–3954. [Google Scholar] [CrossRef]
- Gui, S.; Wooderchak-Donahue, W.L.; Zang, T.; Chen, D.; Daly, M.P.; Zhou, Z.S.; Hevel, J.M. Substrate-induced control of product formation by protein arginine methyltransferase 1. Biochemistry 2013, 52, 199–209. [Google Scholar] [CrossRef] [PubMed]
- Zhou, Z.S.; Peariso, K.; Penner-Hahn, J.E.; Matthews, R.G. Identification of the zinc ligands in cobalamin-independent methionine synthase (MetE) from Escherichia coli. Biochemistry 1999, 38, 15915–15926. [Google Scholar] [CrossRef] [PubMed]
- Mosley, S.L.; Bakke, B.A.; Sadler, J.M.; Sunkara, N.K.; Dorgan, K.M.; Zhou, Z.S.; Seley-Radtke, K.L. Carbocyclic pyrimidine nucleosides as inhibitors of S-adenosylhomocysteine hydrolase. Bioorg. Med. Chem. 2006, 14, 7967–7971. [Google Scholar] [CrossRef] [PubMed]
- Deth, R.C.; Hodgson, N.W.; Trivedi, M.S.; Muratore, C.R.; Waly, M.I. Autsim: A Neuroepigenetic Disorder. Autsim Sci. Dig. 2011, 3, 9–19. [Google Scholar]
- Blom, H.J.C.; Fowler, B.; Koch, H.G. Disorders of homocysteine metabolism: From rare genetic defects to common risk factors. Eur. J. Pediatr. 1998, 157 (Suppl. 2), S39–S142. [Google Scholar] [CrossRef]
- Goyette, P.; Sumner, J.S.; Milos, R.; Duncan, A.M.; Rosenblatt, D.S.; Matthews, R.G.; Rozen, R. Human methylenetetrahydrofolate reductase: Isolation of cDNA mapping and mutation identification. Nat. Genet. 1994, 7, 195–200. [Google Scholar] [CrossRef] [PubMed]
- Mudd, S.H.; Finkelstein, J.D.; Irreverre, F.; Laster, L. Homocysteinuria: An enzymatic defect. Science 1964, 143, 1443–1445. [Google Scholar] [CrossRef] [PubMed]
- Selhub, J.; Jacques, P.F.; Wilson, P.W.; Rush, D.; Rosenberg, I.H. Vitamin status and intake as primary determinants of homocysteinemia in an elderly population. J. Am. Med. Assoc. 1993, 270, 2693–2698. [Google Scholar] [CrossRef]
- Verhoef, P.; van Vliet, T.; Olthof, M.R.; Katan, M.B. A high-protein diet increases postprandial but not fasting plasma total homocysteine concentrations: A dietary controlled, crossover trial in healthy volunteers. Am. J. Clin. Nutr. 2005, 82, 553–558. [Google Scholar] [PubMed]
- Handy, D.E.; Loscalzo, J. Homocysteine and atherothrombosis: Diagnosis and treatment. Curr. Atheroscler. Rep. 2003, 5, 276–283. [Google Scholar] [CrossRef] [PubMed]
- Jakubowski, H. An overview of homocysteine metabolism. In Homocysteine in Protein Structure/Function and Human Disease: Chemical Biology of Homocysteine-Containing Proteins; Springer: New York, NY, USA, 2013; pp. 7–17. [Google Scholar]
- Olszewski, A.J.; McCully, K.S. Homocysteine metabolism and the oxidative modification of proteins and lipids. Free Radic. Biol. Med. 1993, 14, 683–693. [Google Scholar] [CrossRef]
- Perla-Kajan, J.; Twardowski, T.; Jakubowski, H. Mechanisms of homocysteine toxicity in humans. Amino Acids 2007, 32, 561–572. [Google Scholar] [CrossRef] [PubMed]
- Perna, A.F.; Ingrosso, D.; Lombardi, C.; Acanfora, F.; Satta, E.; Cesare, C.M.; Violetti, E.; Romano, M.M.; De Santo, N.G. Possible mechanisms of homocysteine toxicity. Kidney Int. Suppl. 2003, 84, S137–S140. [Google Scholar] [CrossRef] [PubMed]
- Cannon, L.M.; Butler, F.N.; Wan, W.; Zhou, Z.S. A stereospecific colorimetric assay for (S,S)-adenosylmethionine quantification based on thiopurine methyltransferase-catalyzed thiol methylation. Anal. Biochem. 2002, 308, 358–363. [Google Scholar] [CrossRef]
- Biastoff, S.; Teuber, M.; Zhou, Z.S.; Drager, B. Colorimetric activity measurement of a recombinant putrescine N-methyltransferase from Datura stramonium. Planta Med. 2006, 72, 1136–1141. [Google Scholar] [CrossRef] [PubMed]
- Joseph, J.; Joseph, L.; Devi, S.; Kennedy, R.H. Effect of anti-oxidant treatment on hyperhomocysteinemia-induced myocardial fibrosis and diastolic dysfunction. J. Heart Lung Transplant. 2008, 27, 1237–1241. [Google Scholar] [CrossRef] [PubMed]
- Perna, A.F.; Satta, E.; Acanfora, F.; Lombardi, C.; Ingrosso, D.; de Santo, N.G. Increased plasma protein homocysteinylation in hemodialysis patients. Kidney Int. 2006, 69, 869–876. [Google Scholar] [CrossRef] [PubMed]
- Perna, A.F.; Acanfora, F.; Luciano, M.G.; Pulzella, P.; Capasso, R.; Satta, E.; Cinzia, L.; Pollastro, R.M.; Iannelli, S.; Ingrosso, D.; et al. Plasma protein homocysteinylation in uremia. Clin. Chem. Lab. Med. 2007, 45, 1678–1682. [Google Scholar] [CrossRef] [PubMed]
- Jakubowski, H. Molecular basis of homocysteine toxicity in humans. Cell. Mol. Life. Sci. 2004, 61, 470–487. [Google Scholar] [CrossRef] [PubMed]
- Sass, J.O.; Nakanishi, T.; Sato, T.; Sperl, W.; Shimizu, A. S-homocysteinylation of transthyretin is detected in plasma and serum of humans with different types of hyperhomocysteinemia. Biochem. Biophys. Res. Commun. 2003, 310, 242–246. [Google Scholar] [CrossRef] [PubMed]
- Lim, A.; Sengupta, S.; McComb, M.E.; Theberge, R.; Wilson, W.G.; Costello, C.E.; Jacobsen, D.W. In vitro and in vivo interactions of homocysteine with human plasma transthyretin. J. Biol. Chem. 2003, 278, 49707–49713. [Google Scholar] [CrossRef] [PubMed]
- Jakubowski, H. Proofreading in vivo: Editing of homocysteine by methionyl-tRNA synthetase in the yeast Saccharomyces cerevisiae. EMBO J. 1991, 10, 593–598. [Google Scholar] [PubMed]
- Jakubowski, H.; Goldman, E. Synthesis of homocysteine thiolactone by methionyl-tRNA synthetase in cultured mammalian cells. FEBS Lett. 1993, 317, 237–240. [Google Scholar] [CrossRef]
- Jakubowski, H. Aminoacyl-tRNA synthetases and the evolution of coded peptide synthesis: The Thioester World. FEBS Lett. 2016, 590, 469–481. [Google Scholar] [CrossRef] [PubMed]
- Perla-Kajan, J.; Jakubowski, H. Paraoxonase 1 protects against protein N-homocysteinylation in humans. FASEB J. 2010, 24, 931–936. [Google Scholar] [CrossRef] [PubMed]
- Perla-Kajan, J.; Stanger, O.; Luczak, M.; Ziolkowska, A.; Malendowicz, L.K.; Twardowski, T.; Lhotak, S.; Austin, R.C.; Jakubowski, H. Immunohistochemical detection of N-homocysteinylated proteins in humans and mice. Biomed. Pharmacother. 2008, 62, 473–479. [Google Scholar] [CrossRef] [PubMed]
- Jakubowski, H. New method for the determination of protein N-linked homocysteine. Anal. Biochem. 2008, 380, 257–261. [Google Scholar] [CrossRef] [PubMed]
- Uji, Y.; Motomiya, Y.; Hanyu, N.; Ukaji, F.; Okabe, H. Protein-bound homocystamide measured in human plasma by HPLC. Clin. Chem. 2002, 48, 941–944. [Google Scholar] [PubMed]
- Jakubowski, H. Homocysteine is a protein amino acid in humans. Implications for homocysteine-linked disease. J. Biol. Chem. 2002, 277, 30425–30428. [Google Scholar] [CrossRef] [PubMed]
- Jakubowski, H.; Perla-Kajan, J.; Finnell, R.H.; Cabrera, R.M.; Wang, H.; Gupta, S.; Kruger, W.D.; Kraus, J.P.; Shih, D.M. Genetic or nutritional disorders in homocysteine or folate metabolism increase protein N-homocysteinylation in mice. FASEB J. 2009, 23, 1721–1727. [Google Scholar] [CrossRef] [PubMed]
- Jakubowski, H. Protein N-homocysteinylation: Implications for atherosclerosis. Biomed. Pharmacother. 2001, 55, 443–447. [Google Scholar] [CrossRef]
- Paoli, P.; Sbrana, F.; Tiribilli, B.; Caselli, A.; Pantera, B.; Cirri, P.; de Donatis, A.; Formigli, L.; Nosi, D.; Manao, G.; et al. Protein N-homocysteinylation induces the formation of toxic amyloid-like protofibrils. J. Mol. Biol. 2010, 400, 889–907. [Google Scholar] [CrossRef] [PubMed]
- Undas, A.; Perla, J.; Lacinski, M.; Trzeciak, W.; Kazmierski, R.; Jakubowski, H. Autoantibodies against N-homocysteinylated proteins in humans: Implications for atherosclerosis. Stroke J. Cereb. Circ. 2004, 35, 1299–1304. [Google Scholar] [CrossRef] [PubMed]
- Sauls, D.L.; Lockhart, E.; Warren, M.E.; Lenkowski, A.; Wilhelm, S.E.; Hoffman, M. Modification of fibrinogen by homocysteine thiolactone increases resistance to fibrinolysis: A potential mechanism of the thrombotic tendency in hyperhomocysteinemia. Biochemistry 2006, 45, 2480–2487. [Google Scholar] [CrossRef] [PubMed]
- Sauls, D.L.; Warren, M.; Hoffman, M. Homocysteinylated fibrinogen forms disulfide-linked complexes with albumin. Thromb. Res. 2011, 127, 576–581. [Google Scholar] [CrossRef] [PubMed]
- Liu, M.; Zhang, Z.; Zang, T.; Spahr, C.; Cheetham, J.; Ren, D.; Zhou, Z.S. Discovery of Undefined Protein Crosslinking Chemistry: A Comprehensive Methodology Utilizing 18O-labeling and Mass Spectrometry. Anal. Chem. 2013, 85, 5900–5908. [Google Scholar] [CrossRef] [PubMed]
- Chen, T.S.; Nayak, N.; Majee, S.M.; Lowenson, J.; Schafermeyer, K.R.; Eliopoulos, A.C.; Lloyd, T.D.; Dinkins, R.; Perry, S.E.; Forsthoefel, N.R.; et al. Substrates of the Arabidopsis thaliana Protein Isoaspartyl Methyltransferase 1 Identified Using Phage Display and Biopanning. J. Biol. Chem. 2010, 285, 37281–37292. [Google Scholar] [CrossRef] [PubMed]
- Ni, W.; Dai, S.; Karger, B.L.; Zhou, Z.S. Analysis of isoaspartic Acid by selective proteolysis with Asp-N and electron transfer dissociation mass spectrometry. Anal. Chem. 2010, 82, 7485–7491. [Google Scholar] [CrossRef] [PubMed]
- Liu, M.; Cheetham, J.; Cauchon, N.; Ostovic, J.; Ni, W.; Ren, D.; Zhou, Z.S. Protein isoaspartate methyltransferase-mediated 18O-labeling of isoaspartic acid for mass spectrometry analysis. Anal. Chem. 2012, 84, 1056–1062. [Google Scholar] [CrossRef] [PubMed]
- Dai, S.; Ni, W.; Patananan, A.N.; Clarke, S.G.; Karger, B.L.; Zhou, Z.S. Integrated proteomic analysis of major isoaspartyl-containing proteins in the urine of wild type and protein l-isoaspartate O-methyltransferase-deficient mice. Anal. Chem. 2013, 85, 2423–2430. [Google Scholar] [CrossRef] [PubMed]
- Liu, M.; Zhang, Z.; Cheetham, J.; Ren, D.; Zhou, Z.S. Discovery and characterization of a photo-oxidative histidine-histidine cross-link in IgG1 antibody utilizing 18O-labeling and mass spectrometry. Anal. Chem. 2014, 86, 4940–4948. [Google Scholar] [CrossRef] [PubMed]
- Liu, S.; Moulton, K.R.; Auclair, J.R.; Zhou, Z.S. Mildly acidic conditions eliminate deamidation artifact during proteolysis: Digestion with endoprotease Glu-C at pH 4.5. Amino Acids 2016, 48, 1059–1067. [Google Scholar] [CrossRef] [PubMed]
- Zhou, Z.S.; Smith, A.E.; Matthews, R.G. l-selenohomocysteine: One-step synthesis from l-selenomethionine and kinetic analysis as substrate for methionine synthases. Bioorg. Med. Chem. Lett. 2000, 10, 2471–2475. [Google Scholar] [CrossRef]
- Zang, T.; Lee, B.W.; Cannon, L.M.; Ritter, K.A.; Dai, S.; Ren, D.; Wood, T.K.; Zhou, Z.S. A naturally occurring brominated furanone covalently modifies and inactivates LuxS. Bioorg. Med. Chem. Lett. 2009, 19, 6200–6204. [Google Scholar] [CrossRef] [PubMed]
- Wang, Z.; Rejtar, T.; Zhou, Z.S.; Karger, B.L. Desulfurization of cysteine-containing peptides resulting from sample preparation for protein characterization by mass spectrometry. Rapid Commun. Mass Spectrom. 2010, 24, 267–275. [Google Scholar] [CrossRef] [PubMed]
- Zhao, G.; Zhou, Z.S. Vinyl sulfonium as novel proteolytic enzyme inhibitor. Bioorg. Med. Chem. Lett. 2001, 11, 2331–2335. [Google Scholar] [CrossRef]
- Chumsae, C.; Gifford, K.; Lian, W.; Liu, H.; Radziejewski, C.H.; Zhou, Z.S. Arginine modifications by methylglyoxal: Discovery in a recombinant monoclonal antibody and contribution to acidic species. Anal. Chem. 2013, 85, 11401–11409. [Google Scholar] [CrossRef] [PubMed]
- Sibrian-Vazquez, M.; Escobedo, J.O.; Lim, S.; Samoei, G.K.; Strongin, R.M. Homocystamides promote free-radical and oxidative damage to proteins. Proc. Natl. Acad. Sci. USA 2010, 107, 551–554. [Google Scholar] [CrossRef] [PubMed]
- Sharma, G.S.; Kumar, T.; Singh, L.R. N-homocysteinylation induces different structural and functional consequences on acidic and basic proteins. PLoS ONE 2014, 9, e116386. [Google Scholar] [CrossRef] [PubMed]
- Gurda, D.; Handschuh, L.; Kotkowiak, W.; Jakubowski, H. Homocysteine thiolactone and N-homocysteinylated protein induce pro-atherogenic changes in gene expression in human vascular endothelial cells. Amino Acids 2015, 47, 1319–1339. [Google Scholar] [CrossRef] [PubMed]
- Jakubowski, H. Pathophysiological consequences of homocysteine excess. J. Nutr. 2006, 136 (Suppl. 6), 1741S–1749S. [Google Scholar] [PubMed]
- Jakubowski, H. Quantification of urinary S- and N-homocysteinylated protein and homocysteine-thiolactone in mice. Anal. Biochem. 2016, 508, 118–123. [Google Scholar] [CrossRef] [PubMed]
- Ferguson, E.; Parthasarathy, S.; Joseph, J.; Kalyanaraman, B. Generation and initial characterization of a novel polyclonal antibody directed against homocysteine thiolactone-modified low density lipoprotein. J. Lipid Res. 1998, 39, 925–933. [Google Scholar] [PubMed]
- Zang, T.; Dai, S.; Chen, D.; Lee, B.W.; Liu, S.; Karger, B.L.; Zhou, Z.S. Chemical methods for the detection of protein N-homocysteinylation via selective reactions with aldehydes. Anal. Chem. 2009, 81, 9065–9071. [Google Scholar] [CrossRef] [PubMed]
- Fathe, K.; Person, M.D.; Finnell, R.H. The application of a chemical determination of N-homocysteinylation levels in developing mouse embryos: Implication for folate responsive birth defects. J. Nutr. Biochem. 2015, 26, 312–318. [Google Scholar] [CrossRef] [PubMed]
- Hodgson, N.W.; Waly, M.I.; Al-Farsi, Y.M.; Al-Sharbati, M.M.; Al-Farsi, O.; Ali, A.; Ouhtit, A.; Zang, T.Z.; Zhou, Z.S.; Deth, R.C. Decreased glutathione and elevated hair mercury levels are associated with nutritional deficiency-based autism in Oman. Exp. Biol. Med. 2014, 239, 697–706. [Google Scholar] [CrossRef] [PubMed]
- Alfaro, J.F.; Gillies, L.A.; Sun, H.G.; Dai, S.; Zang, T.; Klaene, J.J.; Kim, B.J.; Lowenson, J.D.; Clarke, S.G.; Karger, B.L.; et al. Chemo-enzymatic detection of protein isoaspartate using protein isoaspartate methyltransferase and hydrazine trapping. Anal. Chem. 2008, 80, 3882–3889. [Google Scholar] [CrossRef] [PubMed]
- Guttormsen, A.B.; Schneede, J.; Ueland, P.M.; Refsum, H. Kinetics of total plasma homocysteine in subjects with hyperhomocysteinemia due to folate or cobalamin deficiency. Am. J. Clin. Nutr. 1996, 63, 194–202. [Google Scholar] [PubMed]
- Herrmann, M.; Wildemann, B.; Wagner, A.; Wolny, M.; Schorr, H.; Taban-Shomal, O.; Umanskaya, N.; Ross, S.; Garcia, P.; Hübner, U.; et al. Experimental folate and vitamin B12 deficiency does not alter bone quality in rats. J. Bone Miner. Res. 2009, 24, 589–596. [Google Scholar] [CrossRef] [PubMed]
- Stangl, G.I.; Schwarz, F.J.; Jahn, B.; Kirchgessner, M. Cobalt-deficiency-induced hyperhomocysteinaemia and oxidative status of cattle. Br. J. Nutr. 2000, 83, 3–6. [Google Scholar] [CrossRef] [PubMed]
- Troen, A.M.; Shea-Budgell, M.; Shukitt-Hale, B.; Smith, D.E.; Selhub, J.; Rosenberg, I.H. B-vitamin deficiency causes hyperhomocysteinemia and vascular cognitive impairment in mice. Proc. Natl. Acad. Sci. USA 2008, 105, 12474–12479. [Google Scholar] [CrossRef] [PubMed]
- Eberhardt, R.T.; Forgione, M.A.; Cap, A.; Leopold, J.A.; Rudd, M.A.; Trolliet, M.; Heydrick, S.; Stark, R.; Klings, E.S.; Moldovan, N.I.; et al. Endothelial dysfunction in a murine model of mild hyperhomocyst(e)inemia. J. Clin. Investig. 2000, 106, 483–491. [Google Scholar] [CrossRef] [PubMed]
- Weiss, N.; Heydrick, S.; Zhang, Y.Y.; Bierl, C.; Cap, A.; Loscalzo, J. Cellular redox state and endothelial dysfunction in mildly hyperhomocysteinemic cystathionine beta-synthase-deficient mice. Arterioscler. Thromb. Vasc. Biol. 2002, 22, 34–41. [Google Scholar] [CrossRef] [PubMed]
- Wiese, S.; Reidegeld, K.A.; Meyer, H.E.; Warscheid, B. Protein labeling by iTRAQ: A new tool for quantitative mass spectrometry in proteome research. Proteomics 2007, 7, 340–350. [Google Scholar] [CrossRef] [PubMed]
- Camps, J.; Marsillach, J.; Joven, J. The paraoxonases: Role in human diseases and methodological difficulties in measurement. Crit. Rev. Clin. Lab. Sci. 2009, 46, 83–106. [Google Scholar] [CrossRef] [PubMed]
- Miller, L.L.; Bly, C.G.; Watson, M.L.; Bale, W.F. The dominant role of the liver in plasma protein synthesis; a direct study of the isolated perfused rat liver with the aid of lysine-epsilon-C14. J. Exp. Med. 1951, 94, 431–453. [Google Scholar] [CrossRef] [PubMed]
- Sikora, M.; Marczak, L.; Kubalska, J.; Graban, A.; Jakubowski, H. Identification of N-homocysteinylation sites in plasma proteins. Amino Acids 2014, 46, 235–244. [Google Scholar] [CrossRef] [PubMed]
- Araki, A.; Sako, Y. Determination of free and total homocysteine in human plasma by high-performance liquid chromatography with fluorescence detection. J. Chromatogr. B 1987, 422, 43–52. [Google Scholar] [CrossRef]
- Sample Availability: Samples of the compounds are available from the authors.


| B12 Deficiency * | Control Diet | ||
|---|---|---|---|
| Chemiluminescence Intensity | |||
| Band | Mean ± S.D. | Mean ± S.D. | p-Value |
| 1 | 1.2 ± 0.3 | 1.0 ± 0.4 | 0.3 |
| 2 | 1.3 ± 0.4 | 1.0 ± 0.3 | 0.2 |
| 3 | 1.3 ± 0.4 | 1.0 ± 0.3 | 0.2 |
| 4 | 1.2 ± 0.3 | 1.0 ± 0.2 | 0.2 |
| 5 | 1.2 ± 0.2 | 1.0 ± 0.2 | 0.09 |
| 6 | 1.3 ± 0.2 | 1.0 ± 0.2 | 0.03 |
| 7 | 1.4 ± 0.3 | 1.0 ± 0.2 | 0.009 |
| 8 | 1.4 ± 0.2 | 1.0 ± 0.3 | 0.04 |
| 9 | 1.2 ± 0.3 | 1.0 ± 0.3 | 0.2 |
| 10 | 1.5 ± 0.6 | 1.0 ± 0.4 | 0.09 |
| 11 | 1.8 ± 0.7 | 1.0 ± 0.4 | 0.03 |
| Overall | 1.3 ± 0.3 | 1.0 ± 0.2 | 0.08 |
| “Total homocysteine” (µM) | |||
| 31.1 ± 10.0 | 4.7 ± 0.8 | 5.00 × 10⁻⁵ | |
© 2016 by the authors. Licensee MDPI, Basel, Switzerland. This article is an open access article distributed under the terms and conditions of the Creative Commons Attribution (CC-BY) license ( http://creativecommons.org/licenses/by/4.0/).
Share and Cite
Zang, T.; Pottenplackel, L.P.; Handy, D.E.; Loscalzo, J.; Dai, S.; Deth, R.C.; Zhou, Z.S.; Ma, J. Comparison of Protein N-Homocysteinylation in Rat Plasma under Elevated Homocysteine Using a Specific Chemical Labeling Method. Molecules 2016, 21, 1195. https://doi.org/10.3390/molecules21091195
Zang T, Pottenplackel LP, Handy DE, Loscalzo J, Dai S, Deth RC, Zhou ZS, Ma J. Comparison of Protein N-Homocysteinylation in Rat Plasma under Elevated Homocysteine Using a Specific Chemical Labeling Method. Molecules. 2016; 21(9):1195. https://doi.org/10.3390/molecules21091195
Chicago/Turabian StyleZang, Tianzhu, Ligi Paul Pottenplackel, Diane E. Handy, Joseph Loscalzo, Shujia Dai, Richard C. Deth, Zhaohui Sunny Zhou, and Jisheng Ma. 2016. "Comparison of Protein N-Homocysteinylation in Rat Plasma under Elevated Homocysteine Using a Specific Chemical Labeling Method" Molecules 21, no. 9: 1195. https://doi.org/10.3390/molecules21091195
APA StyleZang, T., Pottenplackel, L. P., Handy, D. E., Loscalzo, J., Dai, S., Deth, R. C., Zhou, Z. S., & Ma, J. (2016). Comparison of Protein N-Homocysteinylation in Rat Plasma under Elevated Homocysteine Using a Specific Chemical Labeling Method. Molecules, 21(9), 1195. https://doi.org/10.3390/molecules21091195