
Simultaneous Quantitation of Free Amino Acids, Nucleosides and Nucleobases in Sipunculus nudus by Ultra-High Performance Liquid Chromatography with Triple Quadrupole Mass Spectrometry

 ,
,
Abstract
:1. Introduction
2. Results and Discussion
2.1. Sample Preparation Optimization
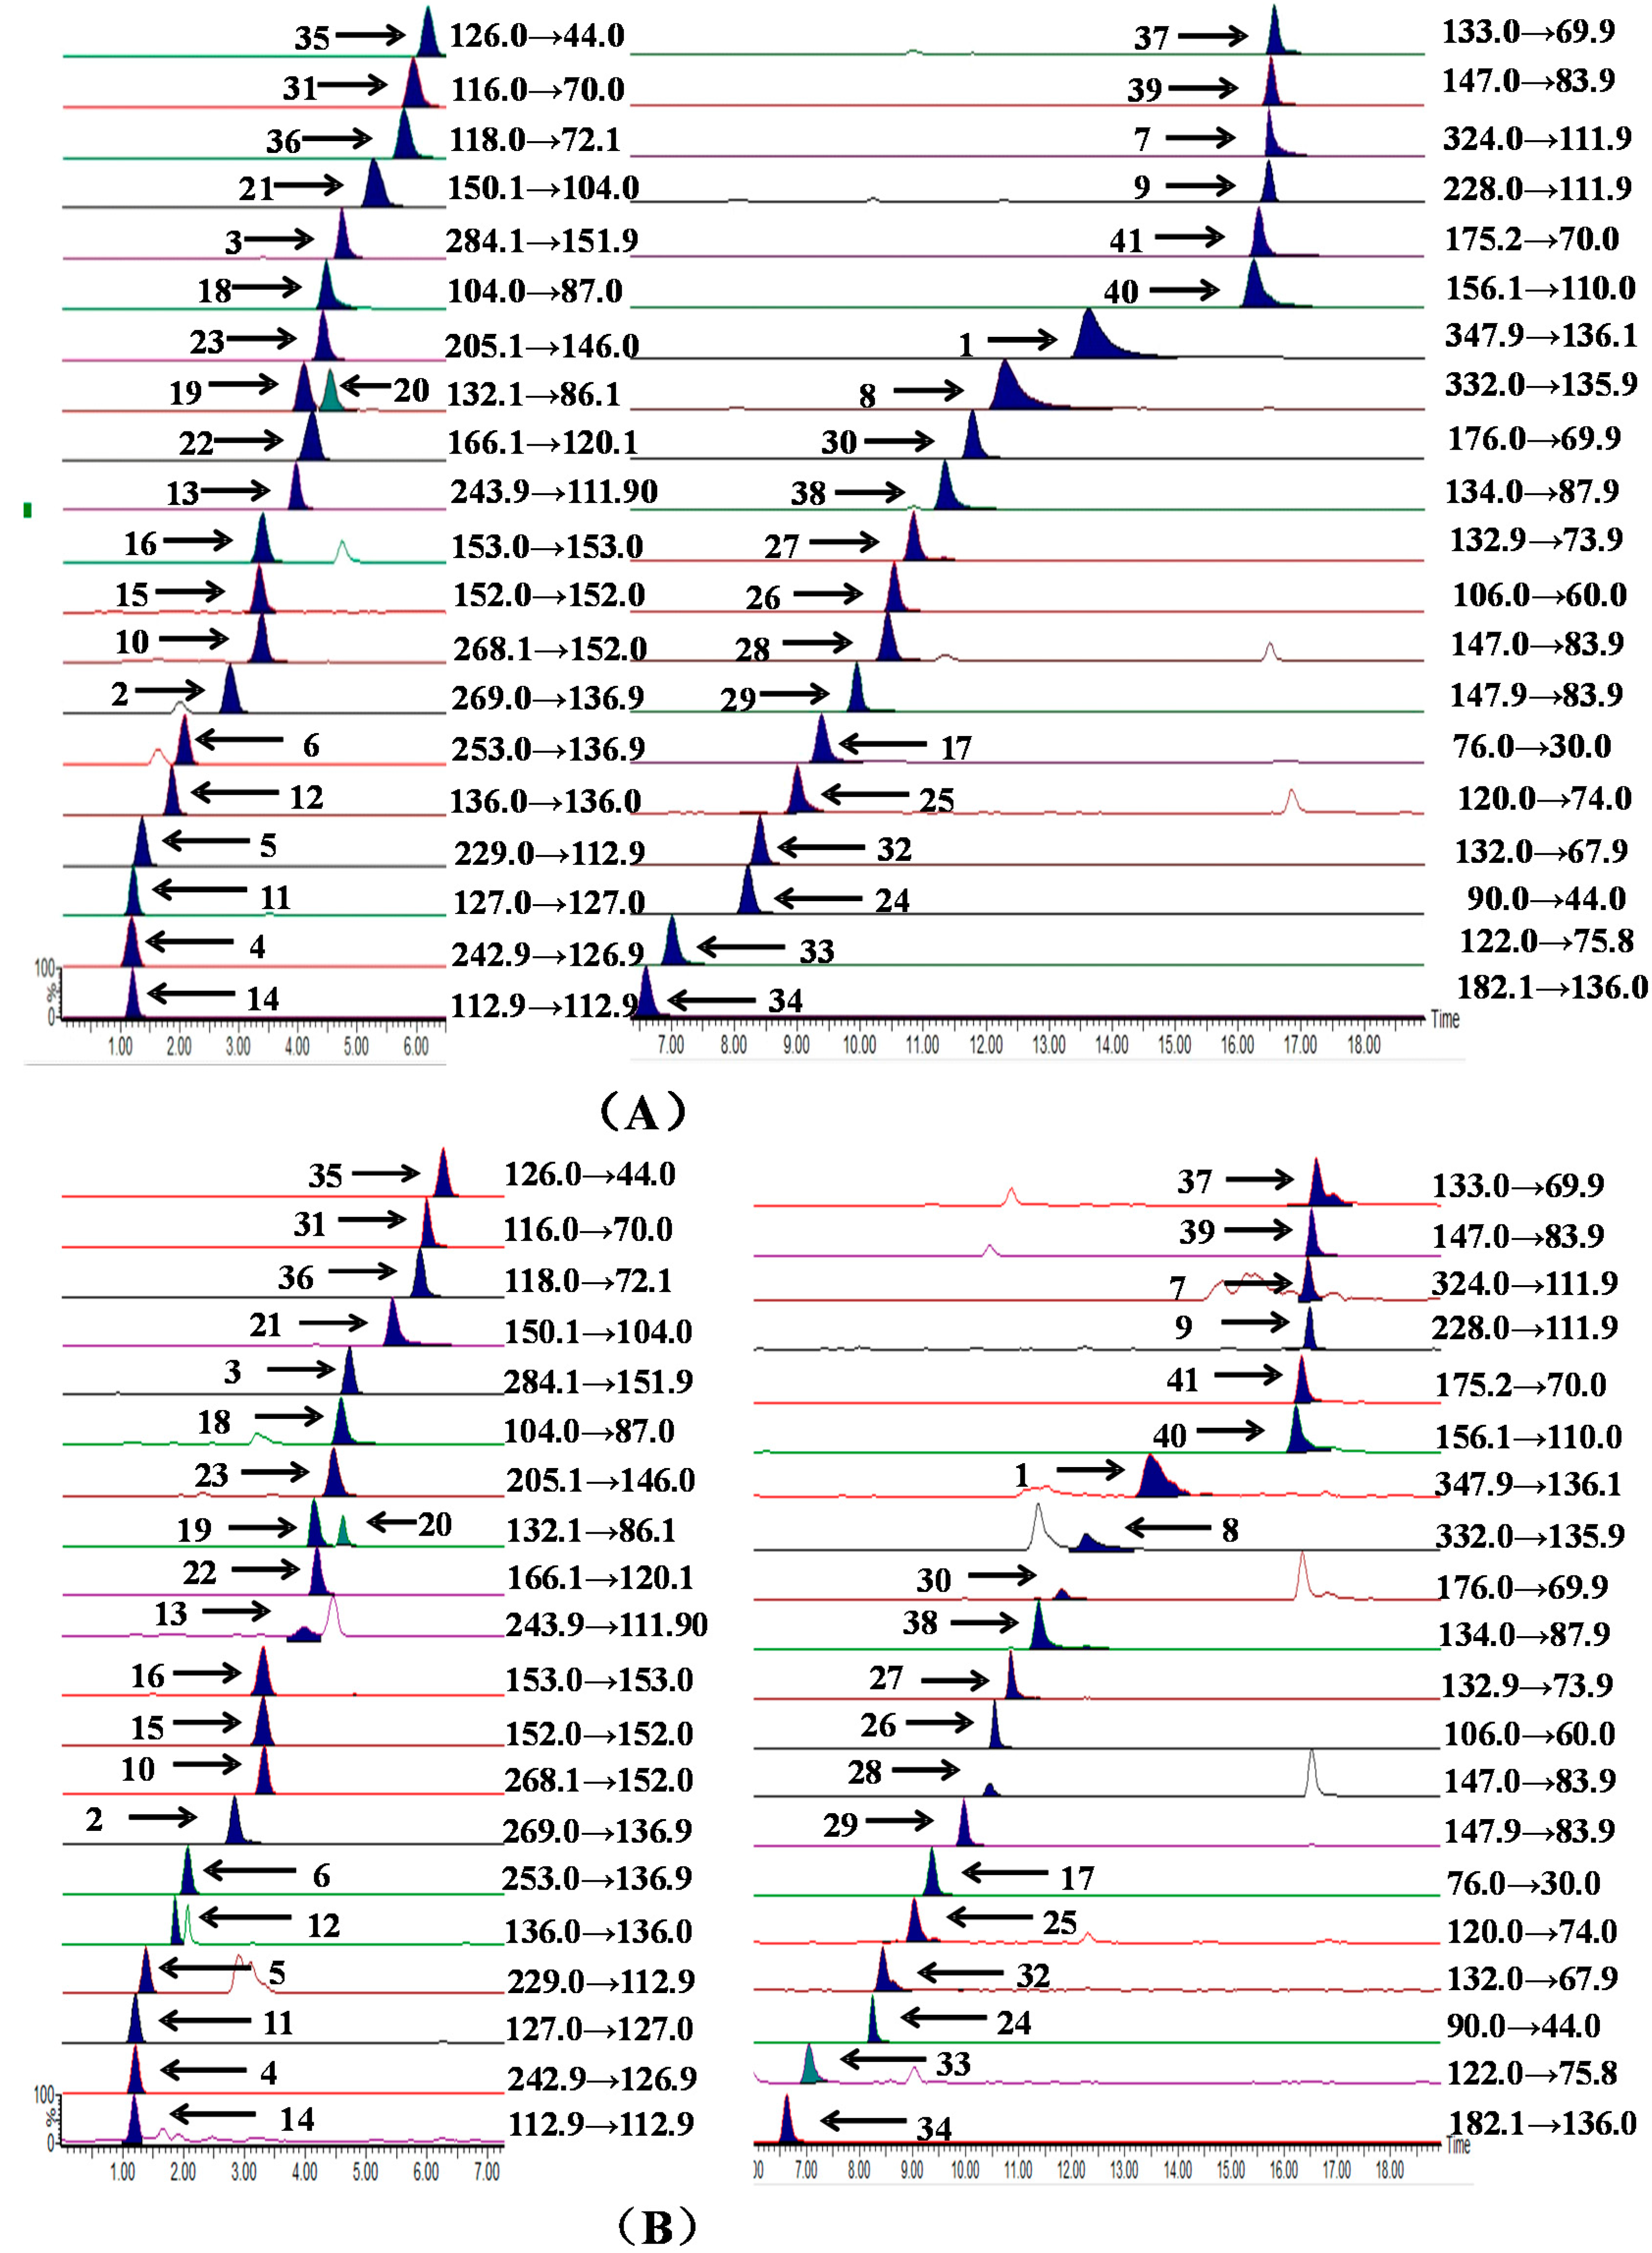
2.2. UPLC-TQ-MS/MS Conditions Optimization
2.3. Method Validation
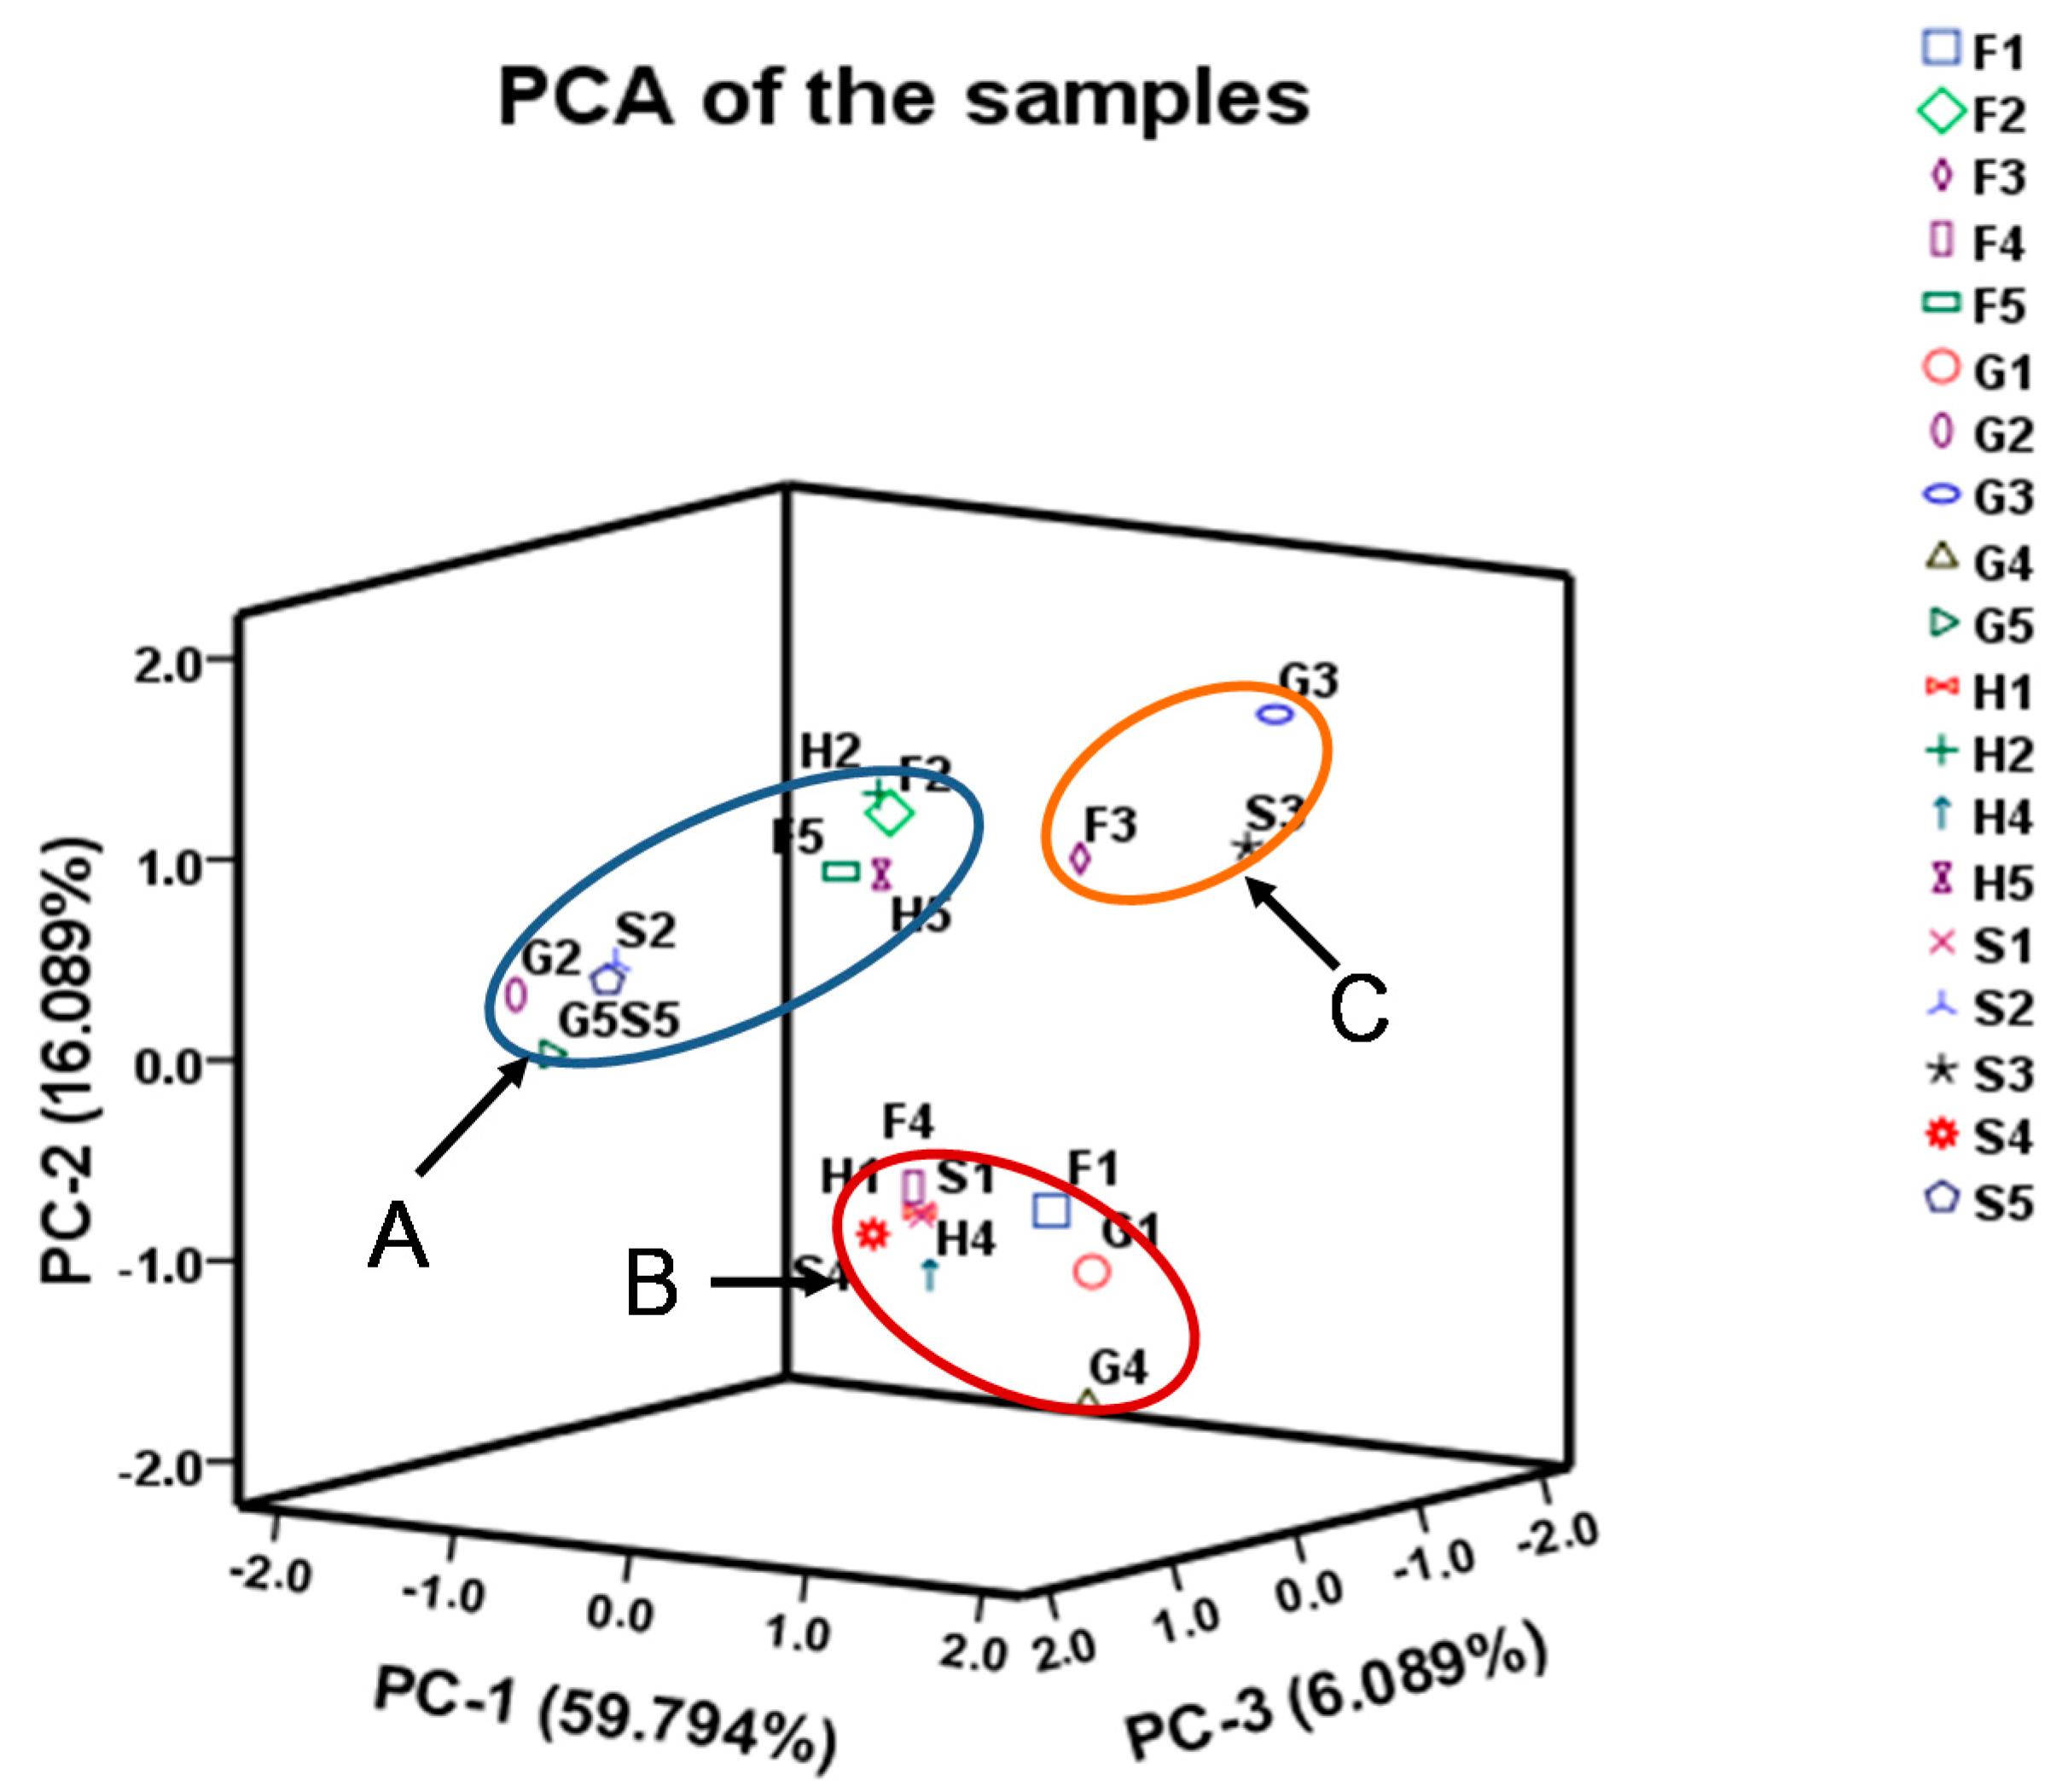
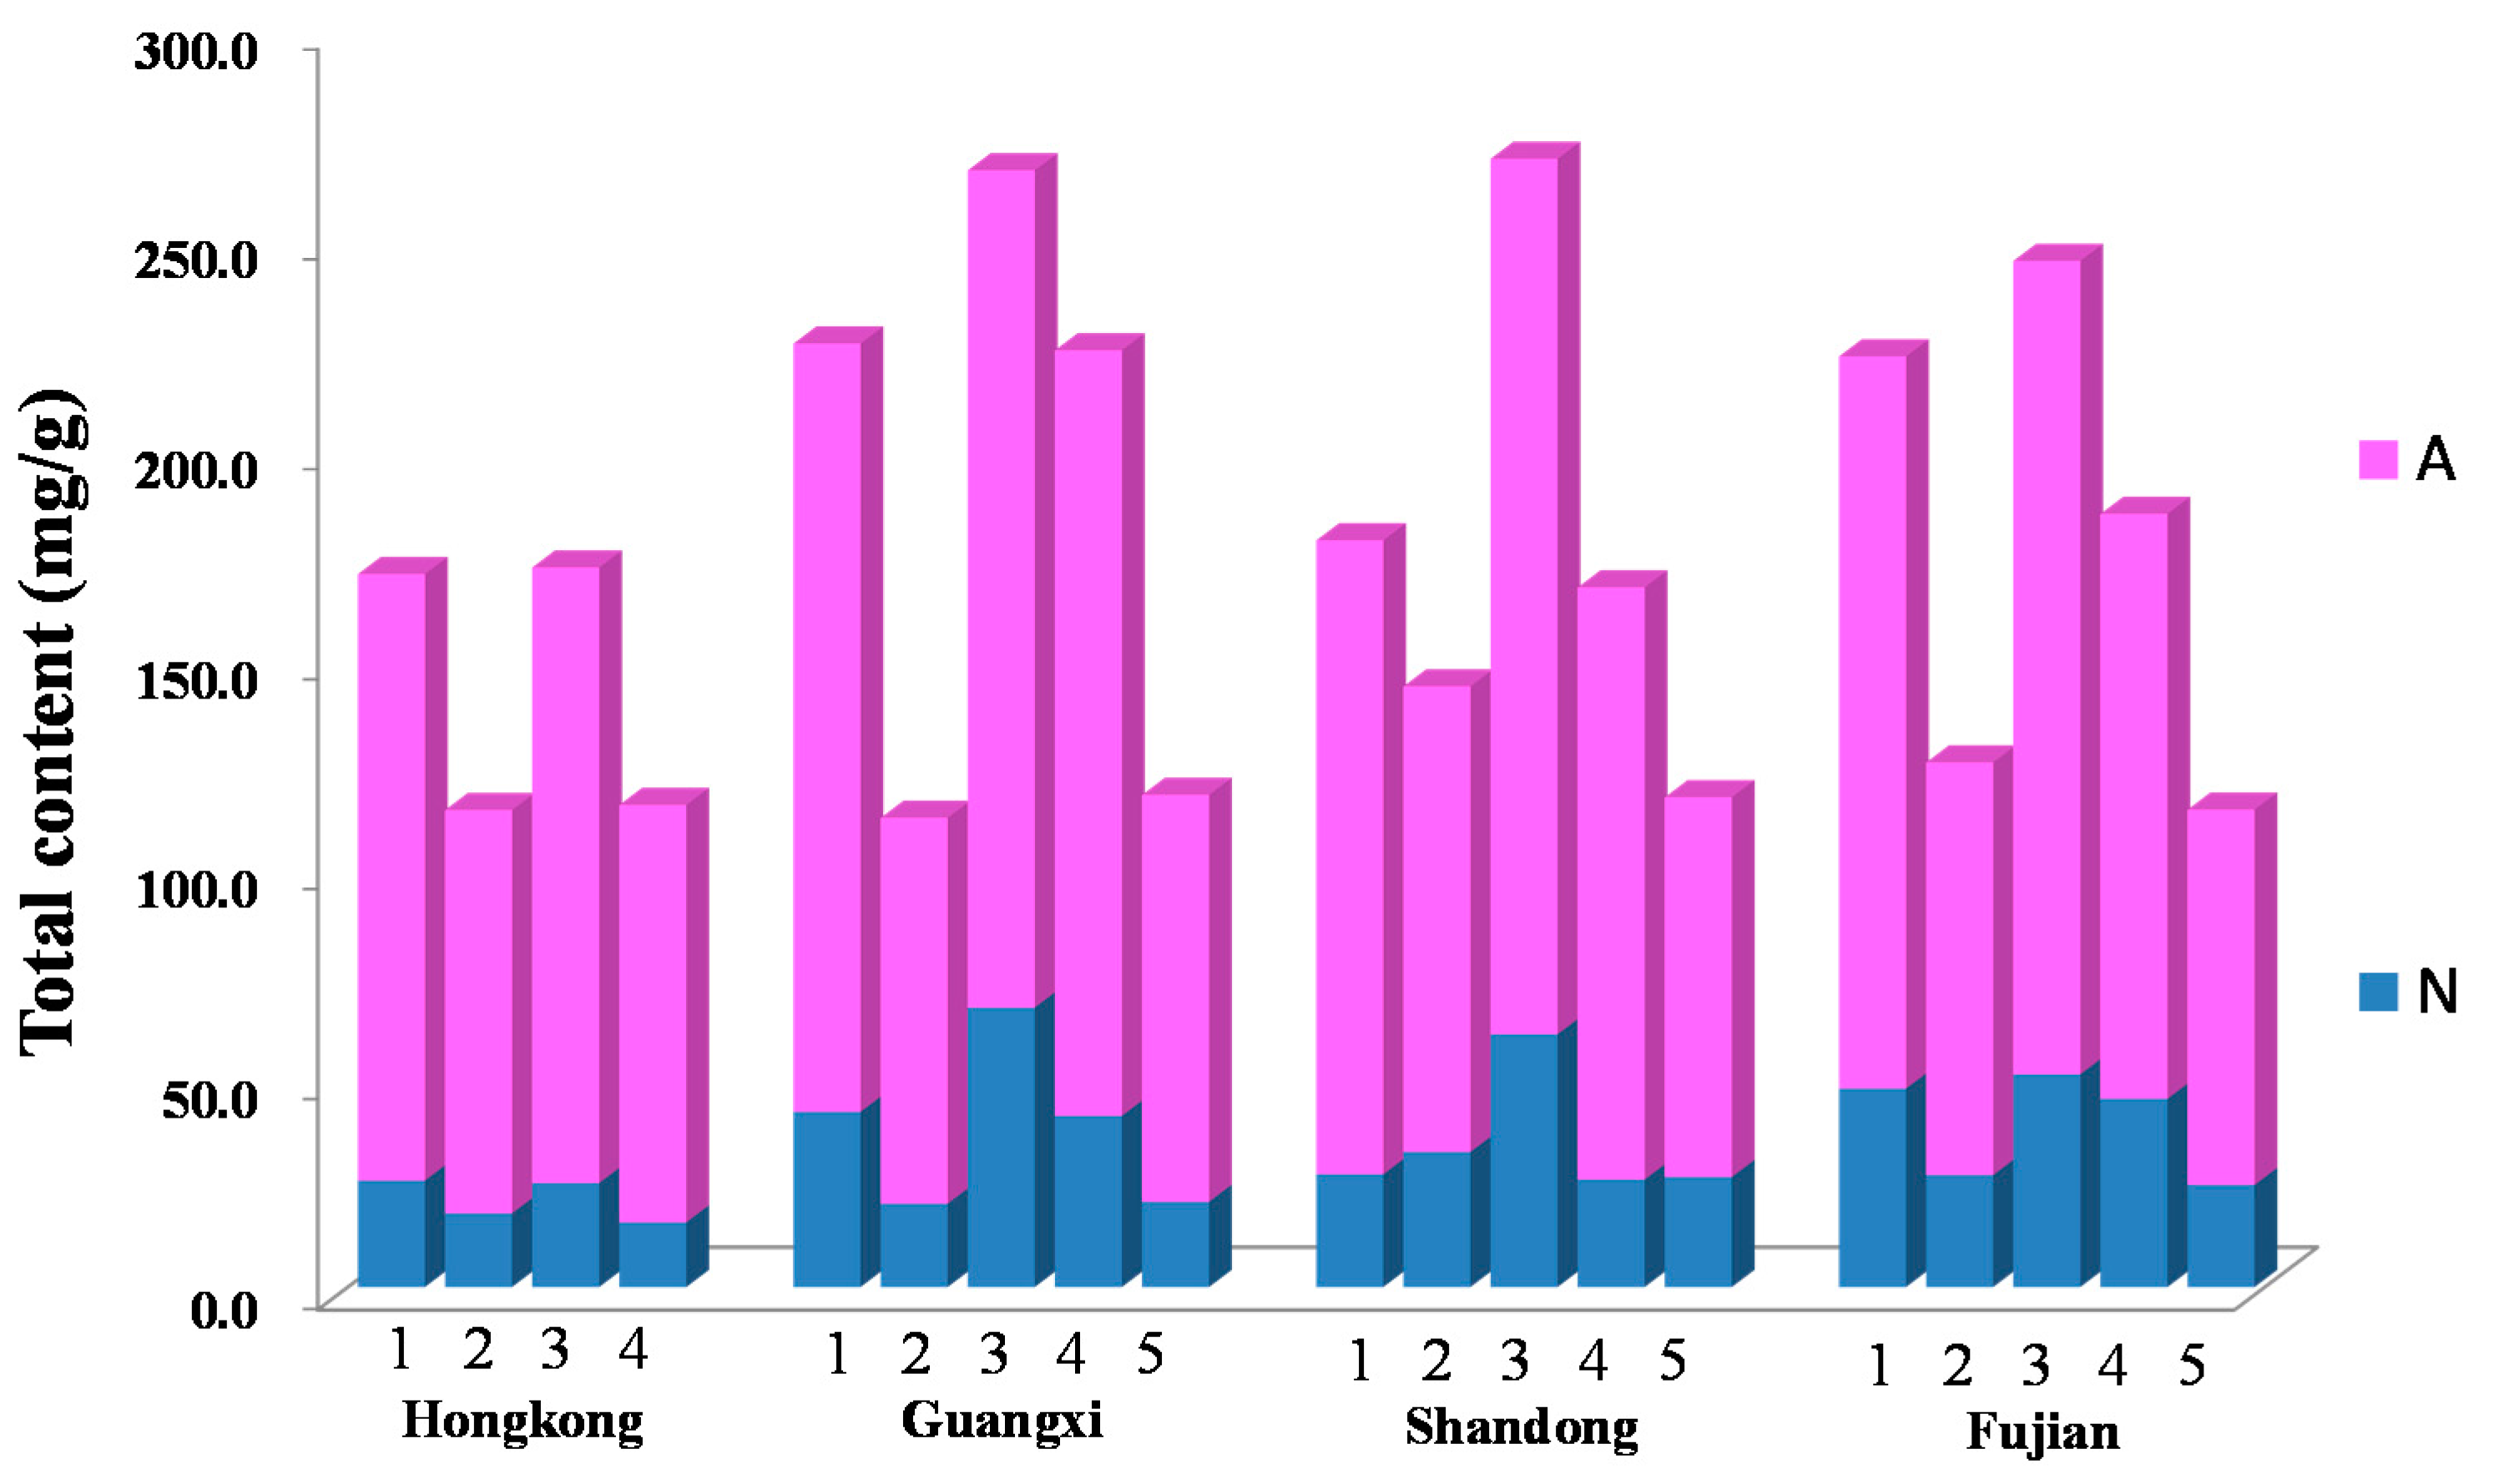
2.4. Sample Analysis
3. Materials and Methods
3.1. Reagents and Materials
3.2. Sample Preparation
3.3. UPLC-TQ-MS/MS Conditions
3.4. Data Processing
3.5. Method Validation
4. Conclusions
Supplementary Files
Supplementary File 1Acknowledgments
Author Contributions
Conflicts of Interest
References
- Pancucci-Papadopoulou, M.A.; Murina, G.V.V.; Zenetos, A. The Phylum Sipuncula in the Mediterranean Sea; Aghios Kosmas: Athens, Greece, 1999; p. 15. [Google Scholar]
- State Administration of Traditional Chinese Medicine. Chinese Materia Medica; Shanghai Scientific and Technical Publishers: Shanghai, China, 2000; p. 7948. [Google Scholar]
- Li, K.X.; Shen, X.R.; He, Y.; Jiang, D.W.; Liu, Y.M.; Hou, D.Y.; Chen, W. Effect of Sipunculus nudus polysaccharides on immunological function in mice. Chin. J. Mar. Drugs 2012, 31, 46–49. [Google Scholar]
- Zhang, G.H.; Zhao, M.M.; Wu, G.H. The nutritional components of enzymatic hydrolysate from Sipunculus nudus and effects on anti-oxidation. J. Food Sci. Biotechnol. 2007, 26, 80–84. [Google Scholar]
- Chen, J.; Liu, Z.G.; Li, L.Y.; He, Y.C. Acute toxicity of three drugs acting on nymph of Sipunculus nudus. South China Fish. Sci. 2009, 5, 54–58. [Google Scholar]
- Dong, L.F.; Zhang, Q.; Tong, T.; Xu, M.Z.; Chen, J.H. Amino acid composition of peanut worm Sipunculus nudus at different growth stages. South China Fish. Sci. 2012, 8, 60–65. [Google Scholar]
- Zhang, G.H.; Zhao, M.M.; Wang, W. Isolation, Purification and Property Identification of Polysaccharide Contained in Sipunculus nudus. J. Food Sci. Biotechnol. 2006, 25, 63–66. [Google Scholar]
- Hu, X.C. Some Trace Elements in Sipunculids. Fish. Sci. 2005, 24, 12–14. [Google Scholar]
- Lei, D.Q.; Li, X.X.; Liao, G.S. Study of Fibrinolytic Enzyme from Sipunculus nudus Linnaeus in Guangxi Coastal Area. Nat. Prod. Res. Dev. 2013, 25, 897–902. [Google Scholar]
- Guo, S.; Duan, J.A.; Qian, D.W.; Tang, Y.P.; Qian, Y.F.; Wu, D.W.; Su, S.L.; Shang, E.X. Rapid Determination of amino acids in fruits of Ziziphus jujube by hydrophilic interaction ultra-high-performance liquid chromatography coupled with triple-quadrupole mass spectrometry. J. Agric. Food Chem. 2013, 61, 2709–2719. [Google Scholar] [CrossRef] [PubMed]
- Wu, L.M.; Chen, L.Z.; Selvaraj, J.N.; Wei, Y.; Wang, Y.; Li, Y.; Zhao, J.; Xue, X.F. Identification of the distribution of adenosine phosphates, nucleosides and nucleobases in royal jelly. Food Chem. 2015, 173, 1111–1118. [Google Scholar] [CrossRef] [PubMed]
- Kong, W.J.; Jin, C.; Xiao, X.H.; Zhao, Y.L.; Liu, W.; Li, Z.L.; Zhang, P. Determination of multicomponent contents in Calculus bovis by ultra-performance liquid chromatography-evaporative light scattering detection and its application for quality control. J. Sep. Sci. 2010, 33, 1518–1527. [Google Scholar] [CrossRef] [PubMed]
- Zhang, X.M.; Yang, F.Q.; Xia, Z.N. Recent advances in research on pharmaceutical functions of nucleosides and nucleotides in dietary foods. Food Sci. 2012, 33, 277–282. [Google Scholar]
- Szterk, A.; Roszko, M. Simultaneous determination of free amino acids, L-Carnosine, purine, pyrimidine, and nucleosides in meat by liquid chromatography/single quadrupole mass spectrometry. J. Liq. Chromatogr. Relat. Technol. 2014, 37, 664–680. [Google Scholar] [CrossRef]
- Chen, P.; Li, W.; Li, Q.; Wang, Y.H.; Li, Z.G.; Ni, Y.F. Identification and quantification of nucleosides and nucleobases in Geosaurus and Leech by hydrophilic-interaction chromatography. Talanta 2011, 85, 1634–1641. [Google Scholar] [CrossRef] [PubMed]
- Cao, Y.; Duan, J.A.; Guo, J.M.; Guo, S. Rapid determination of nucleosides, nucleobases and free amino acids in brown seaweeds using ultra-performance liquid chromatography coupled with triple quadrupole mass spectrometry. J. Appl. Phycol. 2014, 26, 675–686. [Google Scholar] [CrossRef]
- Yang, F.Q.; Zhang, X.M.; Ge, L.Y.; Tan, S.N. Determination of nucleosides and related compounds in Ganoderma. by CE-MS. J. China Pharm. Univ. 2011, 42, 337–341. [Google Scholar]
- Cunico, R.L.; Schlabach, T. Comparison of ninhydrin and O-phthalaldehyde post-column detection techniques for high-performance liquid chromatography of free amino acids. J. Chromatogr. A 1983, 266, 461–470. [Google Scholar] [CrossRef]
- Núñez, O.; Gallart-Ayala, H.; Martins, C.P.B.; Lucci, P. New trends in fast liquid chromatography for food and environmental analysis. J. Chromatogr. A 2012, 1228, 298–323. [Google Scholar] [CrossRef] [PubMed]
- Koolen, H.H.F.; Silva, F.M.A.; Gozzo, F.C.; Souza, A.Q.L.; Souza, A.D.L. Antioxidant, antimicrobial activities and characterization of phenolic compounds from buriti (Mauritia flexuosa L.f.) by UPLC-ESI-MS/MS. Food Res. Int. 2013, 51, 467–473. [Google Scholar] [CrossRef]
- Lerma-García, M.J.; Simó-Alfonso, E.F.; Méndez, A.; Liliberia, J.L.; Herrero-Martínez, J.M. Classification of extra virgin olive oils according to their genetic variety using linear discriminant analysis of sterol profiles established by ultra-performance liquid chromatography with mass spectrometry detection. Food Res. Int. 2011, 44, 103–108. [Google Scholar] [CrossRef]
- Zhang, W.D.; Wang, P.Y.; Wang, Y.; Wang, Q.; Gu, Y.; Cao, J.; Wang, S.Q.; Wang, X.J. Simultaneous determination of aurantio-obtusin, chrysoobtusin, obtusin and 1-desmethylobtusin in rat plasma by UHPLC-MS/MS. Biomed. Chromatogr. 2014, 28, 369–374. [Google Scholar] [CrossRef] [PubMed]
- Li, S.P.; Li, P.; Lai, C.M.; Gong, Y.X.; Kan Kelvin, K.W.; Dong Tina, T.X.; Tsim Karl, W.K.; Wang, Y.T. Simultaneous determination of ergosterol, nucleosides and their bases from natural and cultured Cordyceps by pressurized liquid extraction and high-performance liquid chromatography. J. Chromatogr. A 2004, 1036, 239–243. [Google Scholar] [CrossRef] [PubMed]
- Le Deun, E.; Van Der Werf, R.; Le Bail, G.; Le Quéré, J.M.; Guyot, S. HPLC-DAD-MS profiling of polyphenols responsible for the yellow-orange color in apple juices of different French cider apple varieties. J. Agric. Food Chem. 2015, 63, 7675–7684. [Google Scholar] [CrossRef] [PubMed]
- Bataglion, G.A.; Silva, F.M.A.; Eberlin, M.N.; Koolen, H.H.F. Simultaneous quantification of phenolic compounds in buriti fruit (Mauritia flexuosa L.f.) by ultra-high performance liquid chromatography coupled to tendem mass spectrometry. Food Res. Int. 2014, 66, 396–400. [Google Scholar] [CrossRef]
- Bajad, S.U.; Lu, W.; Kimball, E.H.; Yuan, J.; Peterson, C.; Rabinowitz, J.D. Separation and quantitation of water soluble cellular metabolites by hydrophilic interaction chromatography-tandem mass spectrometry. J. Chromatogr. A 2006, 1125, 76–78. [Google Scholar] [CrossRef] [PubMed]
- Ge, Y.H.; Tang, Y.P.; Guo, S.; Liu, X.; Zhu, Z.H.; Liu, P.; Duan, J.A. Comparative analysis of amino acids, nucleosides, and nucleobases in Thais clavigera from different distribution regions by using hydrophilic interaction ultra-performance liquid chromatography coupled with triple quadrupole tandem mass spectrometry. Int. J. Anal. Chem. 2015. [Google Scholar] [CrossRef] [PubMed]
- Ubhi, B.K.; Davenport, P.W.; Welch, M.; Riley, J.; Griffin, J.L.; Connor, S.C. Analysis of chloroformate-derivatised amino acids, dipeptides and polyamines by LC–MS/MS. J. Chromatogr. B 2013, 934, 79–88. [Google Scholar] [CrossRef] [PubMed]
- Guo, S.; Duan, J.A.; Qian, D.W.; Wang, H.Q.; Tang, Y.P.; Qian, Y.F.; Wu, D.W.; Su, S.L.; Shang, E.X. Hydrophilic interaction ultra-high performance liquid chromatography coupled with triple quadrupole mass spectrometry for determination of nucleotides, nucleosides and nucleobases in Ziziphus plants. J. Chromatogr. A 2013, 1301, 147–155. [Google Scholar] [CrossRef] [PubMed]
- Zhou, G.S.; Pang, H.Q.; Tang, Y.P.; Yao, X.; Mo, X.; Zhu, S.Q.; Guo, S.; Qian, D.W.; Qian, Y.F.; Su, S.L.; et al. Hydrophilic interaction ultra-performance liquid chromatography coupled with triple-quadrupole tandem mass spectrometry for highly rapid and sensitive analysis of underivatized amino acids in functional foods. Amino Acids 2013, 44, 1293–1305. [Google Scholar] [CrossRef] [PubMed]
- Kasai, H. Analysis of a form of oxidative DNA damage, 8-hydroxy-2′-deoxyguanosine, as a marker of cellular oxidative stress during carcinogenesis. Mutat. Res. 1998, 387, 147–163. [Google Scholar] [CrossRef]
- Alford, C.; Cox, H.; Wescott, R. The effect of Red Bull Energy Drink on human performance and mood. Amino Acids 2001, 21, 139–150. [Google Scholar] [CrossRef] [PubMed]
- He, Y.; Shen, X.R.; Jiang, D.W.; Liu, Y.M.; Qian, T.T.; Mo, L.F. Effects of Sipunculus. nudus polysaccharides on learning and memory in memory obstruction model mice. Chin. J. Mar. Drug 2012, 31, 38–41. [Google Scholar]
- Liu, Y.M.; Qian, T.T.; Mo, L.F.; He, Y.; Jiang, S.Q.; Shen, X.R. Study on the antifatigue effects of polysaccharides from Sipunculus nudus in mice. Chin. J. Mar. Drug 2012, 31, 41–44. [Google Scholar]
- Sample Availability: Not available.


| NO | Analytes | MW | RT (min) | MRM Transitions | Cone Voltage (V) | Collision Energy (eV) |
|---|---|---|---|---|---|---|
| 1 | Adenosine-5′-monophosphate | 391 | 13.75 | 347.9→136.1 | 20 | 20 |
| 2 | Inosine | 268 | 2.96 | 269.0→136.9 | 10 | 14 |
| 3 | Guanosine | 283 | 4.88 | 284.1→151.9 | 14 | 14 |
| 4 | Thymidine | 242 | 1.34 | 242.9→126.9 | 10 | 10 |
| 5 | 2′-Deoxyuridine | 228 | 1.46 | 229.0→112.9 | 8 | 10 |
| 6 | 2′-Deoxyinosine | 252 | 2.19 | 253.0→136.9 | 22 | 12 |
| 7 | Cytidine-5′-monophosphate | 323 | 16.72 | 324.0→111.9 | 16 | 14 |
| 8 | 2′-Deoxyadenosine-5′-mono-phosphate | 329 | 12.53 | 332.0→135.9 | 20 | 16 |
| 9 | 2′-Deoxycytidine | 227 | 16.65 | 228.0→111.9 | 28 | 10 |
| 10 | 2′-Deoxyguanosine | 267 | 3.55 | 268.1→152.0 | 10 | 12 |
| 11 | Thymine | 126 | 1.45 | 127.0→127.0 | 30 | 15 |
| 12 | Adenine | 135 | 2.17 | 136.0→136.0 | 30 | 20 |
| 13 | Cytidine | 243 | 4.17 | 243.9→111.9 | 28 | 10 |
| 14 | Uracil | 112 | 1.20 | 112.9→112.9 | 30 | 15 |
| 15 | Guanine | 151 | 3.58 | 152.0→152.0 | 30 | 20 |
| 16 | Xanthine | 152 | 3.60 | 153.0→153.0 | 30 | 20 |
| 17 | Glycine | 75 | 9.53 | 76.0→30.0 | 12 | 6 |
| 18 | GABA | 103 | 4.86 | 104.0→87.0 | 16 | 10 |
| 19 | Leucine | 131 | 3.93 | 132.1→86.1 | 16 | 10 |
| 20 | Isoleucine | 131 | 4.75 | 132.1→86.1 | 16 | 10 |
| 21 | Methionine | 149 | 5.25 | 150.1→104.0 | 14 | 10 |
| 22 | Phenylalanine | 165 | 4.32 | 166.1→120.1 | 18 | 14 |
| 23 | Tryptophan | 204 | 4.80 | 205.1→146.0 | 16 | 18 |
| 24 | Alanine | 89 | 8.46 | 90.0→44.0 | 16 | 10 |
| 25 | Threonine | 119 | 9.10 | 120.0→74.0 | 38 | 20 |
| 26 | Serine | 105 | 10.65 | 106.0→60.0 | 14 | 8 |
| 27 | Asparagine | 132 | 10.81 | 132.9→73.9 | 12 | 14 |
| 28 | Glutamine | 146 | 10.60 | 147.0→83.9 | 8 | 16 |
| 29 | Glutamate | 147 | 10.11 | 147.9→83.9 | 12 | 14 |
| 30 | Citrulline | 175 | 11.98 | 176.0→69.9 | 16 | 20 |
| 31 | Proline | 131 | 5.95 | 116.0→70.0 | 20 | 10 |
| 32 | Hydroxyproline | 131 | 8.61 | 132.0→67.9 | 18 | 16 |
| 33 | Cysteine | 121 | 7.15 | 122.0→75.8 | 14 | 17 |
| 34 | Tyrosine | 181 | 6.74 | 182.1→136.0 | 16 | 16 |
| 35 | Taurine | 125 | 6.27 | 126.0→44.0 | 24 | 14 |
| 36 | Valine | 117 | 5.65 | 118.0→72.1 | 12 | 10 |
| 37 | Ornithine | 132 | 17.01 | 133.0→69.9 | 14 | 14 |
| 38 | Aspartate | 133 | 11.68 | 132.9→73.9 | 12 | 14 |
| 39 | Lysine | 146 | 16.77 | 147.0→83.9 | 14 | 14 |
| 40 | Histidine | 155 | 16.53 | 156.1→110.0 | 22 | 14 |
| 41 | Arginine | 174 | 16.68 | 175.2→70.0 | 22 | 18 |
| Analyte a | Calibration Curve | r2 | Linear Range (μg/mL) | LOD (μg/mL) | LOQ (μg/mL) | Precision RSD, %, n = 6 | Repeatablity (RSD%) (n = 6) | Stability (RSD%) (n = 6) | Recovery (%, n = 3) | Matrix Effect b | ||
|---|---|---|---|---|---|---|---|---|---|---|---|---|
| Intraday | Interday | Mean | RSD | |||||||||
| 1 | y = 3470.2X − 4115.1 | 0.9975 | 0.57–28.25 | 0.023 | 0.077 | 1.34 | 0.89 | 3.05 | 3.71 | 99.72 | 1.91 | 0.95 |
| 2 | y = 17,200.4X + 4024.2 | 0.9982 | 0.15–7.69 | 0.021 | 0.069 | 1.02 | 1.03 | 3.03 | 4.92 | 99.86 | 2.87 | 0.92 |
| 3 | y = 12,693.4X + 481.18 | 0.9998 | 0.24–11.75 | 0.007 | 0.025 | 0.75 | 0.39 | 2.57 | 2.27 | 105.13 | 3.47 | 1.02 |
| 4 | y = 5675.6X − 847.53 | 0.9951 | 1.17–58.50 | 0.033 | 0.110 | 2.84 | 2.92 | 3.12 | 4.90 | 98.65 | 1.11 | 0.93 |
| 5 | y = 651.92X + 50.414 | 0.9996 | 0.51–25.25 | 0.080 | 0.267 | 2.65 | 2.90 | 2.38 | 4.66 | 94.64 | 1.54 | 0.98 |
| 6 | y = 8691.2X − 303.63 | 0.9999 | 1.09–54.50 | 0.015 | 0.050 | 2.03 | 2.22 | 3.03 | 3.43 | 98.56 | 2.54 | 0.92 |
| 7 | y = 5984.3X − 5771.5 | 0.9997 | 0.61–30.25 | 0.032 | 0.106 | 1.42 | 1.05 | 1.73 | 2.15 | 102.73 | 2.01 | 0.94 |
| 8 | y = 13,359.8X − 12,482 | 0.9992 | 0.49–24.50 | 0.083 | 0.278 | 1.43 | 0.70 | 3.11 | 2.17 | 104.49 | 2.41 | 0.96 |
| 9 | y = 31,588X − 42,789 | 0.9928 | 0.29–14.50 | 0.003 | 0.008 | 2.98 | 3.02 | 2.55 | 1.36 | 99.59 | 3.14 | 1.01 |
| 10 | y = 11,200X − 9094.5 | 0.9961 | 0.86–43.13 | 0.012 | 0.041 | 3.72 | 2.74 | 2.12 | 3.31 | 101.85 | 2.86 | 0.97 |
| 11 | y = 10,862.6X + 510.08 | 0.9999 | 1.60–79.69 | 0.078 | 0.261 | 0.99 | 1.03 | 3.71 | 2.42 | 98.43 | 1.13 | 0.94 |
| 12 | y = 83,008X + 23,366 | 0.9923 | 0.11–5.37 | 0.040 | 0.131 | 1.04 | 1.16 | 2.73 | 2.90 | 101.53 | 3.76 | 0.93 |
| 13 | y = 338.72X − 22.948 | 0.9985 | 0.29–14.25 | 0.074 | 0.247 | 0.88 | 0.98 | 1.51 | 3.60 | 98.01 | 1.76 | 1.03 |
| 14 | y = 1246.64X − 83.519 | 0.9999 | 0.56–27.75 | 0.204 | 0.681 | 1.39 | 1.98 | 2.43 | 3.12 | 99.76 | 2.03 | 0.98 |
| 15 | y = 3587.4X + 351.61 | 0.9995 | 1.19–59.38 | 0.021 | 0.071 | 3.10 | 3.42 | 2.76 | 3.39 | 100.04 | 2.86 | 0.91 |
| 16 | y = 396.14X − 47.85 | 0.9969 | 0.35–17.66 | 0.229 | 0.763 | 1.52 | 1.53 | 3.01 | 2.55 | 102.24 | 1.78 | 0.93 |
| 17 | y = 457X + 281.7 | 0.9973 | 1.80–90.00 | 0.204 | 0.683 | 0.98 | 0.15 | 2.78 | 2.91 | 102.08 | 2.18 | 0.95 |
| 18 | y = 66,192X + 262.14 | 0.9919 | 0.29–14.44 | 0.031 | 0.105 | 0.25 | 0.29 | 2.33 | 3.88 | 106.69 | 0.64 | 0.97 |
| 19 | y = 66,398X + 140,788 | 0.9925 | 1.78–89.07 | 0.018 | 0.059 | 0.45 | 0.51 | 2.53 | 3.95 | 96.86 | 3.07 | 0.92 |
| 20 | y = 33,258X + 18,095 | 0.9922 | 0.31–15.23 | 0.031 | 0.105 | 0.76 | 0.77 | 1.72 | 4.23 | 104.21 | 3.08 | 0.96 |
| 21 | y = 11,852.6X − 1761.7 | 0.9997 | 0.91–45.70 | 0.016 | 0.055 | 1.14 | 0.93 | 2.70 | 3.11 | 101.27 | 2.36 | 0.97 |
| 22 | y = 29,260X + 15,598 | 0.9968 | 0.34–16.88 | 0.023 | 0.076 | 1.93 | 2.13 | 2.13 | 2.10 | 99.63 | 1.53 | 0.92 |
| 23 | y = 10,330.4X + 358.31 | 0.9999 | 1.95–97.66 | 0.040 | 0.132 | 0.57 | 0.58 | 1.36 | 4.33 | 100.78 | 3.09 | 0.93 |
| 24 | y = 6520.8X + 1836.6 | 0.9999 | 0.57–28.28 | 0.060 | 0.200 | 1.39 | 1.37 | 1.44 | 3.86 | 99.45 | 2.60 | 0.93 |
| 25 | y = 103.41X + 374.97 | 0.9940 | 0.35–17.70 | 0.098 | 0.325 | 1.75 | 2.01 | 3.33 | 3.31 | 104.37 | 1.47 | 1.02 |
| 26 | y = 2565.1X + 1383.7 | 0.9992 | 0.34–16.88 | 0.037 | 0.121 | 0.95 | 1.00 | 1.19 | 2.94 | 95.94 | 2.51 | 0.99 |
| 27 | y = 8145.2X − 3078 | 0.9985 | 0.22–10.98 | 0.023 | 0.075 | 0.60 | 0.56 | 3.29 | 2.77 | 100.14 | 3.17 | 0.92 |
| 28 | y = 4690.1X + 1299.4 | 0.9995 | 0.22–11.21 | 0.029 | 0.096 | 0.55 | 0.62 | 2.93 | 3.64 | 97.65 | 2.92 | 0.94 |
| 29 | y = 8301.8X − 1385.6 | 0.9994 | 6.94–346.88 | 0.060 | 0.202 | 0.84 | 0.91 | 1.98 | 4.85 | 94.03 | 3.33 | 0.96 |
| 30 | y = 5115.8X + 1696 | 0.9995 | 0.51–25.59 | 0.028 | 0.092 | 0.86 | 0.67 | 0.88 | 2.67 | 106.07 | 2.09 | 1.01 |
| 31 | y = 87,432X + 28019 | 0.9966 | 1.92–96.09 | 0.031 | 0.105 | 1.45 | 1.48 | 2.35 | 3.05 | 96.84 | 3.93 | 0.95 |
| 32 | y = 2526.8X − 1496.4 | 0.9968 | 0.34–16.80 | 0.026 | 0.086 | 0.99 | 1.07 | 1.03 | 2.58 | 98.26 | 2.16 | 0.95 |
| 33 | y = 1985.54X − 1440 | 0.9999 | 0.07–3.42 | 0.074 | 0.246 | 0.83 | 0.67 | 1.78 | 2.56 | 99.55 | 2.74 | 1.03 |
| 34 | y = 5755.6X − 3405.1 | 0.9994 | 1.64–82.03 | 0.028 | 0.094 | 1.02 | 0.96 | 1.90 | 3.34 | 100.67 | 2.72 | 0.97 |
| 35 | y = 1091.9X + 198.76 | 0.9986 | 0.60–30.16 | 0.048 | 0.161 | 1.07 | 1.23 | 2.21 | 3.36 | 103.23 | 1.74 | 0.92 |
| 36 | y = 42,856X − 4351.9 | 0.9999 | 1.82–91.02 | 0.027 | 0.090 | 1.20 | 0.99 | 1.37 | 2.47 | 95.06 | 2.67 | 0.94 |
| 37 | y = 8726.2X − 7910.9 | 0.9986 | 0.89–44.53 | 0.051 | 0.170 | 1.68 | 1.44 | 0.98 | 1.02 | 103.28 | 2.38 | 0.91 |
| 38 | y = 3054.6X + 100.91 | 0.9999 | 3.75–187.50 | 0.106 | 0.352 | 1.45 | 1.68 | 1.90 | 3.04 | 105.55 | 1.85 | 0.98 |
| 39 | y = 10,841.6X − 6708.3 | 0.9996 | 7.81–390.63 | 0.050 | 0.168 | 1.23 | 0.96 | 4.48 | 2.46 | 102.56 | 2.83 | 0.97 |
| 40 | y = 12,365.8X + 2691.9 | 0.9990 | 1.83–91.41 | 0.018 | 0.060 | 1.51 | 0.55 | 3.15 | 2.88 | 100.41 | 3.07 | 0.95 |
| 41 | y = 11,109.2X + 30,682 | 0.9998 | 0.60–30.16 | 0.024 | 0.080 | 2.08 | 1.42 | 2.57 | 1.35 | 106.33 | 1.50 | 0.91 |
| Analyte a | Samples (mg/g, n = 3) | |||||||||
| H1 | G1 | S1 | F1 | H2 | G2 | S2 | F2 | G3 | S3 | |
| 1 | 0.15 ± 0.02 | 0.15 ± 0.02 | 0.18 ± 0.02 | 0.18 ± 0.01 | 0.18 ± 0.03 | 0.18 ± 0.00 | 0.21 ± 0.01 | 0.18 ± 0.01 | 0.27 ± 0.03 | 0.25 ± 0.04 |
| 2 | 0.03 ± 0.01 | 0.01 ± 0.00 | 0.06 ± 0.01 | 0.04 ± 0.01 | 0.19 ± 0.02 | 0.10 ± 0.02 | 0.04 ± 0.02 | 0.04 ± 0.00 | 0.12 ± 0.02 | 0.05 ± 0.01 |
| 3 | 0.14 ± 0.04 | 0.05 ± 0.01 | 0.09 ± 0.01 | 0.06 ± 0.02 | 0.08 ± 0.01 | 0.33 ± 0.04 | 0.13 ± 0.01 | 0.08 ± 0.02 | 0.21 ± 0.02 | 0.10 ± 0.01 |
| 4 | 0.90 ± 0.09 | 1.30 ± 0.28 | 0.97 ± 0.06 | 1.78 ± 1.21 | 0.73 ± 0.12 | 0.63 ± 0.09 | 1.11 ± 0.39 | 0.98 ± 0.05 | 2.84 ± 0.96 | 3.22 ± 0.24 |
| 5 | 0.16 ± 0.01 | 0.70 ± 0.02 | 0.38 ± 0.03 | 0.75 ± 0.06 | 0.16 ± 0.02 | 0.18 ± 0.00 | 0.45 ± 0.04 | 0.53 ± 0.06 | 1.22 ± 0.22 | 1.18 ± 0.24 |
| 6 | 0.70 ± 0.08 | 1.24 ± 0.21 | 0.83 ± 0.03 | 1.80 ± 0.51 | 0.41 ± 0.02 | 0.44 ± 0.03 | 0.89 ± 0.04 | 0.64 ± 0.02 | 2.66 ± 0.18 | 2.86 ± 0.16 |
| 7 | 0.16 ± 0.01 | 0.18 ± 0.01 | 0.19 ± 0.02 | 0.18 ± 0.00 | 0.16 ± 0.02 | 0.17 ± 0.01 | 0.19 ± 0.01 | 0.16 ± 0.02 | 0.31 ± 0.02 | 0.27 ± 0.04 |
| 8 | 0.11 ± 0.02 | 0.15 ± 0.01 | 0.13 ± 0.00 | 0.16 ± 0.02 | 0.24 ± 0.04 | 0.17 ± 0.01 | 0.26 ± 0.04 | 0.27 ± 0.04 | 0.35 ± 0.05 | 0.36 ± 0.06 |
| 9 | 0.55 ± 0.17 | 0.21 ± 0.14 | 0.41 ± 0.08 | 0.30 ± 0.03 | 0.43 ± 0.01 | 0.43 ± 0.02 | 0.28 ± 0.03 | 0.17 ± 0.02 | 0.34 ± 0.04 | 0.41 ± 0.03 |
| 10 | 12.34 ± 1.31 | 21.45 ± 0.68 | 11.50 ± 0.47 | 25.07 ± 1.68 | 6.63 ± 0.86 | 7.57 ± 0.61 | 15.41 ± 1.13 | 11.61 ± 0.42 | 31.53 ± 3.17 | 28.66 ± 2.16 |
| 11 | 1.19 ± 0.31 | 1.52 ± 0.22 | 1.24 ± 0.41 | 2.17 ± 0.26 | 0.94 ± 0.16 | 0.87 ± 0.13 | 1.33 ± 0.06 | 1.19 ± 0.28 | 3.15 ± 0.04 | 3.51 ± 0.65 |
| 12 | 0.08 ± 0.01 | 0.18 ± 0.01 | 0.12 ± 0.02 | 0.14 ± 0.01 | 0.07 ± 0.00 | 0.06 ± 0.01 | 0.12 ± 0.03 | 0.14 ± 0.00 | 0.28 ± 0.01 | 0.22 ± 0.02 |
| 13 | 0.10 ± 0.02 | 0.10 ± 0.01 | 0.12 ± 0.01 | 0.09 ± 0.01 | 0.07 ± 0.01 | 0.55 ± 0.01 | 0.85 ± 0.12 | 0.09 ± 0.00 | 0.07 ± 0.01 | 0.19 ± 0.01 |
| 14 | 0.18 ± 0.04 | 0.62 ± 0.08 | 0.37 ± 0.01 | 0.62 ± 0.03 | 0.17 ± 0.01 | 0.11 ± 0.00 | 0.40 ± 0.02 | 0.37 ± 0.03 | 1.25 ± 0.16 | 1.40 ± 0.03 |
| 15 | 1.60 ± 0.34 | 2.48 ± 0.64 | 1.85 ± 0.67 | 2.59 ± 0.74 | 1.27 ± 0.17 | 1.49 ± 0.37 | 1.92 ± 0.34 | 1.89 ± 0.24 | 4.08 ± 0.07 | 3.17 ± 0.35 |
| 16 | 7.01 ± 0.89 | 11.39 ± 1.68 | 8.44 ± 0.53 | 11.36 ± 1.23 | 5.84 ± 0.75 | 6.60 ± 0.61 | 8.61 ± 0.62 | 8.39 ± 0.32 | 17.91 ± 1.21 | 14.36 ± 0.81 |
| 17 | 26.84 ± 2.14 | 50.01 ± 4.95 | 30.62 ± 2.87 | 45.00 ± 4.61 | 18.07 ± 1.14 | 12.79 ± 0.81 | 25.86 ± 2.27 | 26.42 ± 2.12 | 60.59 ± 4.65 | 63.16 ± 5.21 |
| 18 | 0.07 ± 0.01 | 0.06 ± 0.00 | 0.05 ± 0.01 | 0.05 ± 0.02 | 0.03 ± 0.00 | 0.03 ± 0.01 | 0.03 ± 0.00 | 0.05 ± 0.01 | 0.06 ± 0.00 | 0.05 ± 0.02 |
| 19 | 5.03 ± 0.87 | 5.43 ± 1.01 | 4.95 ± 0.21 | 5.70 ± 0.28 | 2.64 ± 0.75 | 3.89 ± 0.21 | 3.68 ± 0.35 | 2.82 ± 0.76 | 5.21 ± 1.01 | 5.29 ± 0.78 |
| 20 | 3.13 ± 0.33 | 4.27 ± 0.36 | 3.50 ± 1.08 | 4.19 ± 0.51 | 1.48 ± 0.26 | 2.57 ± 0.13 | 2.25 ± 0.12 | 1.86 ± 0.73 | 4.39 ± 0.64 | 4.55 ± 0.17 |
| 21 | 0.85 ± 0.02 | 0.91 ± 0.01 | 0.81 ± 0.02 | 0.88 ± 0.01 | 1.36 ± 0.48 | 0.52 ± 0.05 | 0.48 ± 0.09 | 0.37 ± 0.03 | 0.76 ± 0.01 | 0.84 ± 0.16 |
| 22 | 5.21 ± 1.18 | 6.19 ± 1.22 | 5.60 ± 0.52 | 6.47 ± 0.79 | 2.70 ± 1.03 | 4.39 ± 0.23 | 5.00 ± 1.24 | 3.59 ± 0.12 | 5.62 ± 0.46 | 5.81 ± 0.74 |
| 23 | 0.93 ± 0.03 | 1.60 ± 0.06 | 1.14 ± 0.03 | 1.52 ± 0.04 | 0.55 ± 0.05 | 0.86 ± 0.04 | 1.09 ± 0.02 | 0.88 ± 0.04 | 1.65 ± 0.12 | 1.53 ± 0.05 |
| 24 | 12.21 ± 0.81 | 13.06 ± 1.12 | 14.89 ± 0.78 | 12.03 ± 1.12 | 7.57 ± 0.54 | 9.03 ± 0.48 | 7.59 ± 1.08 | 6.32 ± 0.19 | 13.62 ± 0.64 | 13.54 ± 0.61 |
| 25 | 4.31 ± 0.19 | 6.16 ± 0.45 | 4.71 ± 0.73 | 5.71 ± 0.68 | 2.91 ± 0.14 | 2.76 ± 0.14 | 3.15 ± 0.19 | 3.35 ± 0.23 | 5.91 ± 0.37 | 6.24 ± 0.65 |
| 26 | 4.21 ± 0.28 | 5.98 ± 0.26 | 4.94 ± 0.17 | 5.25 ± 0.42 | 2.01 ± 0.16 | 2.68 ± 0.17 | 3.09 ± 0.19 | 2.27 ± 0.31 | 4.53 ± 0.51 | 5.37 ± 1.01 |
| 27 | 3.31 ± 0.34 | 3.35 ± 0.23 | 3.11 ± 0.07 | 3.42 ± 0.23 | 1.75 ± 0.45 | 2.10 ± 0.21 | 2.49 ± 1.81 | 1.85 ± 0.38 | 3.72 ± 0.19 | 4.33 ± 0.51 |
| 28 | 2.07 ± 0.11 | 2.25 ± 0.04 | 2.26 ± 0.16 | 2.71 ± 0.12 | 1.16 ± 0.27 | 2.12 ± 0.13 | 2.28 ± 0.67 | 1.53 ± 0.05 | 2.82 ± 0.14 | 3.36 ± 0.31 |
| 29 | 8.54 ± 0.57 | 10.94 ± 0.53 | 8.90 ± 1.01 | 9.97 ± 0.64 | 5.18 ± 0.45 | 5.82 ± 0.36 | 6.54 ± 0.38 | 5.29 ± 0.45 | 11.43 ± 0.91 | 11.87 ± 0.87 |
| 30 | 0.57 ± 0.02 | 0.48 ± 0.04 | 0.53 ± 0.03 | 0.49 ± 0.02 | 0.61 ± 0.02 | 0.61 ± 0.03 | 0.52 ± 0.02 | 0.72 ± 0.03 | 1.04 ± 0.04 | 0.78 ± 0.08 |
| 31 | 2.44 ± 0.27 | 2.87 ± 0.53 | 2.87 ± 0.32 | 2.76 ± 0.54 | 1.57 ± 0.21 | 1.91 ± 0.09 | 1.64 ± 0.12 | 1.57 ± 0.21 | 3.49 ± 0.11 | 3.36 ± 0.02 |
| 32 | 0.24 ± 0.01 | 0.25 ± 0.02 | 0.25 ± 0.02 | 0.27 ± 0.01 | 0.24 ± 0.00 | 0.24 ± 0.01 | 0.26 ± 0.01 | 0.23 ± 0.00 | 0.42 ± 0.02 | 0.43 ± 0.02 |
| 33 | 0.09 ± 0.00 | 0.13 ± 0.02 | 0.10 ± 0.01 | 0.14 ± 0.01 | 0.11 ± 0.02 | 0.10 ± 0.01 | 0.10 ± 0.01 | 0.09 ± 0.00 | 0.17 ± 0.01 | 0.17 ± 0.01 |
| 34 | 4.03 ± 0.09 | 4.71 ± 0.15 | 4.26 ± 0.13 | 4.62 ± 0.07 | 1.73 ± 0.37 | 2.32 ± 1.56 | 2.98 ± 1.34 | 1.94 ± 0.21 | 3.68 ± 1.11 | 3.83 ± 0.21 |
| 35 | 21.43 ± 2.01 | 16.09 ± 1.97 | 15.59 ± 1.12 | 14.89 ± 0.21 | 15.80 ± 0.21 | 8.29 ± 1.18 | 9.36 ± 0.45 | 8.81 ± 1.17 | 19.61 ± 1.24 | 20.77 ± 1.58 |
| 36 | 3.83 ± 1.12 | 4.59 ± 1.57 | 3.73 ± 1.16 | 4.29 ± 1.66 | 2.16 ± 0.57 | 2.62 ± 0.07 | 2.48 ± 0.08 | 2.15 ± 0.58 | 4.77 ± 1.56 | 4.82 ± 1.45 |
| 37 | 0.43 ± 0.02 | 0.52 ± 0.02 | 0.50 ± 0.01 | 0.46 ± 0.00 | 0.45 ± 0.01 | 0.61 ± 0.03 | 0.39 ± 0.02 | 0.39 ± 0.03 | 1.19 ± 0.21 | 0.87 ± 0.04 |
| 38 | 5.79 ± 0.75 | 8.95 ± 0.58 | 8.08 ± 1.01 | 8.87 ± 1.22 | 4.16 ± 0.76 | 5.48 ± 1.43 | 6.17 ± 0.17 | 4.22 ± 0.13 | 7.73 ± 0.97 | 8.52 ± 1.04 |
| 39 | 11.85 ± 0.74 | 14.11 ± 1.02 | 12.64 ± 0.35 | 14.51 ± 1.02 | 7.86 ± 0.13 | 9.50 ± 0.15 | 8.75 ± 1.62 | 7.39 ± 1.44 | 15.07 ± 1.21 | 15.72 ± 1.43 |
| 40 | 2.21 ± 0.13 | 2.81 ± 0.14 | 2.85 ± 0.53 | 2.98 ± 0.18 | 1.40 ± 0.19 | 1.76 ± 0.48 | 2.18 ± 0.17 | 1.68 ± 0.15 | 2.98 ± 0.17 | 3.00 ± 0.81 |
| 41 | 14.70 ± 0.47 | 17.12 ± 1.02 | 13.96 ± 1.02 | 17.05 ± 0.98 | 12.47 ± 2.01 | 8.82 ± 1.78 | 12.41 ± 0.45 | 11.25 ± 0.56 | 18.76 ± 1.87 | 20.12 ± 2.12 |
| N c | 25.40 ± 3.81 | 41.74 ± 5.42 | 26.89 ± 2.83 | 47.29 ± 6.14 | 17.59 ± 2.15 | 19.88 ± 1.98 | 32.20 ± 2.21 | 26.71 ± 2.72 | 66.57 ± 4.72 | 60.22 ± 5.29 |
| A d | 144.32 ± 15.61 | 182.85 ± 18.39 | 150.86 ± 12.70 | 174.24 ± 21.74 | 95.97 ± 8.45 | 91.82 ± 10.83 | 110.78 ± 14.92 | 98.16 ± 10.84 | 199.25 ± 17.81 | 208.34 ± 20.37 |
| Total | 169.71 ± 15.78 | 224.59 ± 22.74 | 177.74 ± 16.82 | 211.53 ± 25.62 | 113.56 ± 13.00 | 111.70 ± 7.38 | 142.98 ± 14.71 | 124.88 ± 13.80 | 265.81 ± 22.89 | 268.55 ± 27.85 |
| Analyte a | Sample (mg/g, n = 3) | |||||||||
| F3 | H4 | G4 | S4 | F4 | H5 | G5 | S5 | F5 | ||
| 1 | 0.27 ± 0.03 | 0.16 ± 0.02 | 0.15 ± 0.02 | 0.20 ± 0.01 | 0.18 ± 0.00 | 0.16 ± 0.01 | 0.15 ± 0.02 | 0.20 ± 0.02 | 0.17 ± 0.01 | |
| 2 | 0.07 ± 0.01 | 0.16 ± 0.02 | 0.08 ± 0.02 | 0.09 ± 0.01 | 0.10 ± 0.01 | 0.25 ± 0.02 | 0.13 ± 0.01 | 0.05 ± 0.00 | 0.06 ± 0.01 | |
| 3 | 0.12 ± 0.03 | 0.15 ± 0.01 | 0.10 ± 0.01 | 0.09 ± 0.02 | 0.08 ± 0.02 | 0.10 ± 0.00 | 0.33 ± 0.02 | 0.16 ± 0.02 | 0.09 ± 0.02 | |
| 4 | 2.15 ± 1.02 | 0.88 ± 0.05 | 1.36 ± 0.20 | 0.89 ± 0.08 | 1.60 ± 0.20 | 0.60 ± 0.05 | 0.66 ± 0.04 | 0.92 ± 0.05 | 0.85 ± 0.04 | |
| 5 | 1.20 ± 0.38 | 0.18 ± 0.03 | 0.61 ± 0.04 | 0.35 ± 0.02 | 0.57 ± 0.02 | 0.11 ± 0.01 | 0.15 ± 0.05 | 0.30 ± 0.04 | 0.44 ± 0.03 | |
| 6 | 1.92 ± 0.21 | 0.69 ± 0.23 | 1.13 ± 0.16 | 0.74 ± 0.02 | 1.39 ± 0.19 | 0.40 ± 0.03 | 0.46 ± 0.11 | 0.68 ± 0.04 | 0.53 ± 0.05 | |
| 7 | 0.26 ± 0.05 | 0.17 ± 0.04 | 0.18 ± 0.03 | 0.18 ± 0.02 | 0.17 ± 0.06 | 0.17 ± 0.03 | 0.17 ± 0.03 | 0.19 ± 0.04 | 0.18 ± 0.06 | |
| 8 | 0.22 ± 0.04 | 0.12 ± 0.03 | 0.12 ± 0.02 | 0.12 ± 0.01 | 0.12 ± 0.00 | 0.12 ± 0.01 | 0.17 ± 0.03 | 0.17 ± 0.04 | 0.16 ± 0.02 | |
| 9 | 0.73 ± 0.05 | 0.22 ± 0.04 | 0.22 ± 0.03 | 0.38 ± 0.07 | 0.35 ± 0.08 | 0.39 ± 0.09 | 0.44 ± 0.03 | 0.28 ± 0.07 | 0.18 ± 0.02 | |
| 10 | 22.54 ± 0.48 | 11.81 ± 0.38 | 20.81 ± 0.24 | 11.23 ± 0.45 | 24.70 ± 2.12 | 5.91 ± 0.17 | 8.06 ± 1.12 | 11.81 ± 1.32 | 10.39 ± 1.89 | |
| 11 | 2.46 ± 0.34 | 1.19 ± 0.03 | 1.76 ± 0.12 | 1.16 ± 0.03 | 2.23 ± 0.34 | 0.85 ± 0.02 | 0.81 ± 0.03 | 1.21 ± 0.05 | 1.22 ± 0.04 | |
| 12 | 0.19 ± 0.01 | 0.07 ± 0.00 | 0.17 ± 0.02 | 0.10 ± 0.01 | 0.11 ± 0.01 | 0.07 ± 0.01 | 0.07 ± 0.02 | 0.09 ± 0.03 | 0.13 ± 0.00 | |
| 13 | 0.21 ± 0.04 | 0.12 ± 0.01 | 0.09 ± 0.02 | 0.12 ± 0.01 | 0.10 ± 0.01 | 0.05 ± 0.00 | 0.52 ± 0.01 | 0.84 ± 0.11 | 0.07 ± 0.02 | |
| 14 | 1.23 ± 0.22 | 0.15 ± 0.01 | 0.49 ± 0.02 | 0.36 ± 0.03 | 0.12 ± 0.01 | 0.10 ± 0.01 | 0.09 ± 0.02 | 0.26 ± 0.05 | 0.18 ± 0.02 | |
| 15 | 2.70 ± 0.28 | 1.57 ± 0.51 | 2.55 ± 0.35 | 1.72 ± 0.12 | 2.41 ± 0.33 | 1.10 ± 0.03 | 1.44 ± 0.21 | 1.68 ± 0.13 | 1.76 ± 0.22 | |
| 16 | 14.41 ± 1.13 | 7.17 ± 1.07 | 10.97 ± 1.45 | 7.90 ± 0.65 | 10.61 ± 2.24 | 5.06 ± 0.07 | 6.67 ± 1.01 | 7.39 ± 0.23 | 7.85 ± 0.25 | |
| 17 | 61.03 ± 3.43 | 23.57 ± 1.75 | 44.71 ± 2.69 | 26.68 ± 2.01 | 32.35 ± 2.84 | 20.65 ± 1.05 | 15.25 ± 0.98 | 16.13 ± 1.29 | 21.27 ± 2.13 | |
| 18 | 0.03 ± 0.00 | 0.04 ± 0.01 | 0.07 ± 0.00 | 0.04 ± 0.01 | 0.03 ± 0.01 | 0.03 ± 0.01 | 0.04 ± 0.01 | 0.03 ± 0.01 | 0.04 ± 0.00 | |
| 19 | 4.37 ± 0.19 | 6.19 ± 0.92 | 6.25 ± 0.83 | 5.24 ± 0.25 | 5.56 ± 0.24 | 2.97 ± 0.17 | 3.89 ± 0.35 | 3.82 ± 0.23 | 3.05 ± 1.62 | |
| 20 | 4.45 ± 0.83 | 3.51 ± 0.57 | 5.06 ± 0.87 | 3.53 ± 1.17 | 4.02 ± 0.48 | 1.39 ± 0.49 | 2.52 ± 0.57 | 2.23 ± 0.18 | 1.91 ± 0.52 | |
| 21 | 0.58 ± 0.02 | 0.91 ± 0.11 | 0.99 ± 0.13 | 0.84 ± 0.03 | 0.84 ± 0.04 | 1.36 ± 0.26 | 0.50 ± 0.01 | 1.44 ± 0.22 | 1.37 ± 0.26 | |
| 22 | 5.57 ± 1.72 | 6.16 ± 1.52 | 8.06 ± 0.15 | 5.85 ± 0.18 | 6.83 ± 0.56 | 2.89 ± 0.82 | 4.29 ± 1.74 | 5.48 ± 0.32 | 4.17 ± 0.52 | |
| 23 | 1.51 ± 0.24 | 1.10 ± 0.04 | 1.97 ± 0.06 | 1.18 ± 0.05 | 1.44 ± 0.02 | 0.54 ± 0.03 | 0.81 ± 0.03 | 1.07 ± 0.04 | 0.95 ± 0.04 | |
| 24 | 13.72 ± 1.80 | 11.77 ± 0.59 | 13.28 ± 1.60 | 13.36 ± 1.80 | 10.20 ± 0.54 | 7.73 ± 0.65 | 9.76 ± 1.17 | 6.46 ± 0.54 | 5.98 ± 0.67 | |
| 25 | 5.54 ± 1.10 | 4.55 ± 1.04 | 5.75 ± 1.05 | 4.01 ± 0.24 | 4.14 ± 0.21 | 2.49 ± 0.14 | 2.82 ± 0.06 | 2.71 ± 0.58 | 3.07 ± 0.12 | |
| 26 | 4.40 ± 0.24 | 4.22 ± 0.36 | 6.13 ± 0.26 | 4.83 ± 0.19 | 4.03 ± 0.26 | 2.05 ± 0.17 | 2.66 ± 0.76 | 2.72 ± 0.86 | 1.99 ± 0.55 | |
| 27 | 2.71 ± 0.55 | 3.17 ± 0.15 | 3.43 ± 1.12 | 2.97 ± 0.32 | 2.81 ± 0.30 | 2.11 ± 1.01 | 2.19 ± 0.96 | 2.12 ± 0.18 | 1.60 ± 0.47 | |
| 28 | 2.16 ± 0.58 | 1.66 ± 0.24 | 1.83 ± 0.57 | 1.92 ± 0.57 | 1.69 ± 0.61 | 1.12 ± 0.17 | 1.79 ± 0.52 | 1.89 ± 0.57 | 1.28 ± 0.24 | |
| 29 | 10.86 ± 0.57 | 8.19 ± 0.35 | 10.75 ± 0.57 | 8.20 ± 0.43 | 7.43 ± 0.43 | 4.92 ± 0.81 | 5.89 ± 1.13 | 5.31 ± 0.52 | 4.75 ± 0.86 | |
| 30 | 0.78 ± 0.23 | 0.47 ± 0.02 | 0.48 ± 0.13 | 0.52 ± 0.21 | 0.47 ± 0.01 | 0.52 ± 0.22 | 0.56 ± 0.05 | 0.53 ± 0.04 | 0.67 ± 0.02 | |
| 31 | 2.74 ± 0.37 | 2.36 ± 0.48 | 2.82 ± 0.39 | 2.67 ± 0.37 | 2.38 ± 0.66 | 1.55 ± 0.21 | 2.03 ± 0.54 | 1.39 ± 0.23 | 1.43 ± 0.21 | |
| 32 | 0.39 ± 0.04 | 0.24 ± 0.01 | 0.26 ± 0.00 | 0.25 ± 0.02 | 0.27 ± 0.04 | 0.25 ± 0.02 | 0.24 ± 0.02 | 0.25 ± 0.03 | 0.25 ± 0.01 | |
| 33 | 0.15 ± 0.01 | + b | + | + | + | + | + | + | + | |
| 34 | 3.76 ± 0.32 | 4.50 ± 0.74 | 5.59 ± 1.02 | 4.41 ± 1.02 | 4.40 ± 1.12 | 1.79 ± 0.47 | 2.43 ± 0.32 | 3.02 ± 0.16 | 2.17 ± 0.38 | |
| 35 | 17.84 ± 1.01 | 20.10 ± 1.29 | 14.46 ± 0.92 | 13.68 ± 0.62 | 11.36 ± 0.73 | 17.36 ± 1.21 | 9.56 ± 1.02 | 6.62 ± 0.24 | 7.42 ± 1.01 | |
| 36 | 4.11 ± 0.76 | 4.32 ± 0.58 | 5.53 ± 0.56 | 3.84 ± 1.03 | 4.37 ± 0.63 | 2.17 ± 0.98 | 2.61 ± 0.72 | 2.56 ± 0.36 | 2.34 ± 0.46 | |
| 37 | 0.61 ± 0.02 | 0.43 ± 0.01 | 0.53 ± 0.01 | 0.44 ± 0.00 | 0.41 ± 0.02 | 0.47 ± 0.01 | 0.44 ± 0.02 | 0.34 ± 0.00 | 0.39 ± 0.03 | |
| 38 | 6.97 ± 0.26 | 5.22 ± 0.83 | 9.18 ± 1.01 | 7.81 ± 0.41 | 6.27 ± 0.78 | 3.05 ± 0.15 | 5.52 ± 0.83 | 5.12 ± 0.45 | 3.85 ± 1.01 | |
| 39 | 15.45 ± 1.32 | 16.40 ± 1.28 | 16.26 ± 1.37 | 13.70 ± 0.82 | 12.76 ± 1.51 | 8.55 ± 0.72 | 9.90 ± 0.50 | 8.02 ± 0.23 | 7.79 ± 0.17 | |
| 40 | 2.84 ± 0.22 | 2.23 ± 0.67 | 2.85 ± 0.08 | 2.61 ± 0.45 | 2.27 ± 0.98 | 1.28 ± 0.16 | 1.77 ± 0.53 | 1.89 ± 0.34 | 15.20 ± 1.28 | |
| 41 | 20.99 ± 0.46 | 15.13 ± 0.98 | 15.93 ± 1.39 | 12.30 ± 0.78 | 12.64 ± 1.01 | 12.05 ± 0.94 | 9.36 ± 0.27 | 9.16 ± 0.43 | 10.04 ± 0.17 | |
| N c | 50.69 ± 4.81 | 24.80 ± 1.26 | 40.80 ± 4.19 | 25.64 ± 2.11 | 44.85 ± 3.62 | 15.43 ± 1.12 | 20.33 ± 2.03 | 26.25 ± 1.03 | 24.35 ± 0.78 | |
| A d | 193.56 ± 18.72 | 146.48 ± 15.29 | 182.18 ± 16.50 | 140.91 ± 14.93 | 139.18 ± 11.27 | 99.83 ± 10.83 | 96.83 ± 8.23 | 90.35 ± 12.47 | 89.29 ± 11.38 | |
| Total | 244.25 ± 22.51 | 171.27 ± 16.78 | 222.98 ± 23.85 | 166.54 ± 15.73 | 184.03 ± 18.35 | 114.76 ± 12.46 | 117.16 ± 15.47 | 116.59 ± 14.19 | 113.64 ± 13.86 | |
| Component (PC) | Analytes | ||||||||||||||||||||
|---|---|---|---|---|---|---|---|---|---|---|---|---|---|---|---|---|---|---|---|---|---|
| 1 | 2 | 3 | 4 | 5 | 6 | 7 | 8 | 9 | 10 | 11 | 12 | 13 | 14 | 15 | 16 | 17 | 18 | 19 | 20 | 21 | |
| 1 | 0.570 | −0.374 | −0.211 | 0.894 | 0.873 | 0.923 | 0.759 | 0.395 | 0.150 | 0.918 | 0.891 | 0.855 | −0.313 | 0.861 | 0.914 | 0.921 | 0.950 | 0.540 | 0.721 | 0.915 | 0.719 |
| 2 | 0.695 | 0.146 | 0.236 | 0.376 | 0.384 | 0.310 | 0.574 | 0.813 | 0.242 | 0.106 | 0.319 | 0.347 | 0.215 | 0.446 | 0.257 | 0.296 | 0.156 | −0.364 | −0.624 | −0.330 | −0.660 |
| 3 | −0.053 | 0.667 | −0.017 | −0.041 | −0.150 | −0.044 | 0.039 | −0.121 | 0.494 | −0.202 | −0.059 | −0.146 | −0.605 | −0.015 | −0.173 | −0.127 | 0.036 | 0.130 | −0.003 | −0.049 | 0.061 |
| 22 | 23 | 24 | 25 | 26 | 27 | 28 | 29 | 30 | 31 | 32 | 33 | 34 | 35 | 36 | 37 | 38 | 39 | 40 | 41 | ||
| 1 | 0.688 | 0.872 | 0.811 | 0.954 | 0.842 | 0.891 | 0.808 | 0.969 | 0.426 | 0.935 | 0.787 | 0.630 | 0.708 | 0.595 | 0.884 | 0.715 | 0.836 | 0.858 | 0.930 | 0.899 | |
| 2 | −0.578 | −0.233 | −0.357 | −0.199 | −0.509 | −0.273 | 0.142 | −0.170 | 0.800 | −0.173 | 0.556 | 0.448 | −0.677 | −0.106 | −0.417 | 0.479 | −0.357 | −0.374 | −0.241 | 0.051 | |
| 3 | −0.324 | −0.328 | 0.296 | 0.048 | −0.031 | 0.105 | −0.221 | 0.084 | 0.136 | 0.185 | 0.110 | 0.049 | −0.094 | 0.724 | 0.057 | 0.215 | −0.210 | 0.196 | −0.115 | 0.266 | |
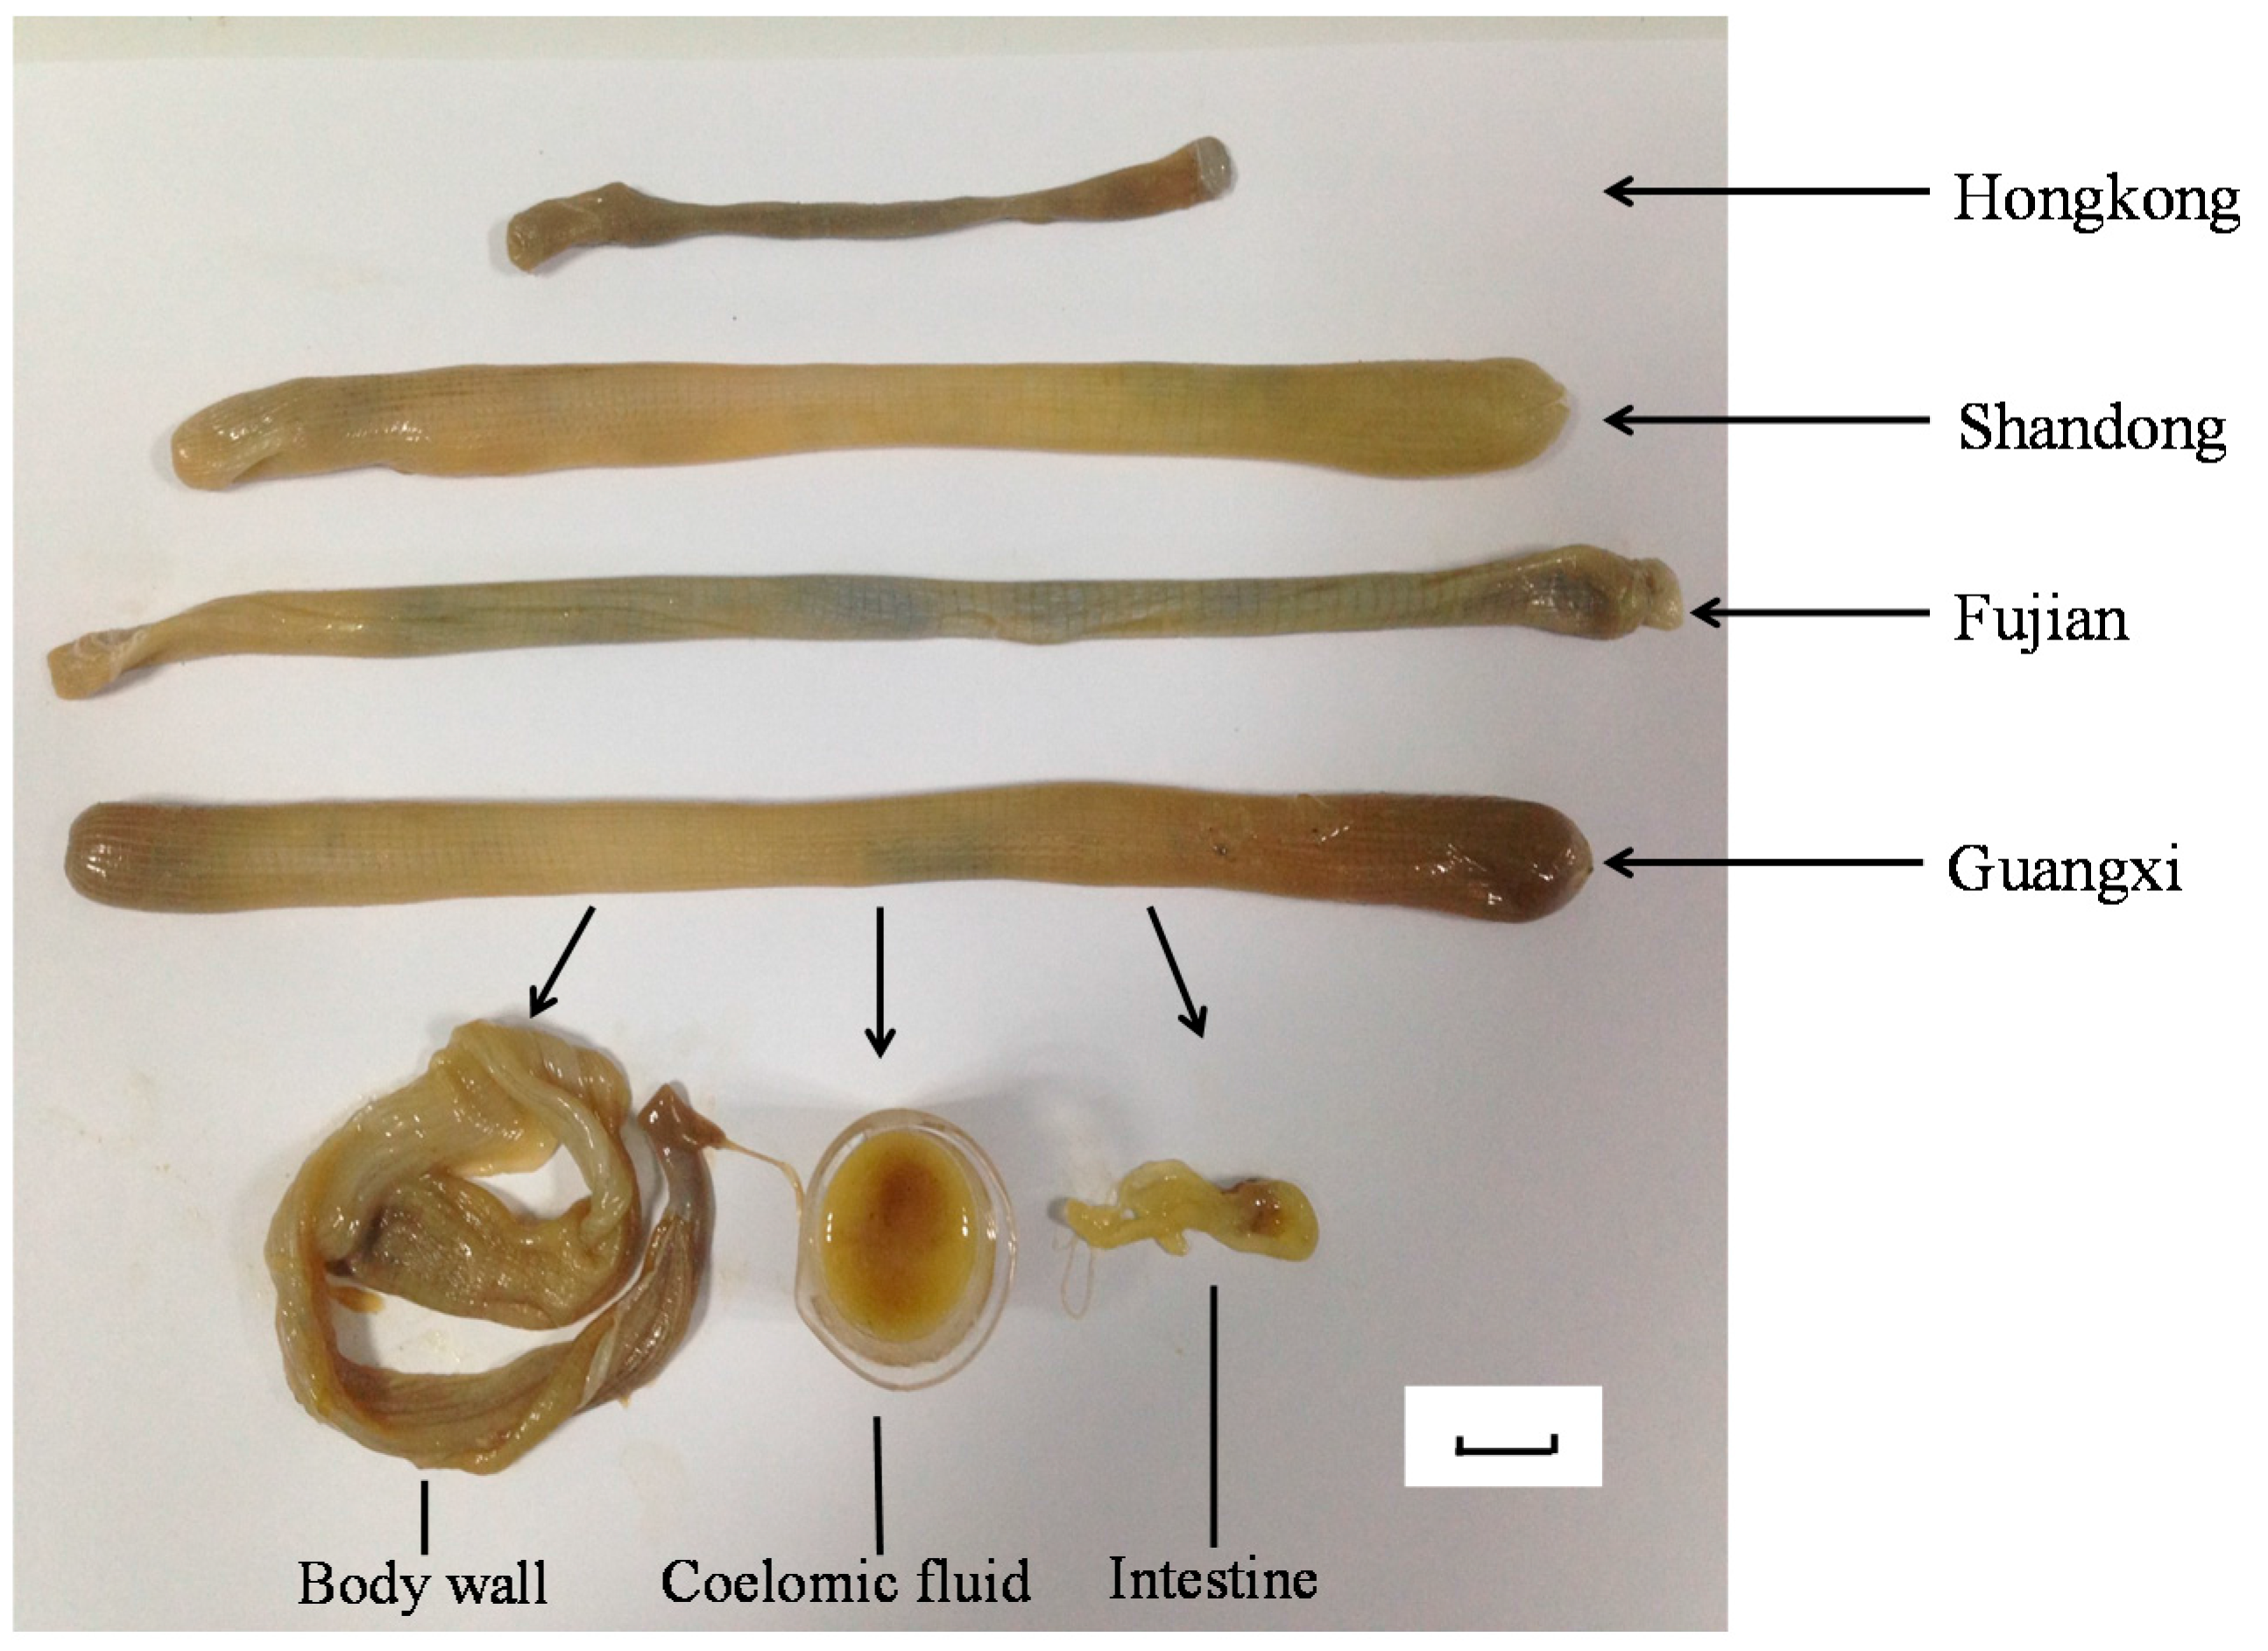
| NO | Sample | Anatomical Part | Habitat | Processing Method |
|---|---|---|---|---|
| 1 | H1 | Body wall (SE) | Hongkong | Ultrasonication |
| 2 | G1 | Body wall (SE) | Guangxi | Ultrasonication |
| 3 | S1 | Body wall (SE) | Shandong | Ultrasonication |
| 4 | F1 | Body wall (SE) | Fujian | Ultrasonication |
| 5 | H2 | Intestine (SI) | Hongkong | Ultrasonication |
| 6 | G2 | Intestine (SI) | Guangxi | Ultrasonication |
| 7 | S2 | Intestine (SI) | Shandong | Ultrasonication |
| 8 | F2 | Intestine (SI) | Fujian | Ultrasonication |
| 9 | G3 | Coelomic fluid (SC) | Guangxi | Ultrasonication |
| 10 | S3 | Coelomic fluid (SC) | Shandong | Ultrasonication |
| 11 | F3 | Coelomic fluid (SC) | Fujian | Ultrasonication |
| 12 | H4 | Body wall (SE) | Hongkong | Refluxing |
| 13 | G4 | Body wall (SE) | Guangxi | Refluxing |
| 14 | S4 | Body wall (SE) | Shandong | Refluxing |
| 15 | F4 | Body wall (SE) | Fujian | Refluxing |
| 16 | H5 | Intestine (SI) | Hongkong | Refluxing |
| 17 | G5 | Intestine (SI) | Guangxi | Refluxing |
| 18 | S5 | Intestine (SI) | Shandong | Refluxing |
| 19 | F5 | Intestine (SI) | Fujian | Refluxing |
© 2016 by the authors. Licensee MDPI, Basel, Switzerland. This article is an open access article distributed under the terms and conditions of the Creative Commons by Attribution (CC-BY) license ( http://creativecommons.org/licenses/by/4.0/).
Share and Cite
Ge, Y.; Tang, Y.; Guo, S.; Liu, X.; Zhu, Z.; Zhang, L.; Liu, P.; Ding, S.; Lin, X.; Lin, R.; et al. Simultaneous Quantitation of Free Amino Acids, Nucleosides and Nucleobases in Sipunculus nudus by Ultra-High Performance Liquid Chromatography with Triple Quadrupole Mass Spectrometry. Molecules 2016, 21, 408. https://doi.org/10.3390/molecules21040408
Ge Y, Tang Y, Guo S, Liu X, Zhu Z, Zhang L, Liu P, Ding S, Lin X, Lin R, et al. Simultaneous Quantitation of Free Amino Acids, Nucleosides and Nucleobases in Sipunculus nudus by Ultra-High Performance Liquid Chromatography with Triple Quadrupole Mass Spectrometry. Molecules. 2016; 21(4):408. https://doi.org/10.3390/molecules21040408
Chicago/Turabian StyleGe, Yahui, Yuping Tang, Sheng Guo, Xin Liu, Zhenhua Zhu, Lili Zhang, Pei Liu, Shaoxiong Ding, Xiangzhi Lin, Rurong Lin, and et al. 2016. "Simultaneous Quantitation of Free Amino Acids, Nucleosides and Nucleobases in Sipunculus nudus by Ultra-High Performance Liquid Chromatography with Triple Quadrupole Mass Spectrometry" Molecules 21, no. 4: 408. https://doi.org/10.3390/molecules21040408
APA StyleGe, Y., Tang, Y., Guo, S., Liu, X., Zhu, Z., Zhang, L., Liu, P., Ding, S., Lin, X., Lin, R., & Duan, J.-a. (2016). Simultaneous Quantitation of Free Amino Acids, Nucleosides and Nucleobases in Sipunculus nudus by Ultra-High Performance Liquid Chromatography with Triple Quadrupole Mass Spectrometry. Molecules, 21(4), 408. https://doi.org/10.3390/molecules21040408