
The Chemical Composition of Achillea wilhelmsii C. Koch and Its Desirable Effects on Hyperglycemia, Inflammatory Mediators and Hypercholesterolemia as Risk Factors for Cardiometabolic Disease


 ,
, 
Abstract
:1. Introduction
2. Results
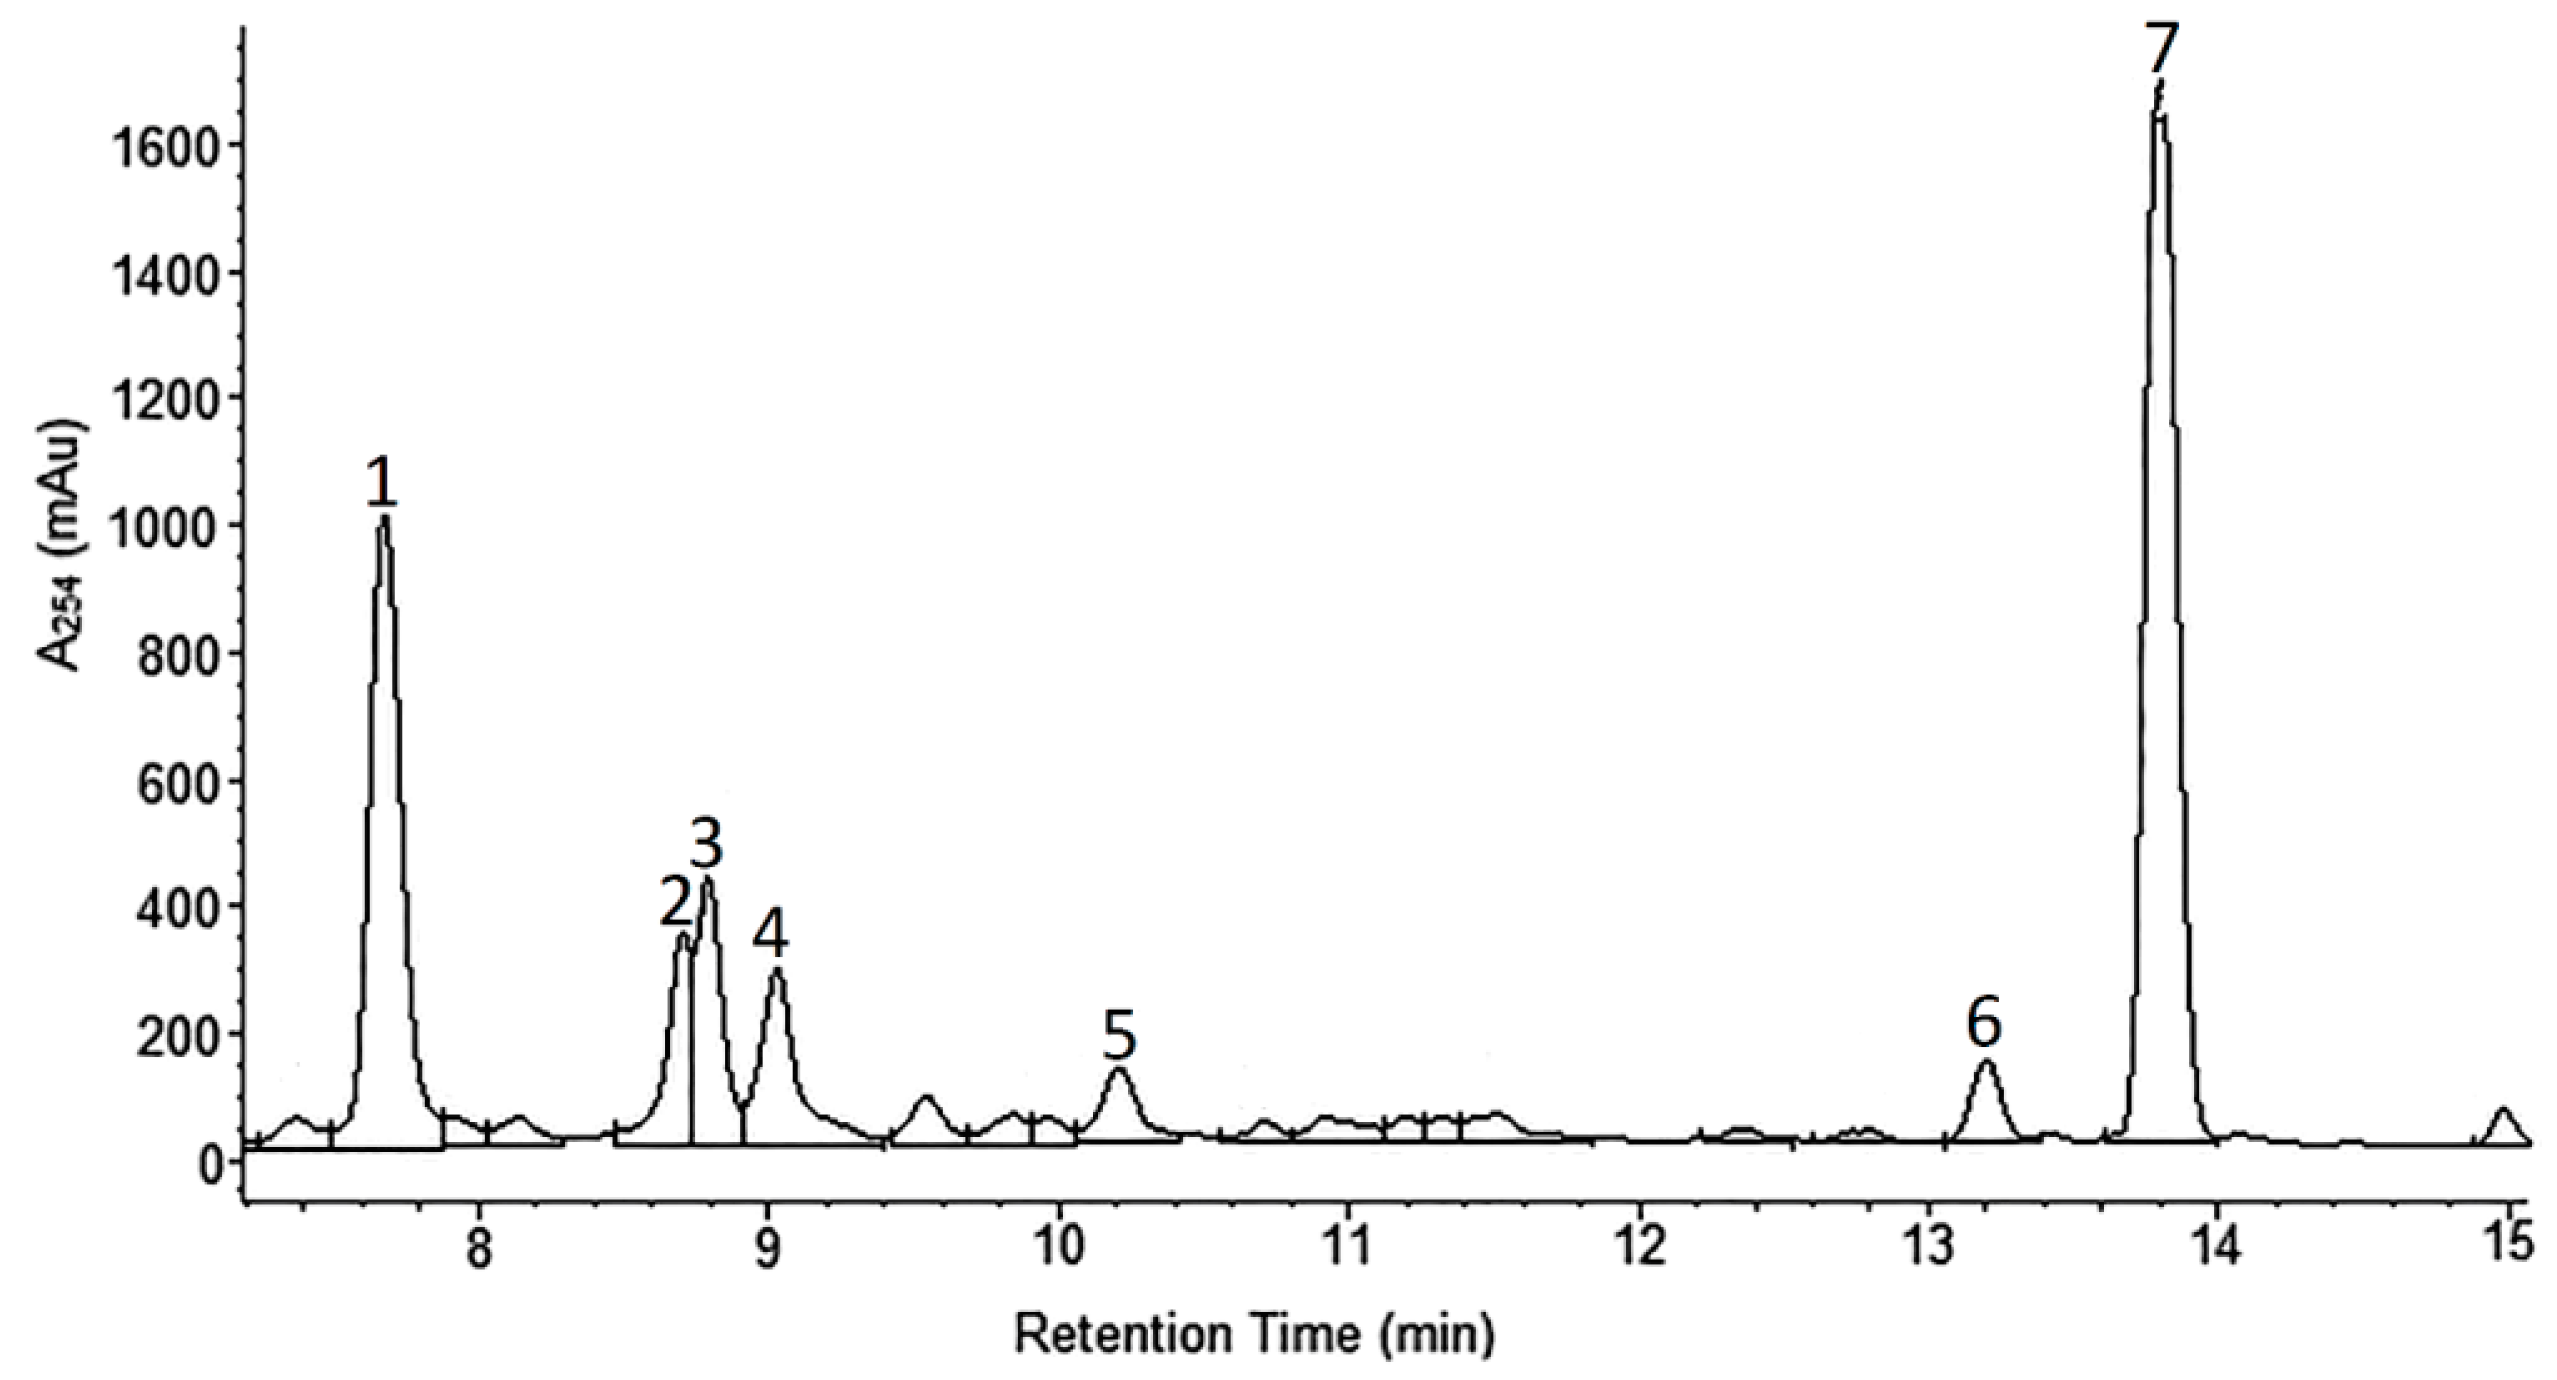
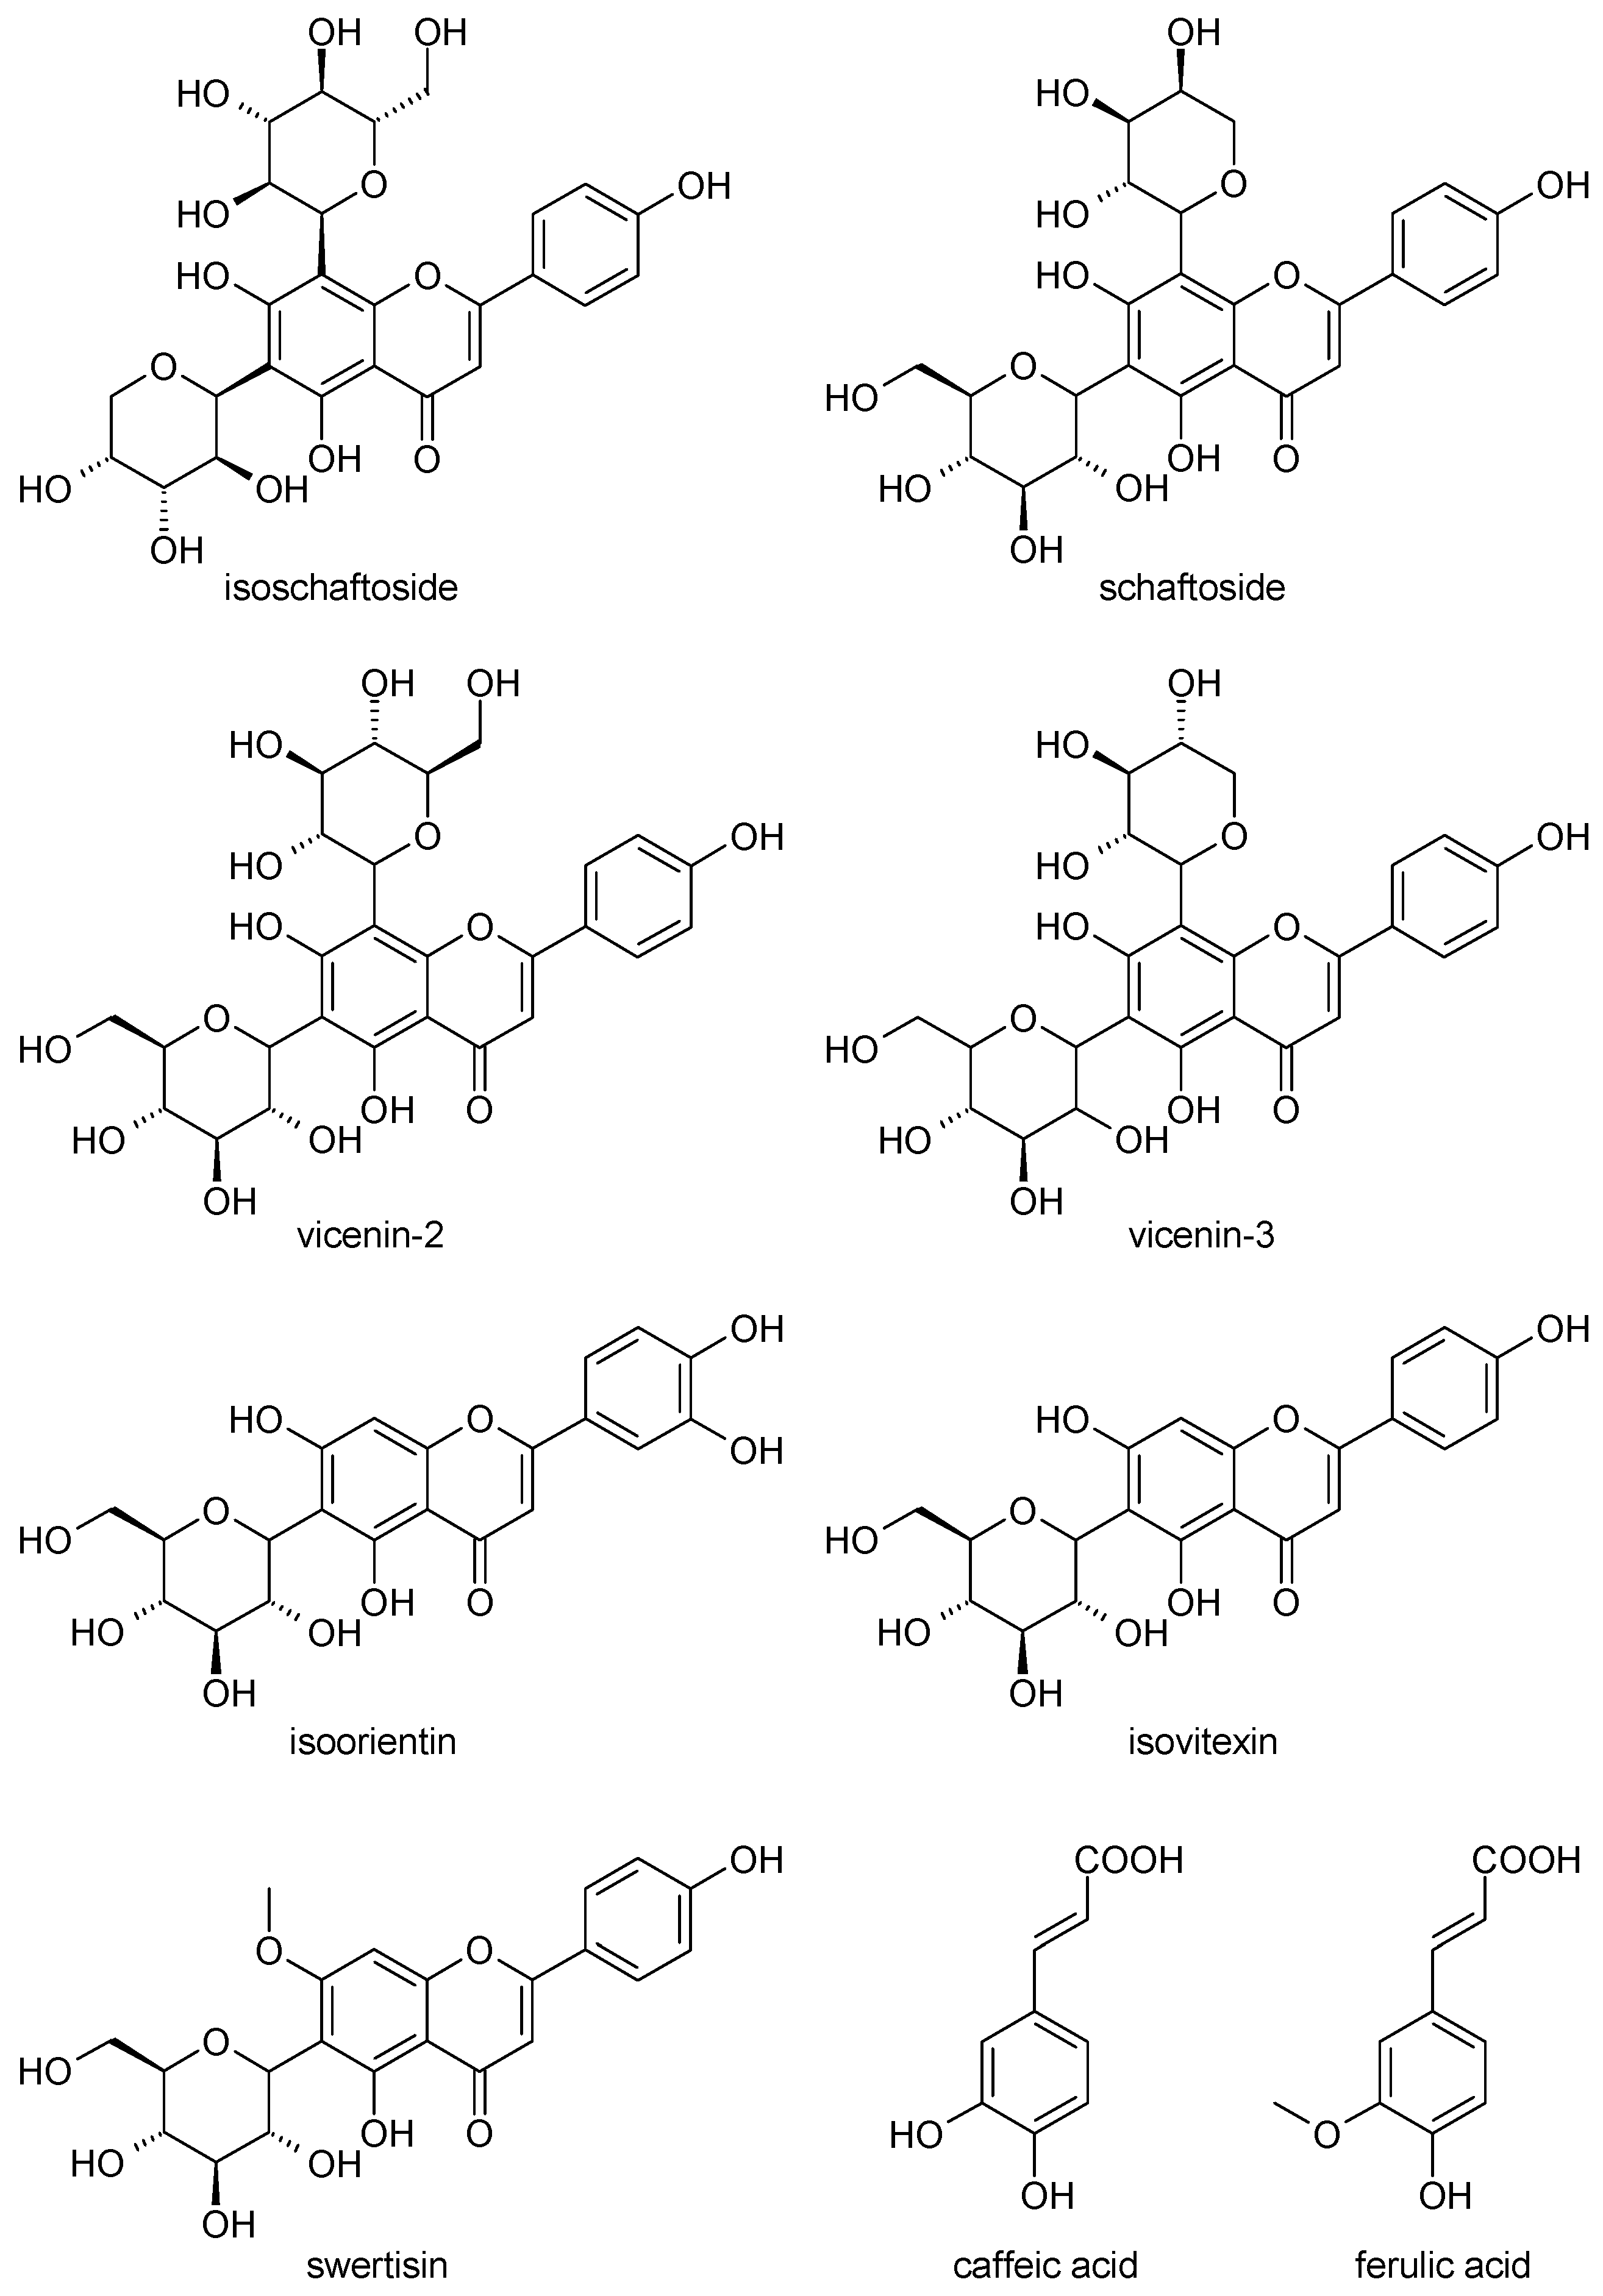
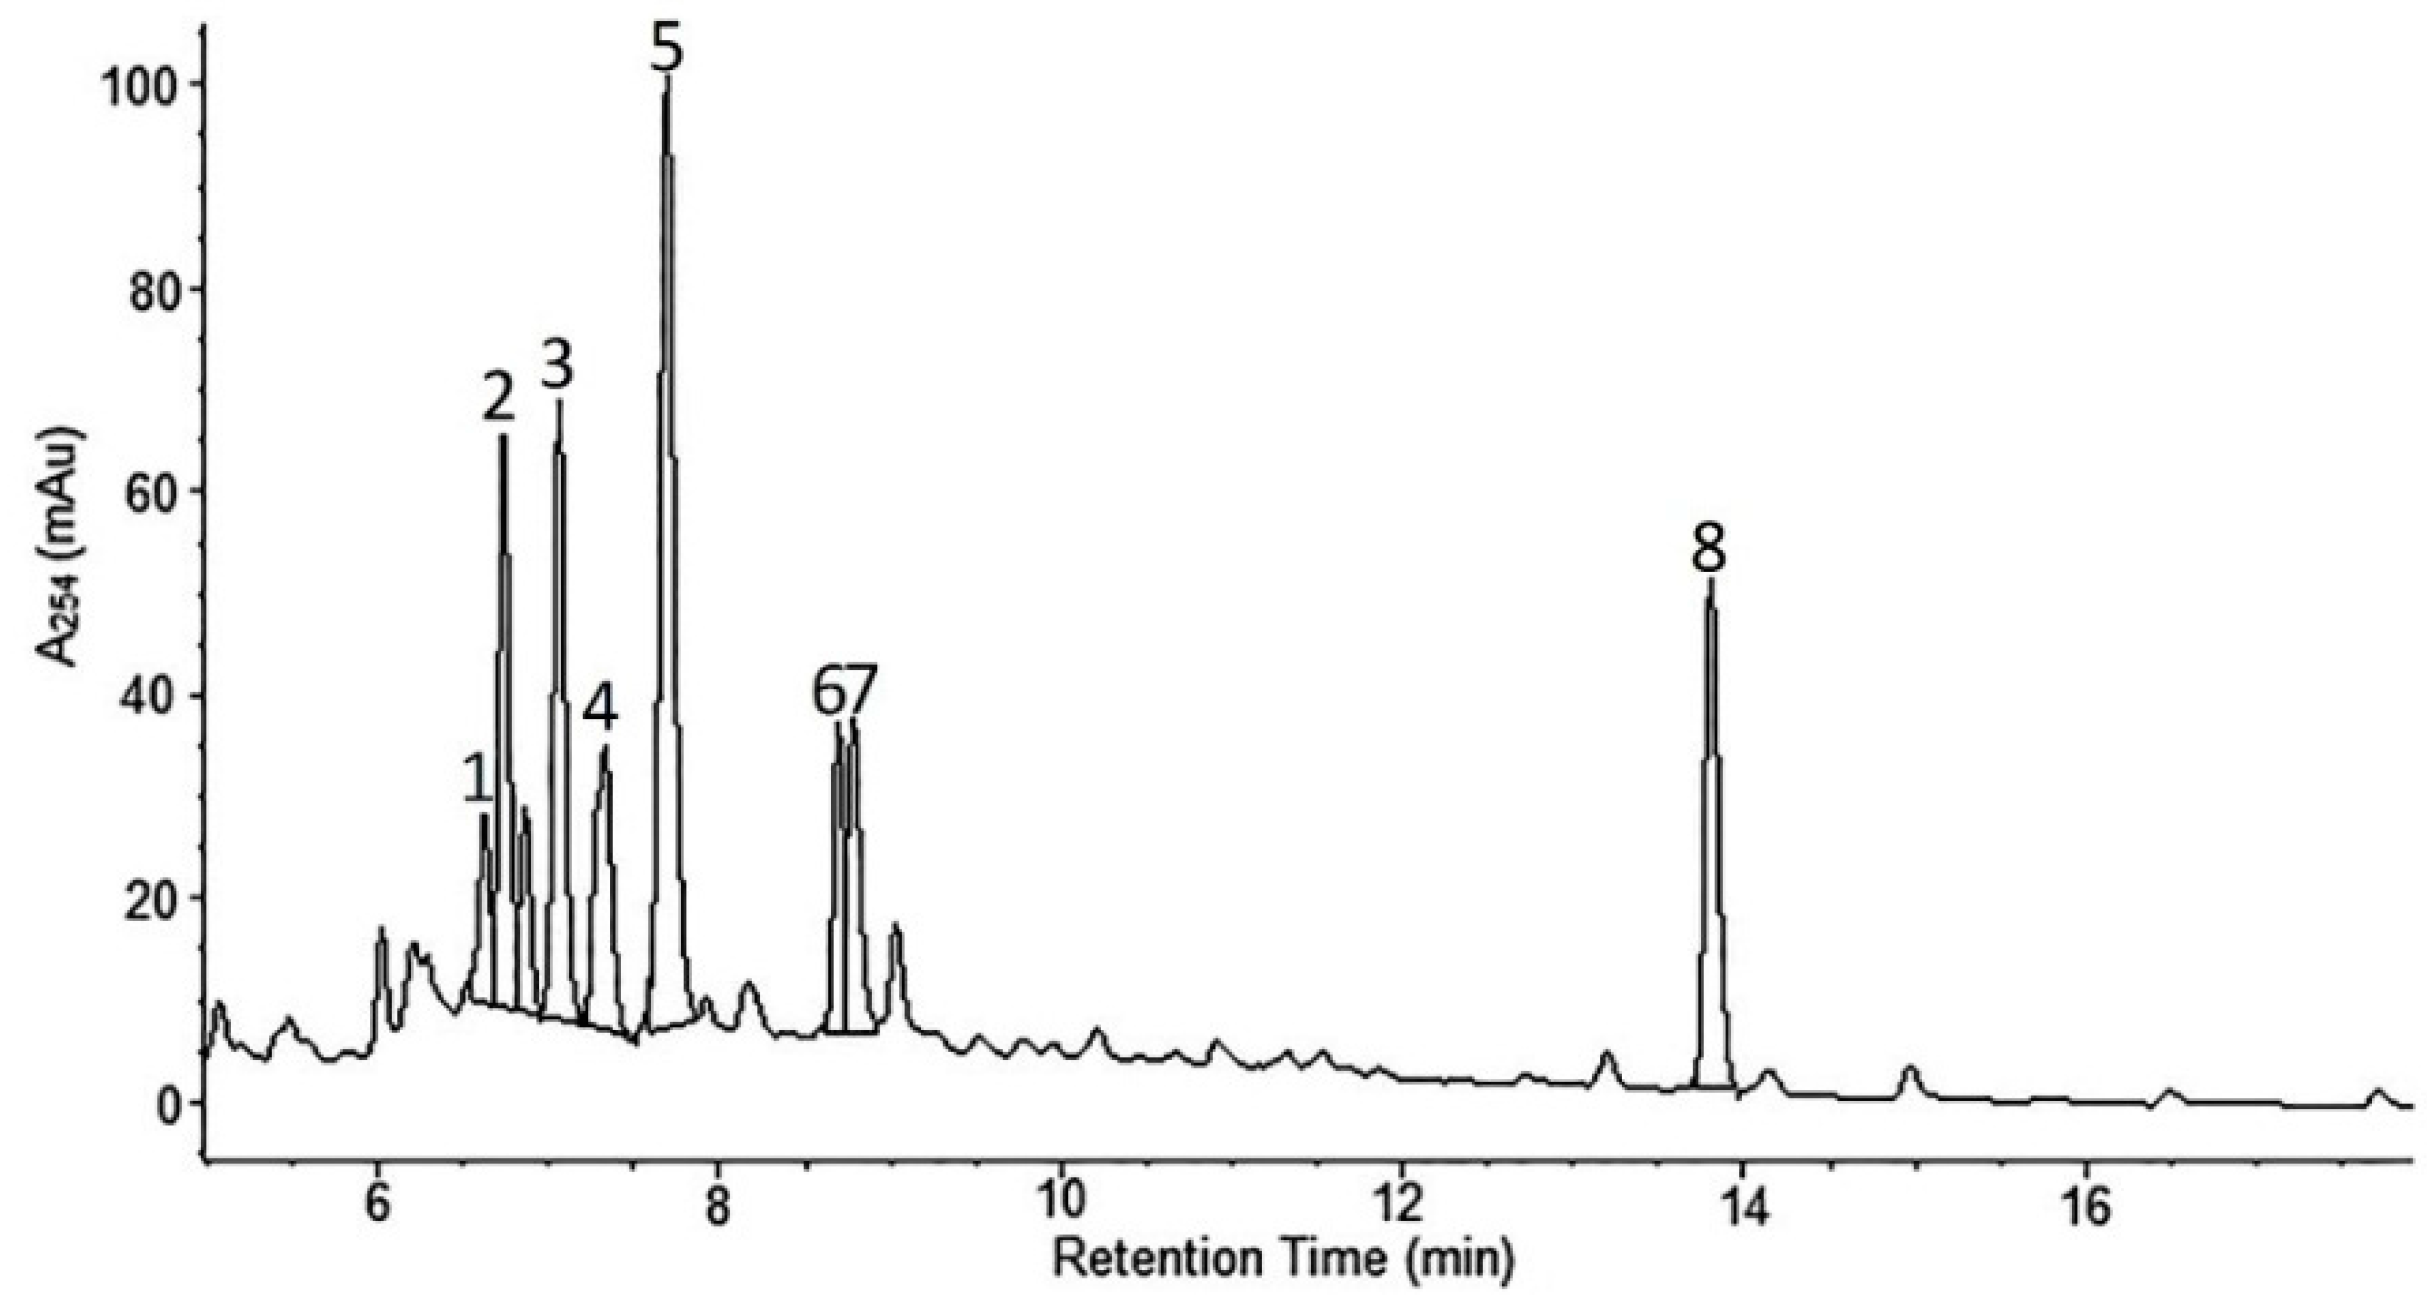
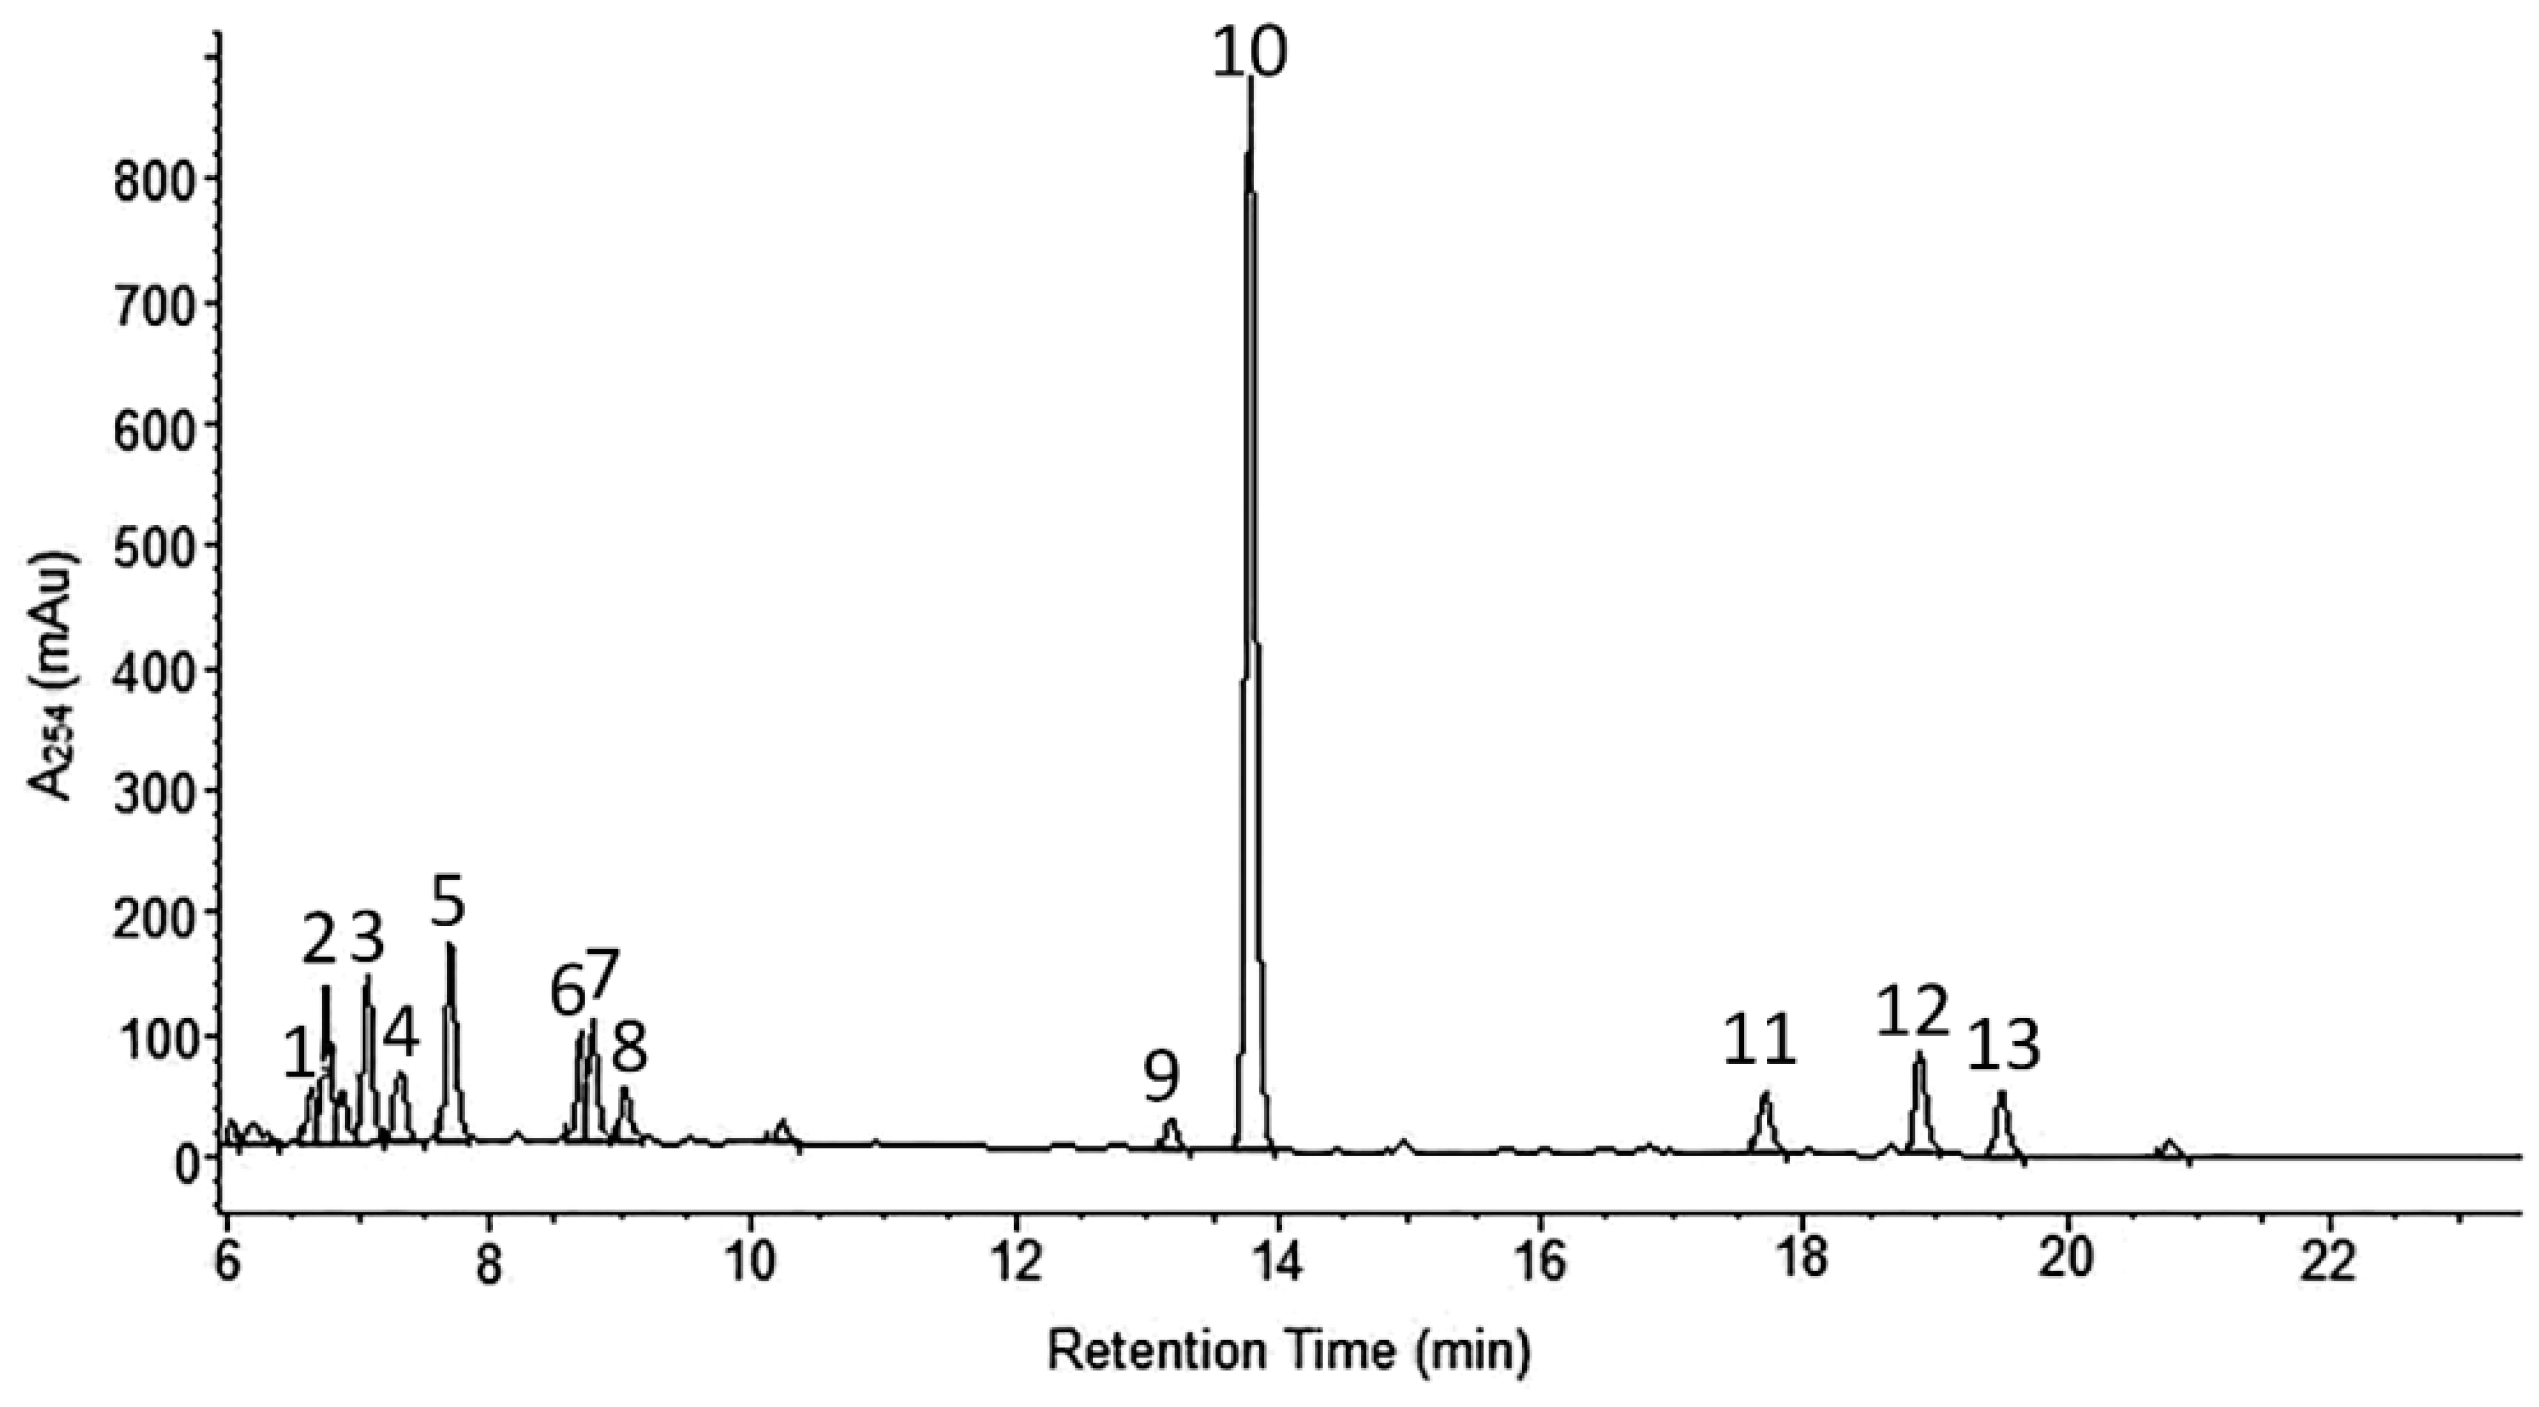
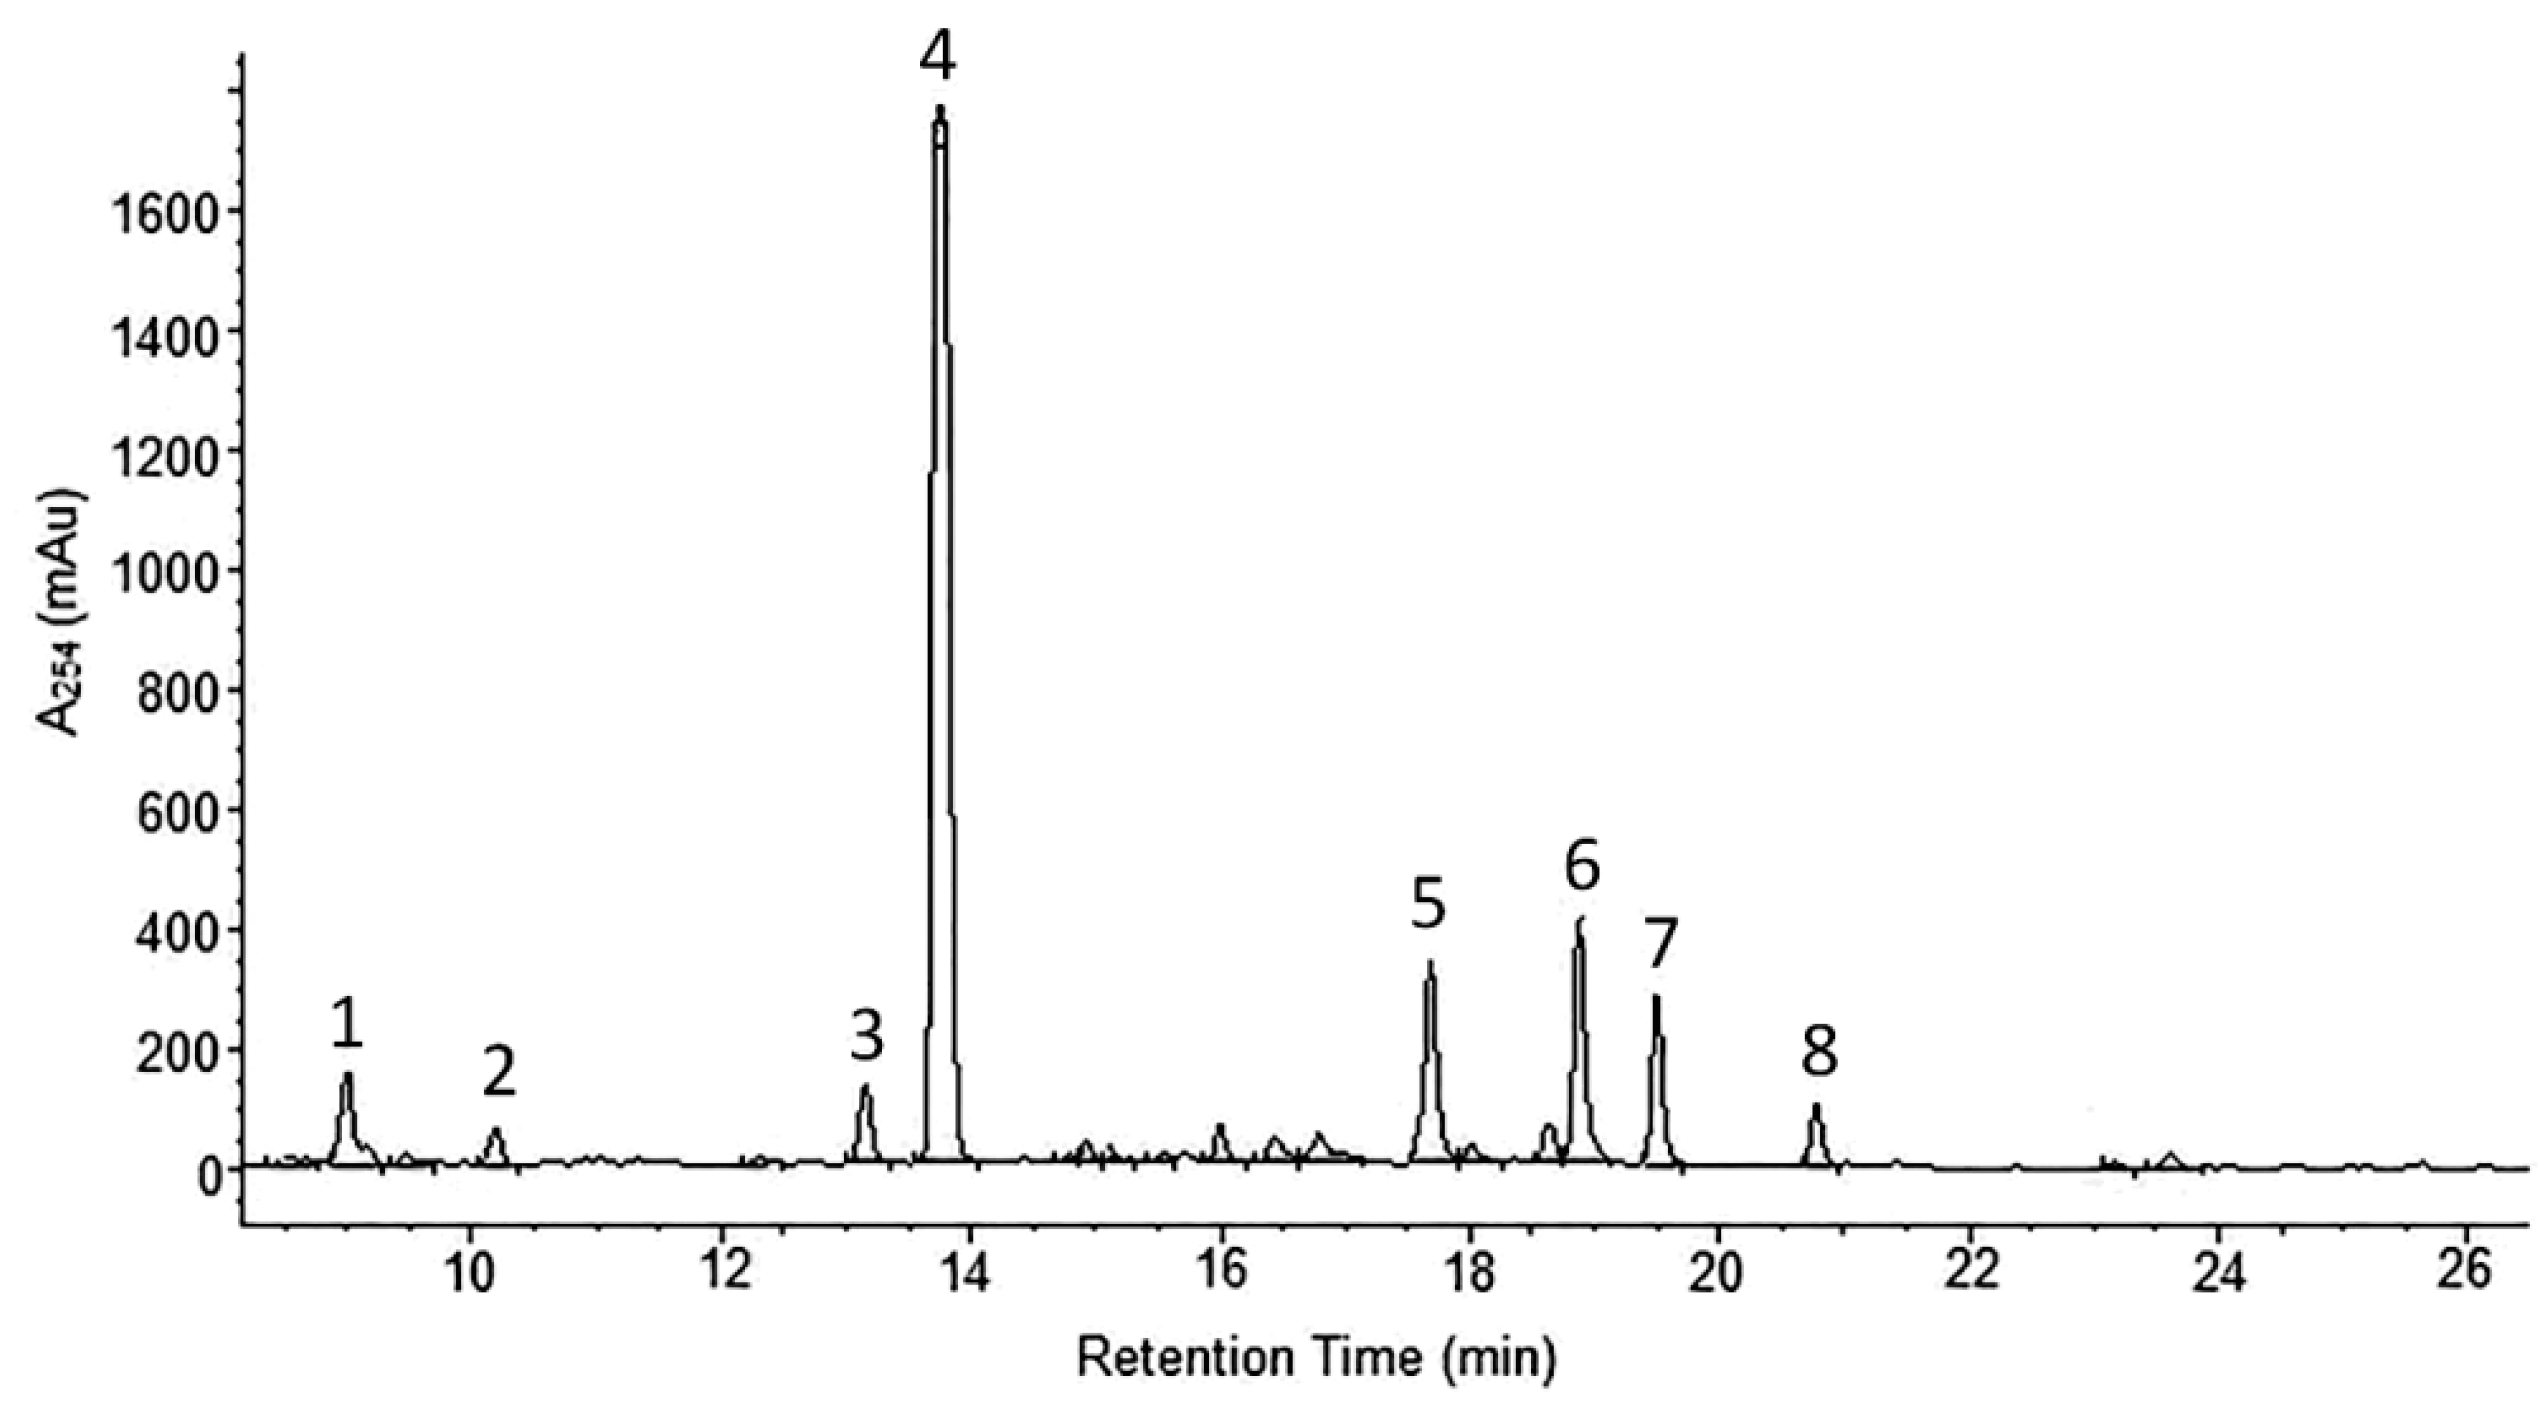
2.1. Phytochemical Analyses
2.2. The Hypoglycemic Activity
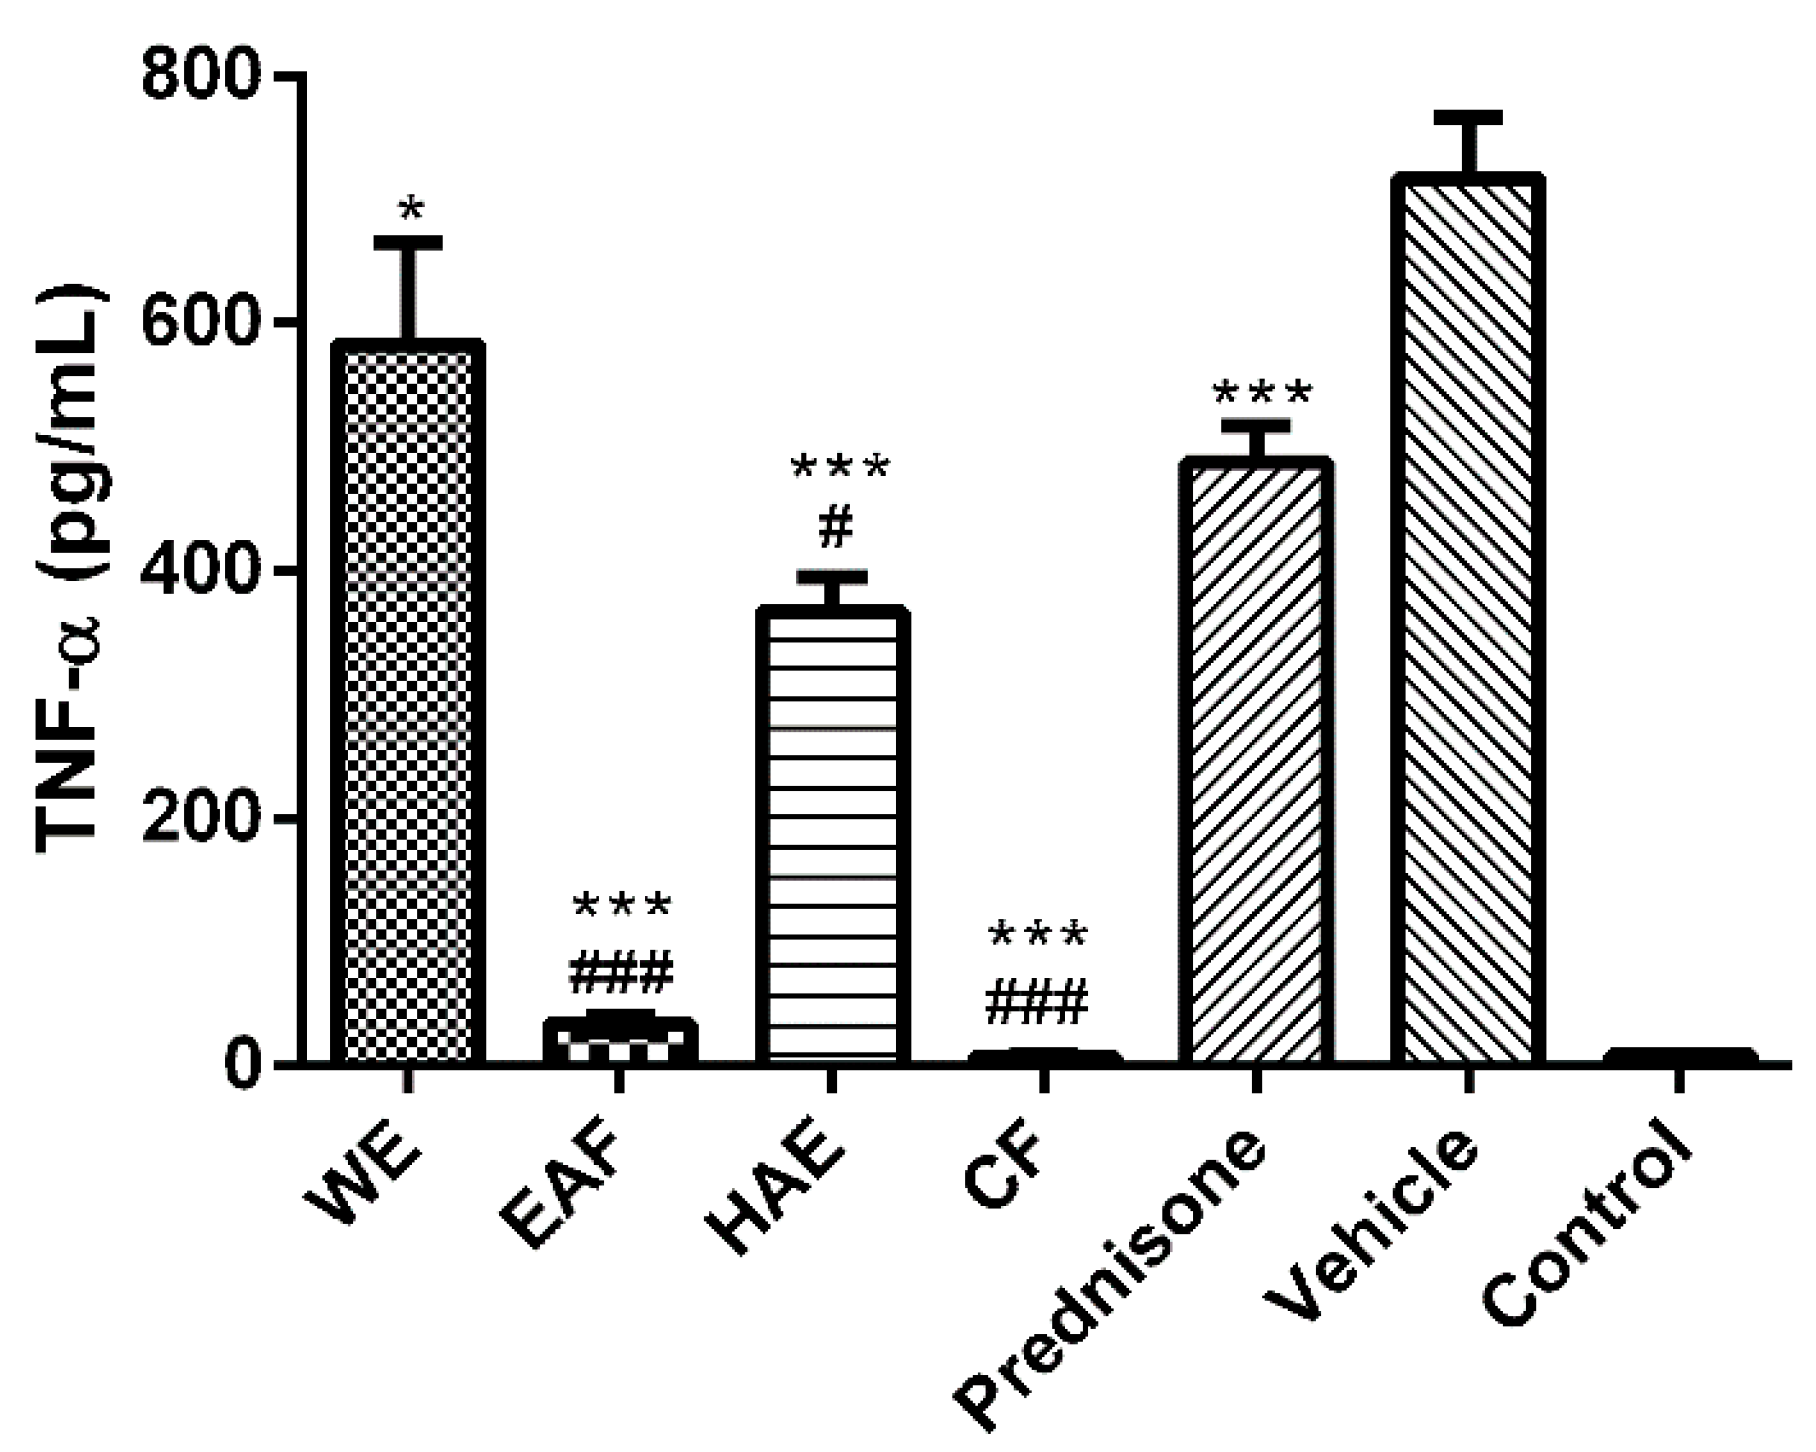
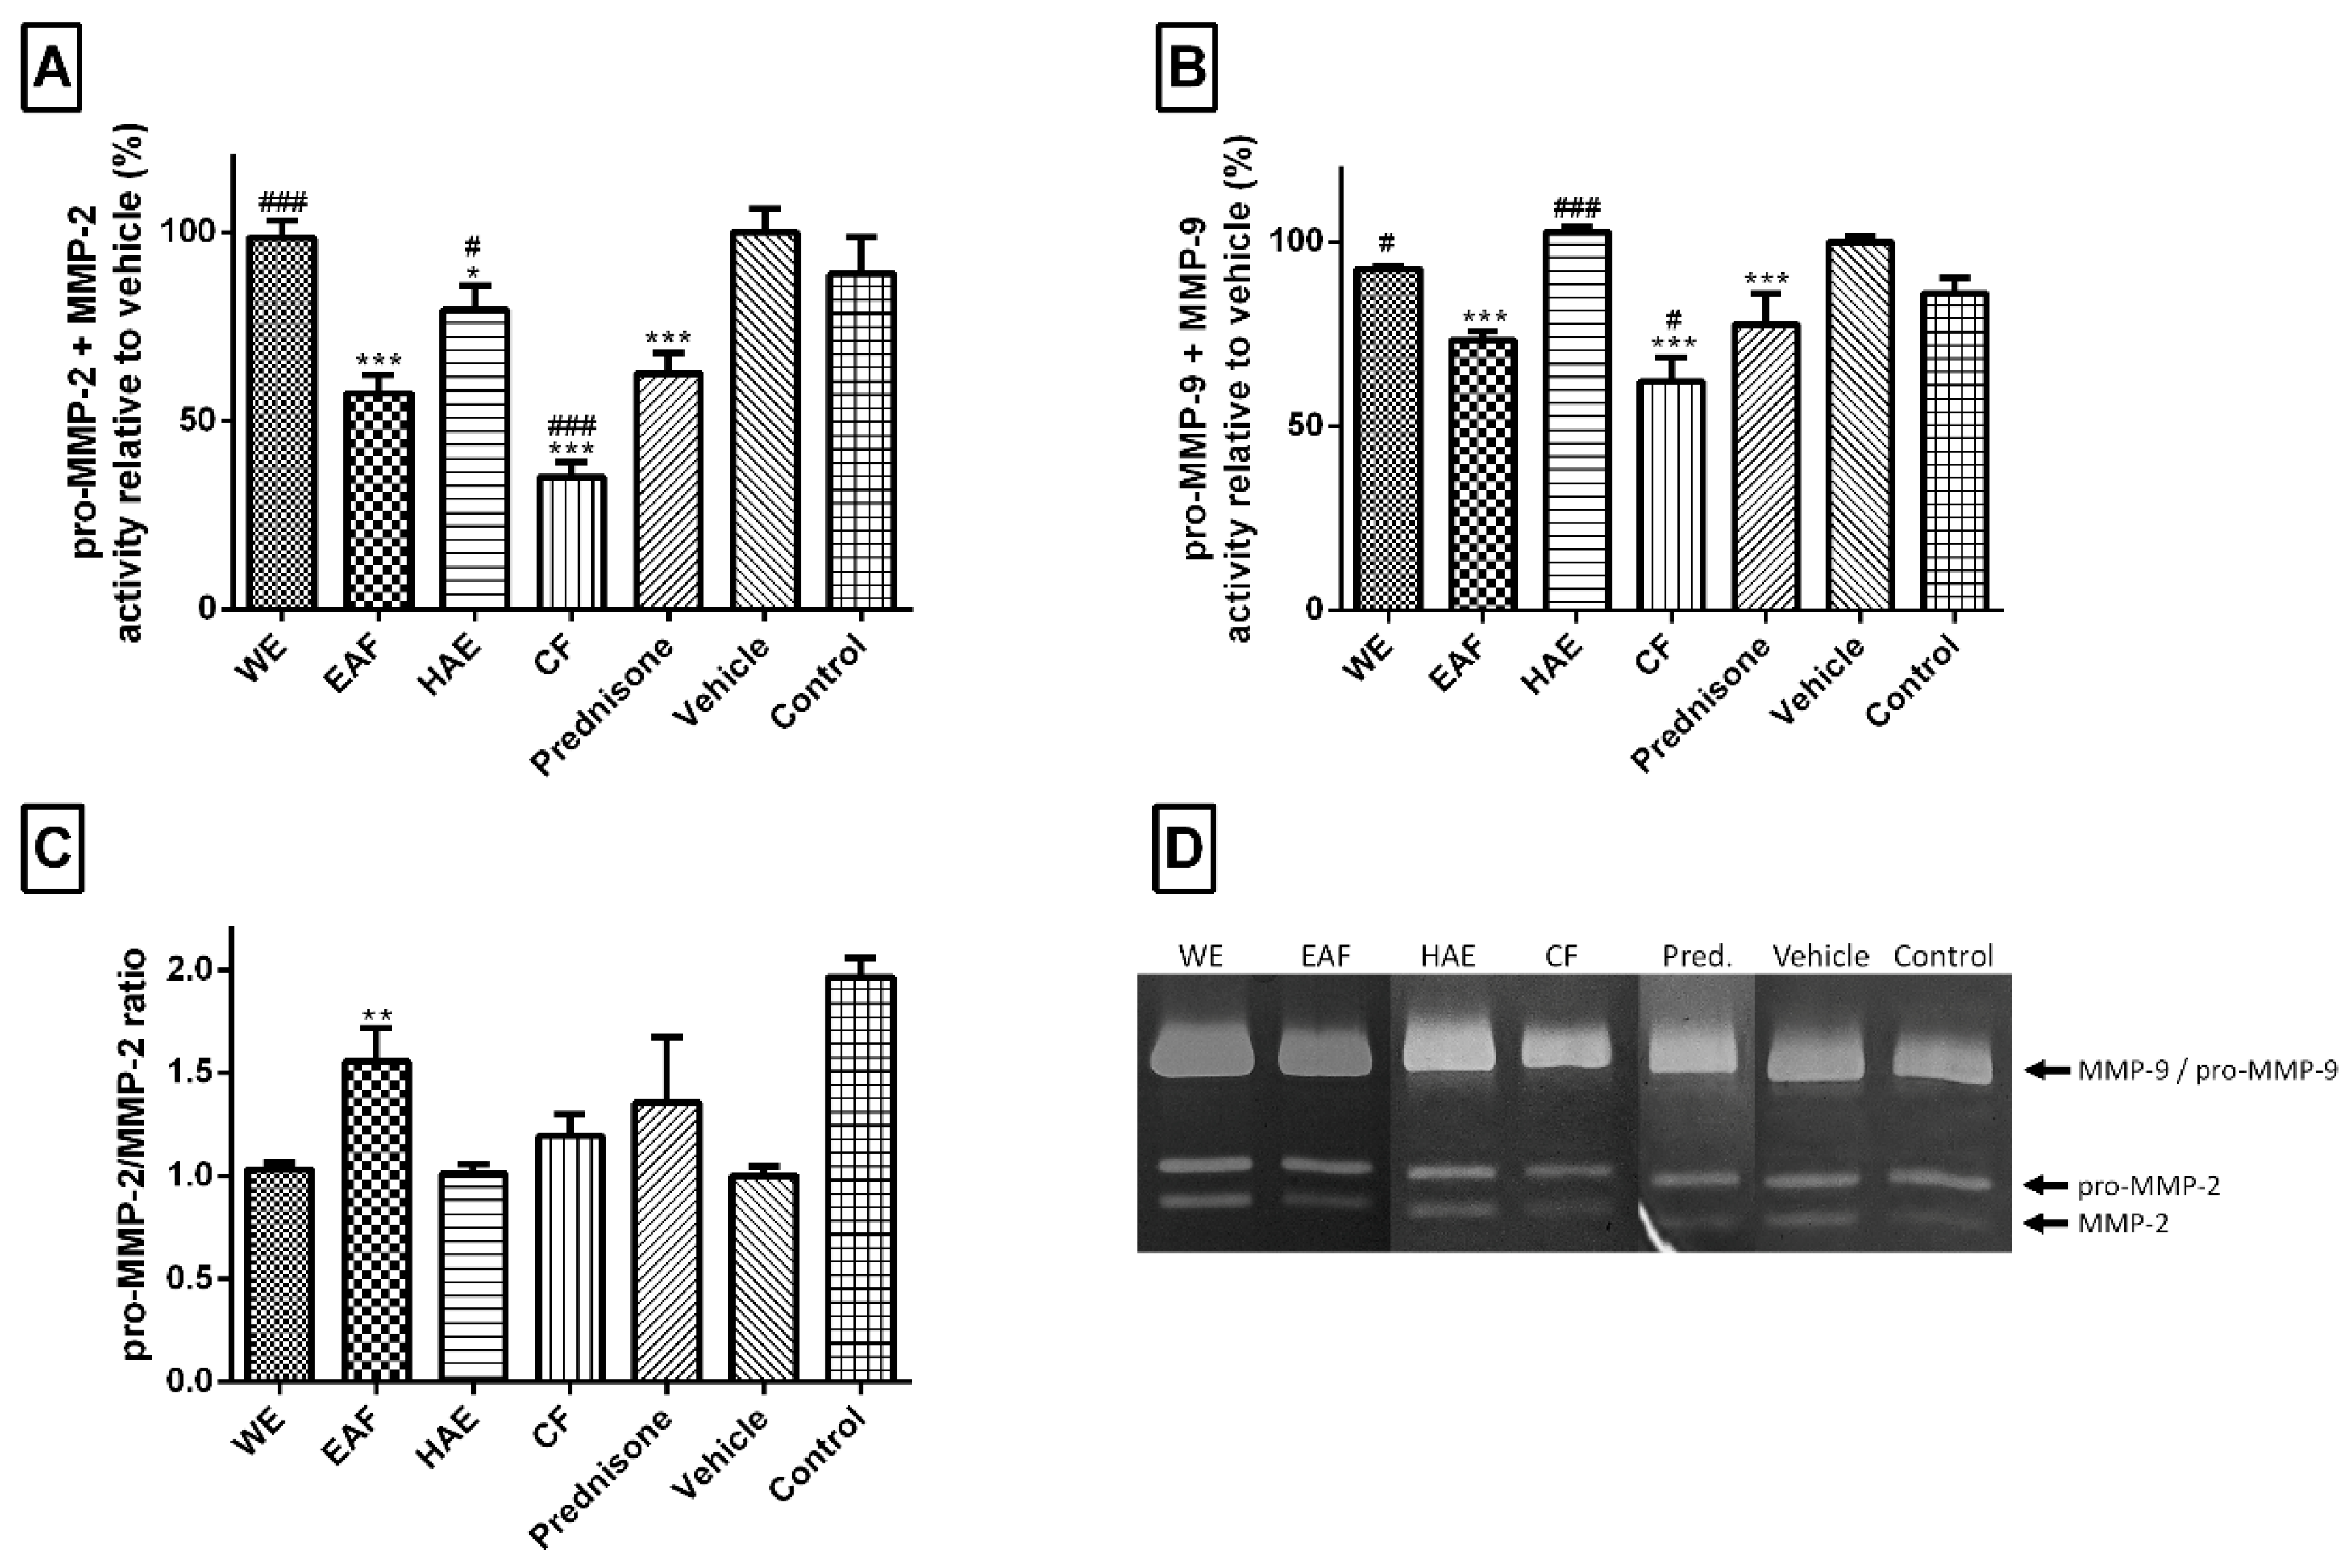
2.3. The Effect on Inflammatory Mediators
2.4. The Anti-Hypercholesterolemic Activity
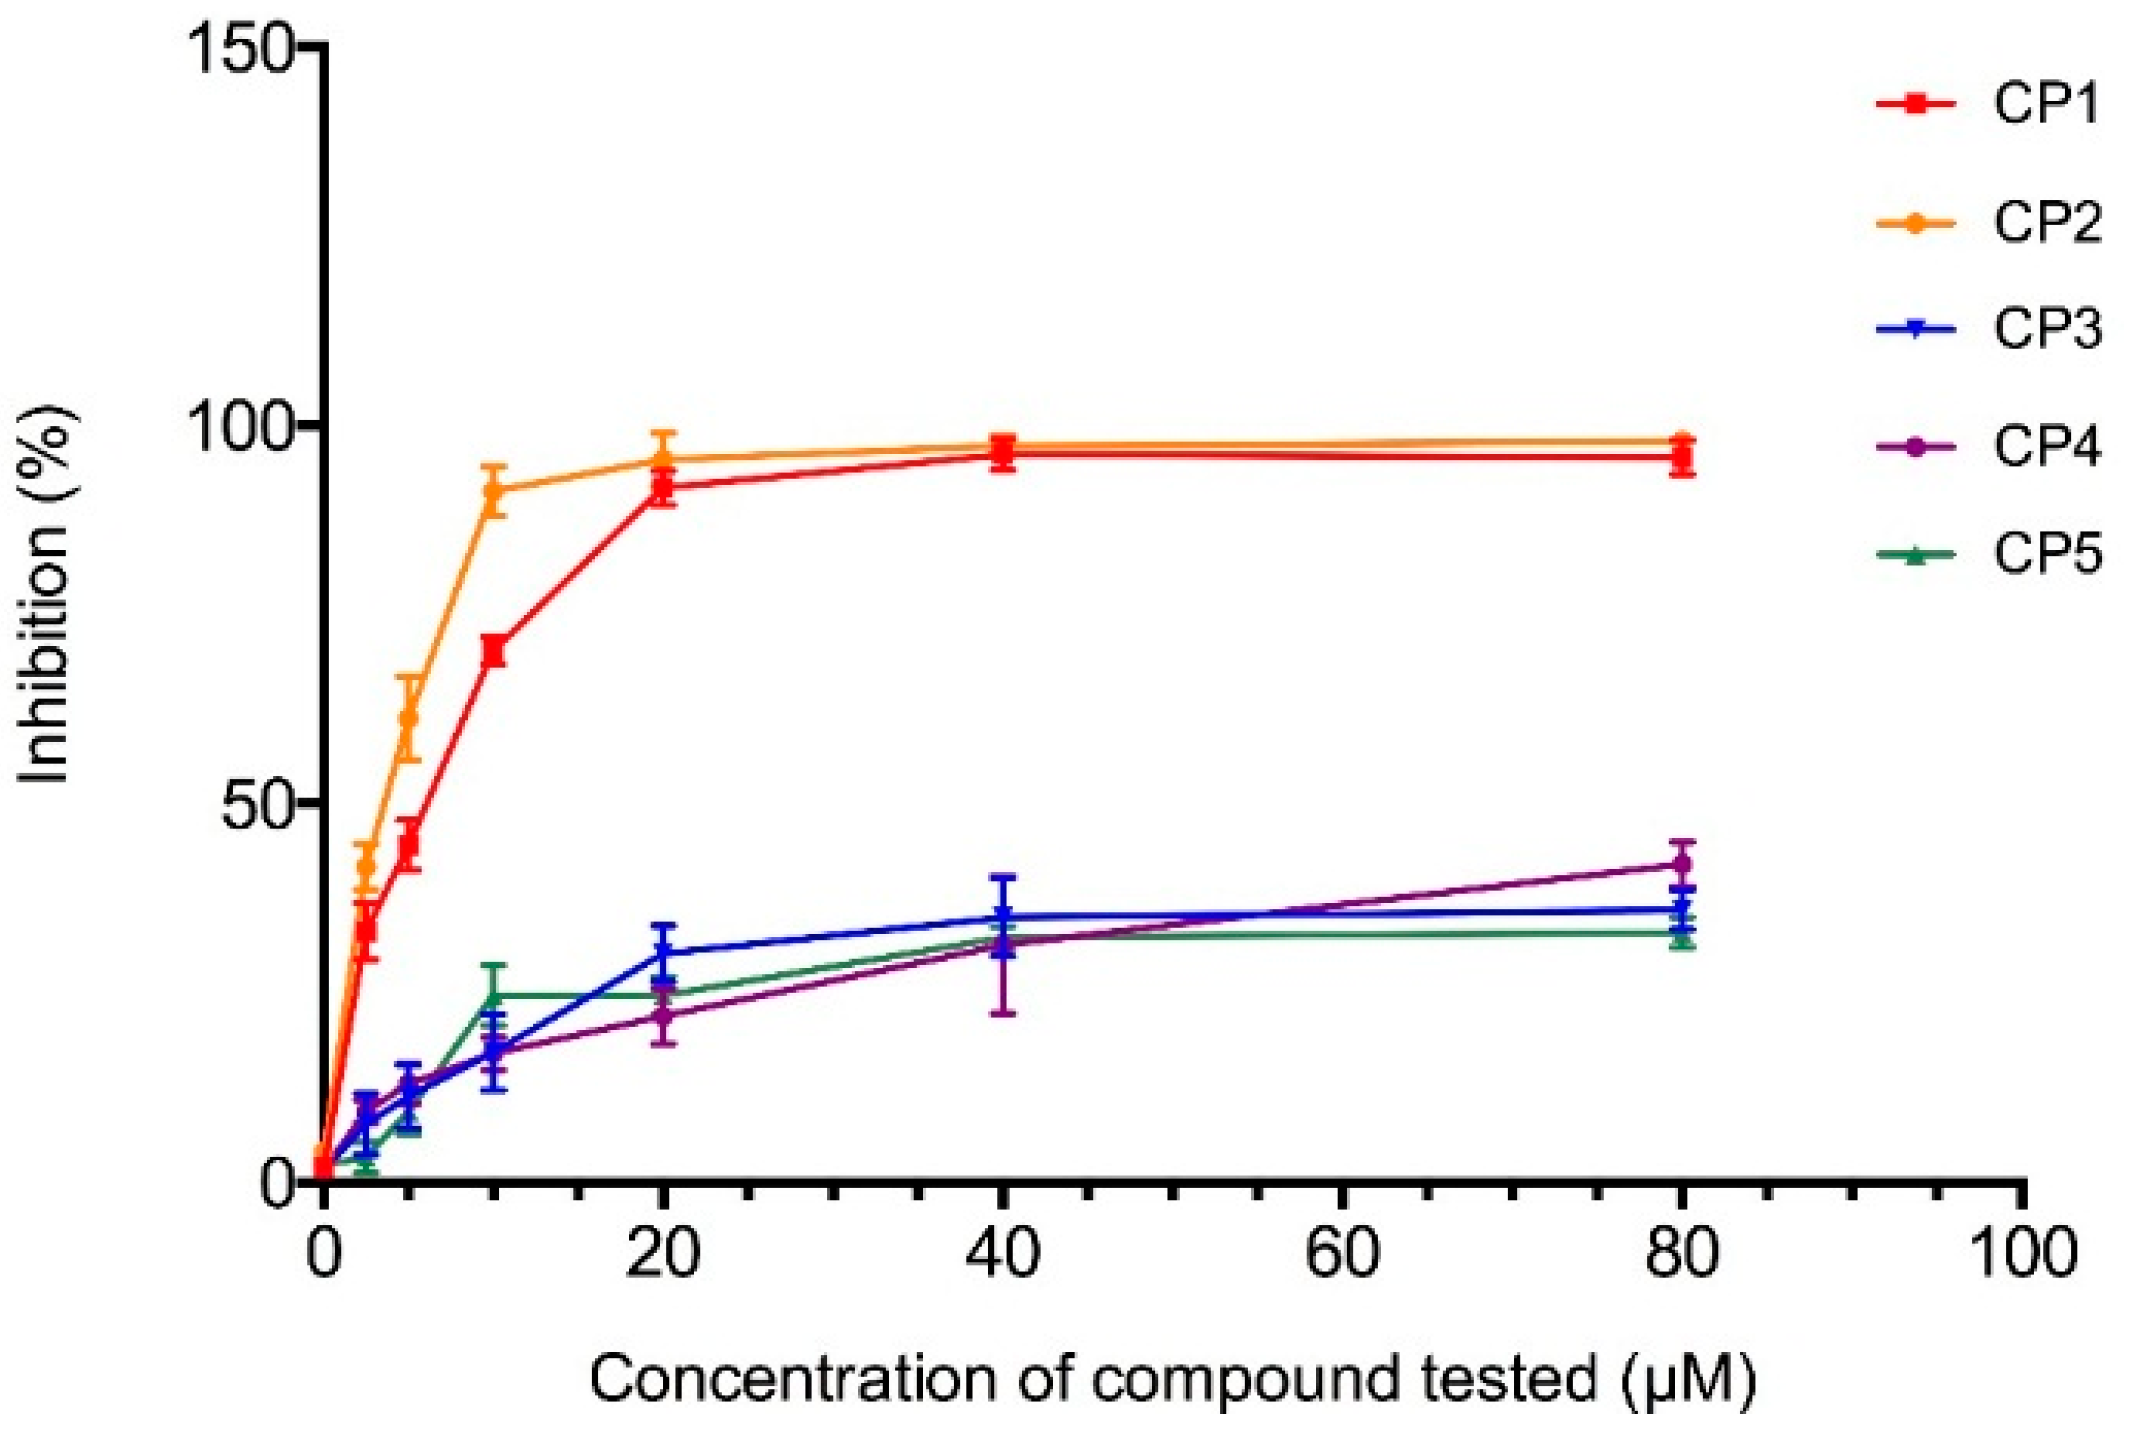
2.4.1. The 3-Hydroxy-3-methyl-glutaryl-CoA Reductase Inhibition Assay
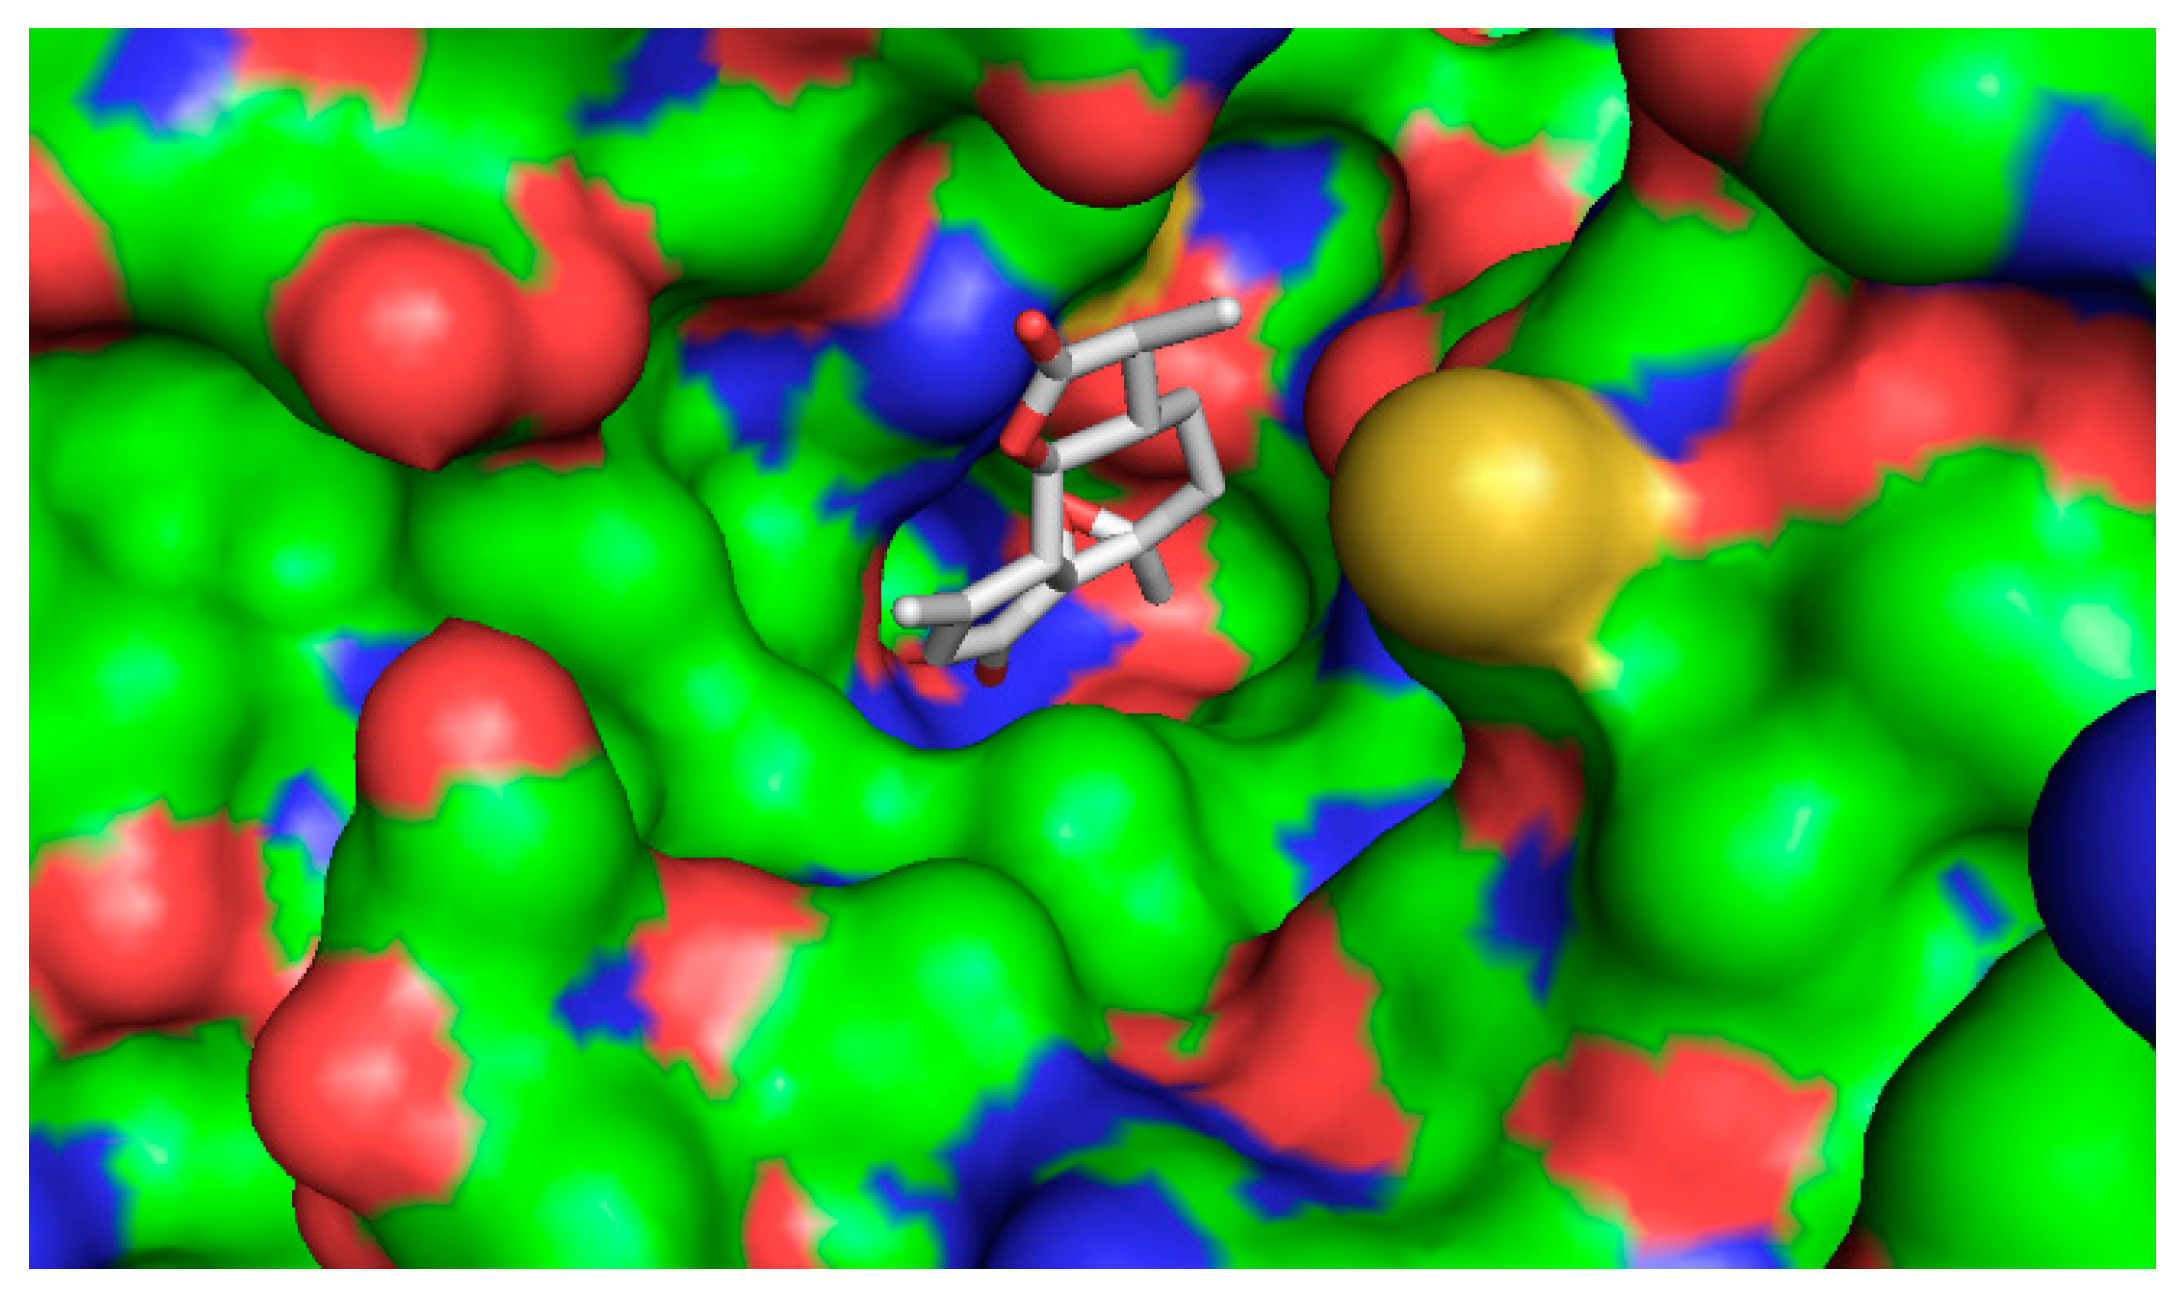
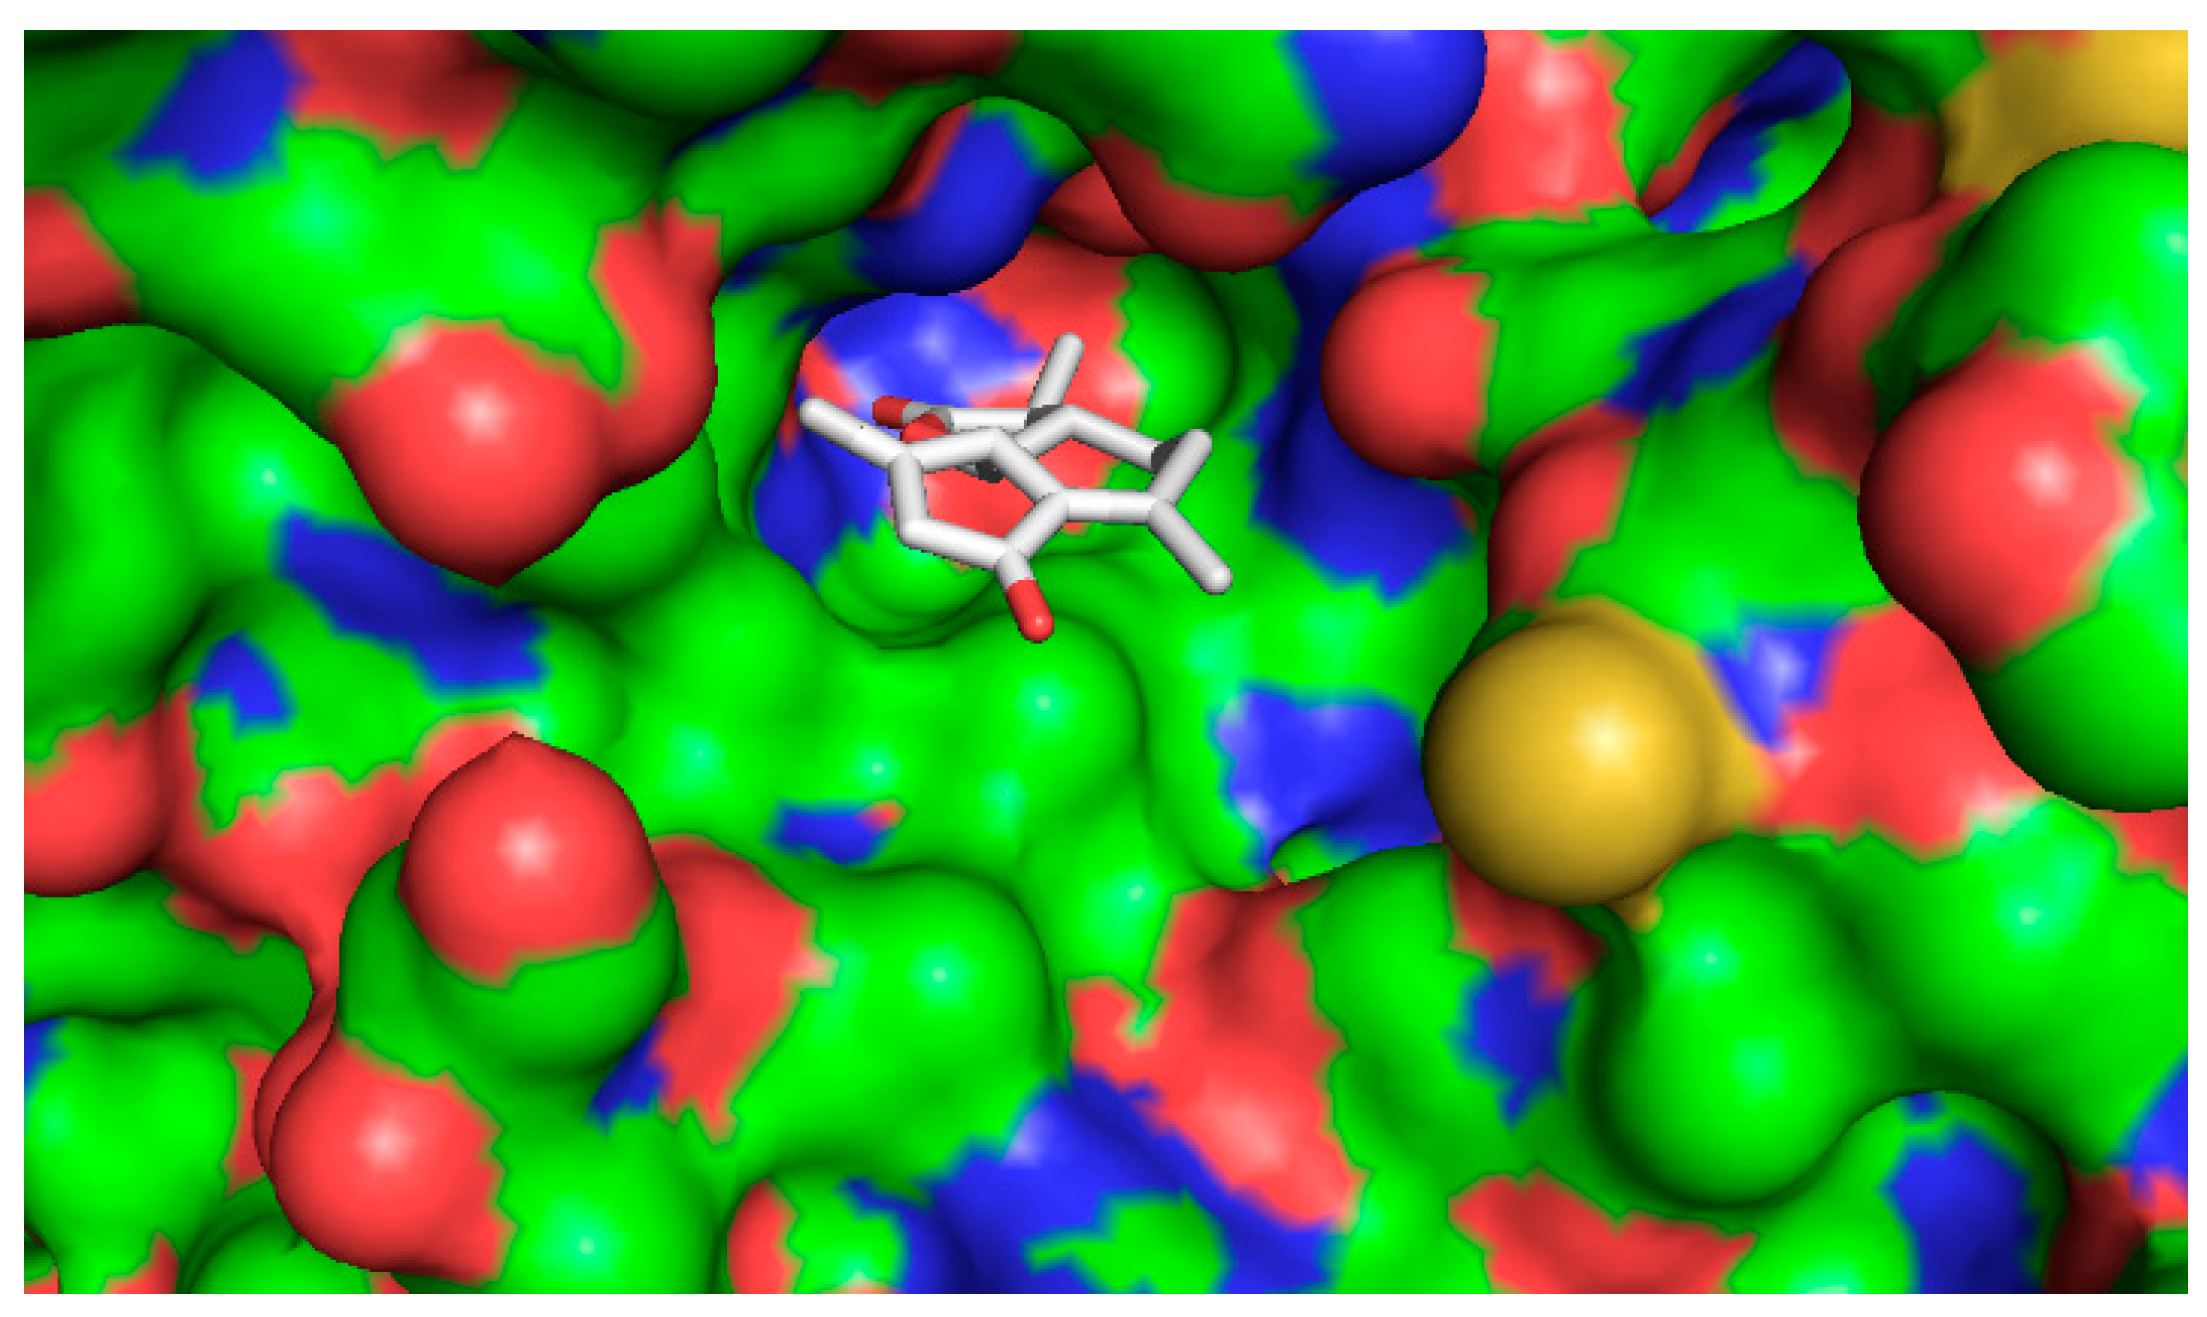
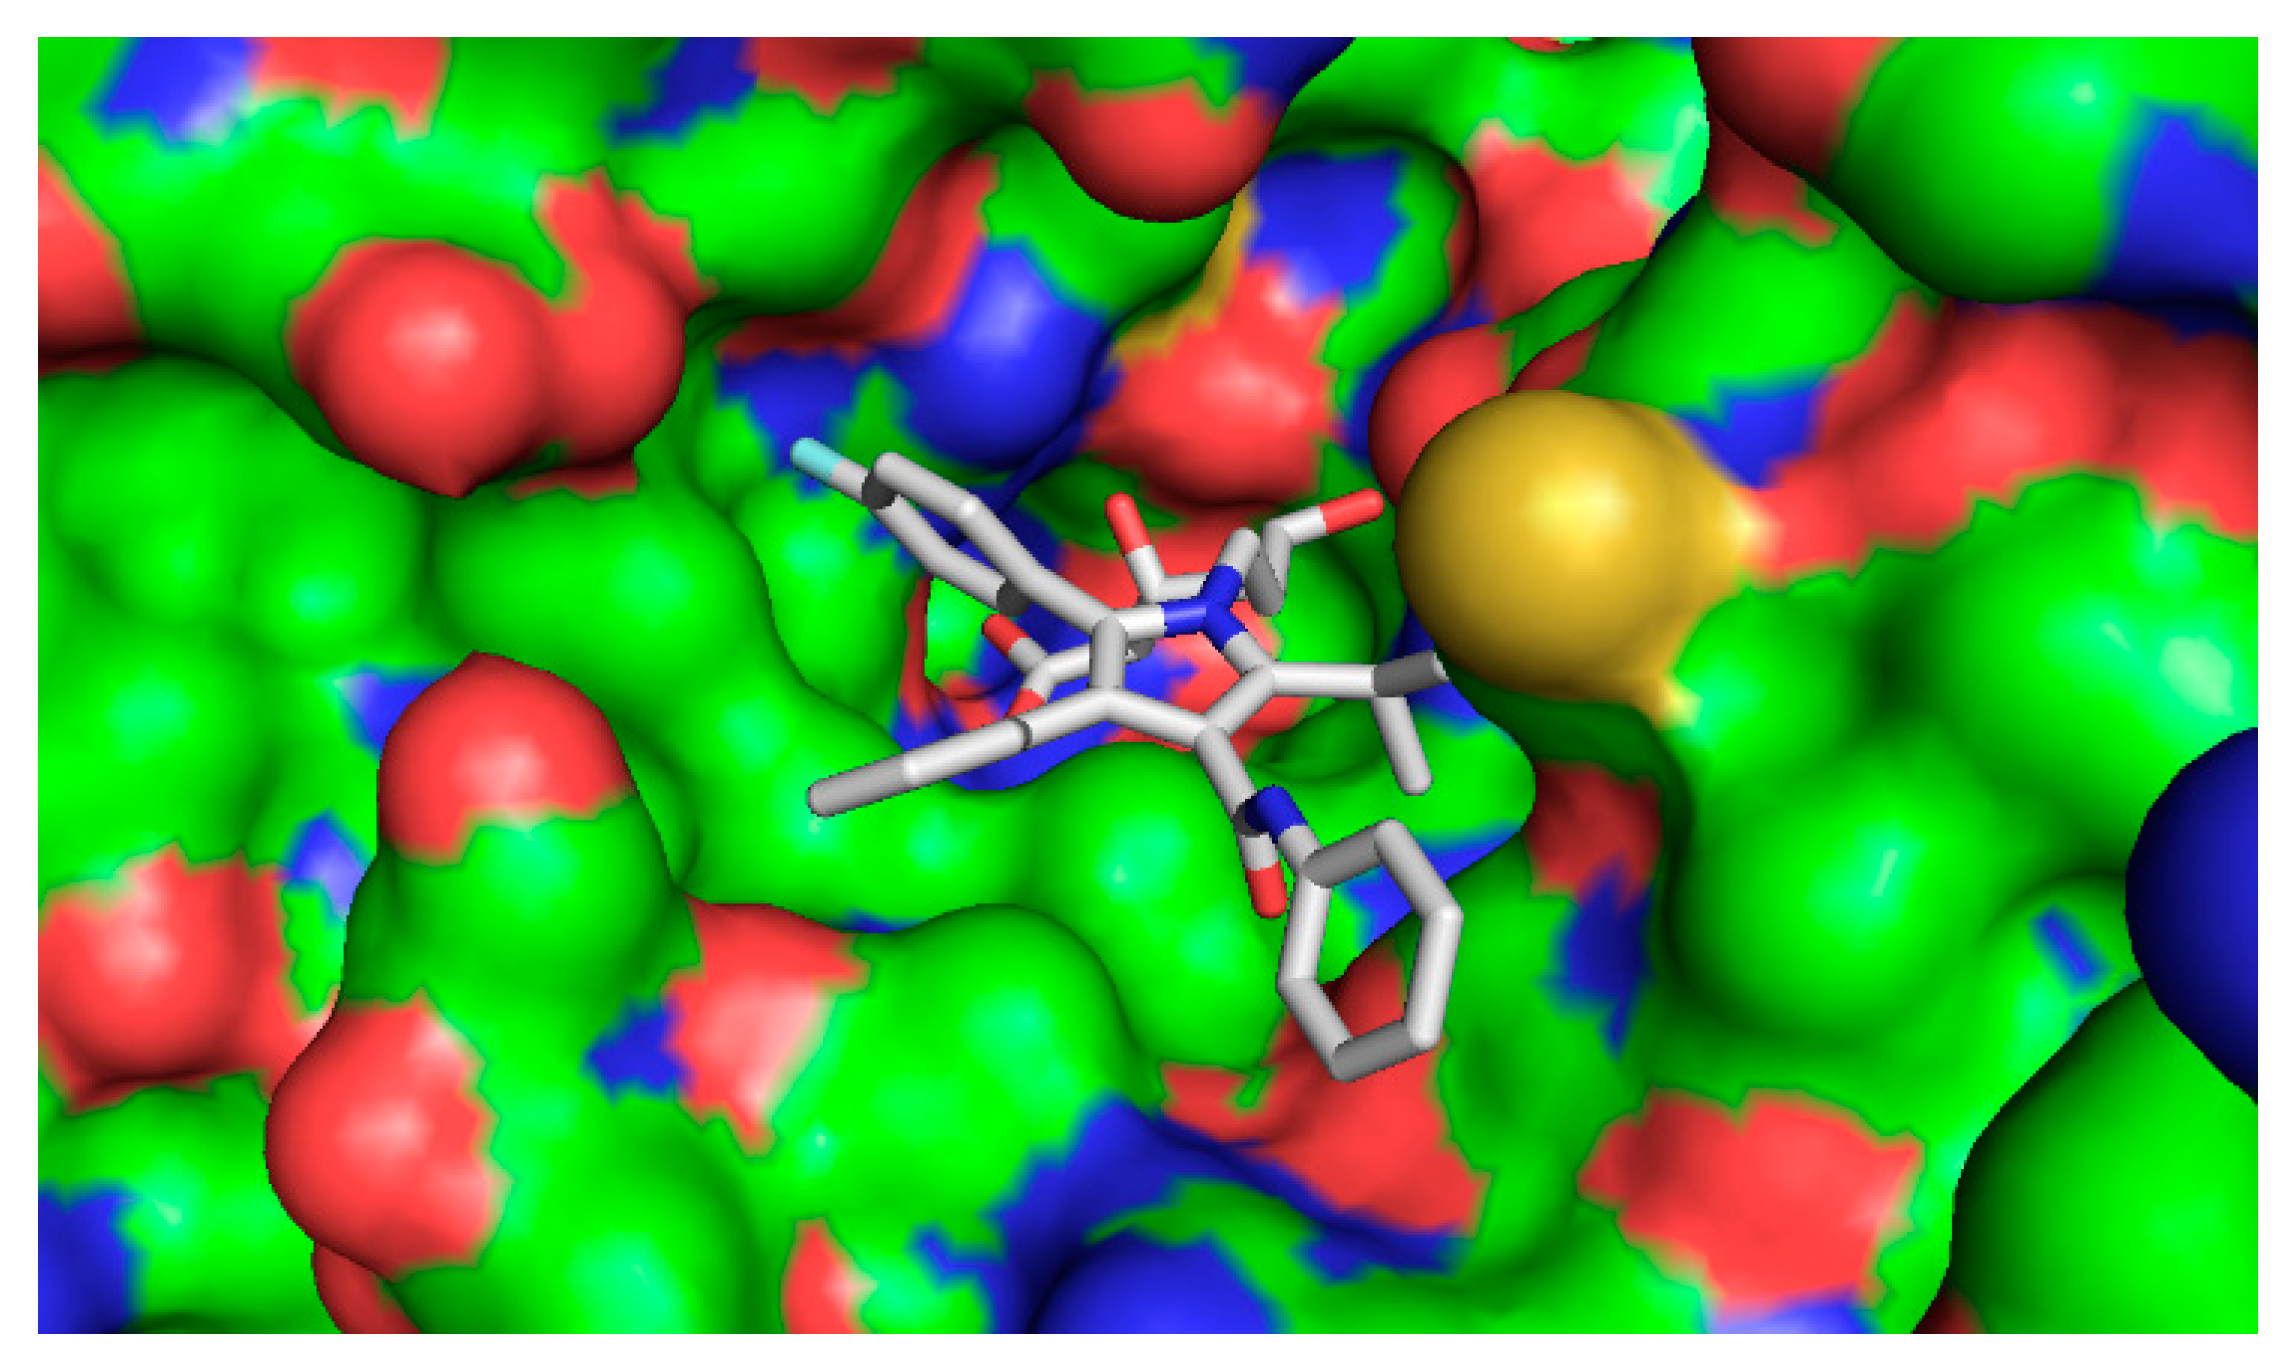
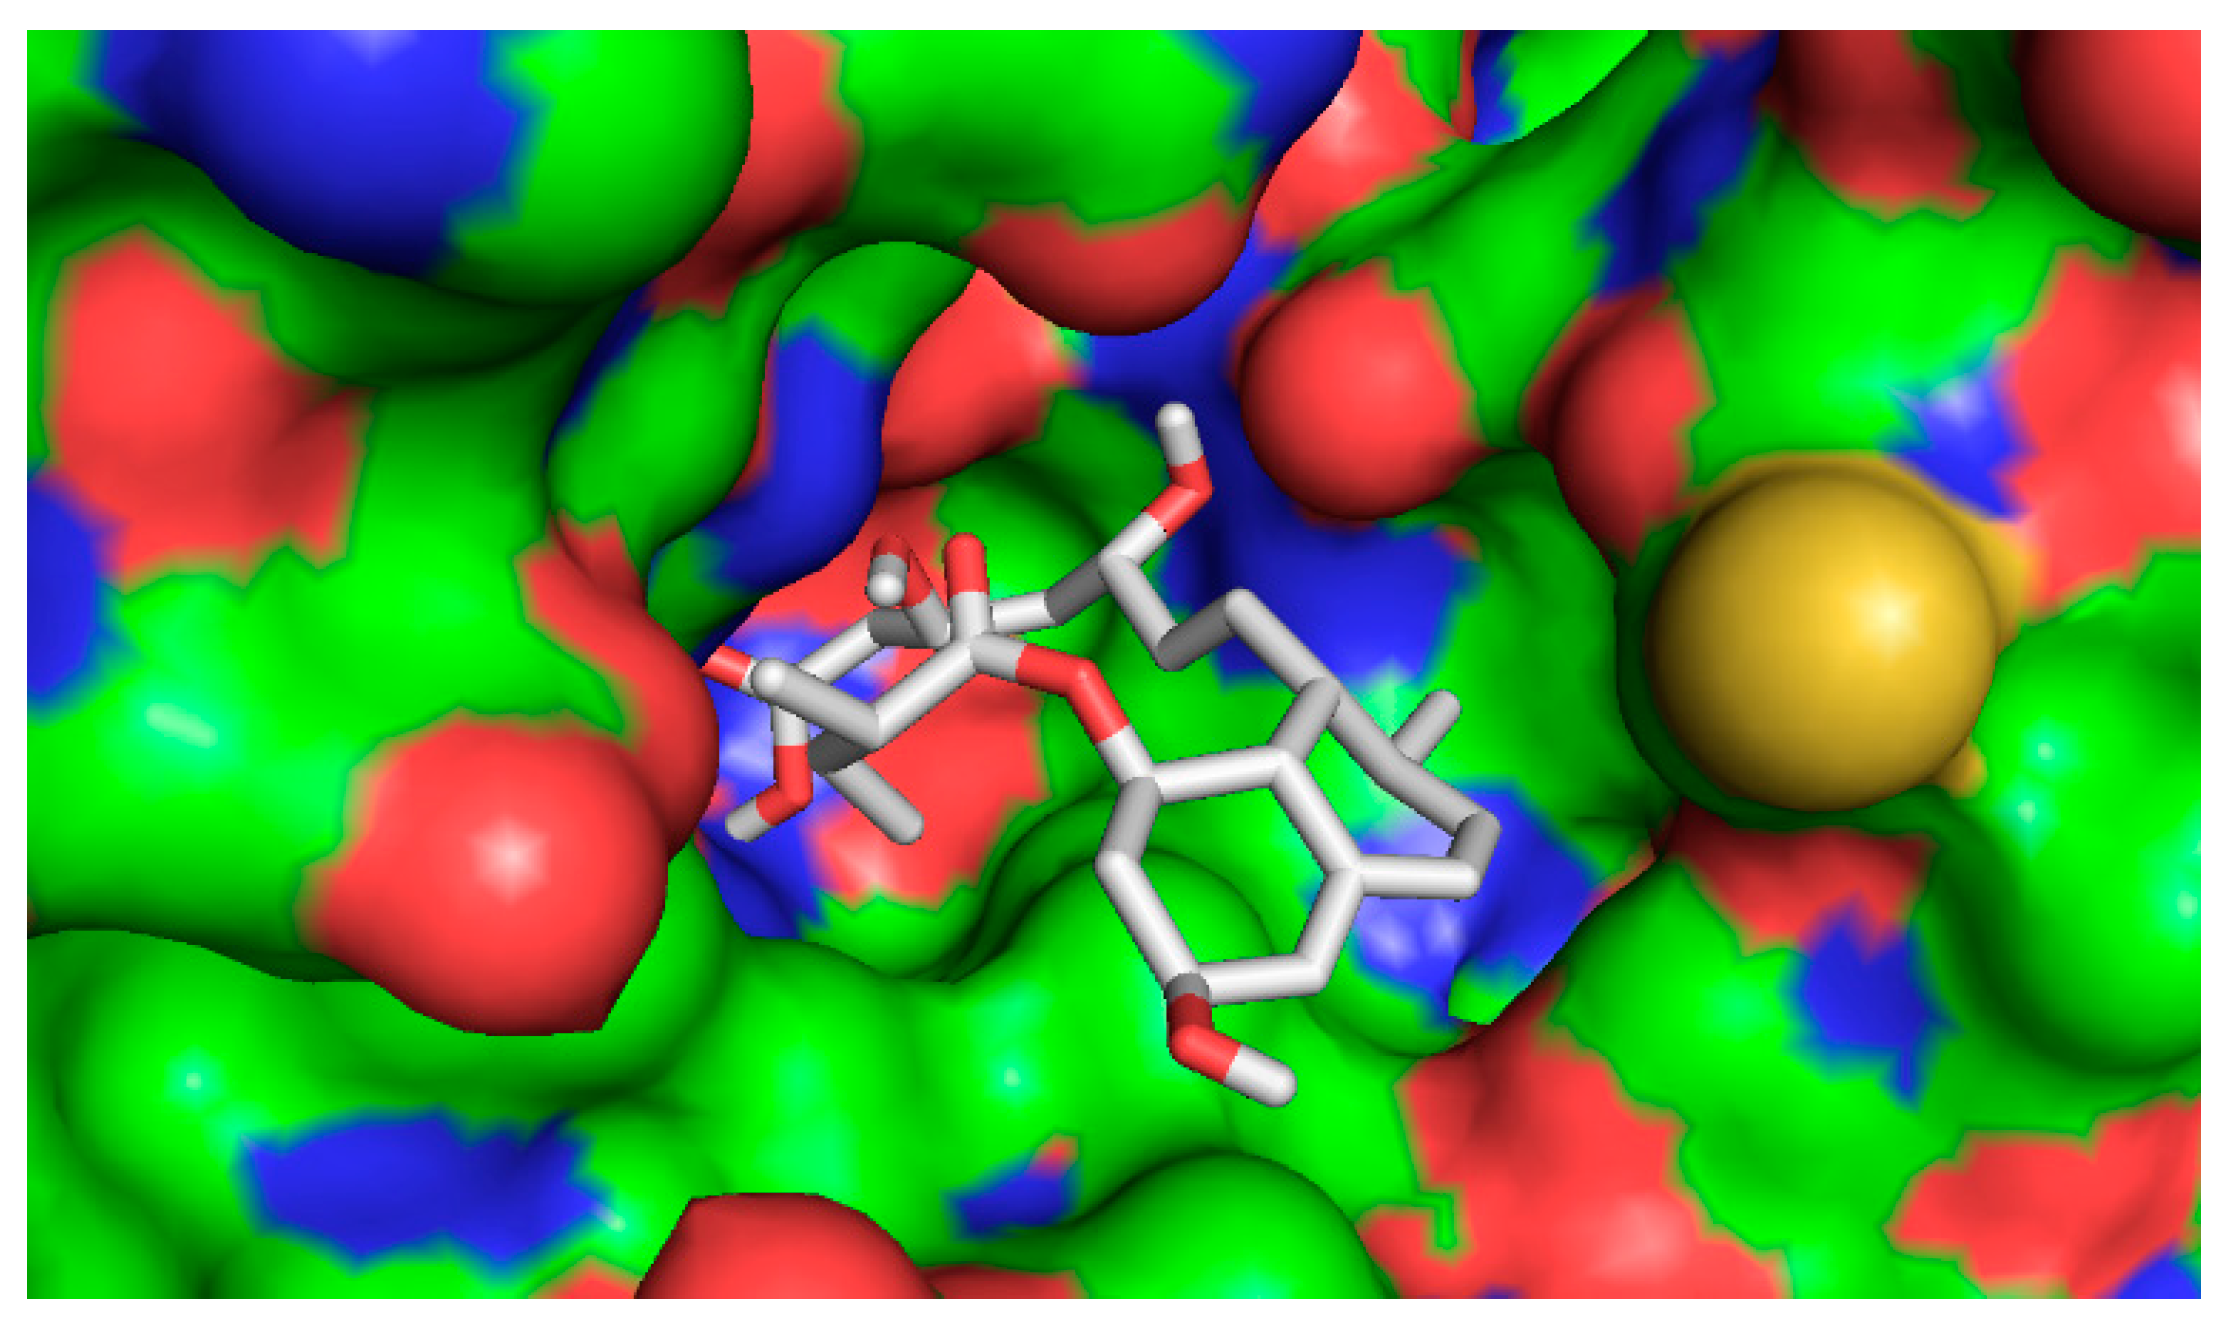
2.4.2. Computational Docking
3. Discussion
4. Materials and Methods
4.1. Plant Material
4.2. Extraction
4.2.1. Preparation of A. wilhelmsii Crude Extracts
4.2.2. Fractionation by Solvent-Solvent Extraction
4.3. Phytochemical Analyses
4.3.1. HPLC-DAD-MS Analysis
4.3.2. Determination of Phenolic Compounds Content
4.3.3. Determination of Flavone and Flavonol Content
4.4. The Hypoglycemic Activity
4.4.1. Animals
4.4.2. Induction of Experimental Diabetes
4.4.3. Experimental Design
- Group 1: Healthy mice;
- Group 2: Diabetic control;
- Group 3: Diabetic mice + 200 mg/kg WE;
- Group 4: Diabetic mice + 200 mg/kg EAF;
- Group 5: Diabetic mice + 200 mg/kg HAE;
- Group 6: Diabetic mice + 200 mg/kg CF;
- Group 7: Diabetic mice + 50 mg/kg quercetin suspension.
4.4.4. Histology Study
4.5. The Effect upon Inflammatory Mediators
4.5.1. Materials
4.5.2. Cell Maintenance and Macrophage Preparation
4.5.3. Drug Treatment, Induction of Inflammation and Evaluation of TNF-α Secretion
4.5.4. Zymography
4.6. Statistical Analysis
4.7. The Anti-Hypercholesterolemic Activity
4.7.1. In Vitro HMGR Inhibition Assay
4.7.2. The Isolation, Identification and HMGR Inhibition Activity Testing of the Main Compounds in the CF
4.7.3. Computational Docking
Ligand Preparation
Protein Preparation
Molecular Docking
Supplementary Materials
Acknowledgments
Author Contributions
Conflicts of Interest
Abbreviations
| A. wilhelmsii | Achillea wilhelmsii |
| CF | chloroform fraction |
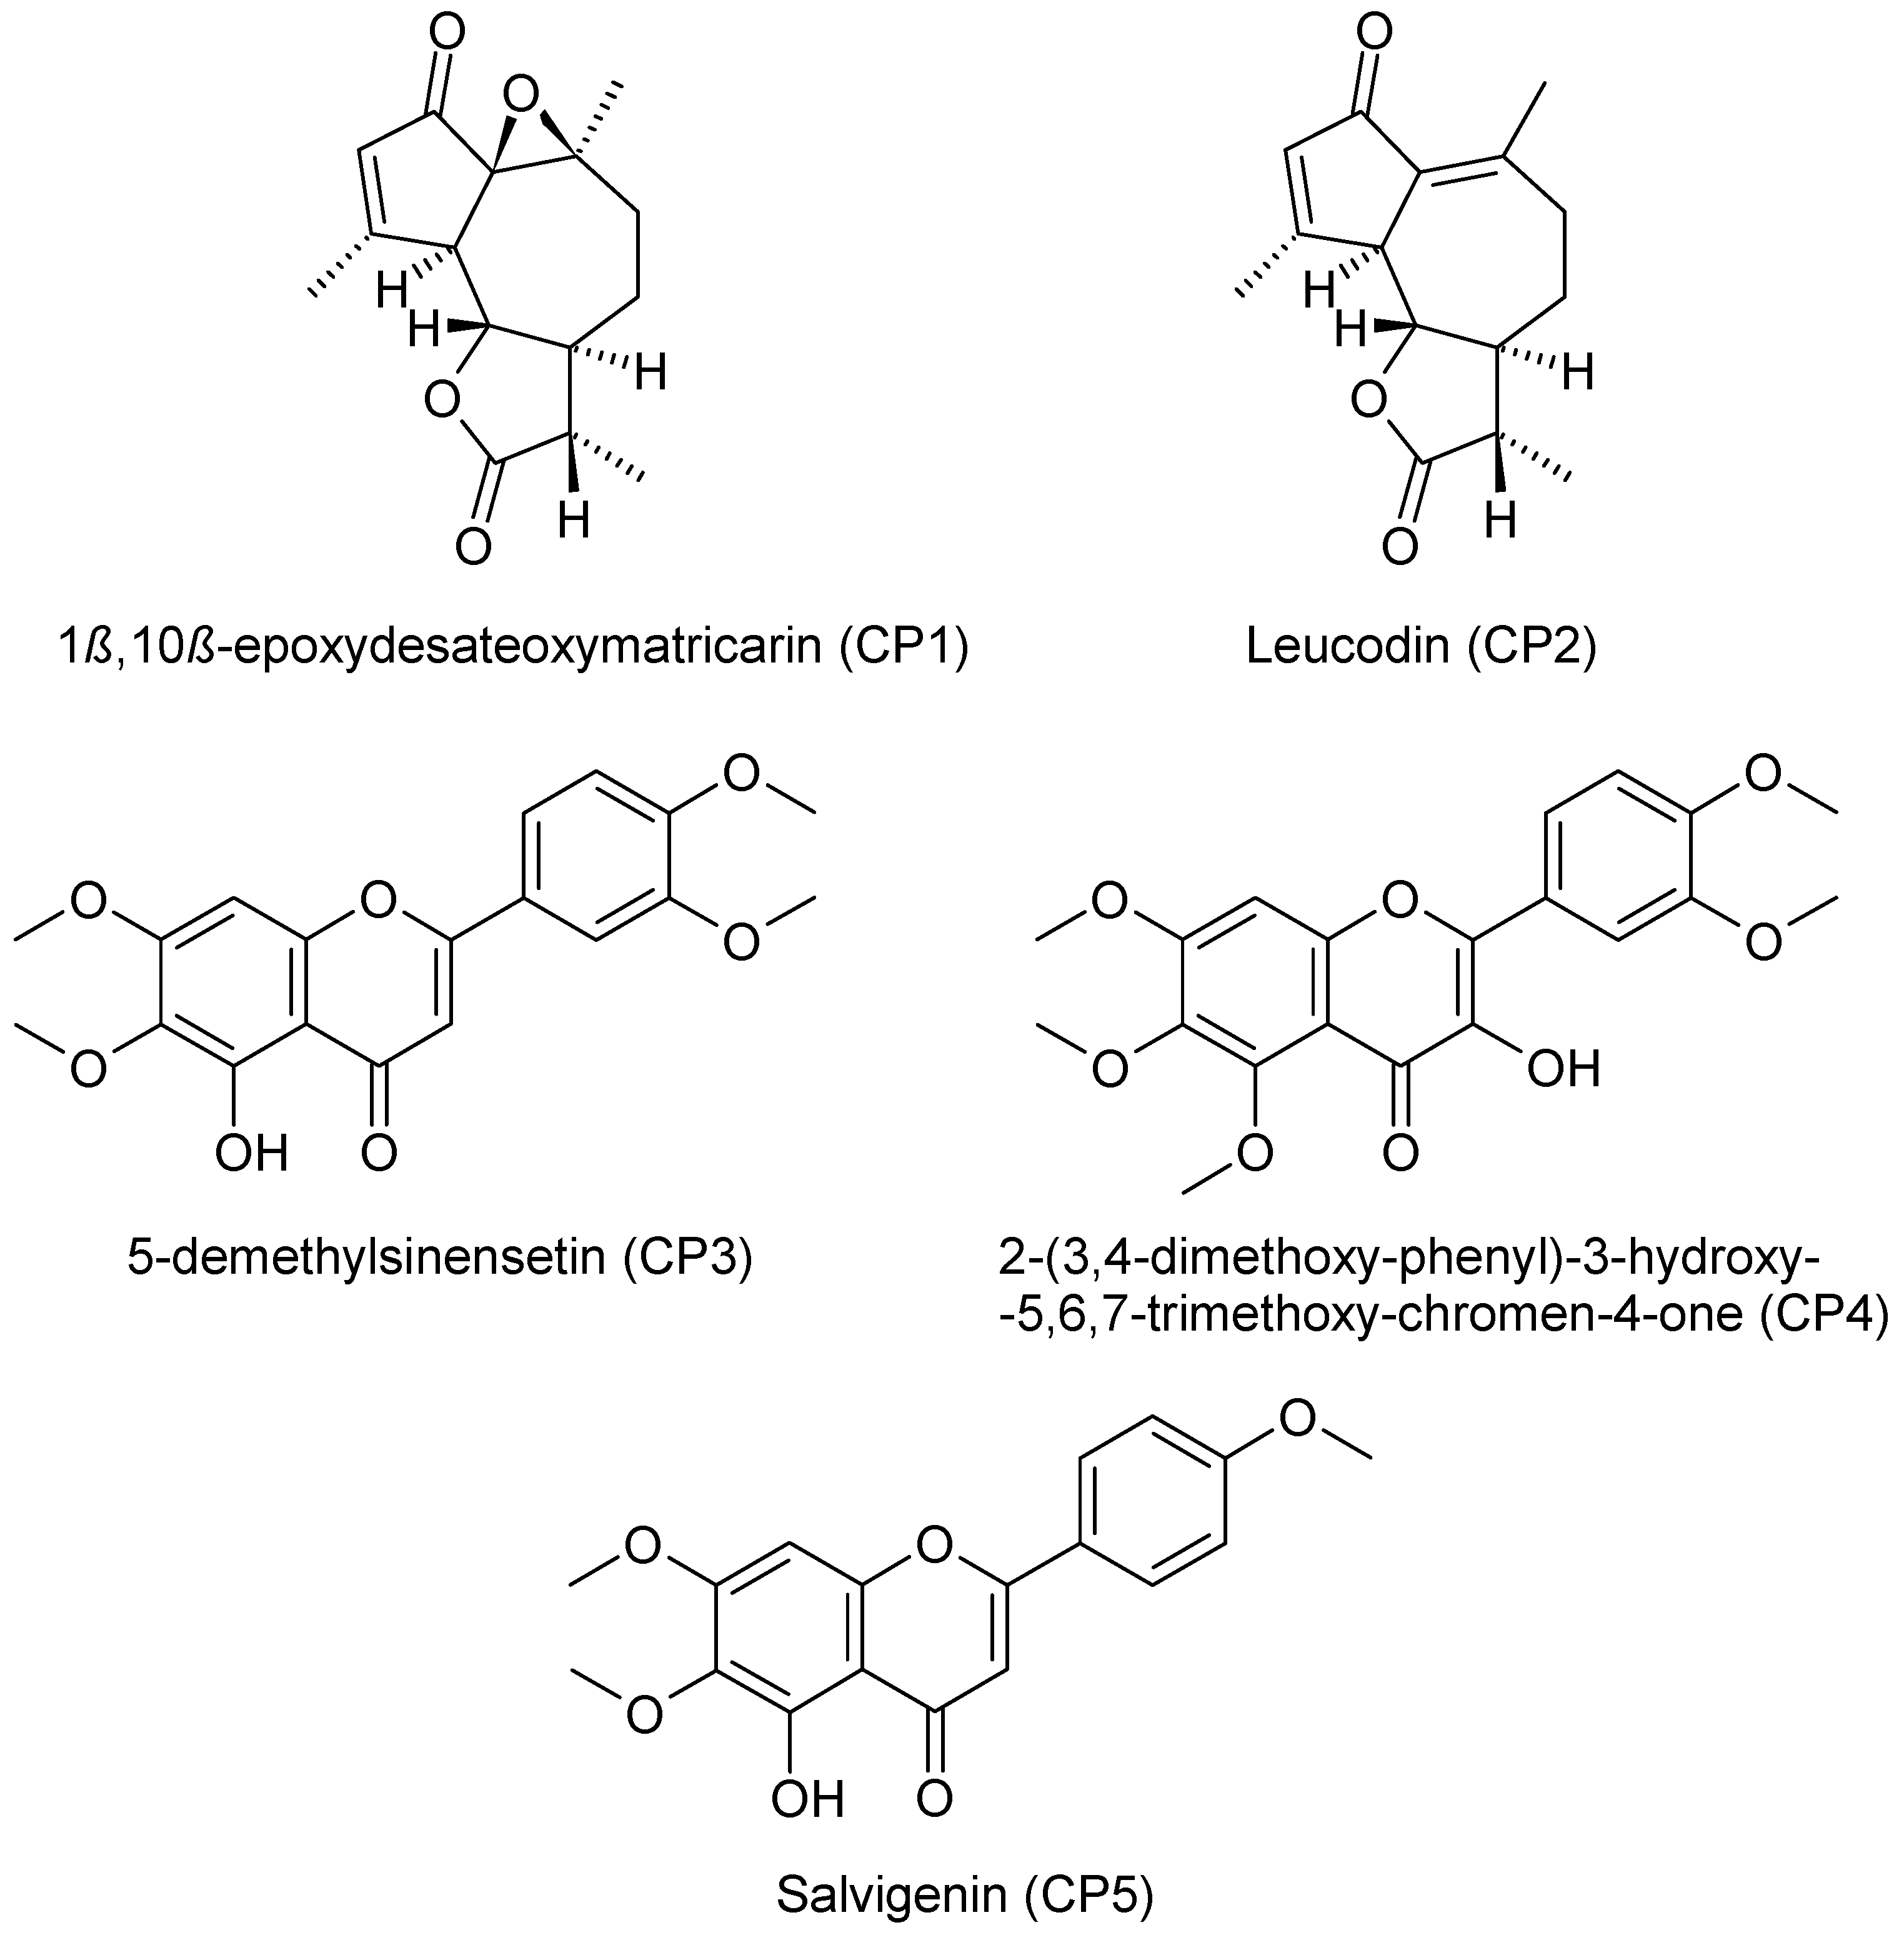
| CP1 | 1β,10β-epoxydesacetoxymatricarin |
| CP2 | Leucodin |
| CP3 | 5-demethylsinensetin |
| CP4 | 2-(3,4-dimethoxy-phenyl)-3-hydroxy-5,6,7-trimethoxy-chromen-4-one |
| CP5 | Salvigenin |
| DUOF | Herbarium of the Faculty of Forestry |
| EAF | ethyl acetate fraction |
| FBGL | fasting blood glucose levels |
| GAE | gallic acid equivalent |
| HAE | hydro-alcoholic extract |
| HMGR | 3-hydroxy-3-methylglutaryl-CoA reductase |
| MMP | matrix-metalloproteinases |
| QE | quercetin equivalent |
| THP-1 | human monocytic cell line derived from an acute monocytic leukemia patient |
| TNF-α | tumor necrosis factor α |
| WE | water extract |
References
- Dokhani, S.H.; Cottrell, T.; Khajeddin, J.; Mazza, G. Analysis of aroma and phenolic components of selected Achillea species. Plant Foods Hum. Nutr. 2005, 60, 55–62. [Google Scholar] [CrossRef] [PubMed]
- Trifunovic, S.; Vajs, V.; Juranic, Z.; Zizak, Z.; Tesevic, V.; Macura, S.; Milosavljevic, S. Cytotoxic constituents of Achillea clavennae from Montenegro. Phytochemistry 2006, 67, 887–893. [Google Scholar] [CrossRef] [PubMed]
- Rezaeipoor, R.; Saeidnia, M.; Kamalinejad, M. Immunosuppressive activity of Achillea talagonica on humoral immune responses in experimental animals. J. Ethnopharmacol. 2005, 14, 221–227. [Google Scholar] [CrossRef]
- Konyalioglu, S.; Karamenderes, C. The protective effects of Achillea L. species native in Turkey against H2O2-induced oxidative damage in human erythrocytes and leucocytes. J. Ethnopharmacol. 2005, 14, 221–227. [Google Scholar] [CrossRef] [PubMed]
- Kotan, R.; Cakir, A.; Dadasoglu, F.; Aydin, T.; Cakmakci, R.; Ozar, H.; Kordali, S.; Mete, E.; Dikbas, N. Antibacterial activities of essential oils and extracts of Turkish achillea, Satureja and Thymus species against plant pathogenic bacteria. J. Sci. Food Agric. 2010, 15, 145–160. [Google Scholar] [CrossRef] [PubMed]
- Stojanovic, G.; Radulovic, N.; Hashimoto, T.; Palic, R. In vitro antimicrobial activity of extracts of four Achillea species: The composition of Achillea clavennae L. (Asteraceae) extract. J. Ethnopharmacol. 2005, 101, 185–190. [Google Scholar] [CrossRef] [PubMed]
- Yazdanparast, R.; Ardestani, A.; Jamshidi, S.H. Experimental diabetes treated with Achillea santolina: Effect on pancreatic oxidative parameters. J. Ethnopharmacol. 2007, 112, 13–18. [Google Scholar] [CrossRef] [PubMed]
- Karamenderes, C.; Apaydin, S. Antispasmodic effect of Achillea nobilis L. subsp. Sipylea (O. Schwarz) Bassler on the rat isolated duodenum. J. Ethnopharmacol. 2003, 84, 175–179. [Google Scholar] [CrossRef]
- Potrich, F.B.; Allemand, A.; da Silva, L.M.; dos Santos, A.C.; Baggio, C.H.; Freitas, C.S.; Mendes, D.A.G.B.; Andre, E.; Werner, M.F.P.; Marques, M.C.A. Antiulcerogenic activity of hydroalcoholic extract of Achillea millefolium L.: Involvement of the antioxidant system. J. Ethnopharmacol. 2010, 130, 85–92. [Google Scholar] [CrossRef] [PubMed]
- Cavalcanti, A.M.; Baggio, C.H.; Freitas, C.S.; Rieck, L.; de Sousa, R.S.; Da Silva-Santos, J.E.; Mesia-Vela, S.; Marques, M.C.A. Safety and antiulcer efficacy studies of Achillea millefolium L. after chronic treatment in Wistar rats. J. Ethnopharmacol. 2006, 107, 277–284. [Google Scholar] [CrossRef] [PubMed]
- Tuberoso, C.I.G.; Montoro, P.; Piacente, S.; Corona, G.; Deiana, M.; Dessi, M.A.; Pizza, C.; Cabras, P. Flavonoid characterization and antioxidant activity of hydroalcoholic extracts from Achillea ligustica All. J. Pharm. Biomed. Anal. 2009, 50, 440–448. [Google Scholar] [CrossRef] [PubMed]
- Kaliora, A.C.; Dedoussis, G.V.Z. Natural antioxidant compounds in risk factors for CVD. Pharmacol. Res. 2007, 56, 99–109. [Google Scholar] [CrossRef] [PubMed]
- Tosun, F.; Kizilay, C.A.; Sener, B.; Vural, M.; Palittapongarnpim, P. Antimycobacterial screening of some Turkish plants. J. Ethnopharmacol. 2004, 95, 273–275. [Google Scholar] [CrossRef] [PubMed]
- Shetty, A.K.; Rashmi, R.; Rajan, M.G.R.; Sambaiah, K.; Salimath, P.V. Antidiabetic influence of quercetin in Streptozotocin-induced diabetic rats. Nutr. Res. 2004, 24, 373–381. [Google Scholar] [CrossRef]
- Jamkhande, P.G.; Chandak, P.G.; Dhawale, S.C.; Barde, S.R.; Tidke, P.S.; Sakhare, R.S. Therapeutic approaches to drug targets in atherosclerosis. Saudi Pharm. J. 2014, 22, 179–190. [Google Scholar] [CrossRef] [PubMed]
- Bhatnagar, D.; Soran, H.; Durrington, P.N. Hypercholesterolaemia and its management. BMJ 2008, 337. [Google Scholar] [CrossRef] [PubMed]
- Buhaescu, I.; Izzedine, H. Mevalonate pathway: A review of clinical and therapeutical implications. Clin. Biochem. 2007, 40, 575–584. [Google Scholar] [CrossRef] [PubMed]
- Manzoni, M.; Rollini, M. Biosynthesis and biotechnological production of statins by filamentous fungi and application of these cholesterol-lowering drugs. Appl. Microbiol. Biotechnol. 2002, 58, 555–564. [Google Scholar] [PubMed]
- Ferguson, J.F.; Ryan, M.F.; Gibney, E.R.; Brennan, L.; Roche, H.M.; Reilly, M.P. Dietary isoflavone intake is associated with evoked responses to inflammatory cardiometabolic stimuli and improved glucose homeostasis in healthy volunteers. Nutr. Metab. Cardiovasc. Dis. 2014, 24, 996–1003. [Google Scholar] [CrossRef] [PubMed]
- Braun, L.M.; Rodríguez, D.A.; Evenson, K.R.; Hirsch, J.A.; Moore, K.A.; Roux, A.V.D. Walkability and cardiometabolic risk factors: Cross-sectional and longitudinal associations from the Multi-Ethnic Study of Atherosclerosis. Health Place 2016, 39, 9–17. [Google Scholar] [CrossRef] [PubMed]
- Carney, R.; Cotter, J.; Bradshaw, T.; Firth, J.; Yung, A.R. Cardiometabolic risk factors in young people at ultra-high risk for psychosis: A systematic review and meta-analysis. Schizophr. Res. 2016, 170, 290–300. [Google Scholar] [CrossRef] [PubMed]
- Bastien, M.; Poirier, P.; Lemieux, I.; Despres, J.P. Overview of epidemiology and contribution of obesity to cardiovascular disease. Prog. Cardiovasc. Dis. 2014, 56, 369–381. [Google Scholar] [CrossRef] [PubMed]
- Mathieu, P.; Poirier, P.; Pibarot, P.; Lemieux, I.; Després, J.P. Visceral obesity: The link among inflammation, hypertension, and cardiovascular disease. Hypertension. 2009, 53, 577–584. [Google Scholar] [CrossRef] [PubMed]
- Moy, F.M.; Loh, D.A. Cardiometabolic risks profile of normal weight obese and multi-ethnic women in a developing country. Maturitas 2015, 81, 389–393. [Google Scholar] [CrossRef] [PubMed]
- Bernatoniene, J.; Petkeviciute, Z.; Kalveniene, Z.; Masteikova, R.; Draksiene, G.; Muselik, J.; Bernatoniene, R.; Lazauskas, R.; Savickas, A. The investigation of phenolic compounds and technological properties of Leonurus, Crataegus and Ginkgo extracts. J. Med. Plants Res. 2010, 4, 925–931. [Google Scholar] [CrossRef]
- Soto, C.; Mena, R.; Luna, J.; Cerbon, M.; Larrieta, E.; Vital, P.; Uriae, E.; Sancheza, M.; Recobaa, R.; Barrona, H.; et al. Silymarin induces recovery of pancreatic function after alloxan damage in rats. Life Sci. 2004, 75, 2167–2180. [Google Scholar] [CrossRef] [PubMed]
- Ahlem, S.; Khaled, H.; Wafa, M.; Sofiane, B.; Mohamed, D.; Jean-Claude, M.; Abdelfattah, E.F. Oral administration of Eucalyptus globulus extract reduces the alloxan-induced oxidative stress in rats. Chem. Biol. Interact. 2009, 181, 71–76. [Google Scholar] [CrossRef] [PubMed]
- Valant-Vetschera, K.M. Flavonoid glycoside accumulation trends of Achillea nobilis L. and related species. Biochem. Syst. Ecol. 1987, 15, 45–52. [Google Scholar] [CrossRef]
- Marchart, E.; Kopp, B. Capillary electrophoretic separation and quantification of flavone-O- and C-glycosides in Achillea setacea W. et K. J. Chromatogr. B 2003, 792, 363–368. [Google Scholar] [CrossRef]
- Glasl, S.; Mucaji, P.; Werner, I.; Presser, A.; Jurenitsch, J. Sesquiterpenes and flavonoid aglycones from a Hungarian taxon of the Achillea millefolium group. Z. Naturforsch. C 2002, 57, 976–982. [Google Scholar] [CrossRef] [PubMed]
- Moradkhani, S.; Ayatollahi, A.M.; Ghanadian, M.; Moin, M.R.; Razavizadeh, M.; Shahlaei, M. Phytochemical analysis and metal-chelation activity of Achillea tenuifolia Lam. Iran. J. Pharm. Res. 2012, 11, 177–183. [Google Scholar] [PubMed]
- Saeidnia, S.; Gohari, A.R.; Mokhber-Dezfuli, N.; Kiuchi, F. A review on phytochemistry and medicinal properties of the genus Achillea. Daru 2011, 19, 173–186. [Google Scholar] [PubMed]
- Vessal, M.; Hemmati, M.; Vasei, M. Antidiabetic effects of quercetin in streptozocin-induced diabetic rats. Comp. Biochem. Physiol. C Toxicol. Pharmacol. 2003, 135, 357–364. [Google Scholar] [CrossRef]
- Cazarolli, L.H.; Kappel, V.D.; Pereira, D.F.; Moresco, H.H.; Brighente, I.M.; Pizzolatti, M.G.; Silva, F.R.M.B. Anti-hyperglycemic action of apigenin-6-C-β-fucopyranoside from Averrhoa carambola. Fitoterapia 2012, 83, 1176–1183. [Google Scholar] [CrossRef] [PubMed]
- Zaidi, S.F.; Muhammad, J.S.; Shahryar, S.; Usmanghani, K.; Gilani, A.H.; Jafri, W.; Sugiyama, T. Anti-inflammatory and cytoprotective effects of selected Pakistani medicinal plants in Helicobacter pylori-infected gastric epithelial cells. J. Ethnopharmacol. 2012, 141, 403–410. [Google Scholar] [CrossRef] [PubMed]
- Hosek, J.; Zavalova, V.; Smejkal, K.; Bartos, M. Effect of diplacone on LPS-induced inflammatory gene expression in macrophages. Folia Biol. Praha 2010, 56, 124–130. [Google Scholar] [PubMed]
- Talhouk, R.S.; Chin, J.R.; Unemori, E.N.; Werb, Z.E.N.A.; Bissell, M.J. Proteinases of the mammary gland: Developmental regulation in vivo and vectorial secretion in culture. Development 1991, 112, 439–449. [Google Scholar] [PubMed]
- Bernstein, F.C.; Koetzle, T.F.; Williams, G.J.; Meyer, E.F.; Brice, M.D.; Rodgers, J.R.; Kennard, O.; Shimanouchi, T.; Tasumi, M. The Protein Data Bank: A computer-based archival file for macromolecular structures. Arch. Biochem. Biophys. 1978, 185, 584–591. [Google Scholar] [CrossRef]
- Trott, O.; Olson, A.J. AutoDock Vina: Improving the speed and accuracy of docking with a new scoring function, efficient optimization, and multithreading. J. Comput. Chem. 2010, 31, 455–461. [Google Scholar] [CrossRef] [PubMed]
- Sample Availability: Samples of the compounds are not available from the authors.


| Sample | Total Content of Phenolic Compounds (GAE mg/g) | Total Content of Flavones and Flavonols (QE mg/g) |
|---|---|---|
| WE | 33.11 ± 1.12 | 3.64 ± 0.21 |
| EAF | 104.75 ± 6.12 | 11.51 ± 0.85 |
| HAE | 55.77 ± 2.94 | 11.28 ± 1.05 |
| CF | 46.40 ± 2.22 | 13.27 ± 0.45 |
| Day | Healthy Group | Diabetic Group | EAF-Treated Group | HAE-Treated Group | CF-Treated Group | WE-Treated Group | Quercetin-Treated Group |
|---|---|---|---|---|---|---|---|
| FBGL (mmol/L) | FBGL (mmol/L) | FBGL (mmol/L) | FBGL (mmol/L) | FBGL (mmol/L) | FBGL (mmol/L) | FBGL (mmol/L) | |
| 0 | 6.00 ± 0.84 a | 30.80 ± 2.65 b | 30.11 ± 2.84 | 30.27 ± 1.88 | 31.23 ± 1.19 | 30.71 ± 2.83 | 29.63 ± 2.67 |
| 4 | 5.67 ± 1.11 a | 30.69 ± 1.97 b | 24.71 ± 2.99 a | 29.58 ± 1.94 | 33.45 ± 1.55 | 28.13 ± 2.93 | 27.58 ± 2.09 a |
| 8 | 5.75 ± 1.05 a | 29.46 ± 2.74 b | 20.07 ± 1.95 a | 26.27 ± 2.17 a | 32.00 ± 2.25 | 15.18 ± 2.89 a | 21.02 ± 1.63 a |
| 12 | 6.35 ± 0.99 a | 29.13 ± 1.98 b | 18.04 ± 2.79 a | 21.22 ± 1.45 a | 34.35 ± 1.06 | 12.73 ± 2.16 a | 18.70 ± 1.26 a |
| 16 | 6.12 ± 0.90 a | 30.46 ± 2.41 b | 13.19 ±2 .22 a | 16.77 ± 1.46 a | - | 8.10 ± 2.48 a | 17.55 ± 1.61 a |
| 20 | 5.85 ± 0.97 a | 31.09 ± 2.06 b | 12.40 ± 2.11 a | 14.08 ± 1.34 a | - | 4.39 ± 1.54 a | 14.02 ± 2.06 a |
| Sample | HMGR Inhibition (%) |
|---|---|
| WE | 36.11 ± 4.21 |
| EAF | 64.70 ± 2.50 |
| HAE | 70.15 ± 3.84 |
| CF | 89.21 ± 7.24 |
| Pravastatin | 98.02 ± 3.34 |
| Ligand | Binding Affinity (Kcal/mol) |
|---|---|
| 1β,10β-epoxydesacetoxymatricarin (CP1) | −7.6 |
| Leucodin (CP2) | −8.0 |
| 5-demethylsinensetin (CP3) | −7.5 |
| 2-(3,4-dimethoxy-phenyl)-3-hydroxy-5,6,7-trimethoxy-chromen-4-one (CP4) | −7.4 |
| Salvigenin (CP5) | −7.4 |
| Atorvastatin | −9.6 |
| Pravastatin | −7.0 |
© 2016 by the authors. Licensee MDPI, Basel, Switzerland. This article is an open access article distributed under the terms and conditions of the Creative Commons by Attribution (CC-BY) license ( http://creativecommons.org/licenses/by/4.0/).
Share and Cite
Khazneh, E.; Hřibová, P.; Hošek, J.; Suchý, P.; Kollár, P.; Pražanová, G.; Muselík, J.; Hanaková, Z.; Václavík, J.; Miłek, M.; et al. The Chemical Composition of Achillea wilhelmsii C. Koch and Its Desirable Effects on Hyperglycemia, Inflammatory Mediators and Hypercholesterolemia as Risk Factors for Cardiometabolic Disease. Molecules 2016, 21, 404. https://doi.org/10.3390/molecules21040404
Khazneh E, Hřibová P, Hošek J, Suchý P, Kollár P, Pražanová G, Muselík J, Hanaková Z, Václavík J, Miłek M, et al. The Chemical Composition of Achillea wilhelmsii C. Koch and Its Desirable Effects on Hyperglycemia, Inflammatory Mediators and Hypercholesterolemia as Risk Factors for Cardiometabolic Disease. Molecules. 2016; 21(4):404. https://doi.org/10.3390/molecules21040404
Chicago/Turabian StyleKhazneh, Elian, Petra Hřibová, Jan Hošek, Pavel Suchý, Peter Kollár, Gabriela Pražanová, Jan Muselík, Zuzana Hanaková, Jiří Václavík, Michał Miłek, and et al. 2016. "The Chemical Composition of Achillea wilhelmsii C. Koch and Its Desirable Effects on Hyperglycemia, Inflammatory Mediators and Hypercholesterolemia as Risk Factors for Cardiometabolic Disease" Molecules 21, no. 4: 404. https://doi.org/10.3390/molecules21040404
APA StyleKhazneh, E., Hřibová, P., Hošek, J., Suchý, P., Kollár, P., Pražanová, G., Muselík, J., Hanaková, Z., Václavík, J., Miłek, M., Legáth, J., & Šmejkal, K. (2016). The Chemical Composition of Achillea wilhelmsii C. Koch and Its Desirable Effects on Hyperglycemia, Inflammatory Mediators and Hypercholesterolemia as Risk Factors for Cardiometabolic Disease. Molecules, 21(4), 404. https://doi.org/10.3390/molecules21040404