
Medium Optimization and Fermentation Kinetics for κ-Carrageenase Production by Thalassospira sp. Fjfst-332


Abstract
:1. Introduction
2. Results and Discussion
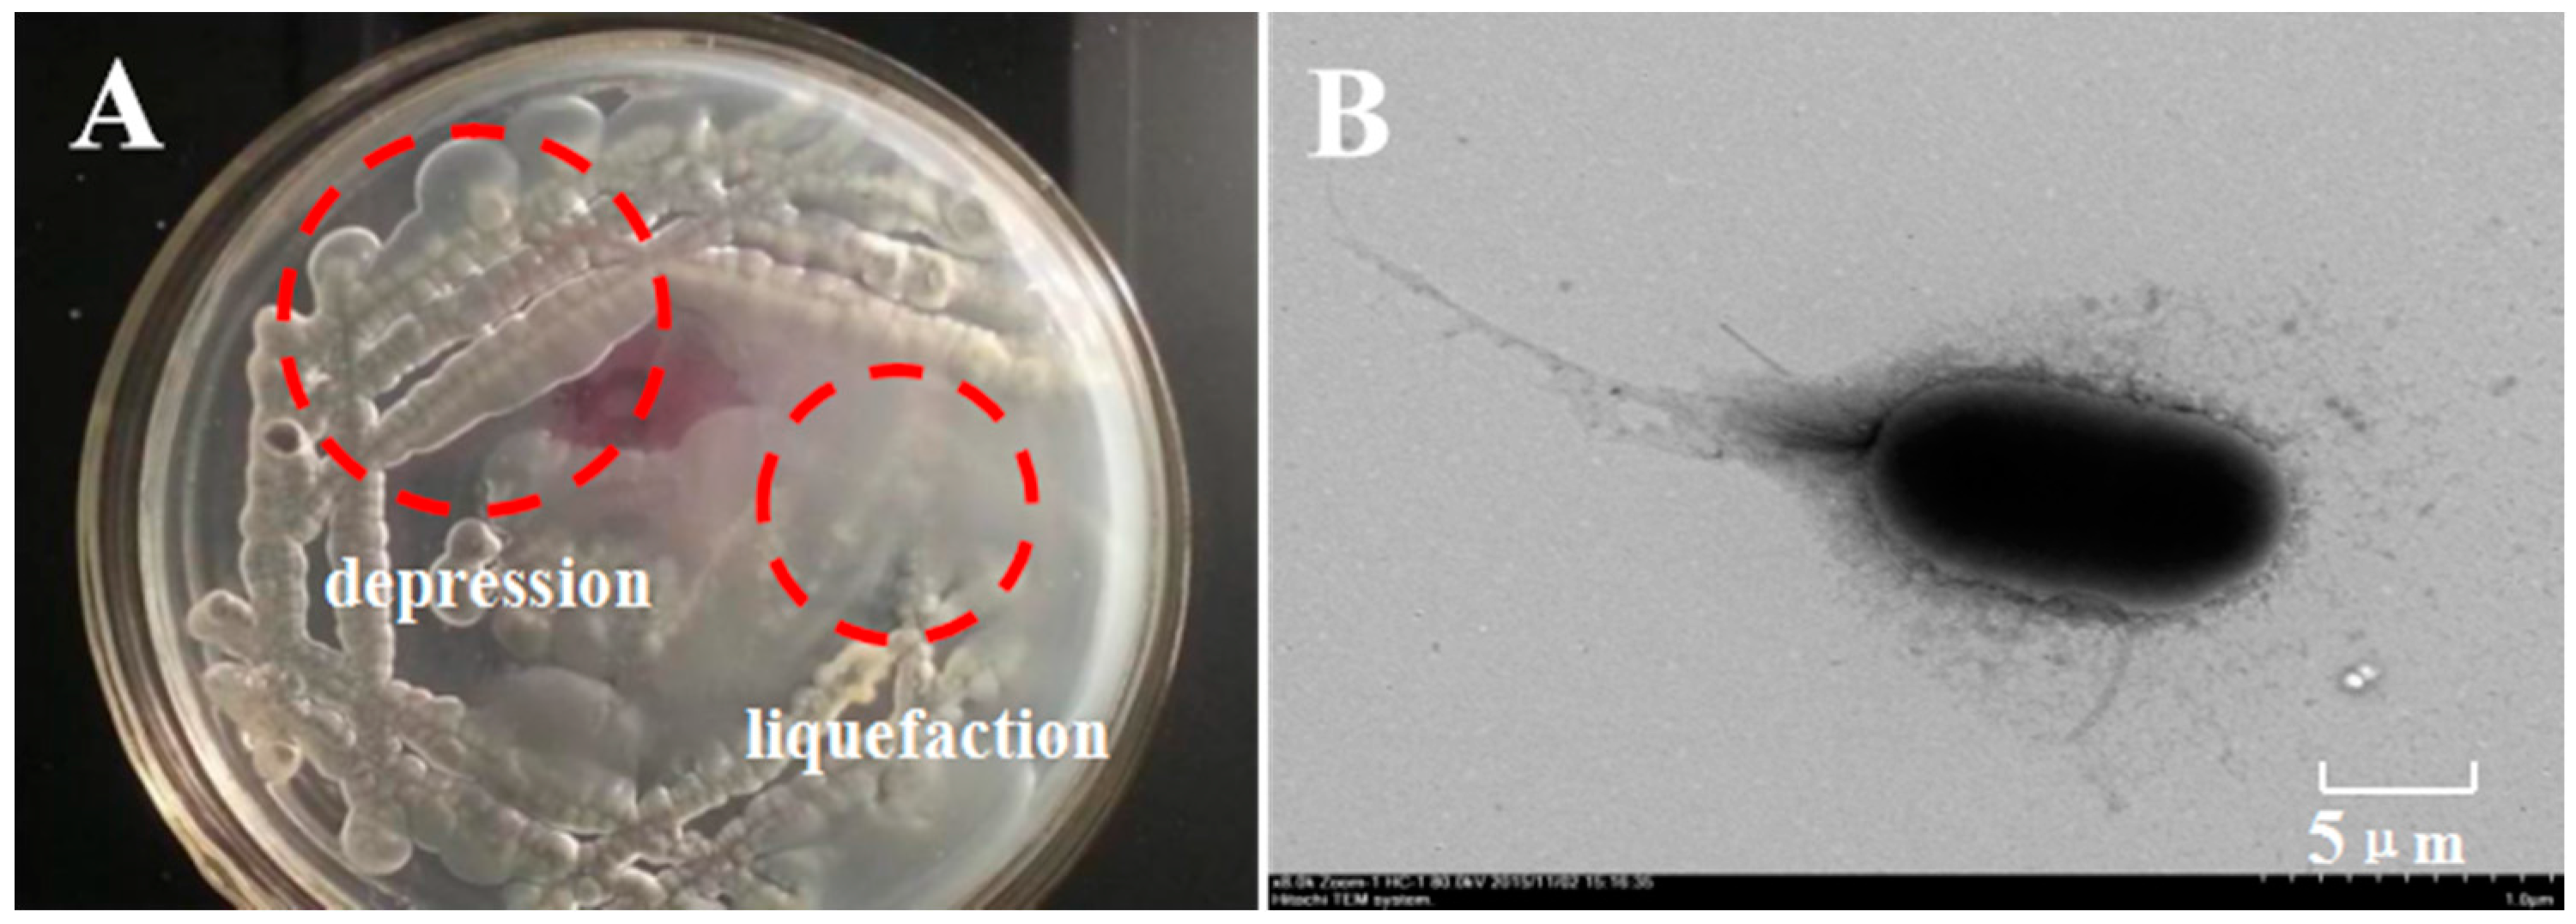
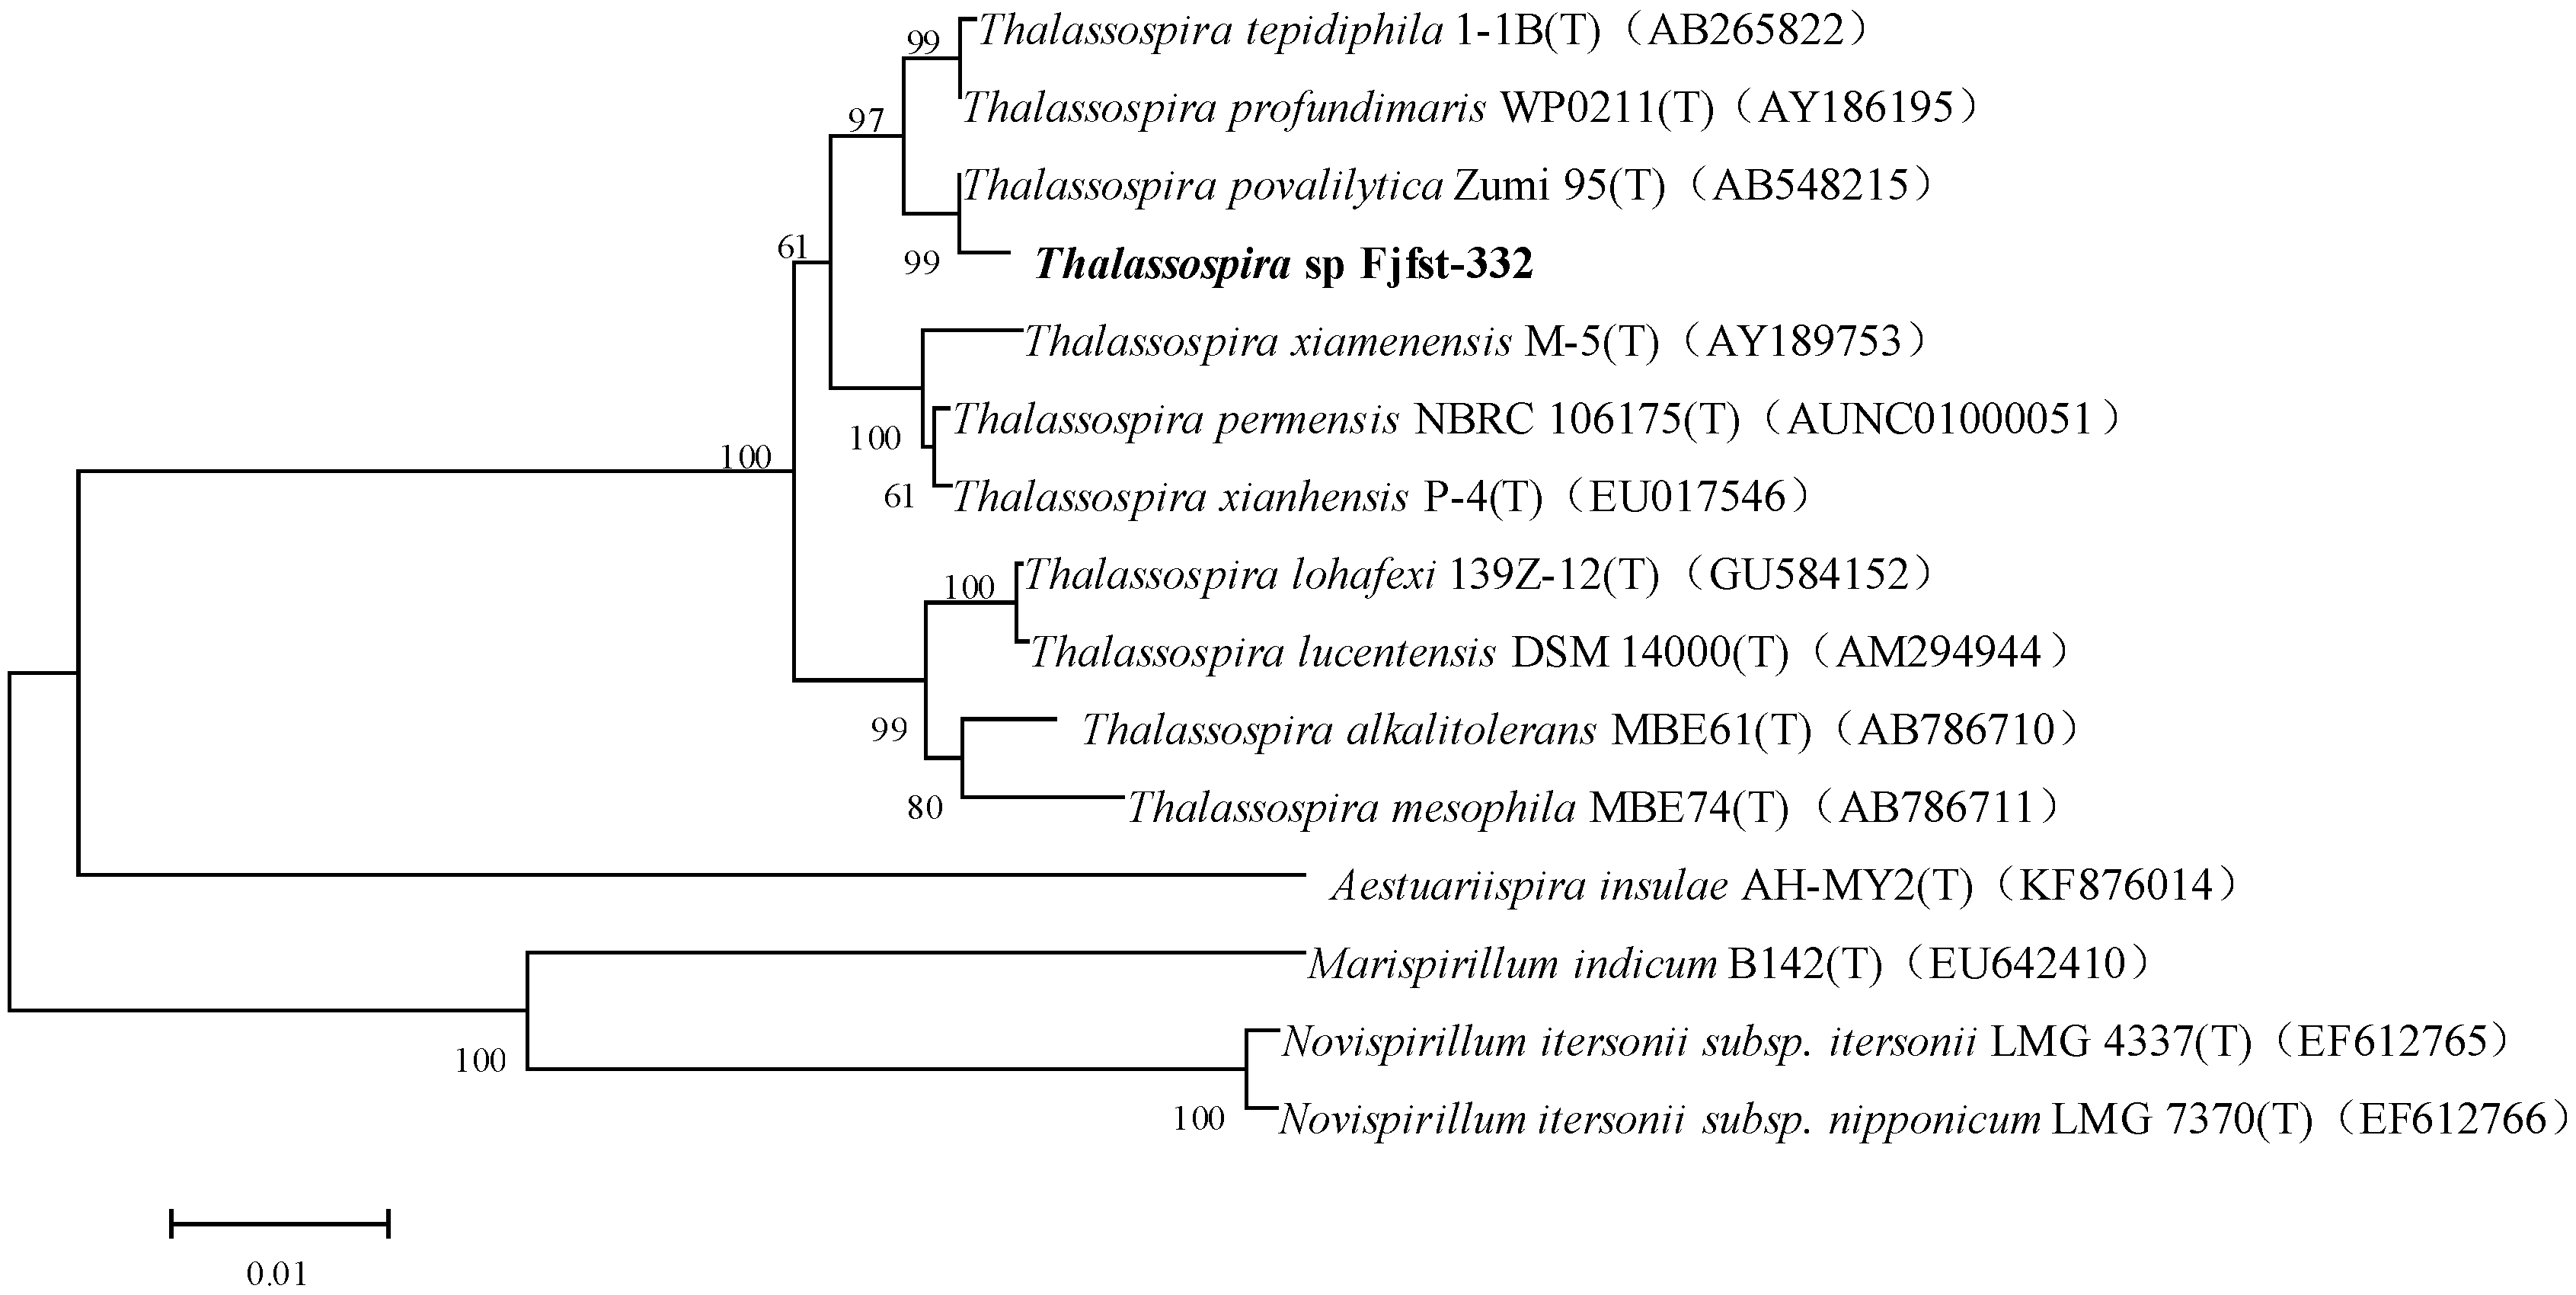
2.1. Isolation and Identification of κ-Carrageenase-Producing Bacterium
2.2. The Effect of Carbon Sources on the Enzyme Activity
2.3. The Effects of Nitrogen Sources, Metal Ions and NaCl on the Enzyme Activity
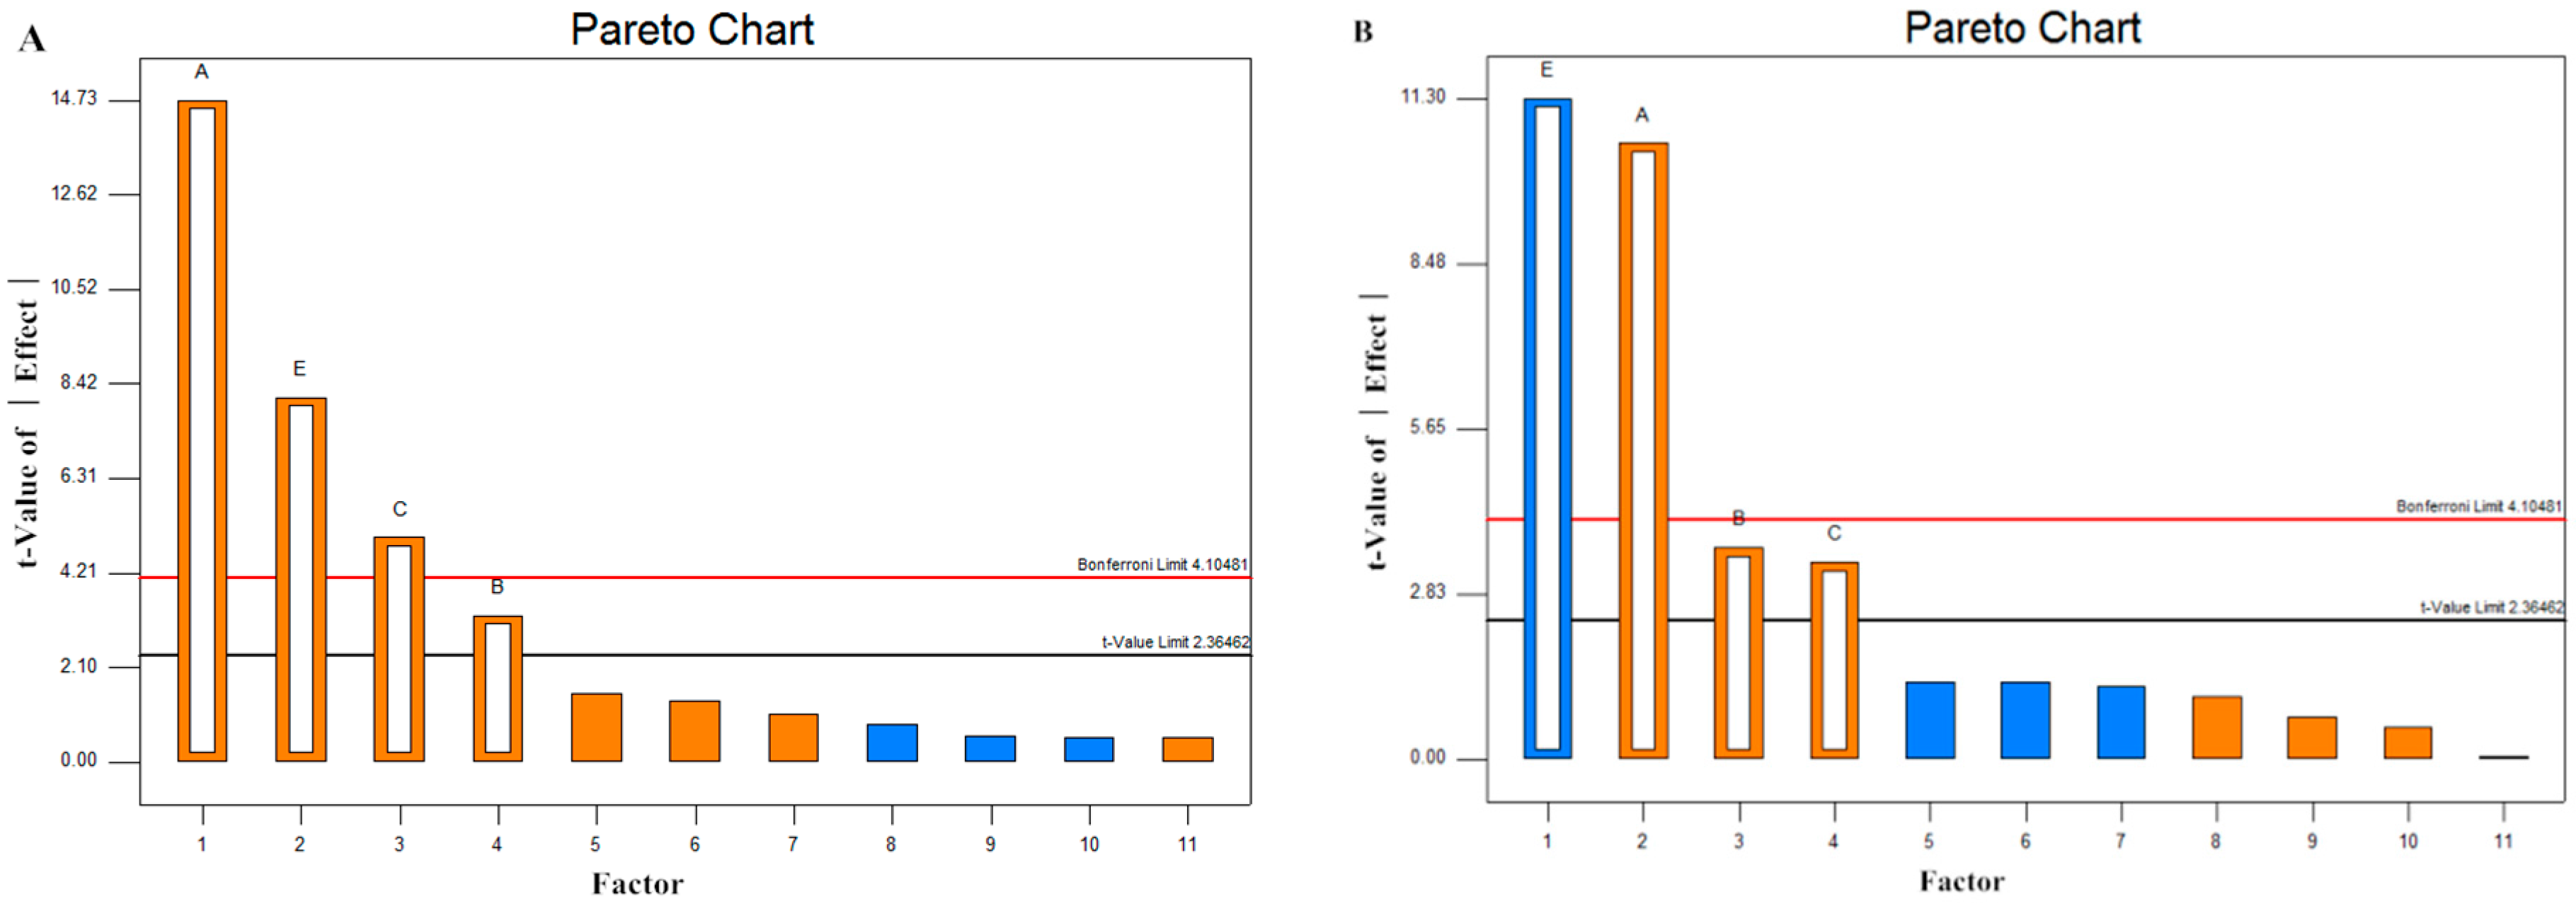
2.4. Screening of Significant Variables by Plackett–Burman (PB) Design
2.5. Model Statistical Analysis
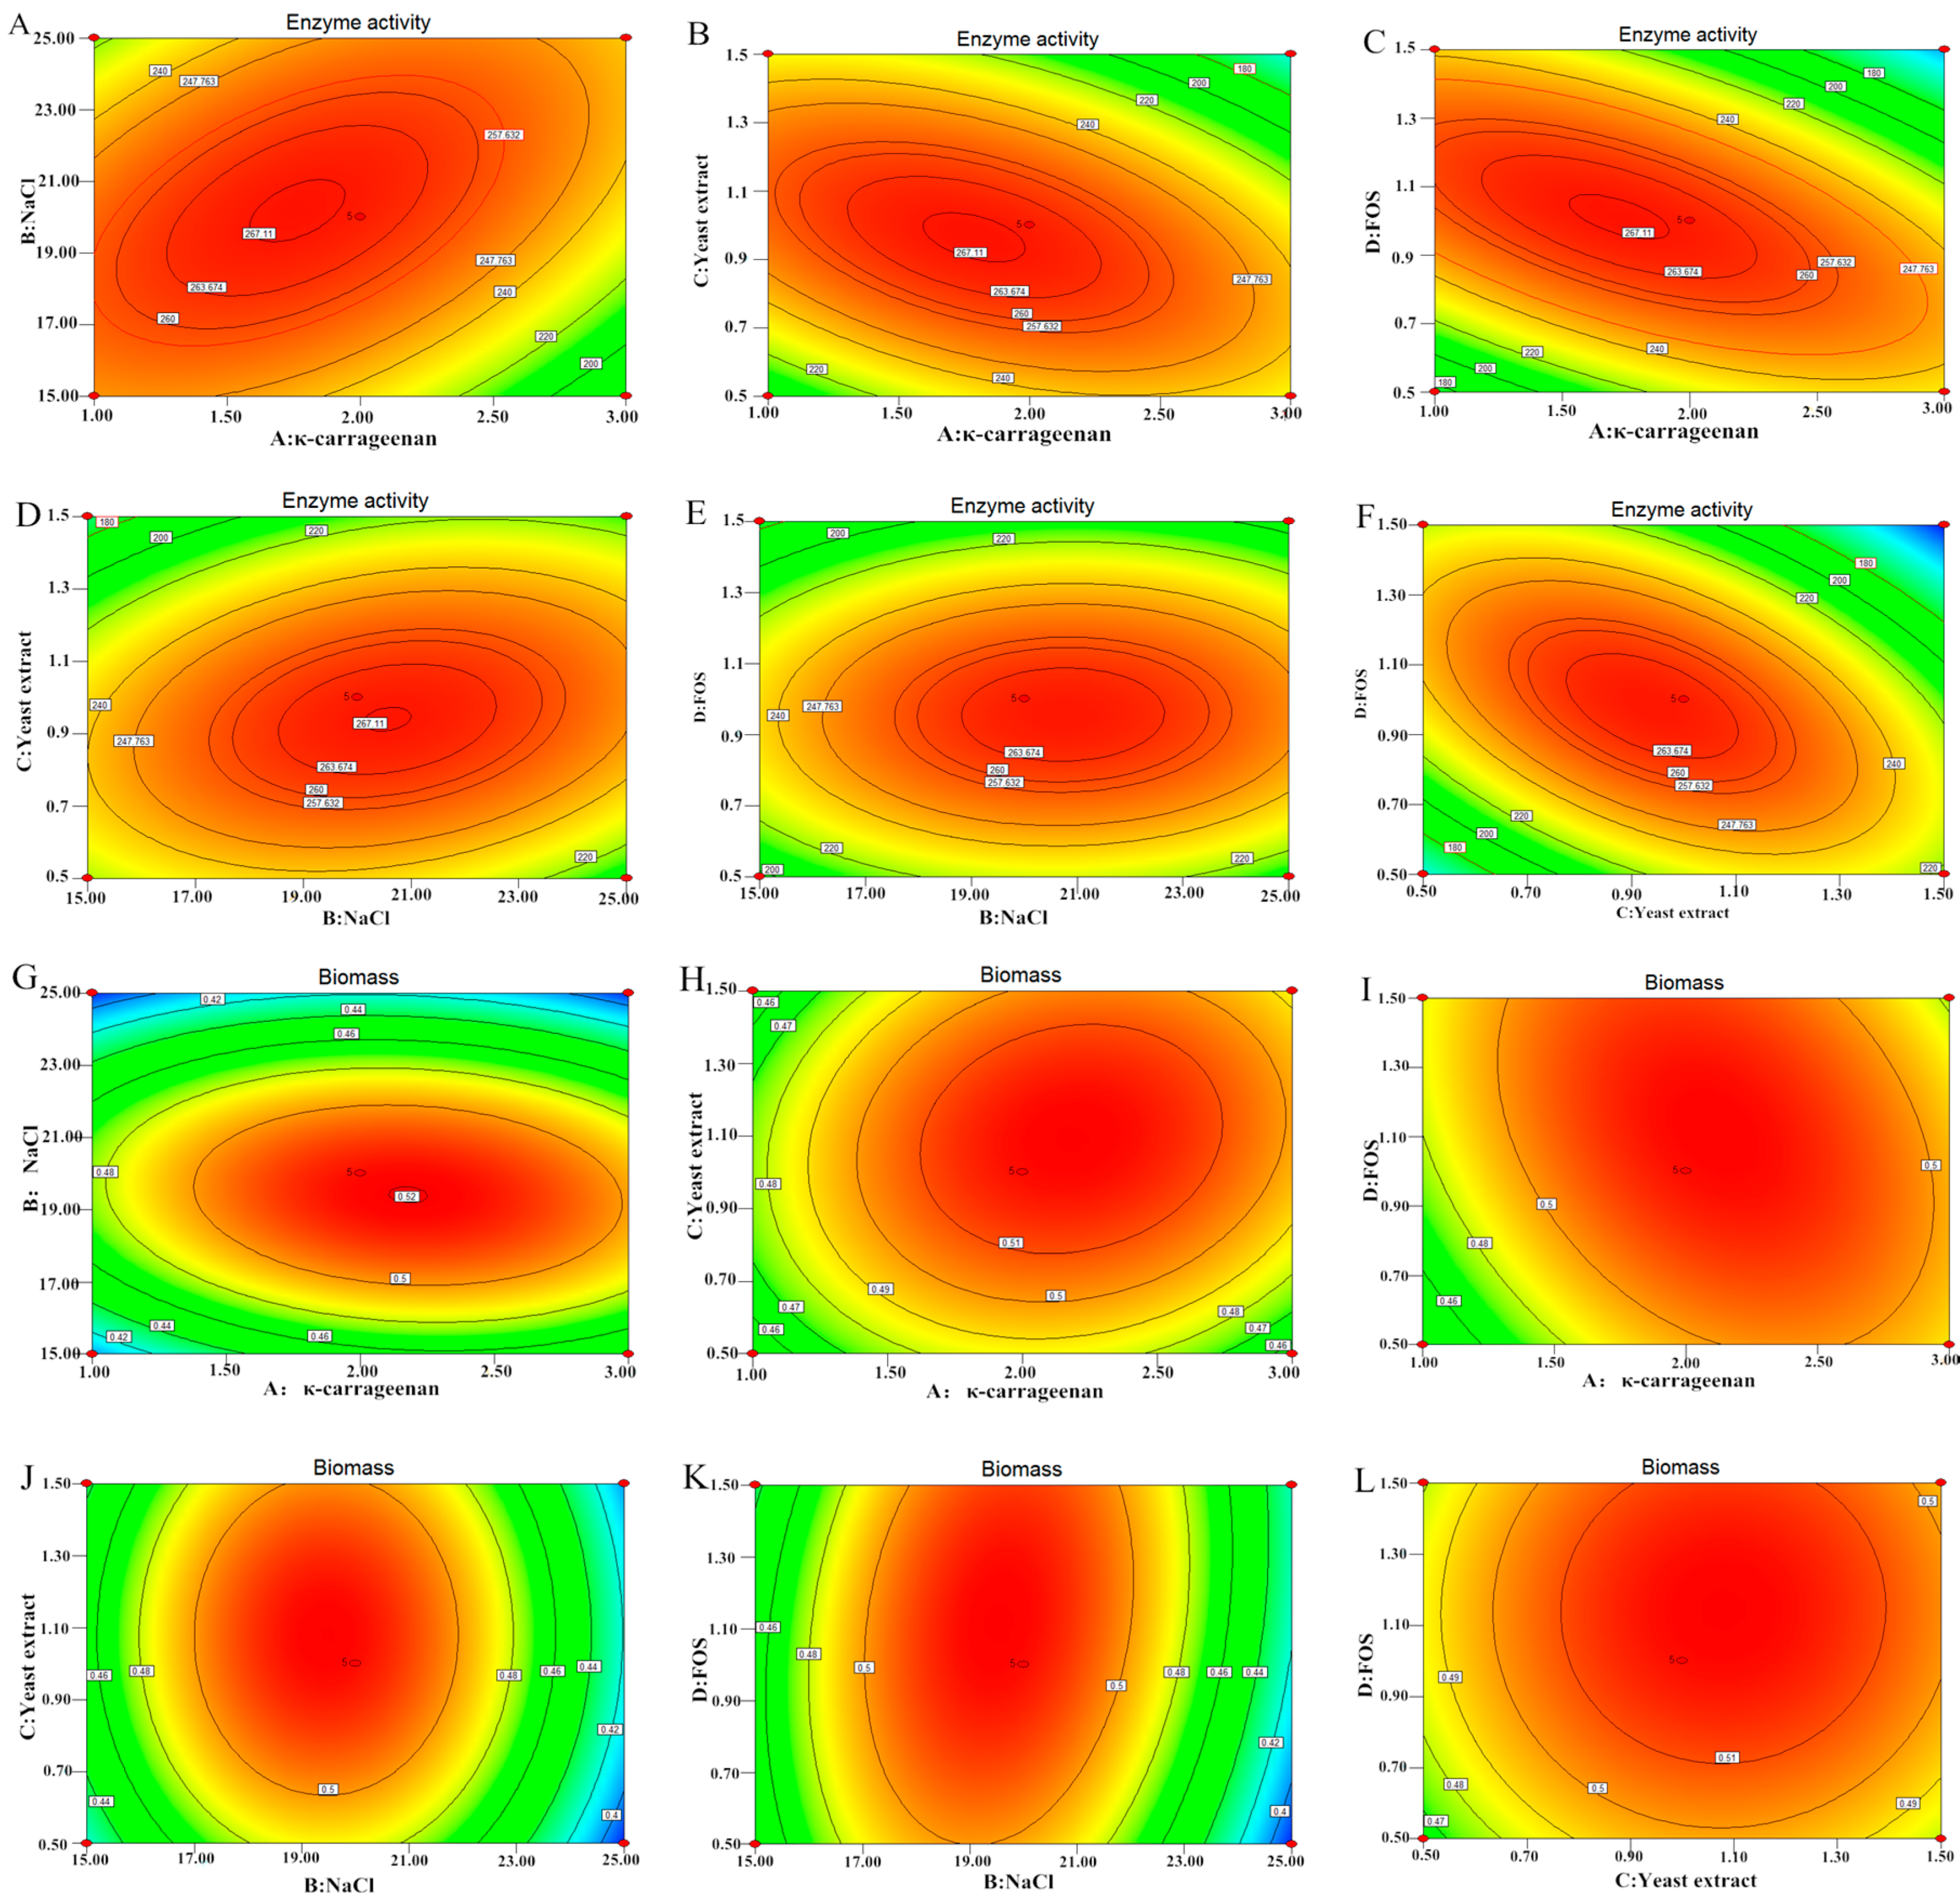
2.6. Effect of Independent Variables on Enzyme Activity (EA) and Biomass (BM)
2.7. Verification Tests
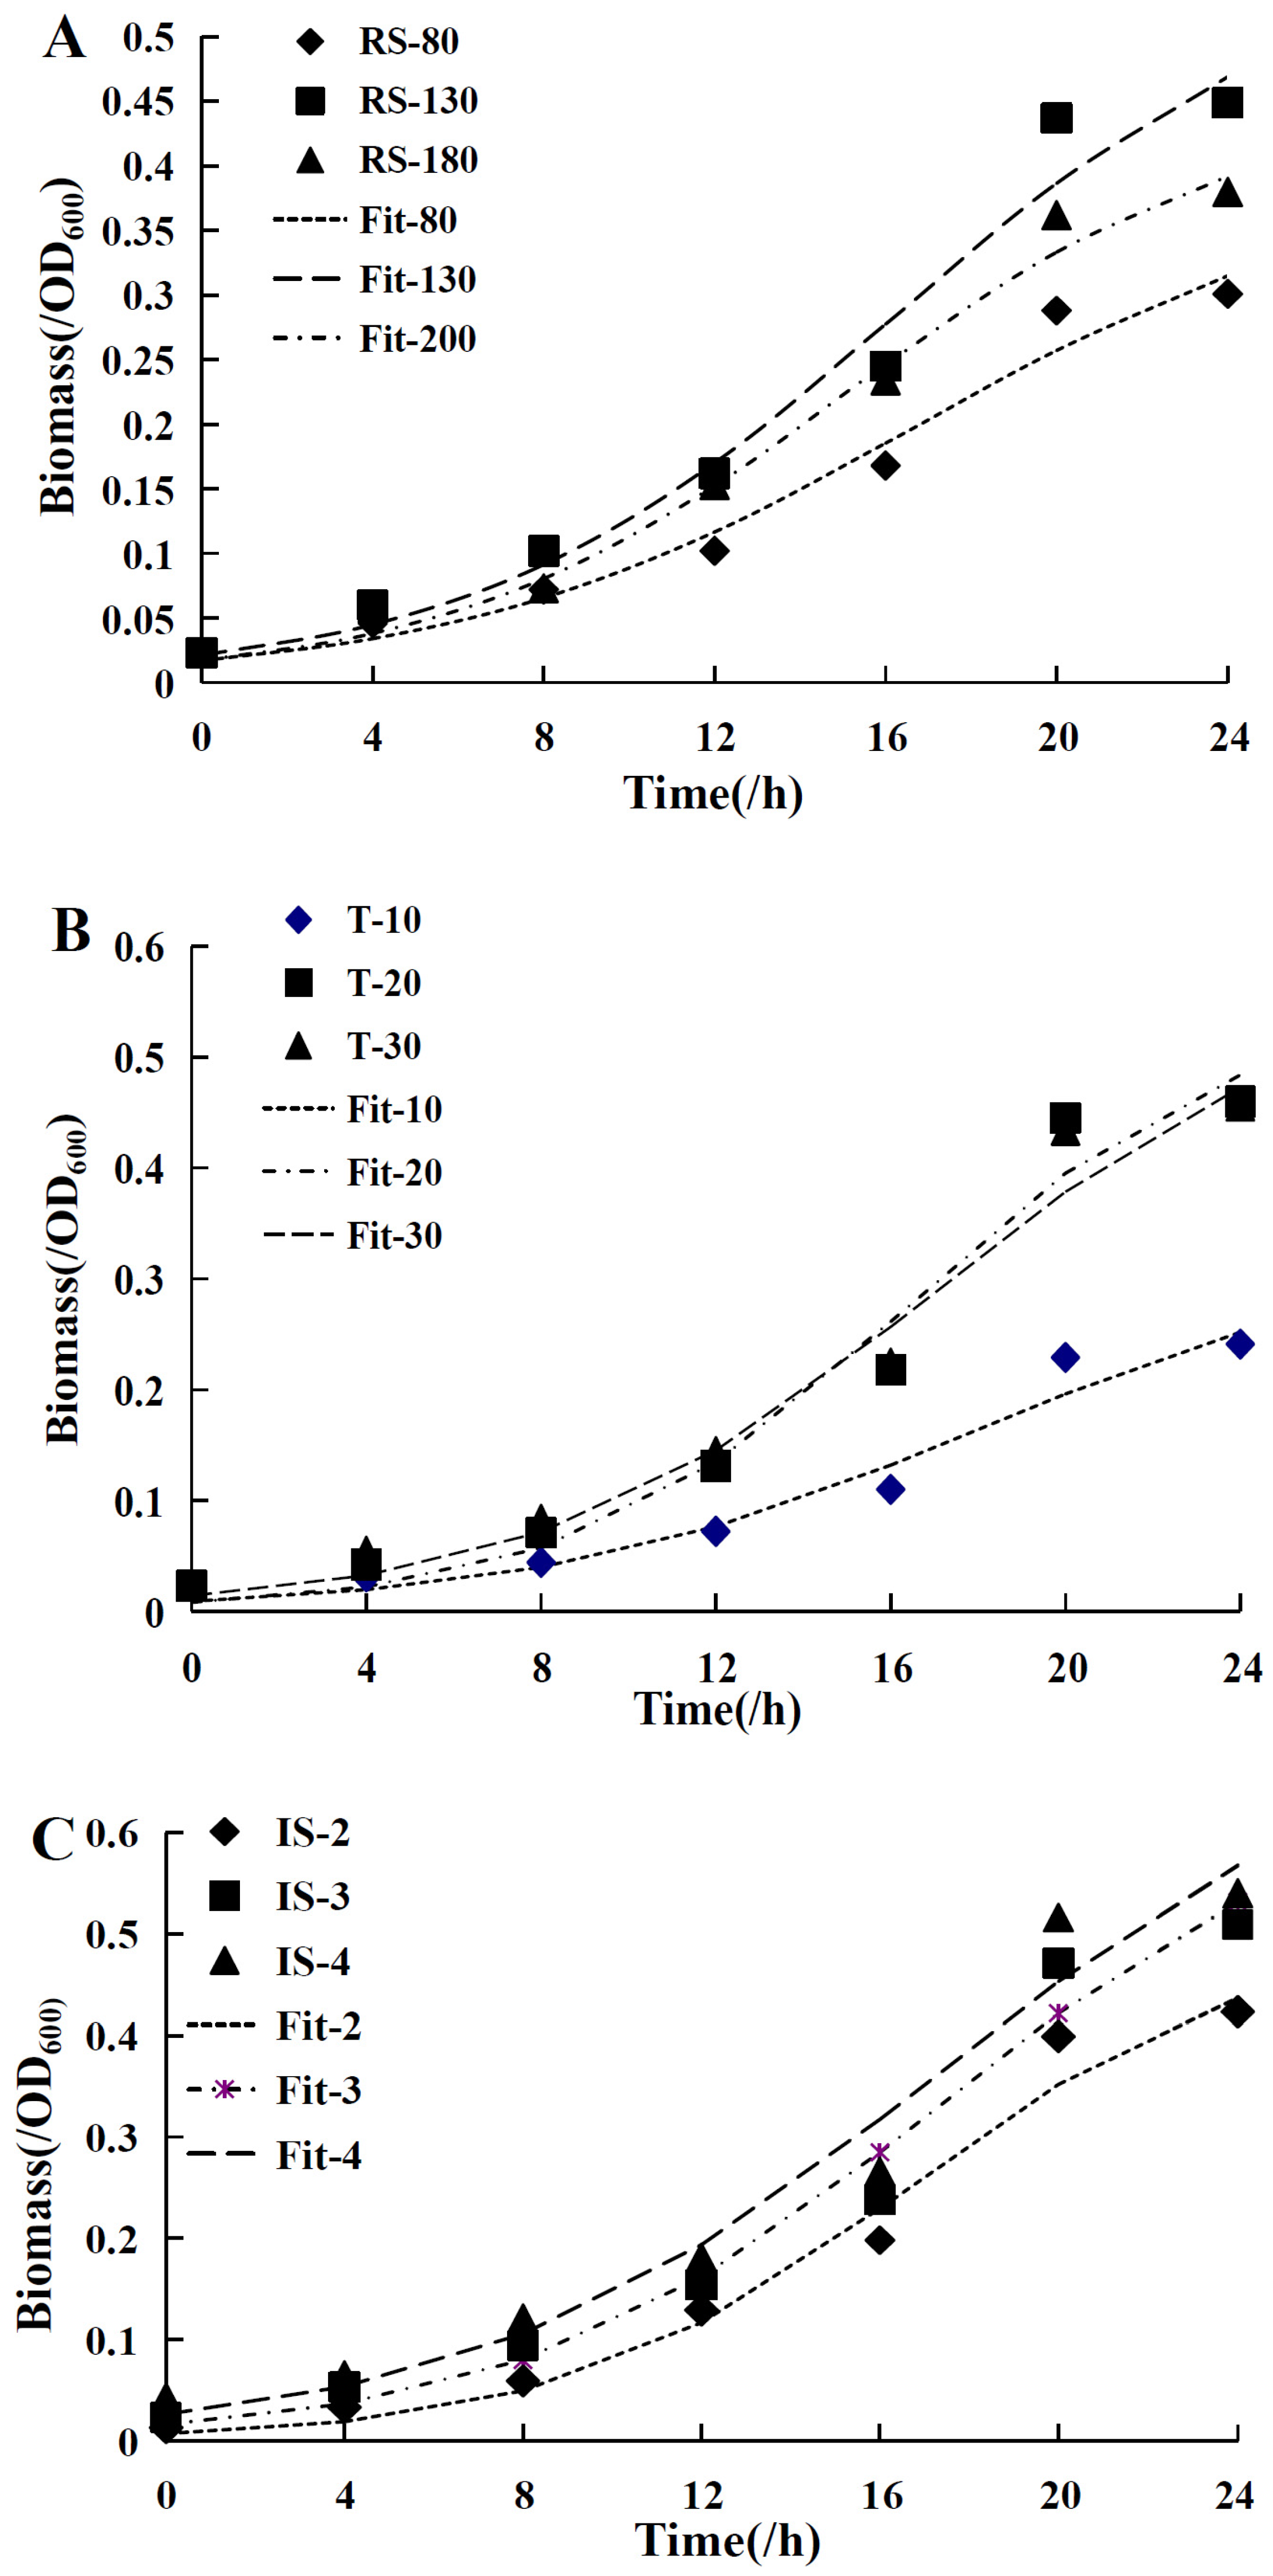
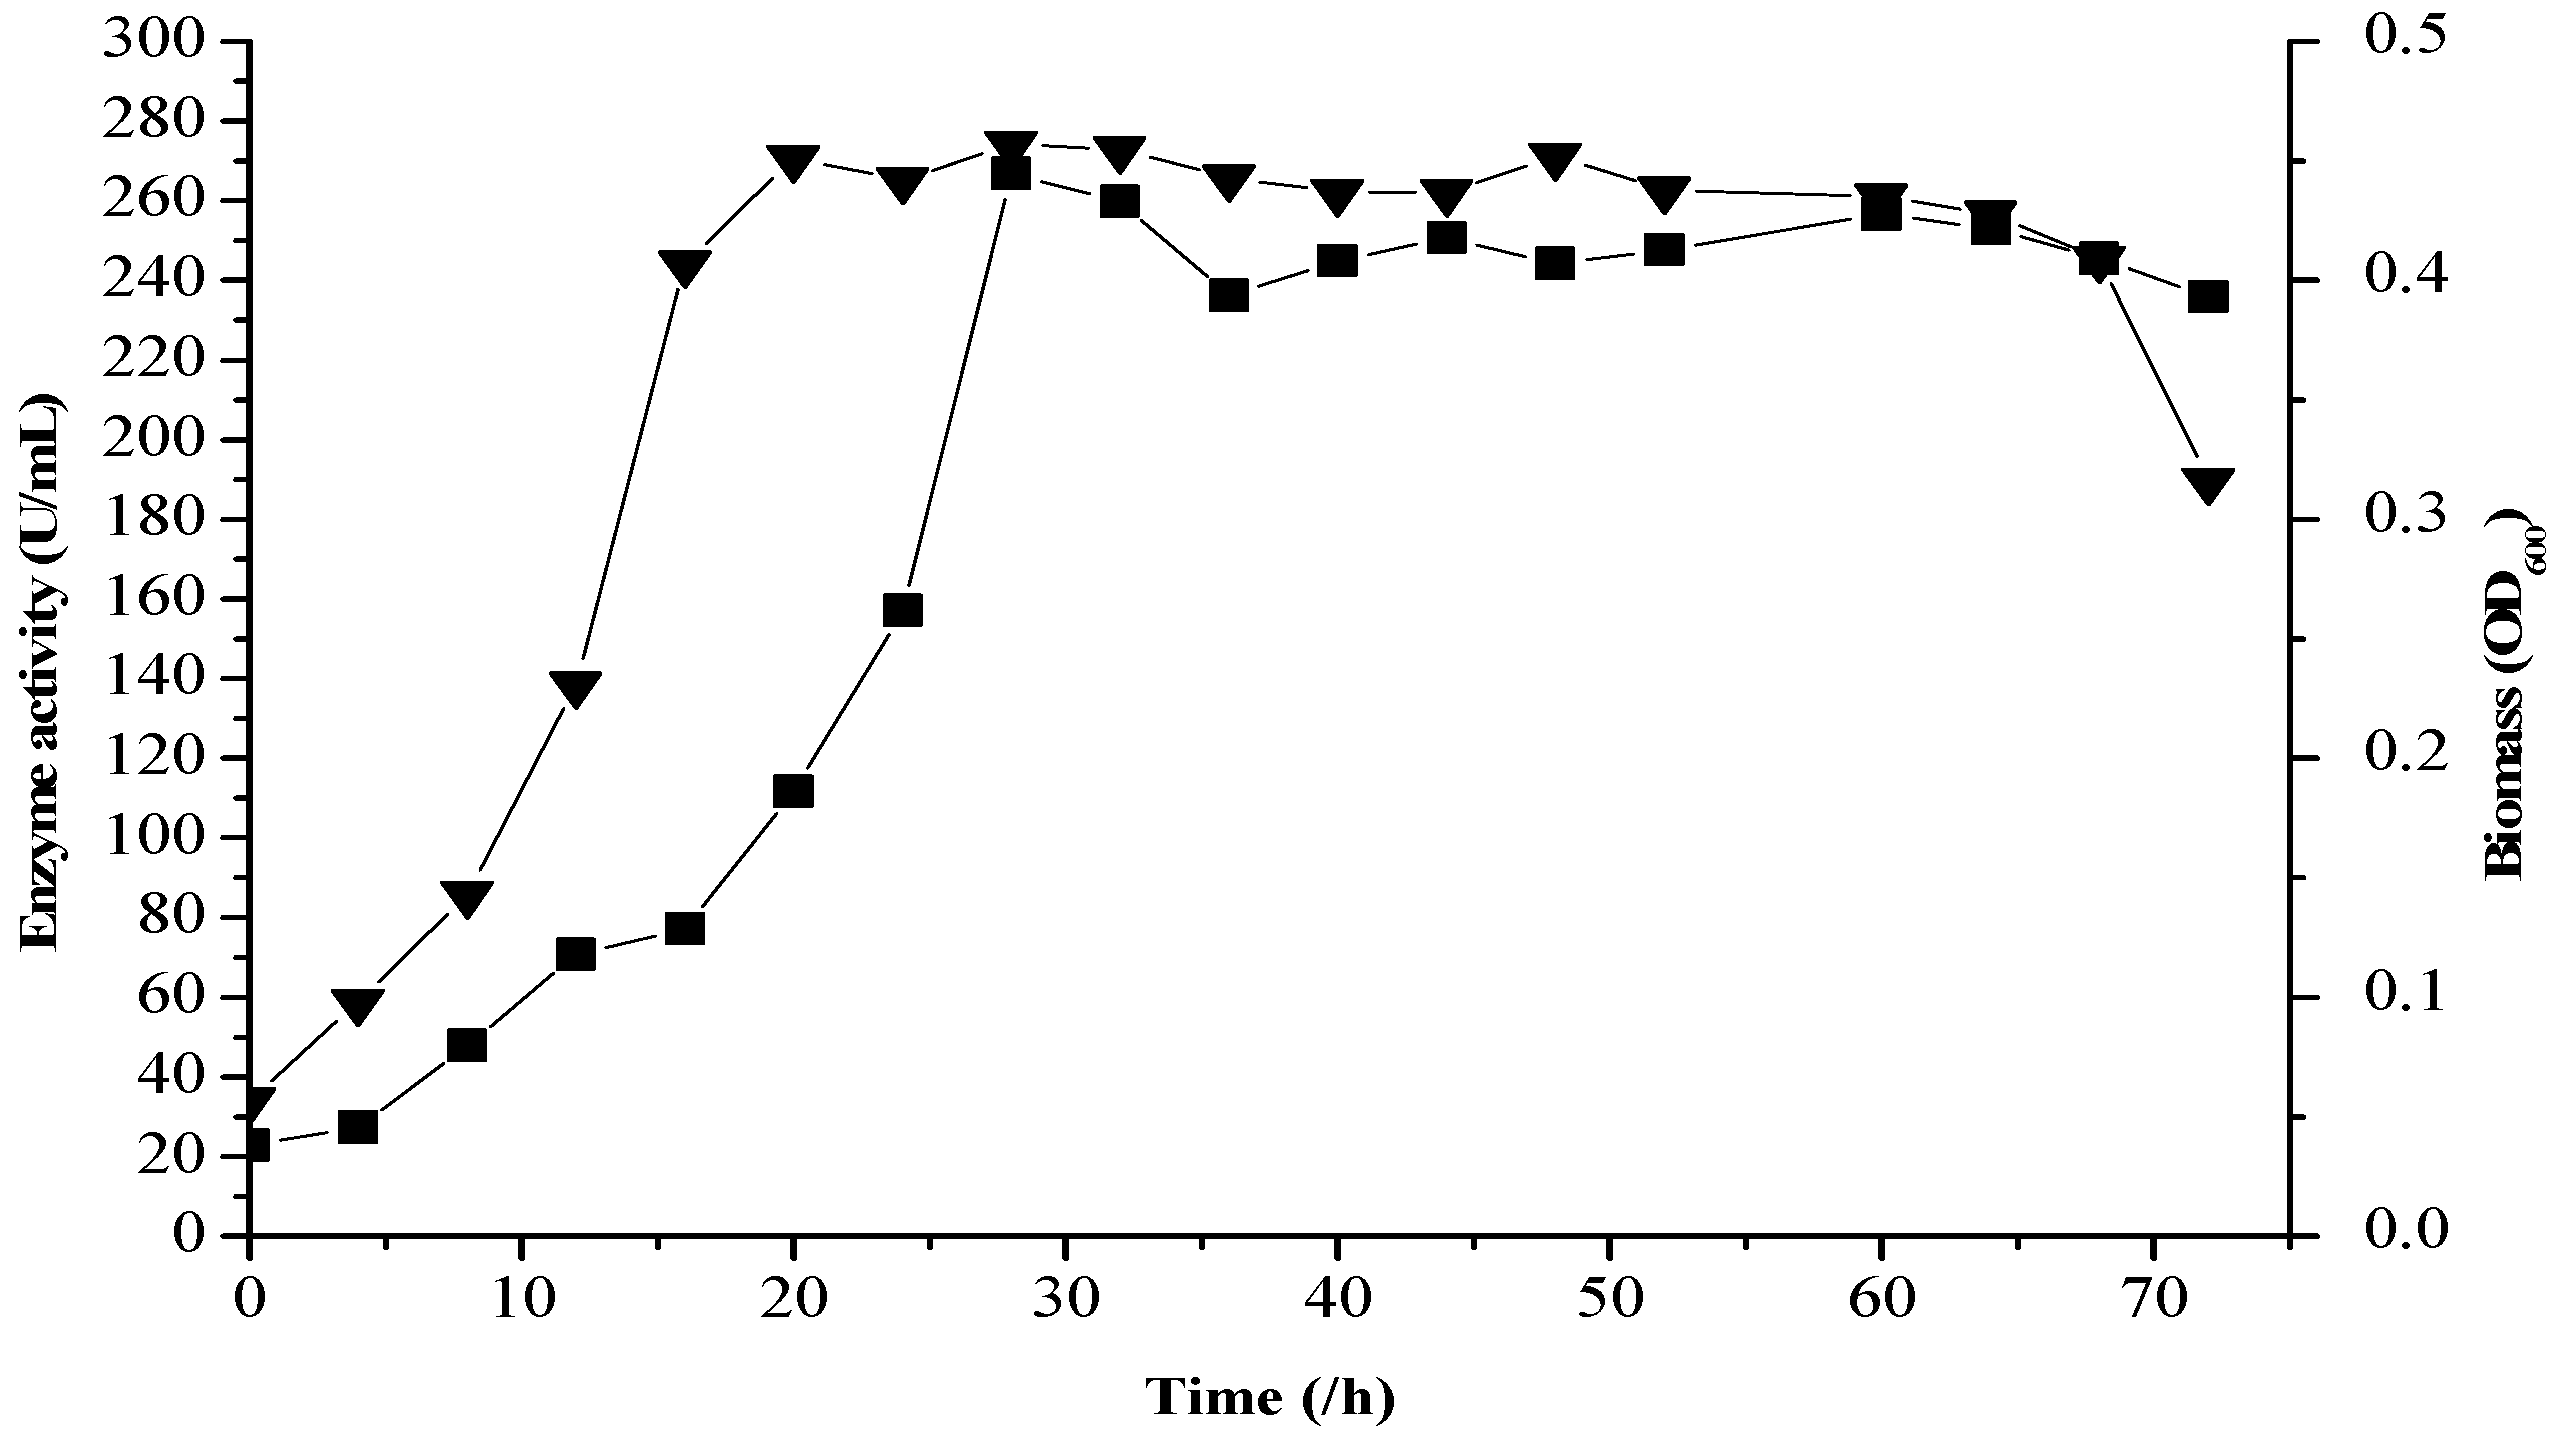
2.8. Fermentation Kinetics
2.9. Logistic Cell Growth Model
2.10. The Luedeking–Piret Model
3. Materials and Methods
3.1. Chemicals and Materials
3.2. Bacterial Isolation
3.3. Identification of Strain Fjfst-332
3.4. Selection of Significant Variables via Plackett–Burman (PB) Design
3.5. Statistical Optimization
3.6. Evaluation of κ-Carrageenase Activity (EA)
3.7. Determination of Cell Biomass (BM)
3.8. Detemination of Viscosity
3.9. Mathematical Model of Fermentation Process
3.9.1. Determination of Cell Growth Dynamics
3.9.2. Analysis of Product Formation Kinetic
3.10. Statistical Analysis
4. Conclusions
Acknowledgments
Author Contributions
Conflicts of Interest
References
- Wang, L.; Li, S.; Zhang, S.; Li, J.; Yu, W.; Gong, Q. A new κ-carrageenase CgkS from marine bacterium Shewanella sp. Kz7. J. Ocean Univ. China 2015, 14, 759–763. [Google Scholar] [CrossRef]
- Zhou, M.H.; Ma, J.S.; Li, J.; Ye, H.R.; Huang, K.X.; Zhao, X.W. A κ-Carrageenase from a Newly Isolated Pseudoalteromonas-like Bacterium, WZUC10. Biotechnol. Bioprocess Eng. 2008, 13, 545–551. [Google Scholar] [CrossRef]
- Yamada, T.; Ogamo, A.; Saito, T.; Uchiyama, H.; Nakagawa, Y. Preparation of O-acylated low-molecular-weight carrageenans with potent anti-HIV activity and low anticoagulant effect. Carbohydr. Polym. 2000, 41, 115–120. [Google Scholar] [CrossRef]
- Relleve, L.; Nagasawa, N.; Luan, L.Q.; Yagi, T.; Aranilla, C.; Abad, L.; Kume, T.; Yoshii, F.; dela Rosa, A. Degradation of carrageenan by radiation. Polym. Degrad. Stab. 2005, 87, 403–410. [Google Scholar] [CrossRef]
- Barbeyron, T.; Michel, G.; Potin, P.; Henrissat, B.; Kloareg, B. Iota-Carrageenases constitute a novel family of glycoside hydrolases, unrelated to that of kappa-carrageenases. J. Biol. Chem. 2000, 275, 35499–35505. [Google Scholar] [CrossRef]
- Barbeyron, T.; Potin, P.; Richard, C.; Collin, O.; Kloareg, B. Arylsulphatase from Alteromonas carrageenovora. Microbiology 1995, 141 Pt 11, 2897–2904. [Google Scholar] [CrossRef]
- Potin, P.; Sanseau, A.; Le Gall, Y.; Rochas, C.; Kloareg, B. Purification and characterization of a new kappa-carrageenase from a marine Cytophaga-like bacterium. Eur. J. Biochem. 1991, 201, 241–247. [Google Scholar] [CrossRef]
- Tayco, C.C.; Tablizo, F.A.; Regalia, R.S.; Lluisma, A.O. Characterization of a κ-Carrageenase-producing Marine Bacterium, Isolate ALAB-001. Philipp. J. Sci. 2013, 142, 45–54. [Google Scholar]
- Weigl, J.; Yaphe, W. The enzymic hydrolysis of carrageenan by Pseudomonas carrageenovora: Purification of a kappa-carrageenase. Can. J. Microbiol. 1966, 12, 939–947. [Google Scholar] [CrossRef]
- Sun, Y.; Liu, Y.; Jiang, K.; Wang, C.; Wang, Z.; Huang, L. Electrospray ionization mass spectrometric analysis of kappa-carrageenan oligosaccharides obtained by degradation with kappa-carrageenase from Pedobacter hainanensis. J. Agric. Food Chem. 2014, 62, 2398–2405. [Google Scholar] [CrossRef]
- Kobayashi, T.; Uchimura, K.; Koide, O.; Deguchi, S.; Horikoshi, K. Genetic and Biochemical Characterization of the Pseudoalteromonas tetraodonis Alkaline κ-Carrageenase. Biosci. Biotechnol. Biochem. 2012, 76, 506–511. [Google Scholar] [CrossRef]
- Duan, F.; Yu, Y.; Liu, Z.; Tian, L.; Mou, H. An effective method for the preparation of carrageenan oligosaccharides directly from Eucheuma cottonii using cellulase and recombinant κ-carrageenase. Algal. Res. 2016, 15, 93–99. [Google Scholar] [CrossRef]
- Whitehead, L.A.; Stosz, S.K.; Weiner, R.M. Characterization of the agarase system of a multiple carbohydrate degrading marine bacterium. Cytobios 2001, 106 (Suppl. 1), 99–117. [Google Scholar]
- Barton, L.L.; Georgi, C.E.; Lineback, D.R. Effect of maltose on glucoamylase formation by Aspergillus niger. J. Bacteriol. 1972, 111, 771–777. [Google Scholar]
- Sugano, Y.; Nagae, H.; Inagaki, K. Production and characteristics of some new β-agarases from a marine bacterium, Vibrio sp. strain JT0107. J. Ferment. Bioeng. 1995, 79, 549–554. [Google Scholar] [CrossRef]
- Gibson, G.R.; Beatty, E.R.; Wang, X.; Cummings, J.H. Selective stimulation of bifidobacteria in the human colon by oligofructose and inulin. Gastroenterology 1995, 108, 975–982. [Google Scholar] [CrossRef]
- Licht, T.R.; Hansen, M.; Poulsen, M.; Dragsted, L.O. Dietary carbohydrate source influences molecular fingerprints of the rat faecal microbiota. BMC Microbiol. 2006, 6, 1–10. [Google Scholar] [CrossRef] [Green Version]
- Zhang, Y.H.P.; Himmel, M.E.; Mielenz, J.R. Outlook for cellulase improvement: Screening and selection strategies. Biotechnol. Adv. 2006, 24, 452–481. [Google Scholar] [CrossRef]
- Sarwar, G.; Oda, H.; Sakata, T.; Kakimoto, D. Potentiality of artificial sea water salts for the production of carrageenase by a marine Cytophaga sp. Microbiol. Immunol. 1985, 29, 405–411. [Google Scholar] [CrossRef]
- Mou, H.J.; Jiang, X.L.; Guan, H.S. A kappa-carrageenan derived oligosaccharide prepared by enzymatic degradation containing anti-tumor activity. J. Appl. Phycol. 2003, 15, 297–303. [Google Scholar]
- Li, S.; Jia, P.; Wang, L.; Yu, W.; Han, F. Purification and characterization of a new thermostable κ-carrageenase from the marine bacterium Pseudoalteromonas sp. QY203. J. Ocean Univ. China 2013, 12, 155–159. [Google Scholar] [CrossRef]
- Goudar, C.T. Analyzing the dynamics of cell growth and protein production in mammalian cell fed-batch systems using logistic equations. J. Ind. Microbiol. Biotechnol. 2012, 39, 1061–1071. [Google Scholar] [CrossRef]
- Thierie, J. Computing and interpreting specific production rates in a chemostat in steady state according to the Luedeking-Piret model. Appl. Biochem. Biotechnol. 2013, 169, 477–492. [Google Scholar] [CrossRef]
- Bradbury, J.F.; Krieg, N.R.; Holt, J.G. (Eds.) Bergey’s Manual of Systematic Bacteriology; Springer: New York, NY, USA, 2011; Volume 1, pp. 89–100.
- Ma, L.; Wang, L.; Tang, J.; Yang, Z. Optimization of arsenic extraction in rice samples by Plackett-Burman design and response surface methodology. Food Chem. 2016, 204, 283–288. [Google Scholar] [CrossRef]
- Miller, G.L. Use of Dinitrosalicylic Acid Reagent for Determination of Reducing Sugar. Anal. Chem. 1959, 31, 426–428. [Google Scholar] [CrossRef]
- Omar, R.; Abdullah, M.A.; Hasan, M.A. Kinetics and modelling of cell growth and substrate uptake inCentella asiatica cell culture. Biotechnol. Bioprocess Eng. 2006, 11, 223–229. [Google Scholar] [CrossRef]
- Gaden, E.L. Fermentation process kinetics. J. Biochem. Microbiol. Technol. Eng. 2000, 1, 413–429. [Google Scholar] [CrossRef]
- Luedeking, R.; Piret, E.L. A kinetic study of the lactic acid fermentation. Batch process at controlled pH. Biotechnol. Bioeng. 2000, 67, 393–412. [Google Scholar] [CrossRef]
- Sample Availability: Samples of the compounds are not available from the authors.


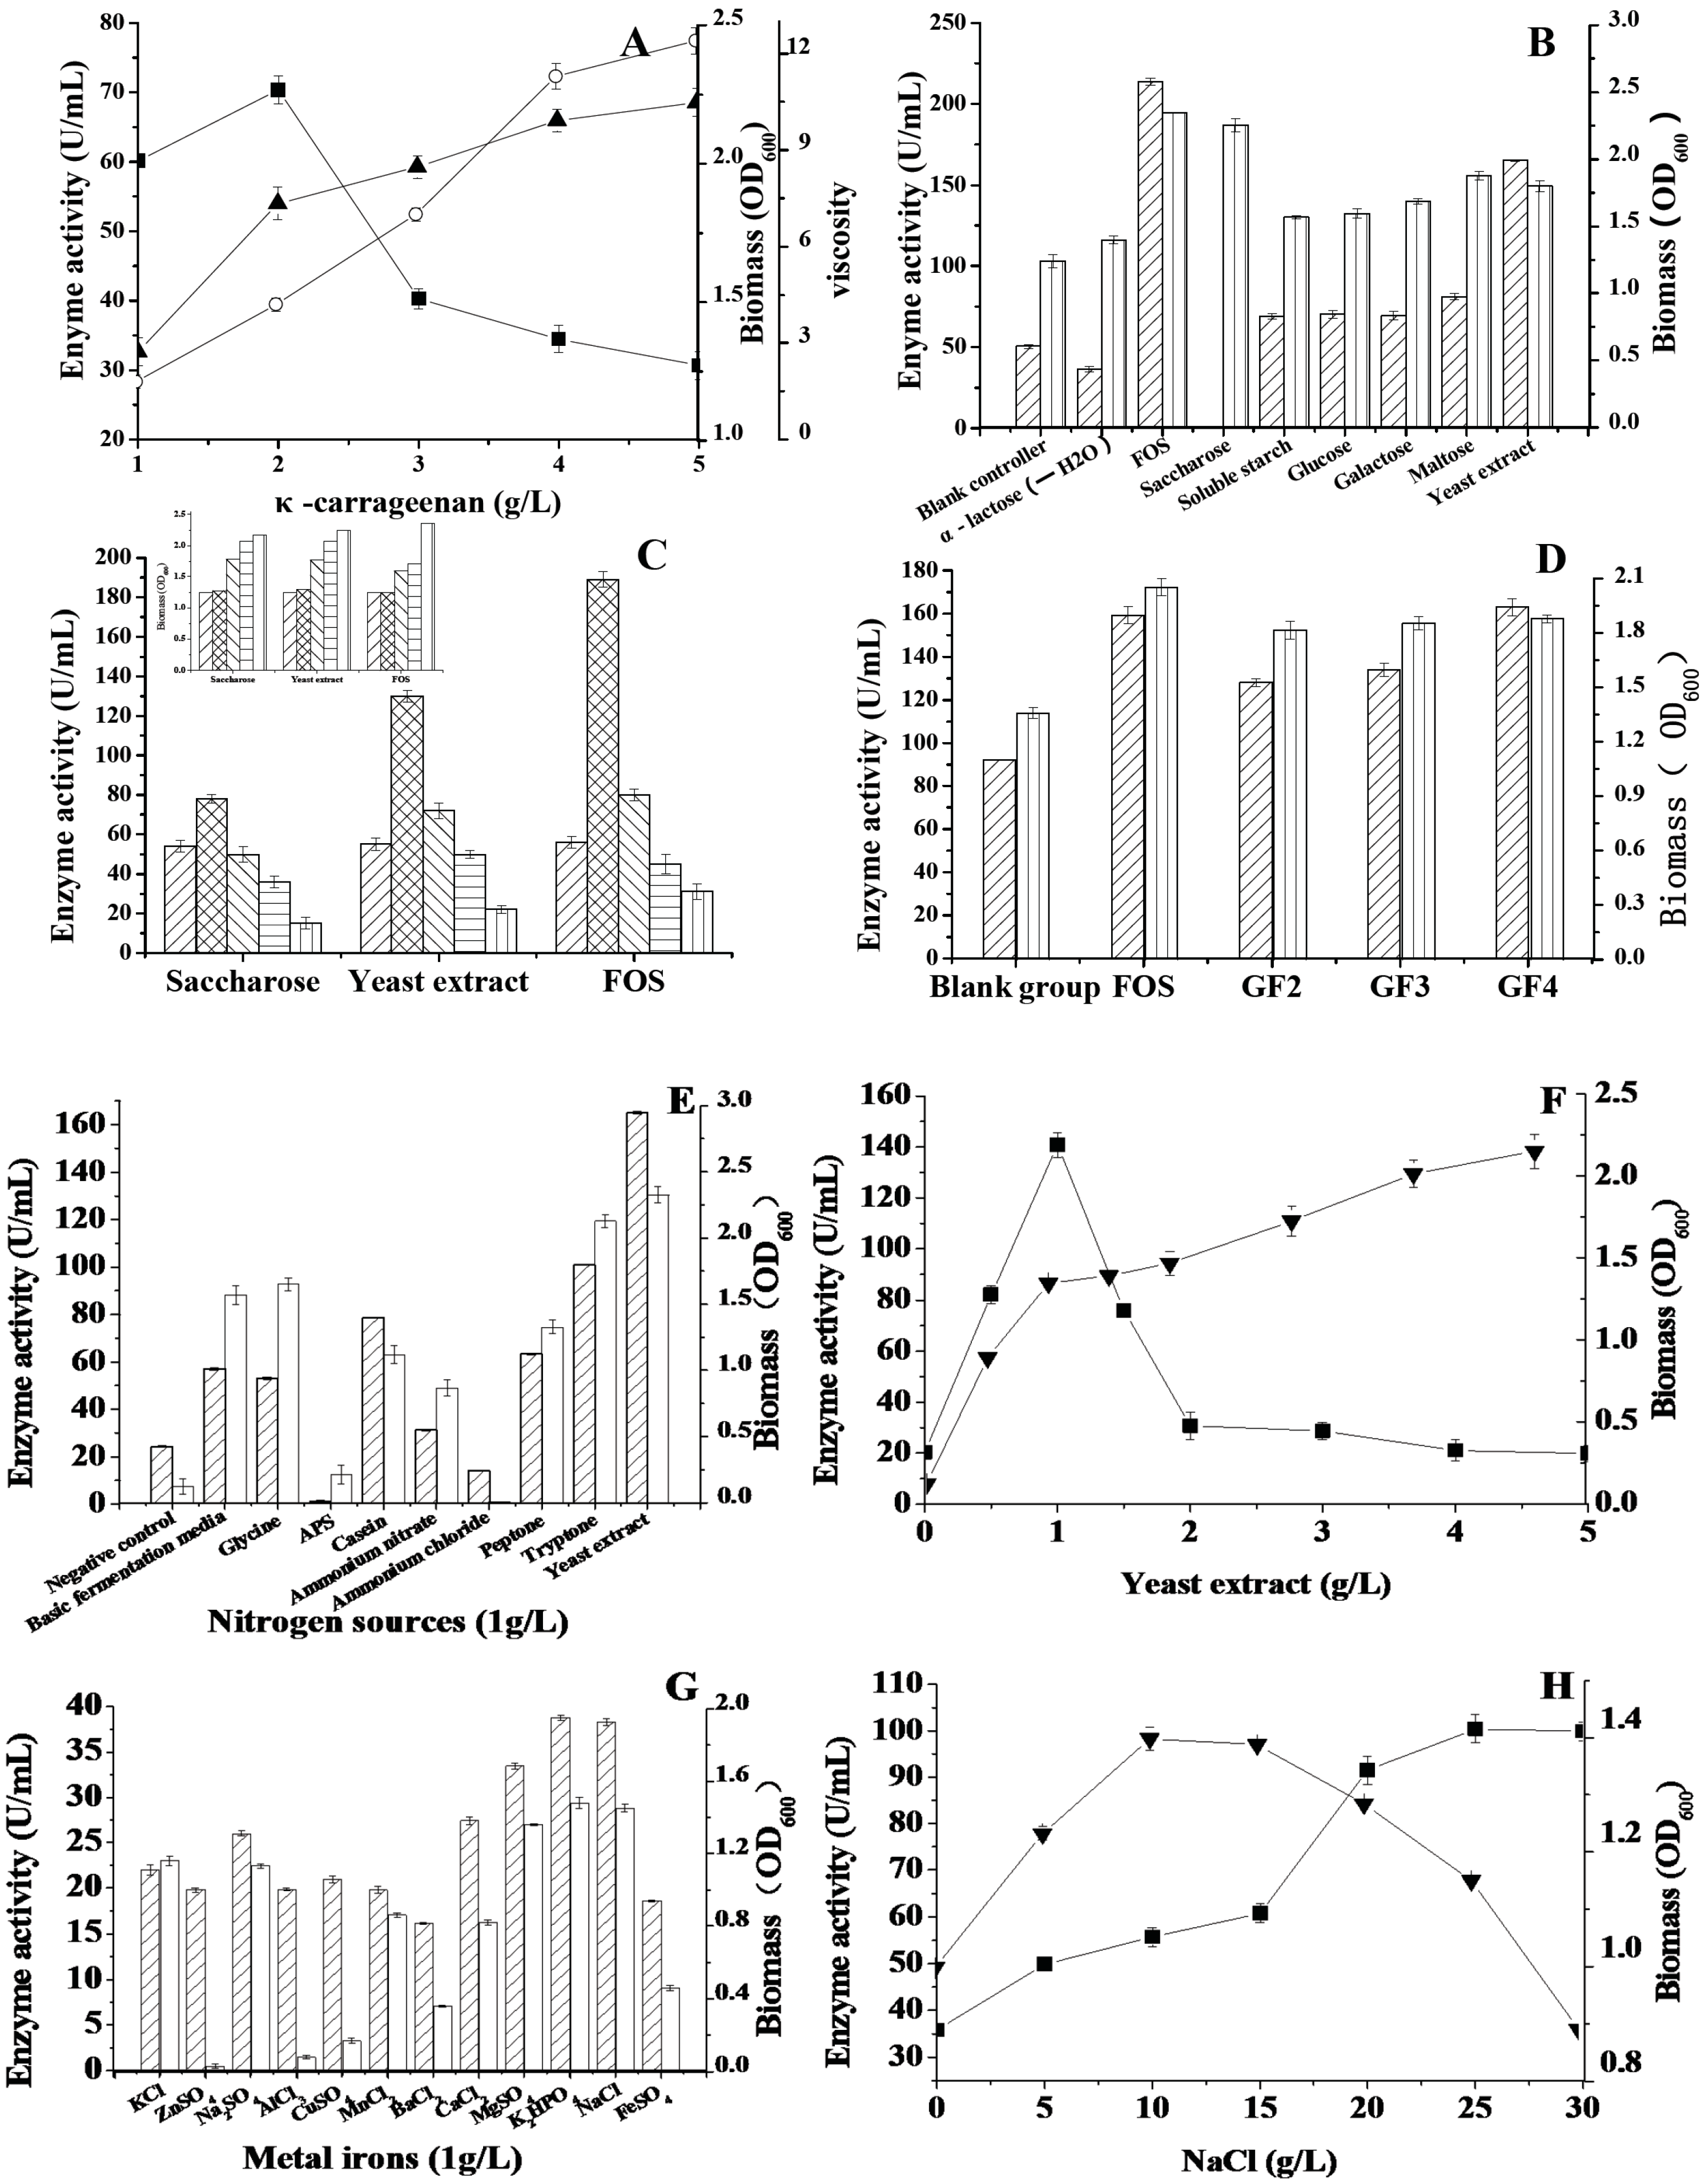
 Enzyme activity,
  Biomass; (C) Effects of saccharose, yeast extract and FOS on κ-carrageenase and biomass (the small figure on the left). 0 g/L,
  1 g/L,
  2 g/L,
  3 g/L, 4 g/L; (D) Effects of inducers on κ-carrageenase and biomass, including FOS, GF2, GF3, GF4 with the concentration of 1 g/L. Enzyme activity, Biomass; (E) Effects of nitrogen sources on κ-carrageenase and biomass, the test nitrogen sources with final concentration of 1 g/L Enzyme activity,
  Biomass; (F) Effects of yeast extract on κ-carrageenase and biomass, ■ Enzyme activity, ▼ Biomass; (G) Effects of metal irons on κ-carrageenase and biomass, all of the metal irons with the concentration of 0.2 g/L, Enzyme activity; Biomass; (H) Effects of NaCl on κ-carrageenase and biomass, ■ Enzyme activity, ▼ Biomass.
Enzyme activity, Biomass; (C) Effects of saccharose, yeast extract and FOS on κ-carrageenase and biomass (the small figure on the left). 0 g/L, 1 g/L, 2 g/L, 3 g/L, 4 g/L; (D) Effects of inducers on κ-carrageenase and biomass, including FOS, GF2, GF3, GF4 with the concentration of 1 g/L. Enzyme activity, Biomass; (E) Effects of nitrogen sources on κ-carrageenase and biomass, the test nitrogen sources with final concentration of 1 g/L Enzyme activity, Biomass; (F) Effects of yeast extract on κ-carrageenase and biomass, ■ Enzyme activity, ▼ Biomass; (G) Effects of metal irons on κ-carrageenase and biomass, all of the metal irons with the concentration of 0.2 g/L, Enzyme activity; Biomass; (H) Effects of NaCl on κ-carrageenase and biomass, ■ Enzyme activity, ▼ Biomass.
Biomass; (F) Effects of yeast extract on κ-carrageenase and biomass, ■ Enzyme activity, ▼ Biomass; (G) Effects of metal irons on κ-carrageenase and biomass, all of the metal irons with the concentration of 0.2 g/L, Enzyme activity; Biomass; (H) Effects of NaCl on κ-carrageenase and biomass, ■ Enzyme activity, ▼ Biomass.
Enzyme activity, Biomass; (C) Effects of saccharose, yeast extract and FOS on κ-carrageenase and biomass (the small figure on the left). 0 g/L, 1 g/L, 2 g/L, 3 g/L, 4 g/L; (D) Effects of inducers on κ-carrageenase and biomass, including FOS, GF2, GF3, GF4 with the concentration of 1 g/L. Enzyme activity, Biomass; (E) Effects of nitrogen sources on κ-carrageenase and biomass, the test nitrogen sources with final concentration of 1 g/L Enzyme activity, Biomass; (F) Effects of yeast extract on κ-carrageenase and biomass, ■ Enzyme activity, ▼ Biomass; (G) Effects of metal irons on κ-carrageenase and biomass, all of the metal irons with the concentration of 0.2 g/L, Enzyme activity; Biomass; (H) Effects of NaCl on κ-carrageenase and biomass, ■ Enzyme activity, ▼ Biomass.


| Feature | Results | Items | Results |
|---|---|---|---|
| Morphological feature | Biochemical Characteristics | ||
| mycelial morphology | rhabditiform | oxidase | − |
| gram stain | positive | hydrogen peroxide | − |
| spore | − | gelatin liquefaction | − |
| flagellum | + | amylolysis | + |
| Cultural Characteristics | carrageenan dispergation | + | |
| colonial morphology | depression, adhesion | ||
| bacterial colony | smooth | ||
| borderline state | irregular | ||
| pigment | faint yellow | ||
| demand for oxygen | facultative anaerobic |
| NO. | A | B | C | D | E | F | G | H | D1 | D2 | D3 | EA (U/mL) | BM, (OD600) |
|---|---|---|---|---|---|---|---|---|---|---|---|---|---|
| 1 | 2.5 | 1.5 | 0.5 | 2 | 25 | 0.3 | 0.1 | 0.1 | −1 | 1 | −1 | 250.12 ± 1.27 a | 0.428 ± 0.005 c,d |
| 2 | 1 | 1.5 | 1.5 | 1 | 25 | 0.3 | 0.3 | 0.1 | −1 | −1 | 1 | 215.21 ± 1.17 f | 0.402 ± 0.006 e |
| 3 | 2.5 | 0.5 | 1.5 | 2 | 10 | 0.3 | 0.3 | 0.3 | −1 | −1 | −1 | 234.12 ± 1.73 c | 0.473 ± 0.011 b |
| 4 | 1 | 1.5 | 0.5 | 2 | 25 | 0.1 | 0.3 | 0.3 | 1 | −1 | −1 | 181.25 ± 1.58 h | 0.39 ± 0.008 e,f |
| 5 | 1 | 0.5 | 1.5 | 1 | 25 | 0.3 | 0.1 | 0.3 | 1 | 1 | −1 | 191.25 ± 2.93 g | 0.385 ± 0.009 f |
| 6 | 1 | 0.5 | 0.5 | 2 | 10 | 0.3 | 0.3 | 0.1 | 1 | 1 | 1 | 123.41 ± 1.38 | 0.418 ± 0.010 d |
| 7 | 2.5 | 0.5 | 0.5 | 1 | 25 | 0.1 | 0.3 | 0.3 | −1 | 1 | 1 | 245.28 ± 0.72 b | 0.403 ± 0.008 e |
| 8 | 2.5 | 1.5 | 0.5 | 1 | 10 | 0.3 | 0.1 | 0.3 | 1 | −1 | 1 | 221.32 ± 2.01 e | 0.471 ± 0.006 b |
| 9 | 2.5 | 1.5 | 1.5 | 1 | 10 | 0.1 | 0.3 | 0.1 | 1 | 1 | −1 | 231.55 ± 1.48 d | 0.489 ± 0.012 a |
| 10 | 1 | 1.5 | 1.5 | 2 | 10 | 0.1 | 0.1 | 0.3 | −1 | 1 | 1 | 164.25 ± 1.53 i | 0.431 ± 0.007 c |
| 11 | 2.5 | 0.5 | 1.5 | 2 | 25 | 0.1 | 0.1 | 0.1 | 1 | −1 | 1 | 253.32 ± 1.77 a | 0.428 ± 0.010 c,d |
| 12 | 1 | 0.5 | 0.5 | 1 | 10 | 0.1 | 0.1 | 0.1 | −1 | −1 | −1 | 118.35 ± 0.71 | 0.419 ± 0.011 d |
| Enzyme Activity | Biomass | |||||||
|---|---|---|---|---|---|---|---|---|
| Factor | Coefficient Estimat | Effects | p-Value | S | Coefficient Estimat | Effects | p-Value | S |
| A | 36.83 | 73.66 | <0.0001 | ** | 0.021 | 0.041 | <0.0001 | ** |
| B | 8.17 | 16.33 | 0.0138 | ** | 0.0071 | 0.014 | 0.0084 | ** |
| C | 12.50 | 24.99 | 0.0016 | ** | 0.0066 | 0.013 | 0.0119 | ** |
| D | −1.38 | −2.75 | −0.0008 | −0.00017 | ||||
| E | 20.29 | 40.57 | <0.0001 | ** | −0.022 | −0.044 | <0.0001 | ** |
| F | 3.45 | 6.90 | 0.0014 | 0.0028 | ||||
| G | 2.68 | 5.36 | 0.0011 | 0.0022 | ||||
| H | 3.79 | 7.58 | −0.0026 | −0.0052 | ||||
| Dummy | −2.10 | −4.20 | 0.0021 | 0.0042 | ||||
| Dummy | −1.47 | −2.95 | −0.0024 | −0.0048 | ||||
| Dummy | 1.35 | 2.69 | −0.0026 | −0.0052 | ||||
| Run | X1 | X2 | X3 | X4 | EA (U/mL) | BM (OD600) |
|---|---|---|---|---|---|---|
| 1 | −1 | −1 | 0 | 0 | 240.99 ± 1.33 | 0.405 ± 0.006 |
| 2 | 1 | −1 | 0 | 0 | 174.26 ± 1.80 | 0.448 ± 0.010 |
| 3 | −1 | 1 | 0 | 0 | 217.43 ± 0.86 | 0.386 ± 0.008 |
| 4 | 1 | 1 | 0 | 0 | 241.56 ± 1.71 | 0.39 ± 0.007 |
| 5 | 0 | 0 | −1 | −1 | 150.97 ± 1.55 | 0.472 ± 0.011 |
| 6 | 0 | 0 | 1 | −1 | 218.21 ± 1.42 | 0.481 ± 0.004 |
| 7 | 0 | 0 | −1 | 1 | 217.54 ± 0.90 | 0.483 ± 0.023 |
| 8 | 0 | 0 | 1 | 1 | 105.86 ± 0.86 | 0.494 ± 0.006 |
| 9 | −1 | 0 | 0 | −1 | 180.70 ± 0.82 | 0.447 ± 0.005 |
| 10 | 1 | 0 | 0 | −1 | 235.65 ± 1.38 | 0.488 ± 0.012 |
| 11 | −1 | 0 | 0 | 1 | 250.14 ± 2.00 | 0.481 ± 0.008 |
| 12 | 1 | 0 | 0 | 1 | 140.93 ± 0.94 | 0.469 ± 0.008 |
| 13 | 0 | −1 | −1 | 0 | 235.93 ± 0.69 | 0.422 ± 0.006 |
| 14 | 0 | 1 | −1 | 0 | 200.45 ± 1.07 | 0.387 ± 0.013 |
| 15 | 0 | −1 | 1 | 0 | 188.06 ± 1.06 | 0.431 ± 0.020 |
| 16 | 0 | 1 | 1 | 0 | 212.07 ± 1.16 | 0.398 ± 0.009 |
| 17 | −1 | 0 | −1 | 0 | 194.38 ± 1.00 | 0.443 ± 0.009 |
| 18 | 1 | 0 | −1 | 0 | 230.18 ± 1.21 | 0.451 ± 0.008 |
| 19 | −1 | 0 | 1 | 0 | 220.04 ± 1.41 | 0.455 ± 0.015 |
| 20 | 1 | 0 | 1 | 0 | 146.33 ± 0.97 | 0.493 ± 0.021 |
| 21 | 0 | −1 | 0 | −1 | 185.89 ± 1.69 | 0.439 ± 0.011 |
| 22 | 0 | 1 | 0 | −1 | 208.25 ± 0.49 | 0.380 ± 0.007 |
| 23 | 0 | −1 | 0 | 1 | 163.21 ± 1.94 | 0.440 ± 0.008 |
| 24 | 0 | 1 | 0 | 1 | 193.42 ± 0.73 | 0.430 ± 0.005 |
| 25 | 0 | 0 | 0 | 0 | 270.32 ± 1.05 | 0.519 ± 0.018 |
| 26 | 0 | 0 | 0 | 0 | 271.85 ± 0.62 | 0.520 ± 0.020 |
| 27 | 0 | 0 | 0 | 0 | 269.09 ± 0.97 | 0.521 ± 0.015 |
| 28 | 0 | 0 | 0 | 0 | 260.33 ± 1.12 | 0.513 ± 0.011 |
| 29 | 0 | 0 | 0 | 0 | 259.36 ± 0.89 | 0.516 ± 0.017 |
| Factor | EA | Biomass | ||||
|---|---|---|---|---|---|---|
| SS | F-Value | Pr > F | SS | F-Value | Pr > F | |
| X1 | 1513.02 | 6.577711 | 0.0027 ** | 0.00124 | 29.75 | <0.0001 *** |
| X2 | 597.81 | 0.795231 | 0.0383 * | 0.00382 | 91.54 | <0.0001 *** |
| X3 | 1607.21 | 6.359724 | 0.0022 ** | 0.00074 | 17.66 | 0.0009 ** |
| X4 | 985.64 | 4.124658 | 0.0108 * | 0.000675 | 16.19 | 0.0013 ** |
| X1X2 | 2065.79 | 11.36978 | 0.0008 ** | 0.00038 | 9.12 | 0.0092 ** |
| X1X3 | 2997.89 | 12.10719 | 0.0002 ** | 0.00023 | 5.40 | 0.0357 * |
| X1X4 | 6736.72 | 46.20569 | <0.0001 *** | 0.00070 | 16.85 | 0.0011 ** |
| X2X3 | 885.00 | 6.160962 | 0.0147 * | 0.000001 | 0.024 | 0.8791 |
| X2X4 | 14.64 | 0.560155 | 0.7258 | 0.00060 | 14.40 | 0.0020 ** |
| X3X4 | 8003.63 | 43.95054 | <0.0001 *** | 0.000001 | 0.024 | 0.6521 |
| X12 | 3148.00 | 11.63744 | 0.0001 | 0.00656 | 157.43 | <0.0001 |
| X22 | 3562.08 | 23.78141 | <0.0001 | 0.043 | 1041.34 | <0.0001 |
| X32 | 10,960.79 | 63.65951 | <0.0001 | 0.00407 | 97.70 | <0.0001 |
| X42 | 16,077.00 | 94.12138 | <0.0001 | 0.00115 | 29.75 | 0.0001 |
| Model | 49,077.94 | 19.7224 | <0.0001 *** | 0.054 | 92.78 | <0.0001 *** |
| Residual error | 1600.21 | 0.000583 | ||||
| Lack of fit | 1461.78 | 3.162004 | 0.0888 | 0.000521 | 3.32 | 0.0598 |
| Pure error | 138.43 | 0.000063 | ||||
| Cor Total | 50,678.15 | 0.055 | ||||
| Biomass | Enzyme Activity | |||||||
|---|---|---|---|---|---|---|---|---|
| Value | Um | X0 | Xm | R2 | α | β | R2 | |
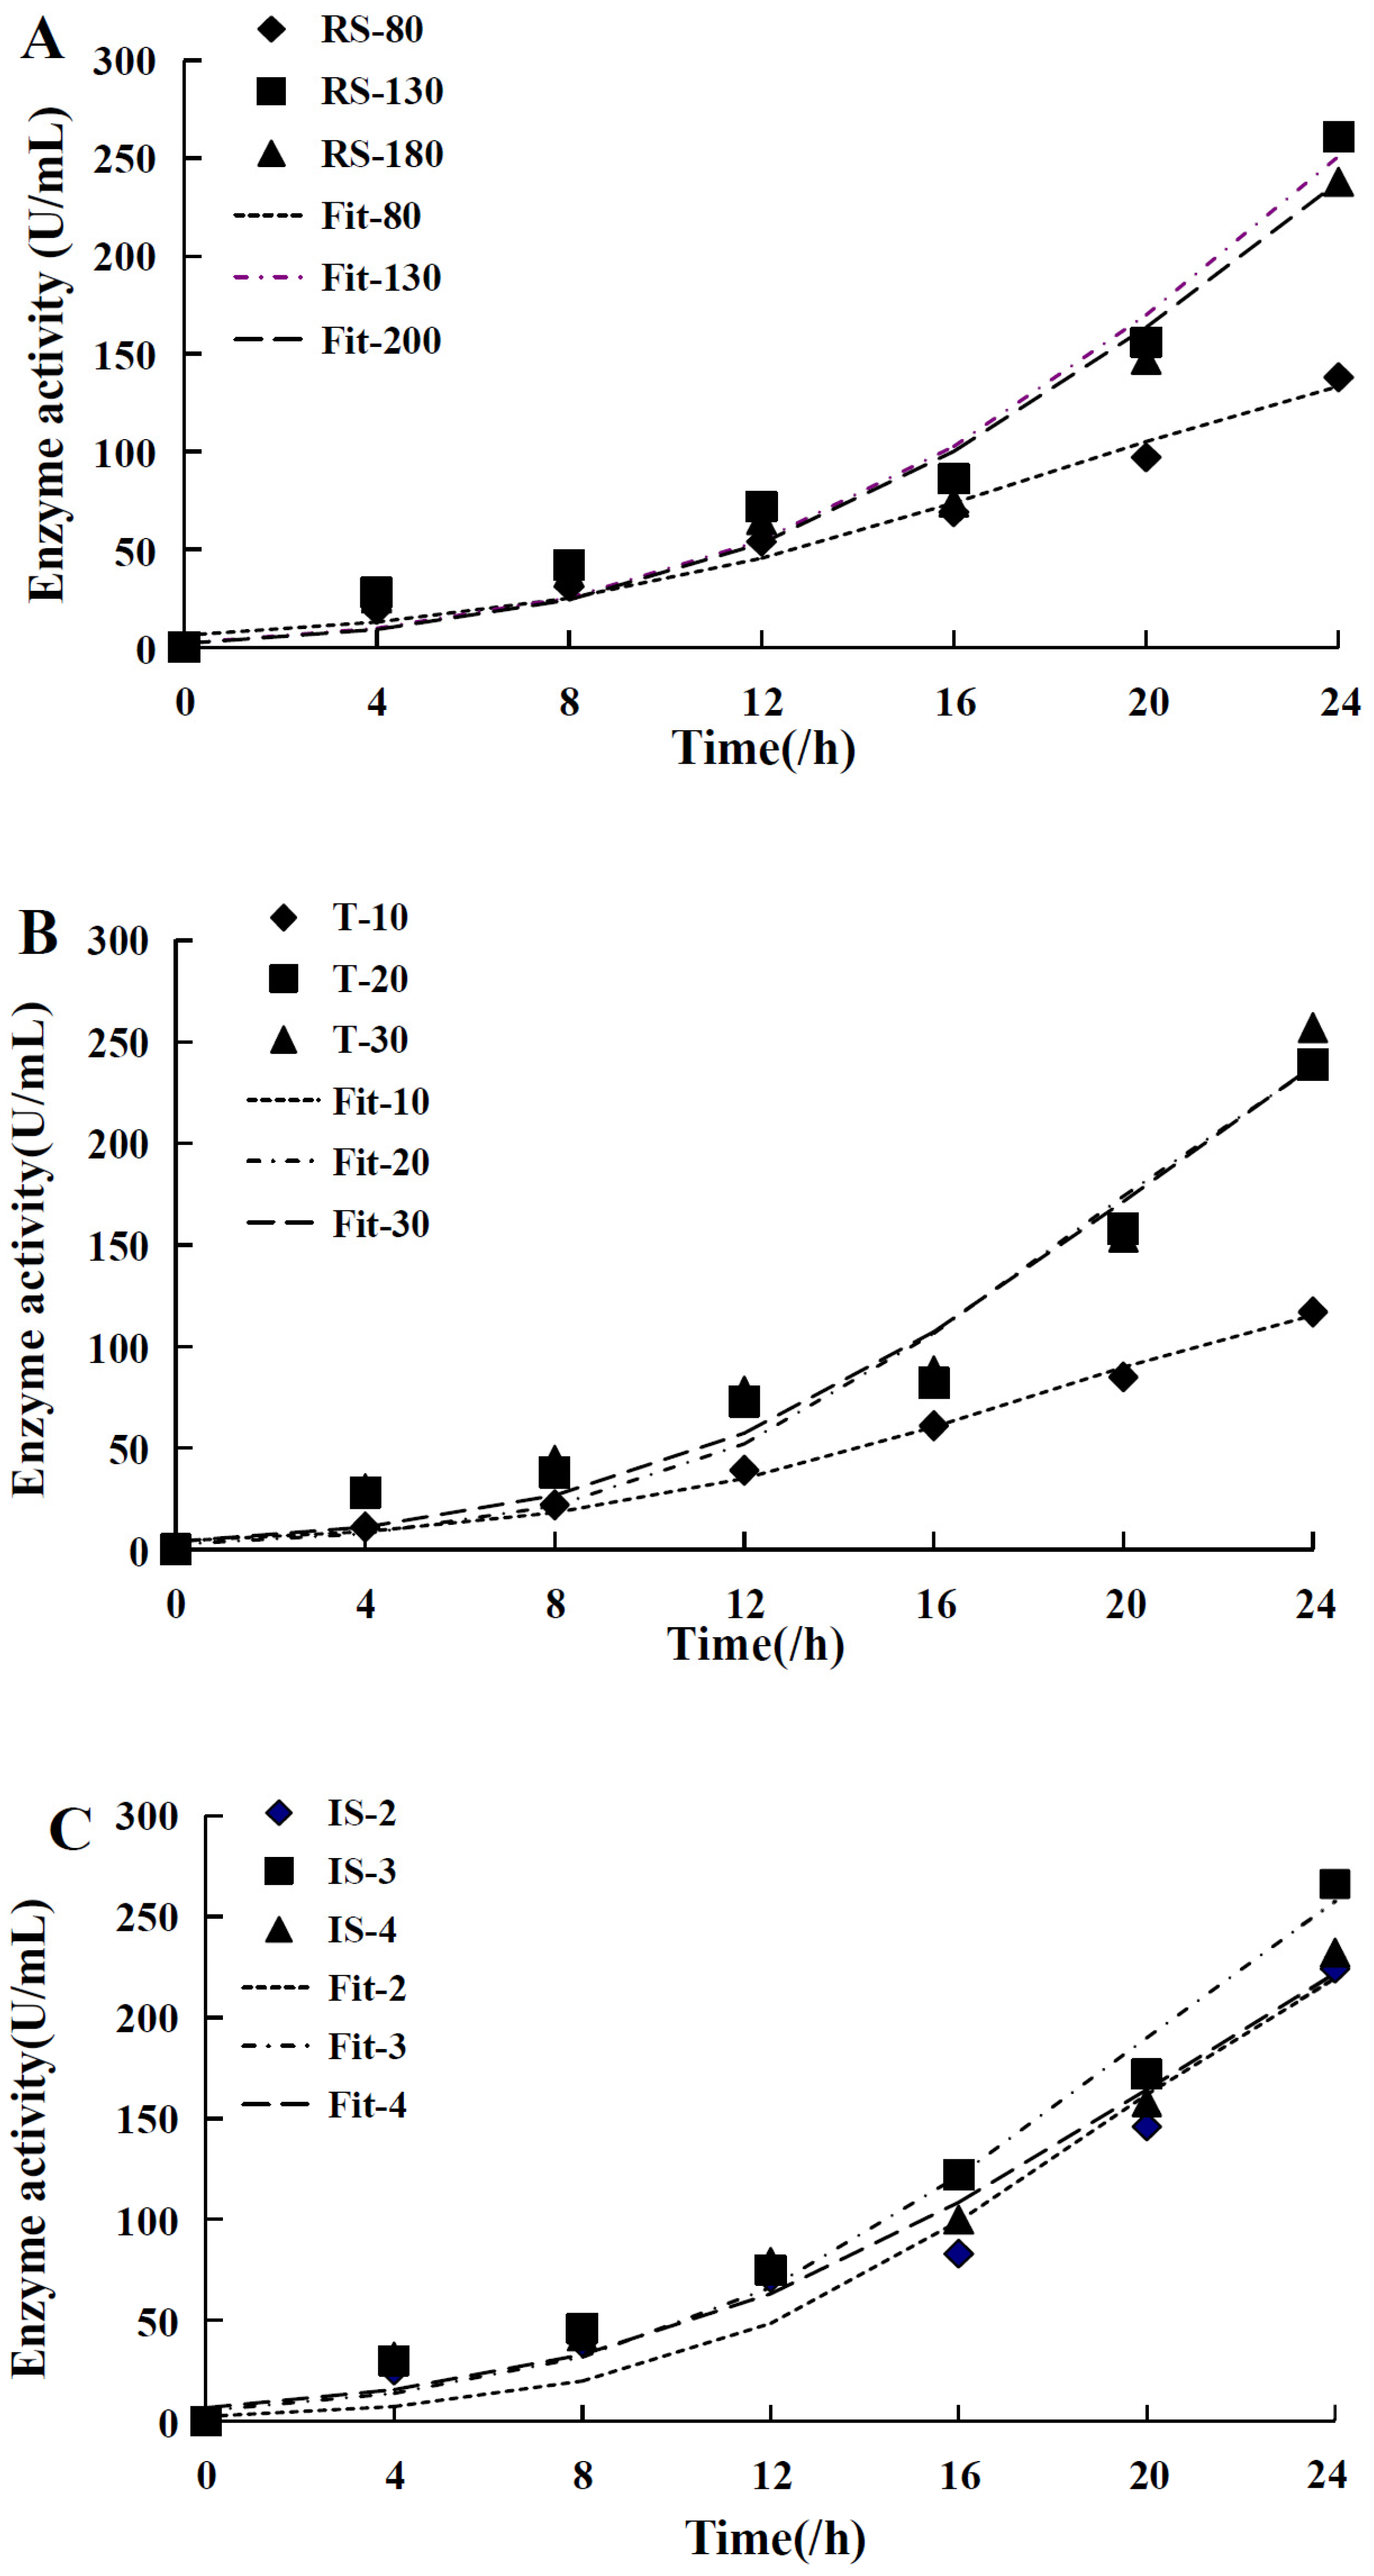
| RS (r/min) | 80 | 0.186 | 0.017 | 0.396 | 0.976 | 352.453 | 6.770 | 0.979 |
| 130 | 0.201 | 0.021 | 0.567 | 0.978 | 95.433 | 42.558 | 0.969 | |
| 200 | 0.214 | 0.017 | 0.451 | 0.988 | 106.824 | 46.014 | 0.971 | |
| T (/°C) | 10 | 0.198 | 0.009 | 0.329 | 0.96 | 458.271 | 0.000 | 0.993 |
| 20 | 0.257 | 0.008 | 0.553 | 0.972 | 300.319 | 20.764 | 0.961 | |
| 30 | 0.217 | 0.014 | 0.577 | 0.974 | 280.334 | 23.532 | 0.97 | |
| IS (/mL) | 2 | 0.255 | 0.007 | 0.504 | 0.978 | 341.826 | 17.908 | 0.96 |
| 3 | 0.214 | 0.016 | 0.655 | 0.976 | 330.606 | 16.432 | 0.981 | |
| 4 | 0.190 | 0.026 | 0.726 | 0.968 | 262.767 | 13.541 | 0.979 | |
| Level | Factor | |||
|---|---|---|---|---|
| X1: κ-Carrageenan g/L | X2: NaCl g/L | X3: Yeast Extract g/L | X4: FOS g/L | |
| −1 | 1 | 15 | 0.5 | 0.5 |
| 0 | 2 | 20 | 1 | 1 |
| 1 | 3 | 25 | 1.5 | 1.5 |
© 2016 by the authors. Licensee MDPI, Basel, Switzerland. This article is an open access article distributed under the terms and conditions of the Creative Commons Attribution (CC-BY) license ( http://creativecommons.org/licenses/by/4.0/).
Share and Cite
Guo, J.; Zhang, L.; Lu, X.; Zeng, S.; Zhang, Y.; Xu, H.; Zheng, B. Medium Optimization and Fermentation Kinetics for κ-Carrageenase Production by Thalassospira sp. Fjfst-332. Molecules 2016, 21, 1479. https://doi.org/10.3390/molecules21111479
Guo J, Zhang L, Lu X, Zeng S, Zhang Y, Xu H, Zheng B. Medium Optimization and Fermentation Kinetics for κ-Carrageenase Production by Thalassospira sp. Fjfst-332. Molecules. 2016; 21(11):1479. https://doi.org/10.3390/molecules21111479
Chicago/Turabian StyleGuo, Juanjuan, Longtao Zhang, Xu Lu, Shaoxiao Zeng, Yi Zhang, Hui Xu, and Baodong Zheng. 2016. "Medium Optimization and Fermentation Kinetics for κ-Carrageenase Production by Thalassospira sp. Fjfst-332" Molecules 21, no. 11: 1479. https://doi.org/10.3390/molecules21111479
APA StyleGuo, J., Zhang, L., Lu, X., Zeng, S., Zhang, Y., Xu, H., & Zheng, B. (2016). Medium Optimization and Fermentation Kinetics for κ-Carrageenase Production by Thalassospira sp. Fjfst-332. Molecules, 21(11), 1479. https://doi.org/10.3390/molecules21111479