
Properties of Manganese(III) Ferrocenyl-β-Diketonato Complexes Revealed by Charge Transfer and Multiplet Splitting in the Mn 2p and Fe 2p X-Ray Photoelectron Envelopes

Abstract
:
1. Introduction
2. Results and Discussion
3. Methods
3.1. Compounds
3.2. X-Ray Photoelectron Spectroscopy
4. Concluding Remarks
Acknowledgments
Author Contributions
Conflicts of Interest
References and Notes
- Bansse, W.; Ludwig, E.; Mickler, W.; Uhlemann, E.; Hahn, E.; Lügger, T.; Lehmann, A. Mangan(IV)-Komplexe mit Dreizähnigen Diaciden Liganden. Kristallstruktur von Acetylacetonato-salicylaldehydbenzoylhydrazonato(2-)-methanol-mangan(III). Z. Anorg. Allg. Chem. 1995, 621, 1483–1488. [Google Scholar] [CrossRef]
- Perera, I.R.; Gupta, A.; Xiang, W.; Daeneke, T.; Bach, U.; Evans, R.A.; Ohlin, C.A.; Spiccia, L. Introducing manganese complexes as redox mediators for dye-sensitized solar cells. Phys. Chem. Chem. Phys. 2014, 16, 12021–12028. [Google Scholar] [CrossRef] [PubMed]
- Henari, F.Z.; Ali-Mohamed, A.Y. Nonlinear refractive index measurement of tris(acetylacetonato) manganese(III) solution. Opt. Laser Technol. 2008, 40, 602. [Google Scholar] [CrossRef]
- Buitendach, B.E.; Erasmus, E.; Landman, M.; Niemantsverdriet, J.W.; Swarts, J.C. Consequences of electron-density manipulations on the X-ray photoelectron spectroscopic properties of ferrocenyl-β-diketonato complexes of manganese(III). Structure of [Mn(FcCOCHCOCH3)3]. Inorg. Chem. 2016, 55, 1992–2000. [Google Scholar] [CrossRef] [PubMed]
- Barra, A.L.; Gatteschi, D.; Sessoli, R.; Abbati, G.L.; Cornia, A.; Fabretti, A.C.; Uytterhoeven, M.G. Electronic structure of manganese(III) compounds from high-frequency EPR spectra. Angew. Chem. Int. Ed. 1997, 36, 2329–2331. [Google Scholar] [CrossRef]
- Kowalczyk, S.P.; Ley, L.; Martin, R.L.; McFeely, F.R.; Shirley, D.A. Relaxation and final-state structure in XPS of atoms, molecules and metals. Faraday Discuss. Chem. Soc. 1975, 60, 7–17. [Google Scholar] [CrossRef]
- Chusuei, C.C.; Goodman, D.W. Control of CuO Particle Size on SiO2 by Spin Coating. In Encyclopedia of Physical Science and Technology, 3rd ed.; Meyers, R.A., Ed.; Academic Press: New York, NY, USA, 2001; Volume 17, p. 921. [Google Scholar]
- Gupta, R.P.; Sen, S.K. Calculation of multiplet structure of core p-vacancy levels. Phys. Rev. B 1974, 10, 71–77. [Google Scholar] [CrossRef]
- Gupta, R.P.; Sen, S.K. Calculation of multiplet structure of core p-vacancy levels. II. Phys. Rev. B 1975, 12, 15–19. [Google Scholar] [CrossRef]
- Biesinger, M.C.; Payne, B.P.; Grosvenor, A.P.; Lau, A.W.M.; Gerson, A.R.; Smart, R.S.C. Resolving surface chemical states in XPS analysis of first row transition metals, oxides and hydroxides: Cr, Mn, Fe, Co and Ni. Appl. Surf. Sci. 2011, 257, 2717. [Google Scholar] [CrossRef]
- Ȕnveren, E.; Kemnitz, E.; Hutton, S.; Lippitz, A.; Unger, W.E.S. Analysis of highly resolved X-ray photoelectron Cr 2p spectra obtained with a Cr2O3 powder sample prepared with adhesive tape. Surf. Interface Anal. 2004, 36, 92–95. [Google Scholar] [CrossRef]
- Ilton, E.S.; de Jong, W.A.; Bagus, P.S. Intra-atomic many-body effects in p-shell photoelectron spectra of Cr3+ ions. Phys. Rev. B 2003, 68, 125106. [Google Scholar] [CrossRef]
- Biesinger, M.C.; Brown, C.; Mycroft, J.R.; Davidson, R.D.; McIntyre, N.S. X-ray photoelectron spectroscopy studies of chromium compounds. Surf. Interface Anal. 2004, 36, 1550–1563. [Google Scholar] [CrossRef]
- Asada, S.; Sugano, S. Satellites in X-ray photoelectron Spectra of Transition-Metal Compounds. J. Phys. Soc. Jpn. 1976, 41, 1291–1299. [Google Scholar] [CrossRef]
- Larsson, S. Satellites in ESCA inner-shell spectra of 3d0 transition metal complexes. J. Electron Spectrosc. Relat. Phenom. 1976, 8, 171–178. [Google Scholar] [CrossRef]
- Larsson, S. Shake-up and multiplet structure of ESCA satellites of Cu compounds. Chem. Phys. Lett. 1976, 40, 362–366. [Google Scholar] [CrossRef]
- Larsson, S.; Braga, M. Charge transfer satellites. Intensity dependence on localization of hole state. Chem. Phys. Lett. 1977, 48, 596–600. [Google Scholar] [CrossRef]
- Carlson, T.A. Photoelectron and Auger Spectroscopy; Plenum: New York, NY, USA, 1976. [Google Scholar]
- Feuerbacher, B.; Fitton, B.; Willis, R.F. Photoemission and the Electronic Properties of Surfaces; Wiley: New York, NY, USA, 1978. [Google Scholar]
- Biesinger, M.C.; Payne, B.P.; Hart, B.R.; Grosvenor, A.P.; McIntyre, N.E.; Lau, L.W.M.; Smart, R.S.C. Quantitative chemical state XPS analysis of first row transition metals, oxides and hydroxides. J. Phys. Conf. Ser. 2008, 100, 012026. [Google Scholar] [CrossRef]
- Grosvenor, A.P.; Biesinger, M.C.; Smart, R.S.C.; McIntrye, N.S. New interpretations of XPS spectra of nickel metal and oxides. Surf. Sci. 2006, 600, 1771–1779. [Google Scholar] [CrossRef]
- Grosvenor, A.P.; Kobe, B.A.; Biesinger, M.C.; McIntyre, N.S. Investigation of multiplet splitting of Fe 2p XPS spectra and bonding in iron compounds. Surf. Interface Anal. 2004, 36, 1564–1574. [Google Scholar] [CrossRef]
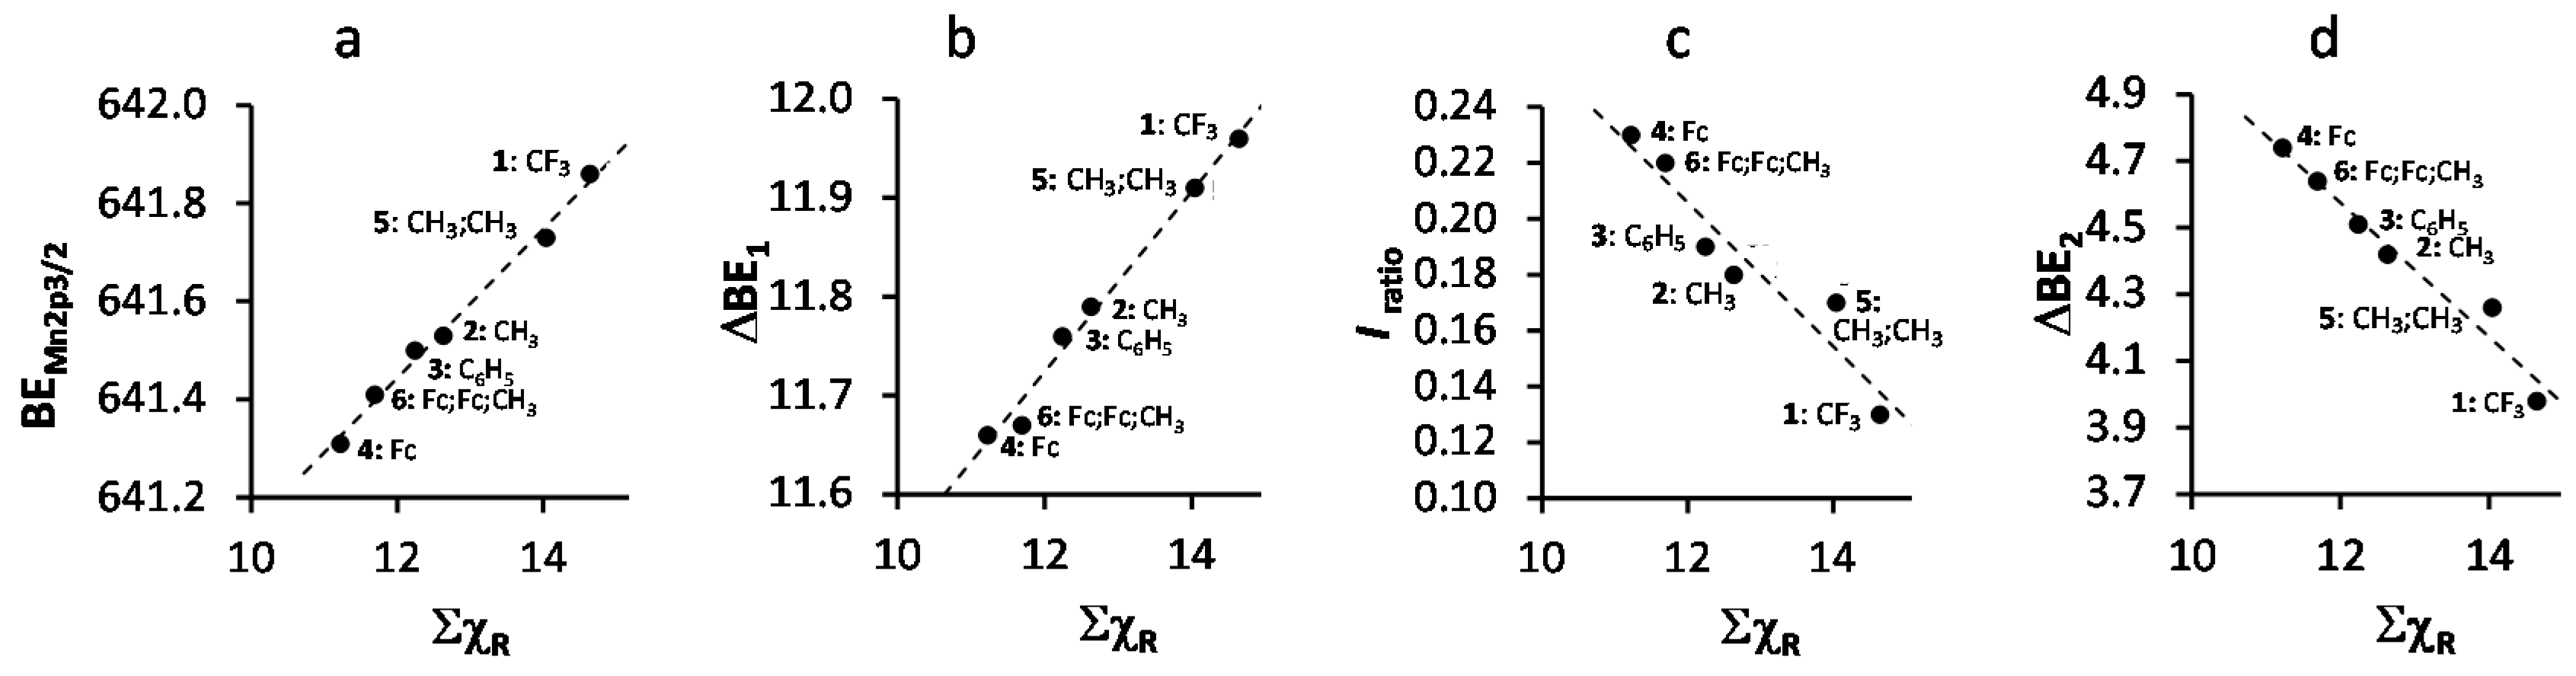
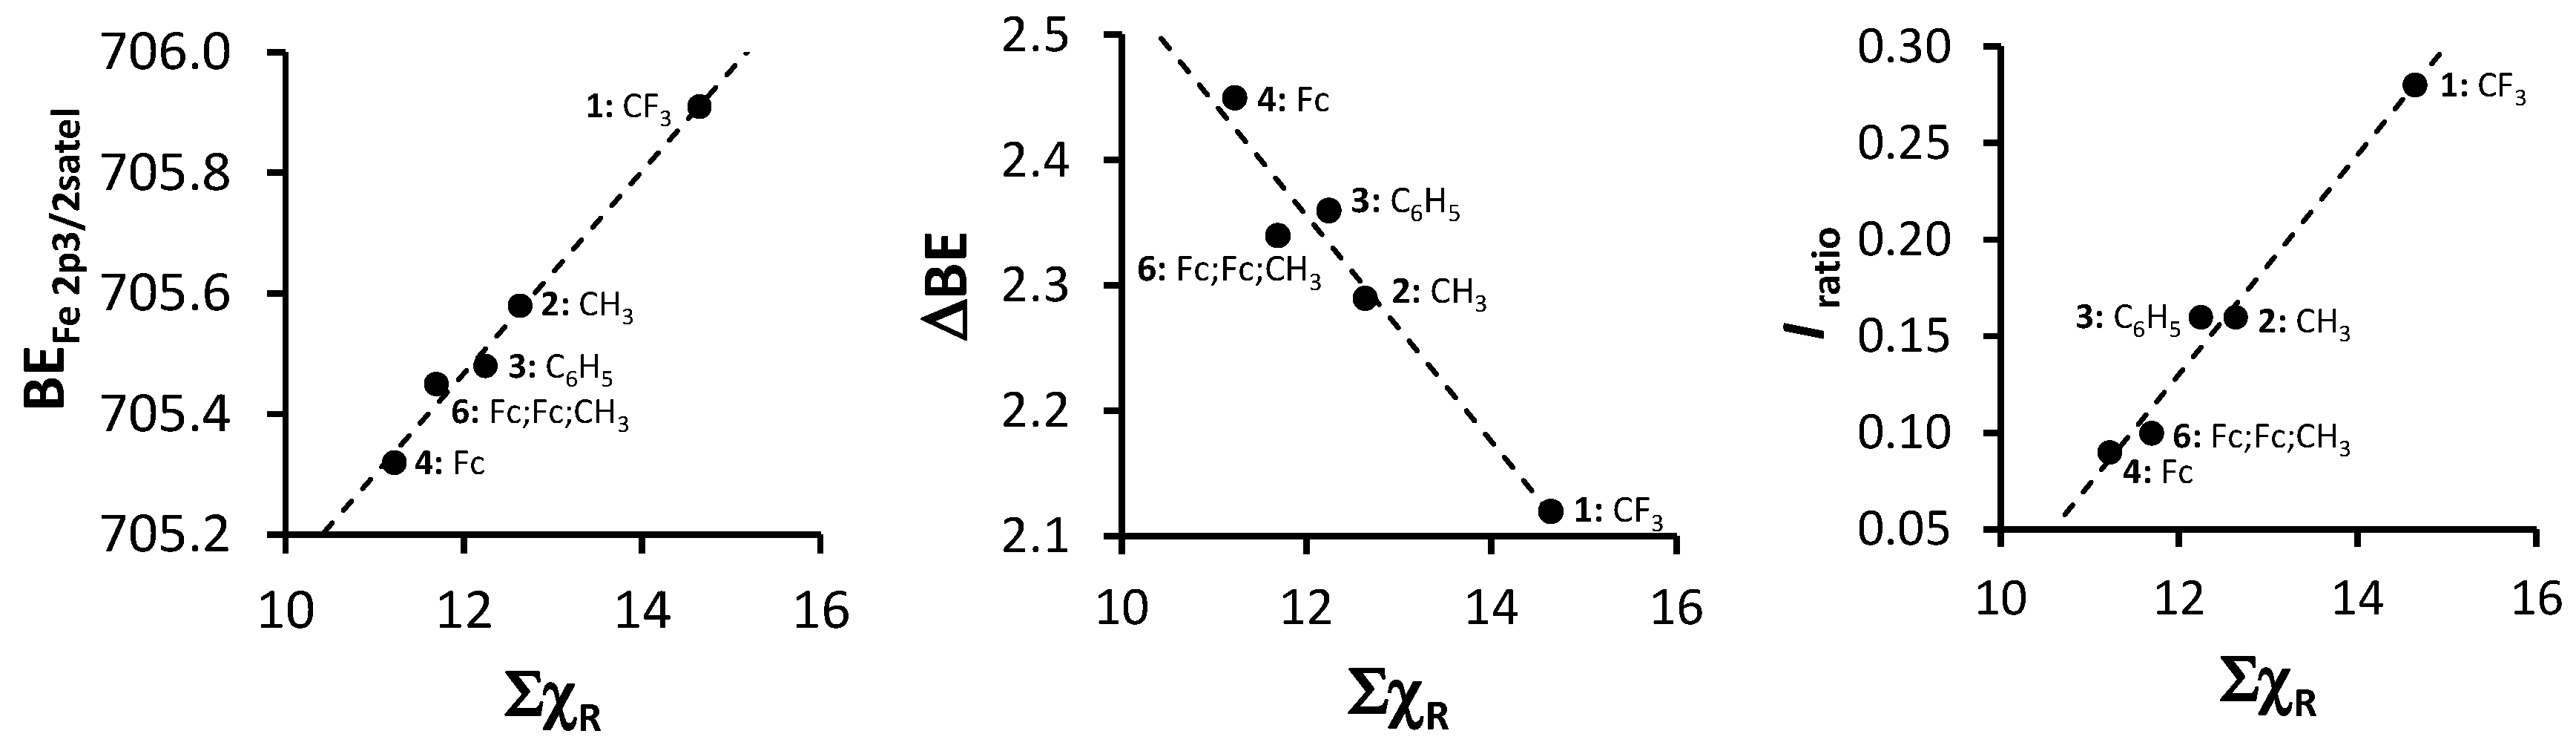
- Gordy scale group electronegativities, χR, are empirical numbers that express the combined tendency of not only one atom, but a group of atoms, like R = CF3 or ferrocenyl (Fc), to attract electrons (including those in a covalent bond) as a function of the number of valence electrons, n, and the covalent radius, r (in Å), of groups as discussed in Kagarise, R.E. Relation between the electronegativities of adjacent substitutents and the stretching frequency of the carbonyl group. J. Am. Chem. Soc. 1955, 77, 1377–1379. [Google Scholar] [CrossRef].
- Erasmus, E.; Conradie, J.; Muller, A.; Swarts, J.C. Synthesis, crystal structure and electrochemistry of tetrahedral mono-β-diketonato titanocenyl complexes. Inorg. Chim. Acta 2007, 360, 2277–2283. [Google Scholar] [CrossRef]
- Erasmus, E. Ferrocene- and ruthenocene-containing chalcones: A spectroscopic and electrochemical study. Inorg. Chim. Acta 2011, 378, 95–101. [Google Scholar] [CrossRef]
- Muller, T.J.; Conradie, J.; Erasmus, E. A spectroscopic, electrochemical and DFT study of para-substituted ferrocene-containing chalcone derivatives: Structure of FcCOCHCH(p-tBuC6H4). Polyhedron 2012, 33, 257–266. [Google Scholar] [CrossRef]
- Erasmus, E. Swarts, J.C. Intramolecular communication and electrochemical observation of the 17-electron ruthenocenium cation in fluorinated ruthenocene-containing β-diketones; polymorphism of C10H21 and C10F21 derivatives. New J. Chem. 2013, 37, 2862–2873. [Google Scholar] [CrossRef]
- Conradie, M.M.; Conradie, J.; Erasmus, E. Immobilization of iron tris(β-diketonates) on a two-dimensional flat amine functionalized silicon wafer: A catalytic study of the formation of urethane, from ethanol and a diisocyanate derivative. Polyhedron 2014, 79, 52–59. [Google Scholar] [CrossRef]
- Erasmus, E. Synthesis and unexpected electrochemical reaction of p-substituted phenyl diphenylphosphinites. J. Electroanal. Chem. 2014, 727, 1–7. [Google Scholar] [CrossRef]
- Liu, R.; Conradie, J.; Erasmus, E. Comparison of X-ray photoelectron spectroscopy multiplet splitting of Cr 2p peaks from chromium tris(β-diketonates) with chemical effects. J. Electron Spectrosc. Relat. Phenom. 2016, 206, 46–51. [Google Scholar] [CrossRef]
- Erasmus, E. Synthesis and electrochemistry of p-substituted phenyl diphenylphosphinite rhodium(I) complexes. Polyhedron 2016, 106, 18–26. [Google Scholar] [CrossRef]
- Carniato, S.; Journel, L.; Guillemin, R.; Piancastelli, M.N.; Stolte, W.C. A new method to derive electronegativity from resonant inelastic X-ray scattering. J. Chem. Phys. 2016, 137, 144303–144313. [Google Scholar] [CrossRef] [PubMed]
- Ilton, E.S.; Post, J.E.; Heaney, P.J.; Ling, F.T.; Kerisit, S.N. XPS determination of Mn oxidation states in Mn (hydr)oxides. Appl. Surf. Sci. 2016, 366, 475–485. [Google Scholar] [CrossRef]
- Wang, S.; He, W.R.; Ferbinteanu, M.; Li, Y.H.; Huang, E. Tetragonally compressed high-spin Mn(III) Schiff base complex: Synthesis, crystal structure, magnetic properties and theoretical calculations. Polyhedron 2013, 52, 1199–1205. [Google Scholar] [CrossRef]
- Kennedy, B.J.; Murray, K.S. Magnetic properties and zero-field splitting in high-spin manganese(III) complexes. 1. Mononuclear and polynuclear Schiff-base chelates. Inorg. Chem. 1985, 24, 1557. [Google Scholar] [CrossRef]
- Carver, J.C.; Schweitzer, G.K.; Carlson, T.A. Use of X-ray Photoelectron Spectroscopy to Study Bonding in Cr, Mn, Fe, and Co Compounds. J. Chem. Phys. 1972, 57, 973–981. [Google Scholar] [CrossRef]
- Ivanova, T.M.; Shchukarev, A.V.; Naumkin, A.V.; Sidorov, A.A.; Kiskin, M.A.; Novotortsev, V.M.; Eremenko, I.L. X-ray photoelectron spectra of polynuclear manganese complexes. Russ. J. Inorg. Chem. 2008, 53, 1929–1933. [Google Scholar] [CrossRef]
- Borod’ko, Y.G.; Vetchinkin, S.I.; Zimont, S.L.; Ivleva, I.N.; Shul’ga, Y.M. Nature of satellites in X-ray photoelectron spectra XPS of paramagnetic cobalt (II) compounds. Chem. Phys. Lett. 1976, 42, 264–267. [Google Scholar] [CrossRef]
- Ioffe, M.S.; Borod’Ko, Y.G. Dependence of satellite intensity in X-ray photoelectron spectra of Cu(II) complexes on the spin density on copper. J. Electron Spectrosc. Relat. Phenom. 1977, 11, 235–238. [Google Scholar] [CrossRef]
- Perera, J.S.H.Q.; Frost, D.C.; McDowell, C.A. X-ray photoelectron spectroscopy of Co(II), Ni(II), and Cu(II) acetylacetonate vapors. J. Phys. Chem. 1980, 72, 5151–5158. [Google Scholar] [CrossRef]
- Park, J.; Ryu, S.; Han, M.; Oh, S.J. Charge-transfer satellites in the 2p core-level photoelectron spectra of heavy-transition-metal dihalides. Phys. Rev. B 1988, 37, 10867–10875. [Google Scholar] [CrossRef]
- Pauling, L. The nature of the chemical bond. IV The energy of single bonds and the relative electronegativity of atoms. J. Am. Chem. Soc. 1932, 54, 3570–3582. [Google Scholar] [CrossRef]
- Gericke, H.J.; Muller, A.J.; Swarts, J.C. Electrochemical illumination of intramolecular communication in ferrocene-containing tris-β-diketonato aluminum(III) complexes; cytotoxicity of Al(FcCOCHCOCF3)3. Inorg. Chem. 2012, 51, 1552–1561. [Google Scholar] [CrossRef] [PubMed]
- Gotstynski, R.; van Rooyen, P.H.; Conradie, J. Jahn-Teller distortion in tris[4,4,4-trifluoro-1-(2-thienyl)-1,3-butanedionato]manganese(III) isomers: An X-ray and computational study. J. Mol. Struct. 2016, 1119, 48–53. [Google Scholar] [CrossRef]
- Conradie, J.; Erasmus, E. XPS Fe 2p peaks from iron tris(β-diketonates): Electronic effect of the β-diketonato ligand. Polyhedron 2016, 119, 142–150. [Google Scholar] [CrossRef]
- Jansen van Rensburg, A.; Landman, M.; Erasmus, E.; van der Westhuizen, D.; Ferreira, H.; Conradie, M.M.; Conradie, J. Electrochemical and X-ray photoelectron spectroscopic insights into Molybdenum(0) Fischer ethoxycarbene complexes. Electrochim. Acta 2016, 219, 204–213. [Google Scholar] [CrossRef]
- Nelson, A.J.; Reynolds, J.G.; Roos, J.W. Core-level satellites and outer core-level multiplet splitting in Mn model compounds. J. Vac. Sci. Technol. A 2000, 18, 1072–1076. [Google Scholar] [CrossRef]
- Nesbitt, H.W.; Banerjee, D. Interpretation of XPS Mn(2p) spectra of Mn oxyhydroxides and constraints on the mechanism of MnO2 precipitation. Am. Mineral. 1998, 83, 305–315. [Google Scholar] [CrossRef]
- Moulder, F.; Stickle, W.F.; Sobol, P.E.; Bomben, K.D. Handbook of X-ray Photoelectron Spectroscopy; ULVAC-PHI, Inc.: Chigasaki, Japan, 1995; pp. 45, 57 and 143. [Google Scholar]
- Sample Availability: Not Available.


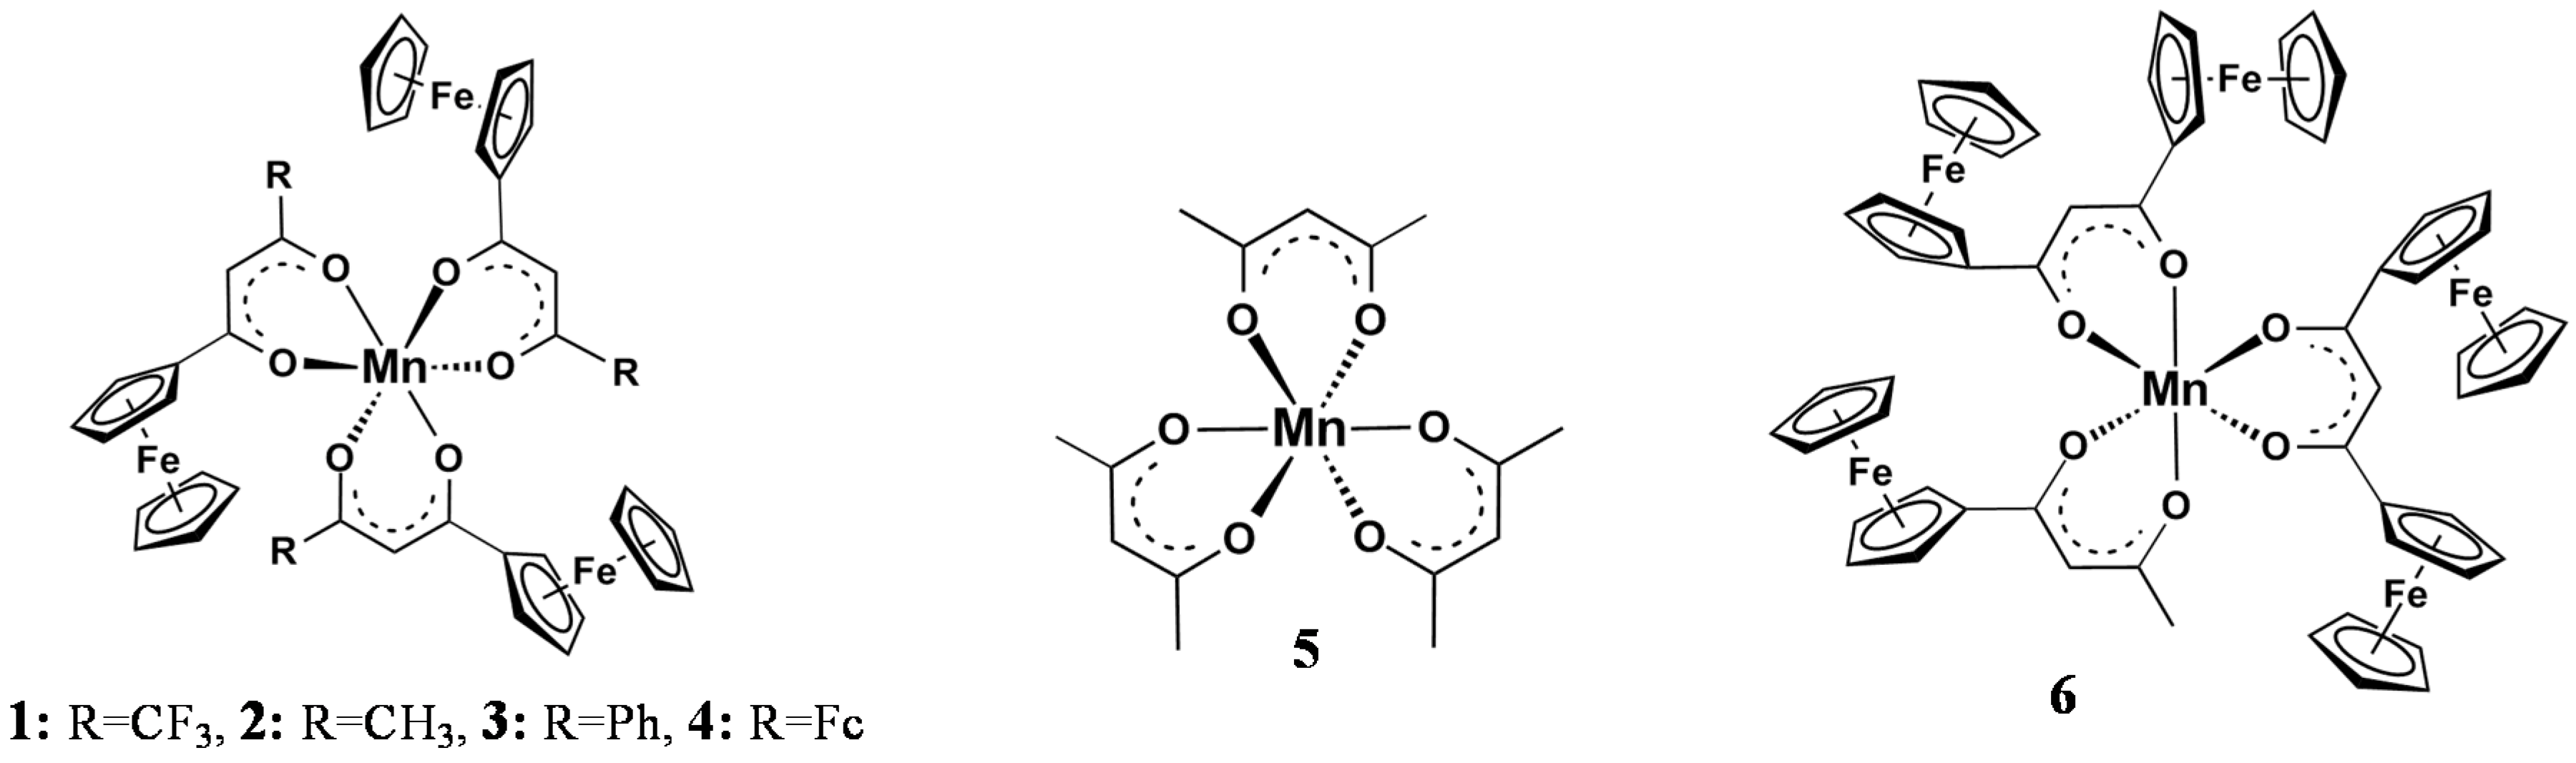
| Comp. No.; Ligand R-Groups | χR | ΣχR 4 | BE Mn 2p3/2 (eV) | FWHM (eV) | ΔBE1 5 (eV) | ΔBE2 6 (eV) | Iratio 7 | BE Mn 2p3/2 (eV) | |
|---|---|---|---|---|---|---|---|---|---|
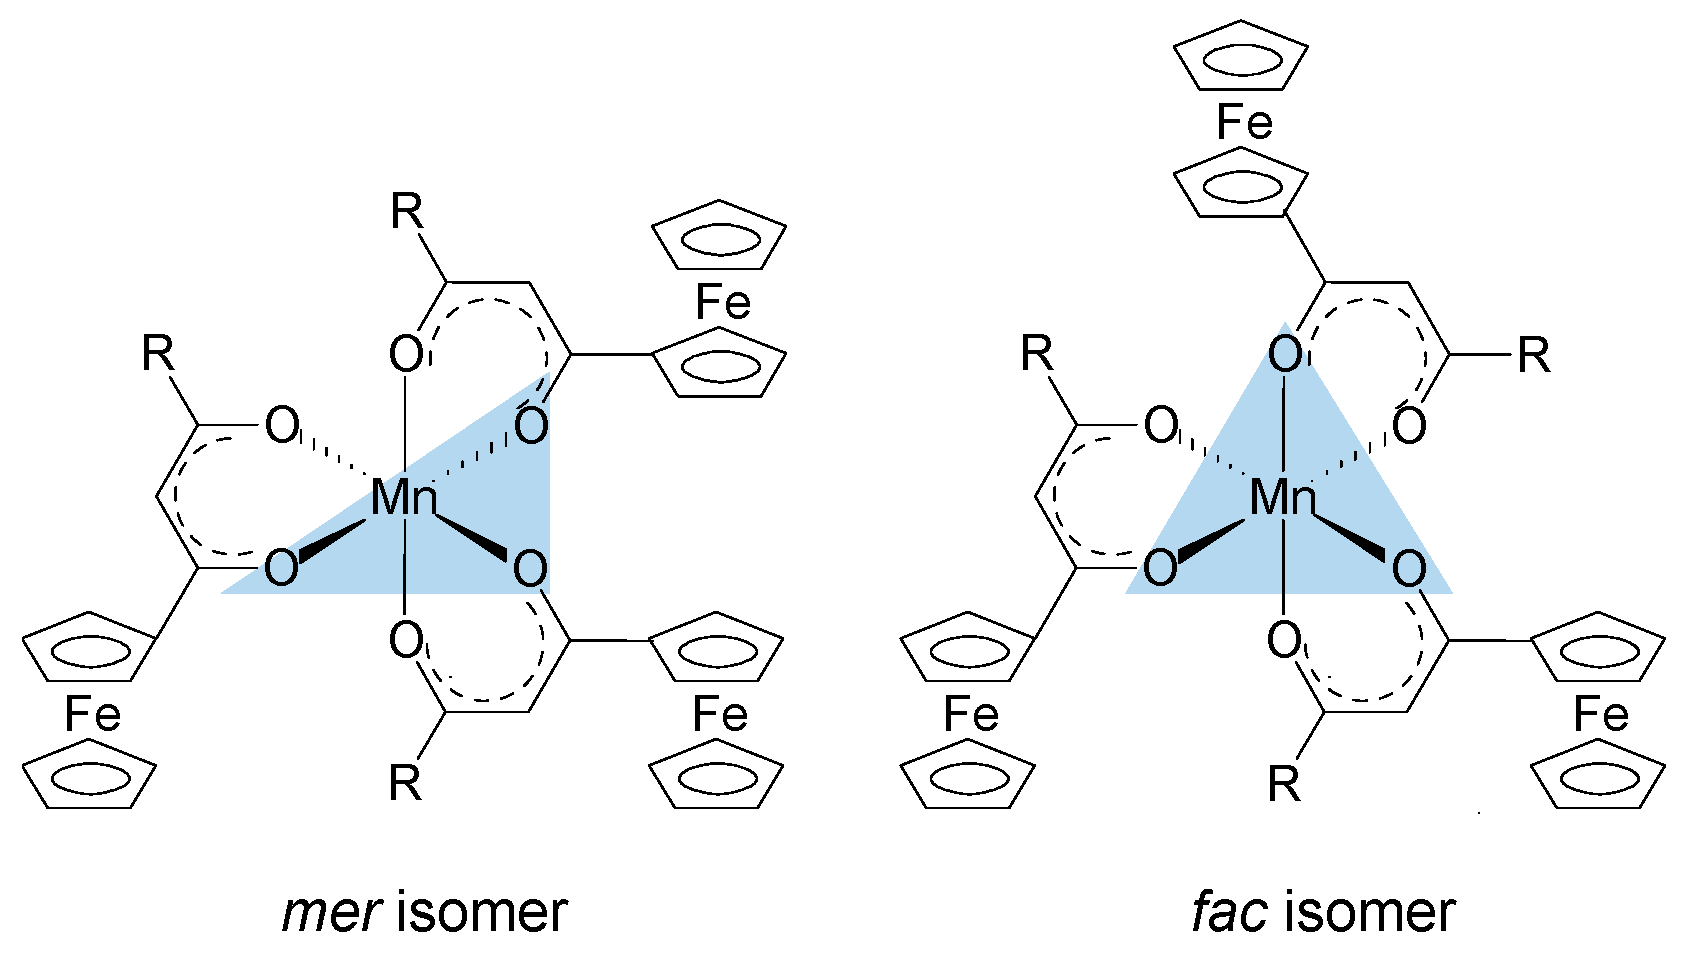
| mer | fac | ||||||||
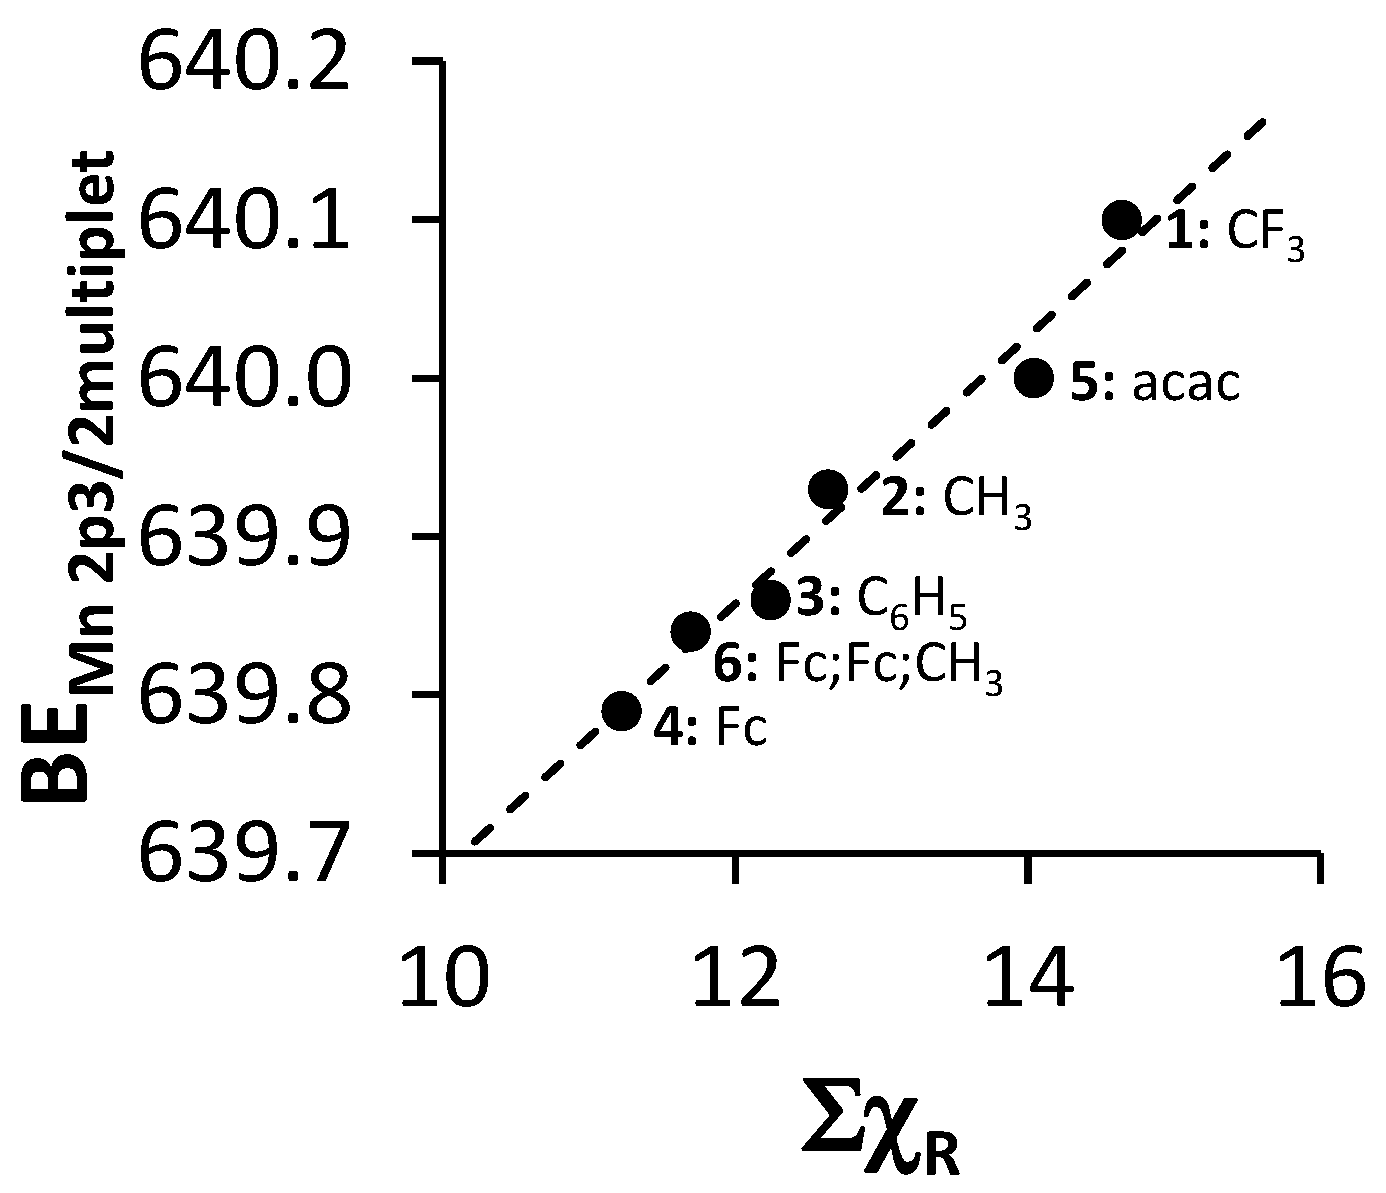
| 1; CF3 1 | 3.01 | 14.64 | 641.86 | 4.64 | 11.96 | 3.98 | 0.13 | 641.62 | 642.22 |
| 2; CH3 1 | 2.34 | 12.63 | 641.53 | 4.00 | 11.79 | 4.42 | 0.19 | 641.5 | 641.9 |
| 3; C6H5 1 | 2.21 | 12.24 | 641.50 | 3.86 | 11.76 | 4.51 | 0.18 | 641.38 | 641.68 |
| 4; Fc 1 | 1.87 | 11.22 | 641.31 | 3.86 | 11.58 | 4.74 | 0.23 | - 8 | - 6 |
| 5; CH3,CH3 2 | 2.34 | 14.04 | 641.73 | 4.06 | 11.91 | 4.36 | 0.17 | - 8 | - 8 |
| 6; Fc,Fc,CH3 3 | - | 11.69 | 641.41 | 4.3 | 11.67 | 4.64 | 0.23 | - 9 | - 9 |
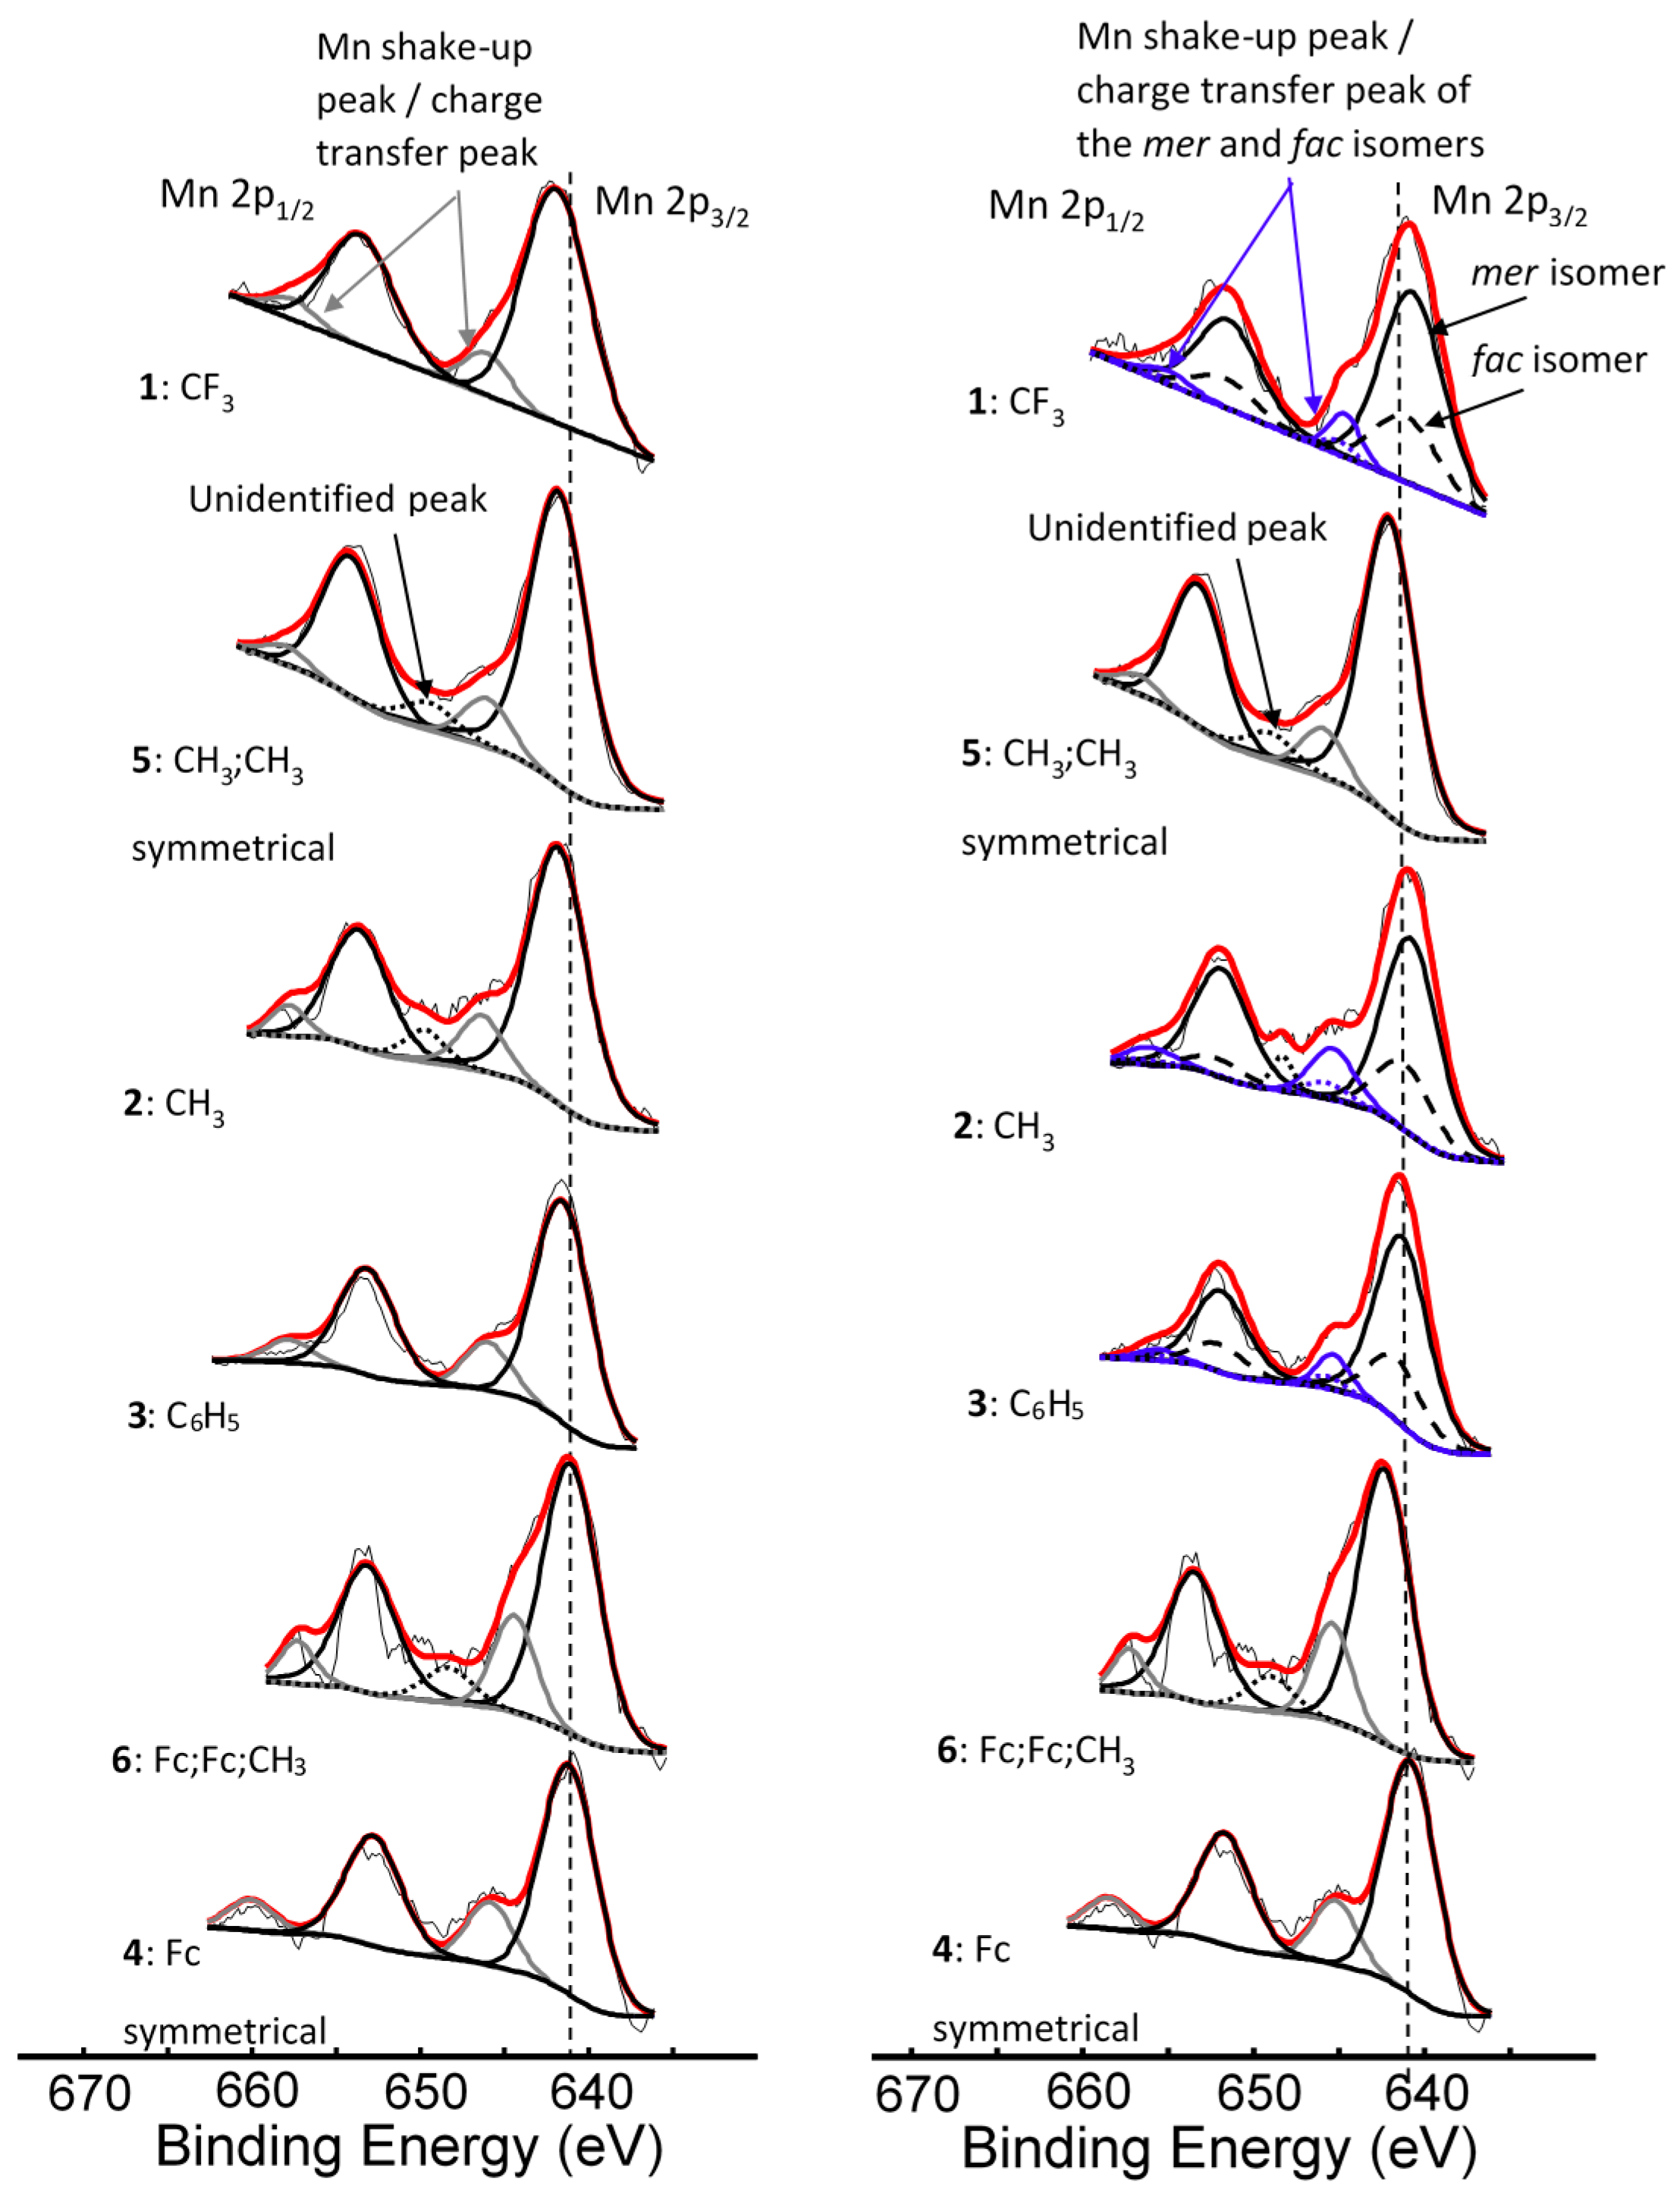
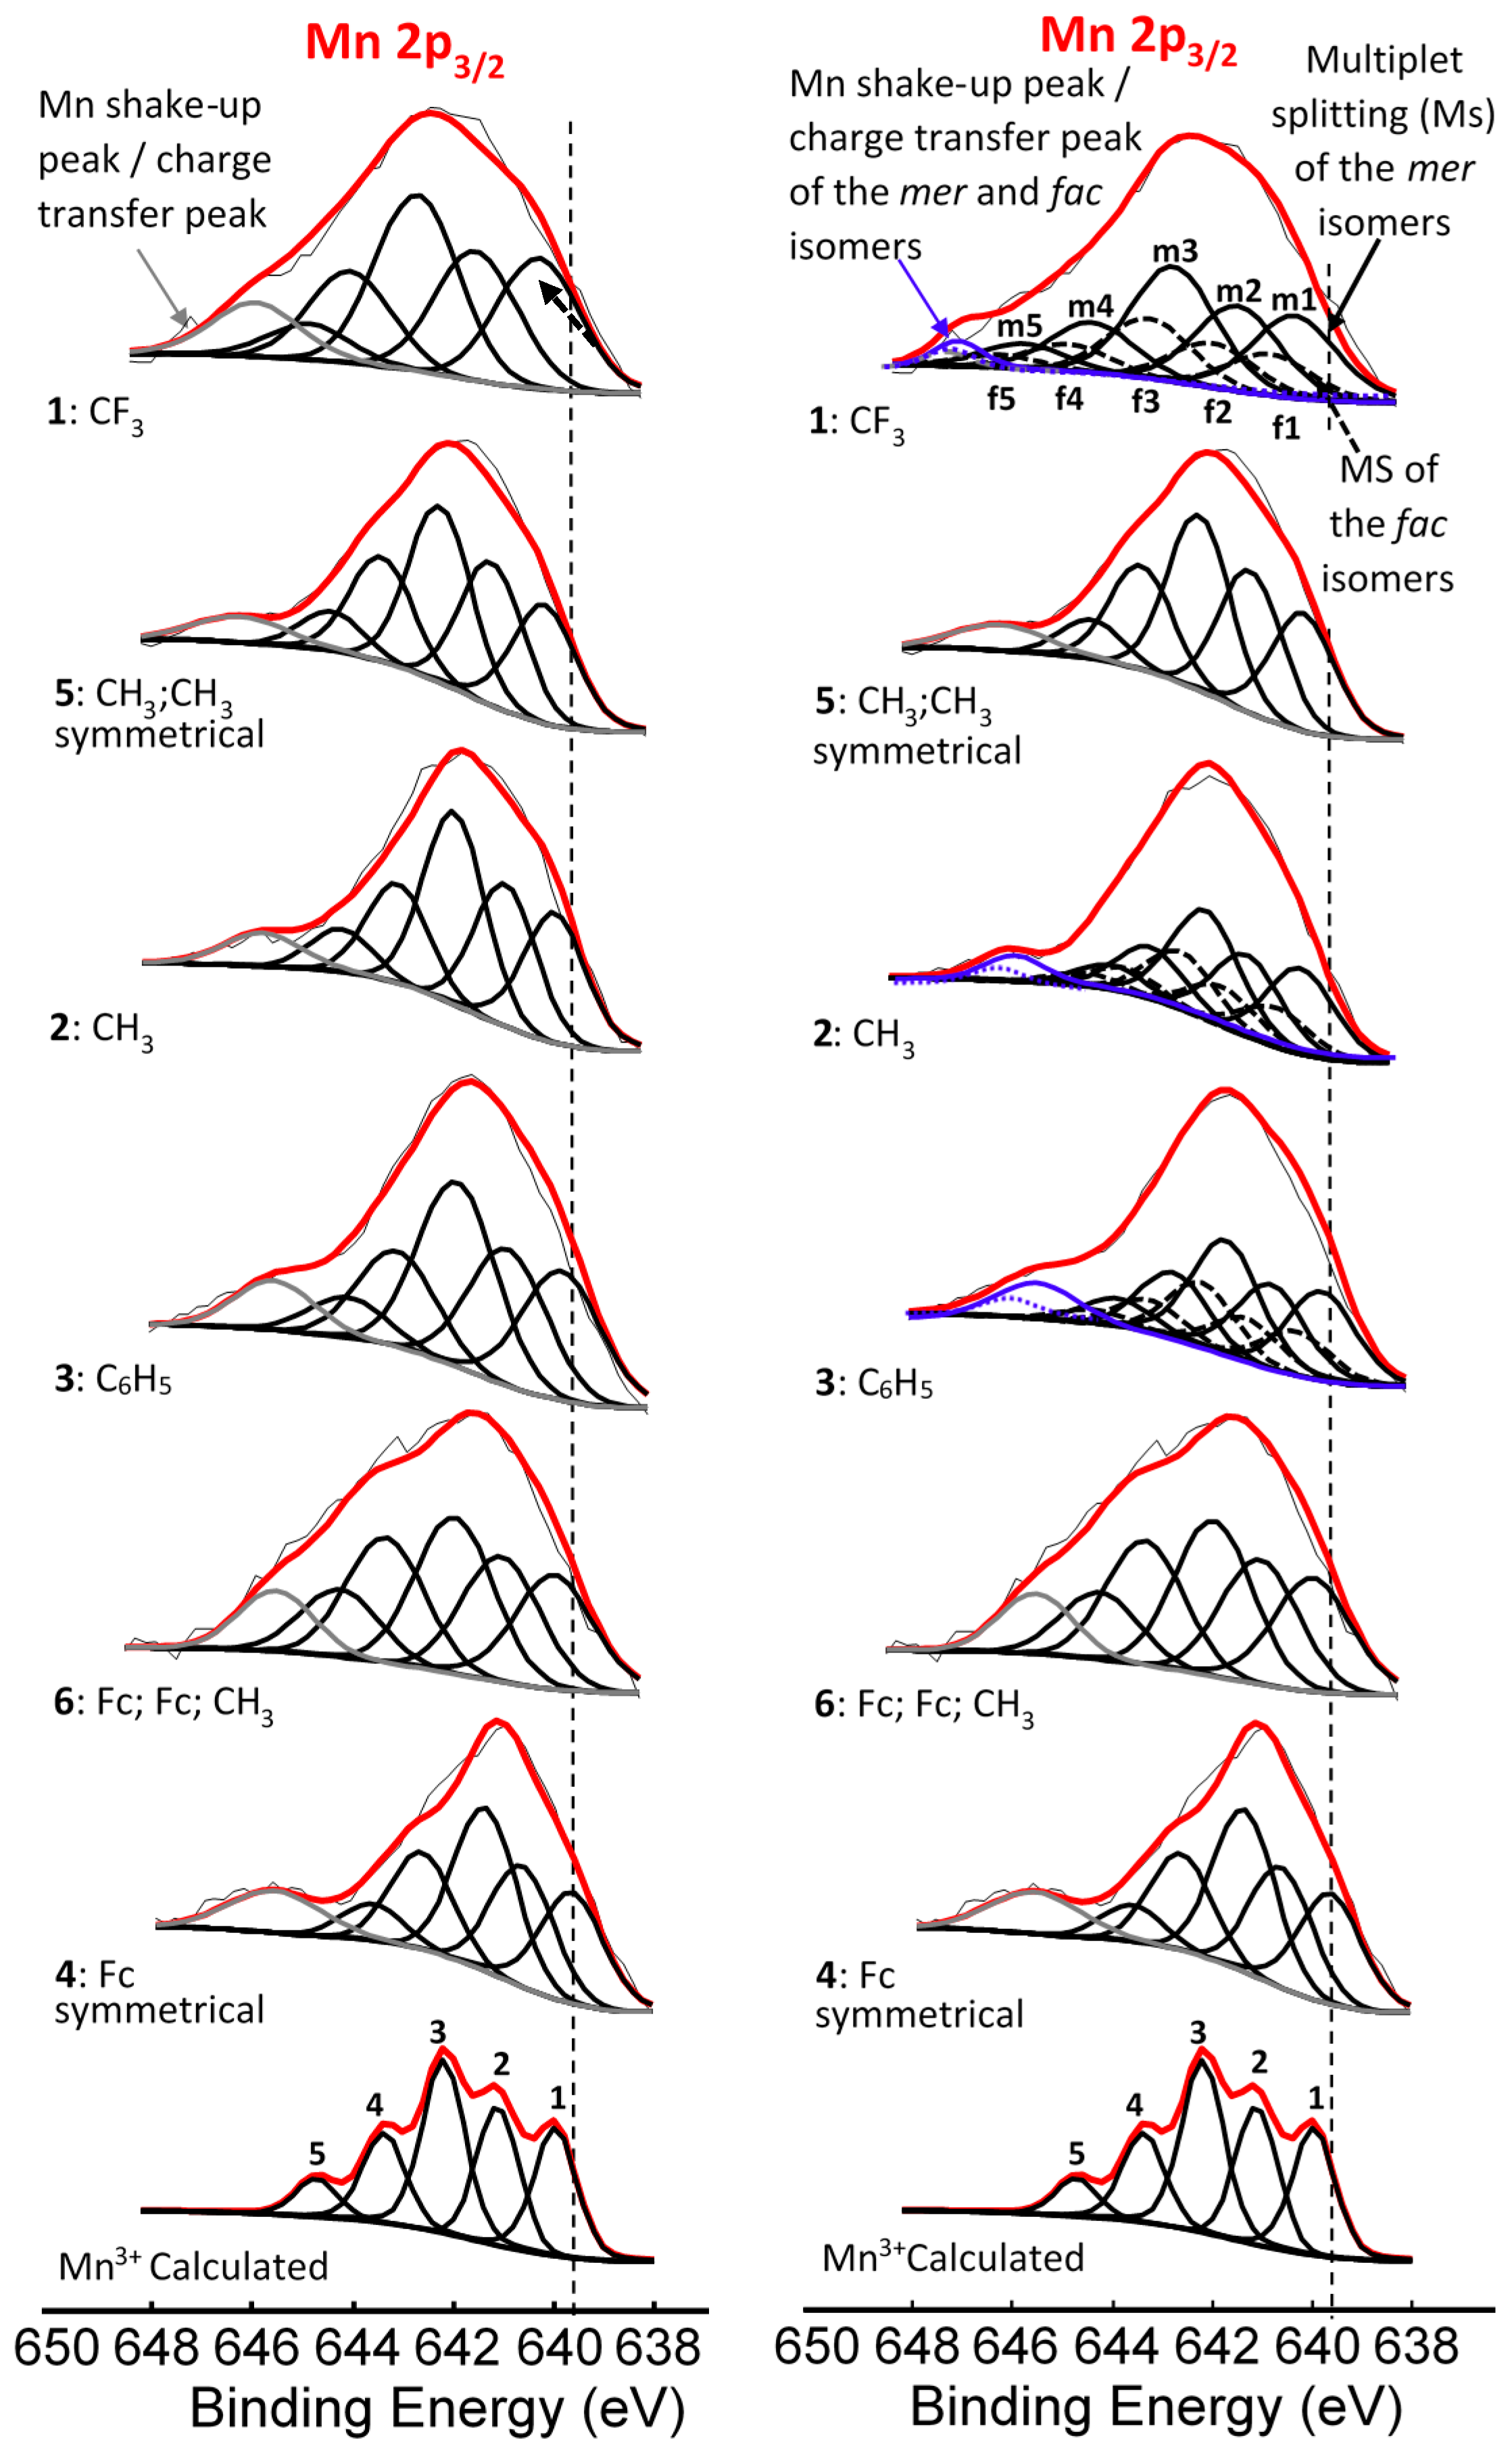
| Comp. No.; R-Groups | Max BE (eV) | Isomer | Peak 1 (eV) | Iratio % 7 | Peak 2 (eV) | Iratio % 7 | Peak 3 (eV) | Iratio % 7 | Peak 4 (eV) | Iratio % 7 | Peak 5 (eV) | Iratio % 7 | Shake-up (eV) | Iratio % 7 |
|---|---|---|---|---|---|---|---|---|---|---|---|---|---|---|
| 1; CF3 1 | 641.86 | mer | 640.10 | 23.4 | 641.22 | 23.4 | 642.52 | 31.2 | 644.17 | 15.0 | 645.56 | 7.0 | 646.90 | 2.46 |
| fac | 640.70 | 23.4 | 641.82 | 23.4 | 643.12 | 31.2 | 644.77 | 15.0 | 646.16 | 7.0 | ||||
| 2; CH3 1 | 641.53 | mer | 639.93 | 23.1 | 640.99 | 23.1 | 641.83 | 31.4 | 642.93 | 15.3 | 643.71 | 7.1 | 645.77 | 4.56 |
| fac | 640.33 | 23.1 | 641.39 | 23.1 | 642.23 | 31.4 | 643.33 | 15.3 | 644.11 | 7.1 | ||||
| 3; C6H5 1 | 641.50 | mer | 639.86 | 23.0 | 640.90 | 23.0 | 641.82 | 31.0 | 642.90 | 16.0 | 644.03 | 7.0 | 645.71 | 9.28 |
| fac | 640.16 | 23.0 | 641.20 | 23.0 | 642.12 | 31.0 | 643.20 | 16.0 | 644.33 | 7.0 | ||||
| 4; Fc 1 | 641.31 | - 5 | 639.78 | 22.5 | 640.80 | 22.5 | 641.56 | 30.3 | 642.86 | 18.0 | 643.87 | 6.7 | 645.89 | 10.25 |
| 5; CH3,CH3 2 | 641.73 | - 5 | 640.00 | 22.9 | 641.14 | 22.9 | 642.20 | 31.0 | 643.36 | 16.1 | 644.36 | 7.1 | 646.24 | 3.98 |
| 6; Fc,Fc,CH3 3 | 641.41 | - 6 | 639.84 | 21.5 | 640.89 | 21.5 | 641.82 | 26 | 643.19 | 21.5 | 644.10 | 11.2 | 645.35 | 8.69 |
| Mn3+ 4 | - | 640.1 | 23 | 641.4 | 23 | 642.3 | 31 | 643.1 | 16 | 644.9 | 7 |
| Comp. Num.; R-Groups | ΣχR 3 | BEFe2p3/2main (eV) | FWHM (eV) | BEFe2p3/2satel (eV) | FWHM (eV) | ΔBE 5 (eV) | Iratio f |
|---|---|---|---|---|---|---|---|
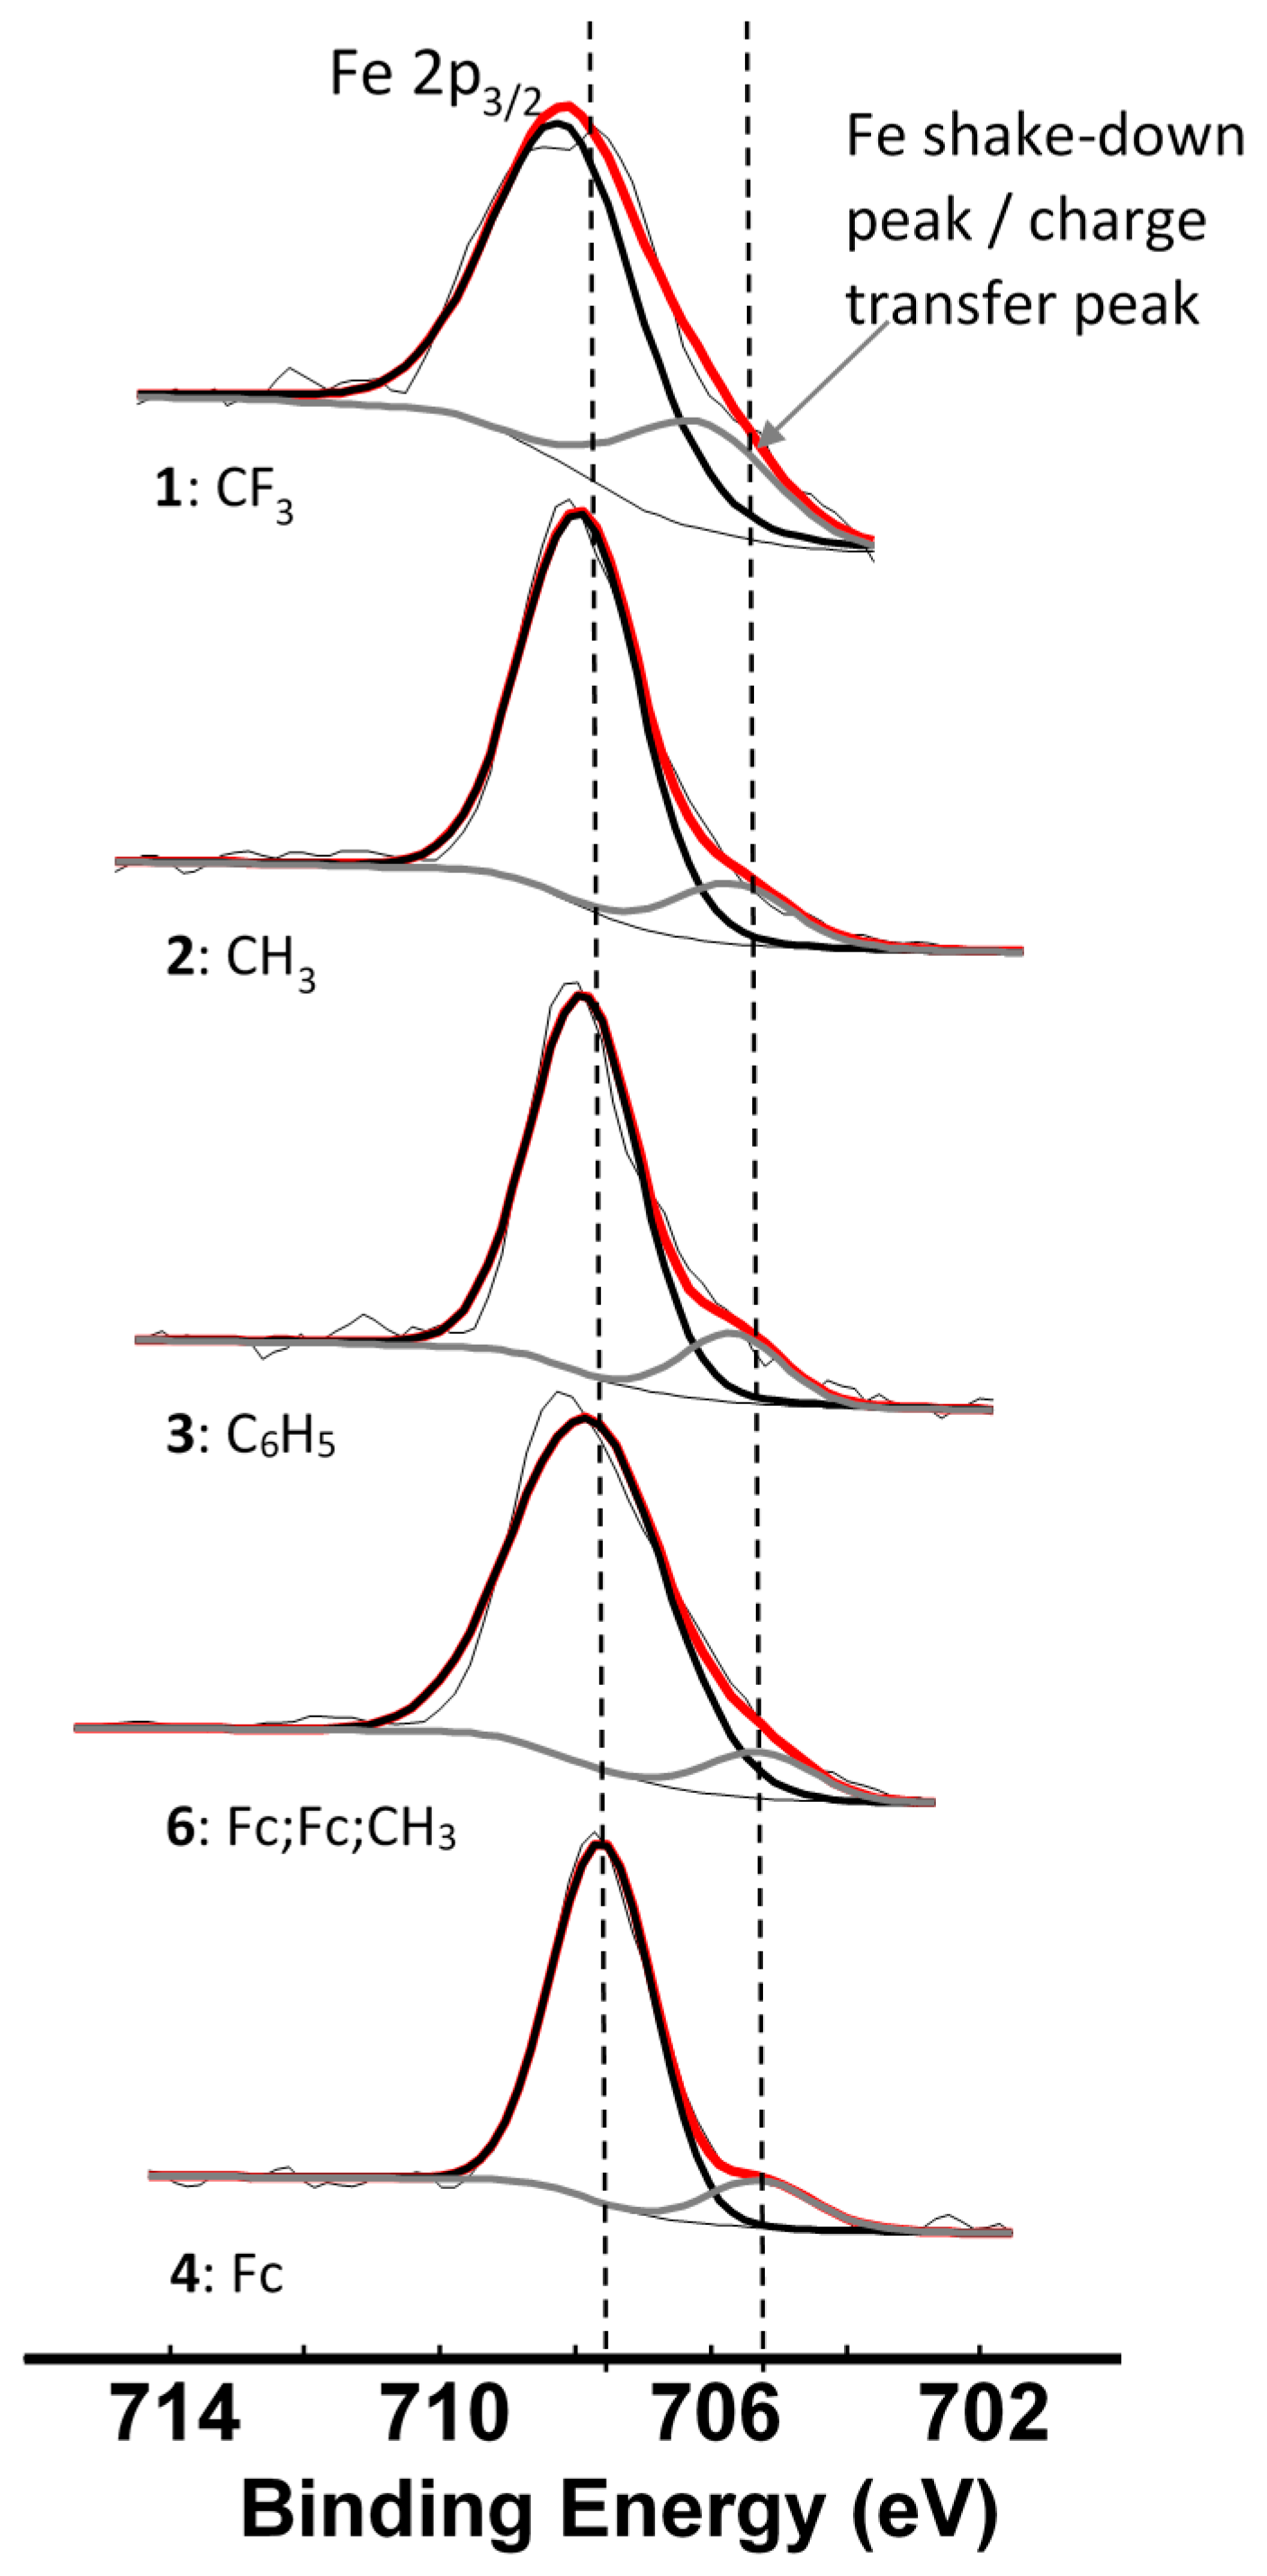
| 1; R = CF3 1 | 14.64 | 708.03 | 2.67 | 705.91 | - 4 | 2.12 | 0.28 |
| 2; R = CH3 1 | 12.63 | 707.87 | 2.22 | 705.61 | 2.37 | 2.26 | 0.16 |
| 3; R = C6H5 1 | 12.24 | 707.84 | 1.93 | 705.48 | 2.07 | 2.36 | 0.16 |
| 4; R = Fc 1 | 11.22 | 707.77 | 2.81 | 705.28 | 2.40 | 2.34 | 0.09 |
| 6; Fc,Fc,CH3 2 | 11.69 | 707.79 | 1.95 | 705.45 | 1.95 | 2.49 | 0.11 |
© 2016 by the authors. Licensee MDPI, Basel, Switzerland. This article is an open access article distributed under the terms and conditions of the Creative Commons Attribution (CC-BY) license ( http://creativecommons.org/licenses/by/4.0/).
Share and Cite
Buitendach, B.E.; Erasmus, E.; Niemantsverdriet, J.W.; Swarts, J.C. Properties of Manganese(III) Ferrocenyl-β-Diketonato Complexes Revealed by Charge Transfer and Multiplet Splitting in the Mn 2p and Fe 2p X-Ray Photoelectron Envelopes. Molecules 2016, 21, 1427. https://doi.org/10.3390/molecules21111427
Buitendach BE, Erasmus E, Niemantsverdriet JW, Swarts JC. Properties of Manganese(III) Ferrocenyl-β-Diketonato Complexes Revealed by Charge Transfer and Multiplet Splitting in the Mn 2p and Fe 2p X-Ray Photoelectron Envelopes. Molecules. 2016; 21(11):1427. https://doi.org/10.3390/molecules21111427
Chicago/Turabian StyleBuitendach, Blenerhassitt E., Elizabeth Erasmus, J. W. (Hans) Niemantsverdriet, and Jannie C. Swarts. 2016. "Properties of Manganese(III) Ferrocenyl-β-Diketonato Complexes Revealed by Charge Transfer and Multiplet Splitting in the Mn 2p and Fe 2p X-Ray Photoelectron Envelopes" Molecules 21, no. 11: 1427. https://doi.org/10.3390/molecules21111427
APA StyleBuitendach, B. E., Erasmus, E., Niemantsverdriet, J. W., & Swarts, J. C. (2016). Properties of Manganese(III) Ferrocenyl-β-Diketonato Complexes Revealed by Charge Transfer and Multiplet Splitting in the Mn 2p and Fe 2p X-Ray Photoelectron Envelopes. Molecules, 21(11), 1427. https://doi.org/10.3390/molecules21111427